 Muhammad Yousaf Raza
 Boqiang Lin2*
- 1School of Economics, Shandong Technology and Business University, Yantai, Shandong, China
- 2School of Management, China Institute for Studies in Energy Policy, Xiamen University, Fujian, China
- 3College of Earth and Environmental Sciences, University of the Punjab, Lahore, Pakistan
India is often referred to as the next development superpower, and generally, becoming a large-scale industrialization center is seen as an achievable goal for the country. This article investigates the output elasticity, substitution elasticity, and technological advancement between the various factors (i.e., labor, capital, and energy use) in the industrial sector of India. To investigate the factor's productivity, a trans-log production function was applied; however, ridge regression was used to analyze the various parameters to check the multicollinearity issue. The results show that (1) the analyzed inputs are optimistic and return-to-scale averages of 1.18, 1.41, and 1.24 between labor, capital, and energy, respectively, are increasing; (2) the pairs substitution between labor–industrial energy utilization and capital–industrial energy consumption is found to be 0.96 and 0.98, respectively, on average, indicating that capital, labor, and energy are good substitutes that need more attention in the production process; and (3) the technological progress between factors ranges from −0.4 to 0.02, in which labor–energy and capital–energy utilizations provide quicker outcomes than a capital–labor utilization. Finally, the industrial sector can attain maximum productivity if capital and skilled labor are improved under the sustainable development goals, as energy and capital are optimized for maximum efficiency. Finally, energy substitution and low-carbon technological efforts can be better suited for attaining dual-carbon goals in the industrial sector.
1 Introduction
India's role in the world's climate change is becoming imperative due to the economy, industrialization, and energy consumption. However, per capita energy use is less than in the developed world, but it is expected to rise to a significant level, causing climate change. According to the Ministry of Environment, Forest, and Climate Change (MoEFCC, 2015), India has associated the mitigation potential targets with diminishing the discharge intensity from its economic growth by 33%−35% by 2030 relative to the 2005 level. This will occur due to technological progress and access to low-cost international financing.
As India's economy and industrial base add to bystander growth, the demand for industrial products is rising. For this, Indian policymakers have concentrated on a normal yearly growth share of 7.75% for the economy from 1990 to 2020 (India Economic Survey, 2021). The industrial division is certainly a major contributor to India's impressive progress record, which is the second-largest sector after the services sector and added 25.02% of the country's economy in 2020. According to Asia's Industrial Transformation, India contributed 25% to the economy and created 100 million jobs (Felipe, 2018). Moreover, it was noted that employment in the industrial sector grew in the four Association of Southeast Asian Nations (ASEAN) countries, of which China and India are dominant.
The industrial added value from 1990 to 2020 increased from US$88,120.6 million to US$66,8439.9 million, with an average growth of 6.58%, as shown in Figure 1. Regarding this growth, the industrial sector is energy-intensive and fossil fuel–dependent (i.e., oil, coal, and gas), in particular. It is obvious that coal consumption is the only fuel with a higher energy intensity, increasing from 1,104,560 to 3,477,651 terajoules (TJ) during the studied period; however, gas and oil are consistently growing. All the energy-related fuels show significant growth, with an industrial added value, until 2004; however, coal consumption increased dramatically after 2005 due to the variation in global coal consumption (Wang and Song, 2021). This has created severe ecological issues, and the industrial sector is a key contributor to carbon emissions and relevant contaminants in India. Thus, controlling carbon emissions from this sector is of the highest urgency. India, being the third-largest carbon-emitting country, whose industrial carbon dioxide (CO2) emissions reached at 501 metric tons during 2020, as shown in Figure 2. Moreover, the CO2 emission reduction trend declined by 0.97% and 0.91% during 2019 and 2020, respectively, due to the COVID-19 epidemic (Davis et al., 2022). As presented in Figure 1, the industrial added value and industrial energy consumption (i.e., oil, coal, and gas) show a direct co-movement, increasing the association to comparable facts during the considered period.
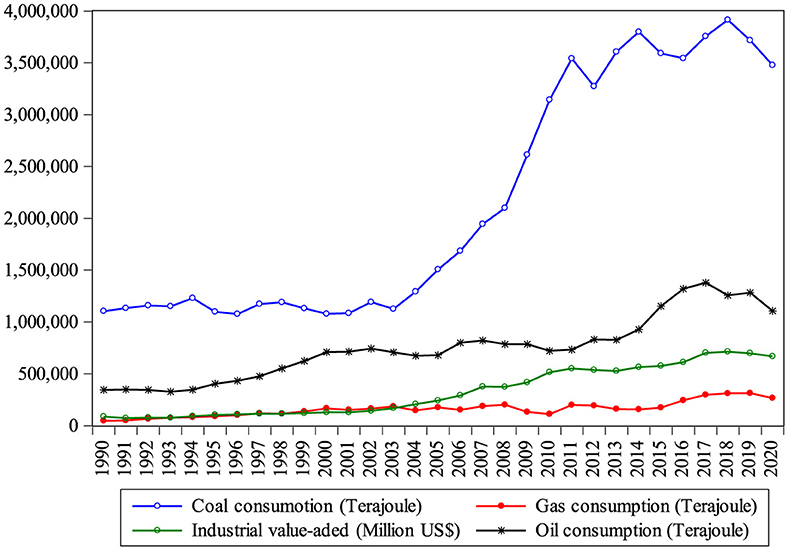
Figure 1. India's industrial added value and energy consumption, 1990–2020. Source: IEA (2021) and WDI (2021).
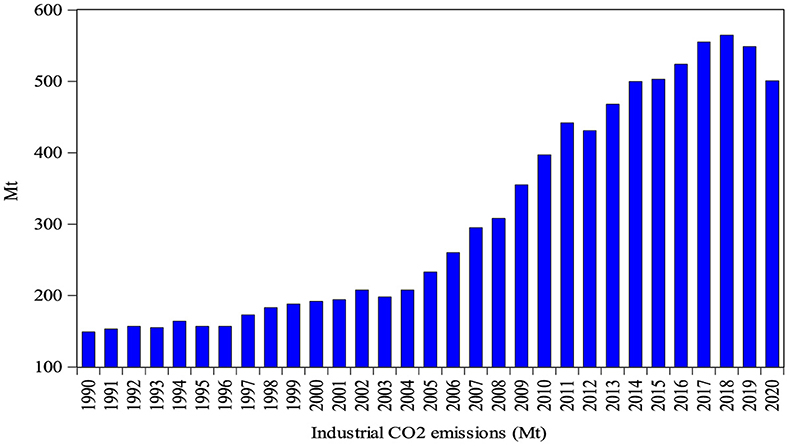
Figure 2. Carbon dioxide emissions from the industrial sector of India. Source: IEA (2021).
Economic growth and fuel consumption have doubled since 2000, with 80% of demand being satisfied by oil, coal, and gas (IEA, 2021). Thus, India is an appropriate case for inspecting the inter-factor and inter-fuel substitution between energy and non-energy influences, industrial output, and technical progress among the various factors.
For India, a few studies on India's inter-factor and inter-fuel substitution have garnered attention. For example, we found a few studies on India with different objectives; for example, Wolde-Rufael (2010), Alam et al. (2011), Ghosh and Kanjilal (2014), Deka et al. (2023), and Raza and Dongsheng (2023) examined the causality measures between energy, economy, and environmental issues in India using the autoregressive distributive lag (ARDL) model, NARDL, decomposition, and ordinary least squares (OLS), among others. Moreover, they estimated that there is a two-way association between energy and the economy; however, population and energy utilization have a direct association. Moreover, Wang and Li (2016) investigated a comparative study between China and India to measure the energy-related factors from 1970 to 2012. They found that technical growth and population are the major aspects in monitoring CO2 emissions in China; however, India still has a durable deterioration in energy intensity because of the population and fossil fuel energy consumption. Similarly, Alam et al. (2016) investigated a matching relationship between China, India, Brazil, and Indonesia using the ARDL method and estimated that CO2 emissions have increased due to energy and revenue in all nations; however, the populace outcome was significantly observed only in Brazil and India.
Moreover, few studies on the factor substitution in different countries have also been observed; for example, Raza (2023) used the production method to investigate Bangladesh's transport sector's energy, labor, and capital from 1990 to 2019 and found that labor productivity, shadowed by capital, was at its maximum; however, other substitution factors (i.e., capital–labor, labor–energy, and capital–energy) are rising in a return to scale. Lin and Raza (2021) estimated the labor, capital, and energy substitution possibilities in the agriculture sector of Pakistan. They found that substitution between labor–cleaner energy will eradicate funding for assisting capital and labor; however, capital–labor and labor–energy are technically substitutes. In addition, we found only one study by Lin et al. (2022) in India with limited objectives using the trans-log production method from 1990 to 2019. They employed labor, capital, oil, coal, gas, and electricity factors as a whole and found that all the energy factor inputs are substituted, with a determined substitution between coal–gas and coal–electricity observed. Also, the substantial role of coal in India may fulfil energy needs in the future; however, the technological growth between factors is attractive, which can enhance energy and substitute it at any time. Thus, based on the current knowledge, the country-specific research for the industrial sector has not been analyzed to investigate inter-factor substitution.
The major motivation and contribution of the study are, first, we found few studies on India that applied traditional regression analysis, for example, Vijayalakshmi and Raj (2020), Ozgur et al. (2022), and Das et al. (2023), who examined the energy, economy, and environmental issues in India using traditional regression models to check causality relationships. We investigated that their time and evaluation periods were shorter due to different factors (i.e., energy, CO2 emissions, population, gross domestic product, and foreign direct investment). However, the present research uses the latest available data from more than three decades, from 1990 to 2020, including energy and non-energy factors, that is, oil, coal, gas, labor, capital, and industrial added value, which is imperative. Second, based on these factors, this study analyzes the output and efficiency of the industrial sector by substituting the pair of factors by adopting a trans-log production model. These factors, including capital–labor, capital–industrial energy, and labor–industrial energy use, are significant for India's policies, economy, energy security, and climate change. Third, the employed method is imperative for factor output, factor substitution, and technological progress (Christensen et al., 1973). As the demand for energy consumption and economic growth continues, checking a factor's substitution is necessary. Fourth, regarding the method used, this study employs the technological progress between energy and non-energy factors, which will increase the motivation to obtain future research in this field. This will show a vast gap in the current research. This method is advantageous because it is a quadratic reaction surface method, provides perfect substitution between factors, evades the imposition of the perfect substitution assumption, and permits an association between factor inputs. This will also provide policy suggestions and real structure for the present and the future to resolve these problems. Based on these circumstances, this study adds to the literature, especially in the context of India's industrial sector. Finally, the necessity of managing energy substitutability in the industrial sector and then suggest policymakers to identify which energy source is more suited. On this basis, this study attempts the following measures and seeks to answer the following questions: What are the major relationships between energy and non-energy factors contributing to India's energy, technology, and climate change policies? What are the input and output elasticities and substitutability between the employed factors? What is the relative difference between a factor's technological progress during the estimated period? and From an Indian energy policy perspective, what are the policy implications in terms of energy, economy, environment, and technological perspectives?
The study proceeds as follows: Section 2 provides a literature review, and Section 3 presents a description of the data collection. Section 4 presents the methodology and measurement process, while the empirical results are discussed in Section 5. In Section 6, our conclusions and policy recommendations are provided.
2 Literature review
Past studies have estimated much about capital-to-energy-related continuity. For example, a study by Pindyck (1977) analyzed the energy and capital hypothesis for 10 countries and found that both factors are substitutes. These violations of various results have been determined to balance out. Moreover, the industrial sector is an important sector of a country's economy, energy, and economy. Since the Industrial Revolution, coal, oil, gas, and renewables have been utilized as fundamental energy sources. Thus, India is committed to using renewable energy and environmentally friendly resources. Most studies have employed a trans-log cost method; for instance, Bölük and Koç (2010) adopted this model to estimate capital, labor, and electricity energy for Turkey's manufacturing sector from 1980 to 2001 and found that there is cost substitutability; Lin and Tian (2016) analyzed the energy rebound effect in China's light industry and found that energy conservation is a major tool for China's sustainable growth and energy security. Also, capital flow plays an imperative role locally and worldwide (Ma, 2023). However, several scholars have employed a trans-log production model because the costs for variables were not available; for example, Lin and Xie (2014) analyzed the inter-factor and inter-fuel substitution of the transport sector of China and found that capital, labor, and energy are substitutes; Lin and Raza (2020, 2021) and Raza et al. (2021a) for Pakistan's transport, agriculture, and chemical industries and found that energy is the major substitute over the period. However, few studies estimated energy, labor, and capital as a whole; for instance, Prywes (1986) estimated for U.S. industries, Wang et al. (2018) estimated for China's steel industry and found the progressive enhancement in the technological progress, and Lin et al. (2022) analyzed for India's energy, capital, labor substitution, and technological progress from 1990 to 2019.
Previous studies on the Indian industrial sector in this field have not concentrated on the trends in historical energy use, energy substitution, non-energy factor output, and technological progress over the most recent period. In one study, for instance, Dhingra et al. (2023) created a framework to analyze the barriers in the Indian industrial and commercial rooftop solar sectors and found that most of the barriers in the industrial sector in India are market-, financial-, regulatory-, technical-, and location-based. Few researchers have associated the quick rise in the demand for electricity in India with the growing ownership of electric appliances (Chaturvedi et al., 2014; Poblete-Cazenave and Pachauri, 2021).
As discussed earlier, the study gap shows that most energy economics methods employed the trans-log cost method that needs statistics on input costs; however, few studies employed trans-log production function in different sectors, excluding India. Because the data relating to cost are unavailable to the authors for the industrial sector, the present study uses a log-linear trans-log production method to investigate the degree of inter-factor and inter-fuel substitution and technological progress between industrial energy, labor, and capital for the 1990–2020 period, which has not been estimated before.
3 Data collection and its description
On the availability of annual observation, we collected information on industrial output, labor, and fossil fuel consumption (i.e., oil, coal, and gas)1 over the 1990–2020 period. Regarding the model used, we employed three main variables, for instance, output variable (Y) and inputs (i.e., labor, capital, and energy) in the Indian industrial sector. We investigated all these variables by applying the aggregate production model output with inputs that impacted the production process during the studied period. We used the 1990–2020 period because of the availability of current data and variable situations. As the industrial sector of India consumes a lot of fossil fuel energy, with little renewable energy for the production process, which can be a significant limitation. Thus, we analyzed three major factors, including physical capital, labor, and energy. For this, we used standard growth method and supposed that these factors optimally affect economic growth. For example, Solow (1956) found in the neoclassical growth theory that capital and labor inputs are imperative in economic activities. Also, energy is another factor that is useful in the production process that benefits economic development (Alam et al., 2013). Thus, this study investigates the energy and non-energy factors to calculate the influence of the industrial sector. The theoretical analysis of this study is provided in the form of a framework and is divided into four parts, as shown in Figure 3. These parts present the sectorial information, factors contribution, methods, and implications.

Figure 3. Systematic flow chart of the study.
Thus, to avoid the ambiguous consequences of additional factors in the inter-fuel substitution analysis, a few alterations were made to the statistics. To eliminate the impact of inflation, we assessed output and capital stock at constant prices (US$). Following Lin et al. (2022), we converted all set variables into their natural logarithmic form because this process is one of the Box–Cox alterations, which may steady variances and thus enhance the arithmetical data properties. This process is imperative for parametric tests. The data relating to output, gross capital formation, and labor were collected from the World Development Indicators (WDI, 2021) in millions, while data related to energy were collected from the International Energy Agency (IEA, 2021) in TJ. Because the Indian Economic Survey and the Bureau of Statistics do not provide statistics on capital sticks, this variable was valued at constant prices using the perpetual inventory method as follows in Equation (1):
where Kt is the current capital stock, Kt−1 is the capital stock of the preceding year, δt is the capital depreciation rate, and It is the current capital investment. Following Smyth et al. (2012), Raza et al. (2021a), and Lin et al. (2022), we accept that, yearly, the δt of the Indian industrial sector is 5%.2 In the present research, we compute the base year capital stock (K0), investment (I0), growth (g), and depreciation (δ) as follows in Equation (2):
where g is the growth rate of capital spending and I0 shows the capital expenditure in the base year 1990.
4 Methodology and measurement process
The employed model is the trans-log production function, which is the second-order Taylor series estimate, presenting the association between input and output services from various inputs. These can be stated by using the general practical method, as in Equation (3):
where Y, describe the output. β0 and βij, describes the state of technical knowledge at constant and inputs i and j. Xit, and Xjt denotes the inputs between i and j at time t, respectively. The primary assumption used in this model for the Indian industrial sector is that there is a double-differentiable cumulative trans-log production model involving output to labor, capital, and industrial energy consumption inputs. The application of this method allows one to avoid the imposition of a hypothesis, including perfect competition or perfect substitution of various inputs (Pavelescu, 2011). The existence of quadratic terms also permits non-linear associations among the inputs and outputs. Hence, this will make this function useful for researchers due to its elasticity compared to other practical procedures. Thus, based on energy and non-energy inputs, the trans-log production model for the Indian industrial division can be quantified as in Equation (4).
Thus, this is used in estimating aggregative impact, interface, and estimating the technological progress (τ) of input impacts in the production process. To estimate the τ between various inputs, we employed the leaning variable, such as T = Tt − T0, to see the independent τ of the production system of the industrial sector. However, Tt and T0 are the current (2020) and base year (1990). Kt, and IECt are the capital, labor, and industrial energy consumption in time t, respectively. The output elasticities of considered factors were estimated by differentiating Equation (4).
Using the output of each factor in Equations (5–7), the relative differences in τ can then be employed to check the industrial situation of India, which is consistent with the research of Lin and Fei (2015) and Lin and Raza (2021), who analyzed the energy and economic substitution for China's and Pakistan's agriculture sectors, respectively. Thus, the technological progress can be estimated as in Equation (8) by applying a similar method.
To check, the output elasticates are probable to change across the data since these are functions of energy use. Substitution elasticity can be defined as the transformation in the relative share of an input factor value, which is formed by relative variations in the marginal rate of a technical substitution. The method states the level of the degree of factor substitution. Following the studies of Lin and Wesseh (2013) and Lin et al. (2022), the pairs of factor substitutions can thus be estimated using Equation (9).
The assumption is that the products in the industrial sector are useful agents. These characteristics in the measuring process are the substitution value lies between [0 to +∞] in which 0 means two factors cannot substitute each other; however, +∞ indicates that those two factors can be a substitute for each other. On this basis, the factor substitution, for example, capital for labor or capital for industrial energy, and the presenting variables under the marginal productivity can be measured by rewriting Equations (9), (10) can found as:
Using Equation (9), the pair of substituting factors and elasticities between i and jcontributors can be estimated in Equations (11–13). However, the details of all the substitutions can be seen in studies by Smyth et al. (2012), Lin et al. (2022), and Raza et al. (2021a,b).
Using Equation (11), all the contributing variable substitution between capital–labor (K-L), capital-industrial energy consumption (K-IEC), and labor–industrial energy consumption (L-IEC) can be further explained in Equations (12–14).
Finally, to check the relative difference in technological progress () by using Equation (4), the changing factor inputs i and jcan be valued using Equation (15).
The assumptions of estimating τ are (1) if τij > 0, the τ of i is faster thanj; (2) if τij < 0, the τ of jis quicker than i; and (3) if τij = 0, the τ of i andjare changing with equal speed.
4.1 Estimation strategy
Seeing the trends of different energy infrastructures and due to the interaction and squared terms of the input factors in Equation (4), the prospect occurs for the model to be influenced by a serious multicollinearity issue (high correlation between two or more than two variables in OLS). In this way, the coefficient estimates may vary in response to a few distinctions in the data. For instance, in the ninputs, different parameters should be calculated to n(n + 3)/2if the individual predictor has a trans-log element in the function. In reality, several parameters go off with several inputs involved in the function driving the overparameterization; for example, Smyth et al. (2012) suggested this method when using labor, capital, and factor substitution; however, energy inputs were not estimated. On this basis, a similar method is used in the current study, with more parameters for the latest data, particularly for the industrial sector, which has not been estimated before. As shown in the ridge plot in Figure 4, the maximum elements for labor, capital, and energy show higher substitutions and attain stability at every changing value of the ridge parameter. This suggests a weak prognostic power of the influences; thus, omitting the function to avoid overparameterization seems sensible. To reduce the multicollinearity problem in the model, ridge regression is the best technique to check, which was suggested by Hoerl and Kennard (1970). It is advantageous to reduce the multicollinearity problem in the statistics by incorporating a little value to the diagonal of the number, which is in the correlation pattern. Thus, the ridge evaluator can be determined by estimating. Kis the ridge parameter and its value lies from 0 to 1, which is ≥ 0. If the values are optimistic and lower, it means that the issue is developing and the variances are reduced. Iis the identity matrix. Because few scholars have employed this method, significant standards are not seen in the literature, for instance, Smyth et al. (2012), Lin and Raza (2020), and Raza et al. (2021b). During the ridge trace plot between 0 to 1 for the coefficient dimension, a significant estimate of is selected at an appropriate point.

Figure 4. Ridge trace plot. L, labor; K, capital; IEC, industrial energy consumption; AEC.
5 Empirical results and discussion
5.1 Factor description and ridge trace
Using the data from 31 years, we observed little change between the variables in a similar pattern. To cover the path of empirical findings, Pearson's correlation coefficient was adopted for individual variables in the model. All the coefficients lie in the variables given between +1 to −1. For this, we checked for a multicollinearity issue between them. As described in Table 1, we estimated that there is significant multicollinearity between the variables. This estimation has been covered by several scholars (i.e., Ahlgren et al., 2004; Lin et al., 2022). Moreover, the variance inflation factor (VIF) is >10, which also proposes instability in the model. This is because all the variables are highly correlated, which confirms that OLS is not fit to estimate the purposeful criterion. For this purpose, to reduce the multicollinearity problem, we used a ridge regression, which is an effective method for checking this issue, in preference to the OLS method (Hoerl and Kennard, 1970; Lin et al., 2022). Researchers have employed this technique to address this issue; thus, we evaluated related outcomes to data from our variables using the Eviews and Stata software.

Table 1. Variable description and correlation.
For the accurate ridge regression, the K-values between 0 to 1 are presented in Figure 4. From the overall threshold of ridge trace, we selected 0.65 as a K-value for the coefficients' stability. Furthermore, theβ values of each coefficient, such as ln L, ln K, ln IEC, ln K.ln L, ln K.ln IEC, ln L.ln IEC, ln L.ln L, ln K.ln K, and ln IEC.ln IEC are stable and vary with the ridge parameter values. Thus, as shown in Figure 4, the K-value becomes steady after 0.65, which is consistent. It is also obvious that the VIF value of the ridge parameter is maintained by VIF due to collinearity in the range of parameters. the rule of thumb, the lower VIF satisfies the regression analysis with significant outcomes (Raza et al., 2021b). Thus, the existing results are consistent with the previous studies in which VIF values are lower.
5.2 Ridge regression and stability analysis
As ridge regression is the best way to adjust the OLS to a significant level. As shown in Table 2, the coefficient of determination (R-squared) of the function is 0.992, the standard error (SE) of each factor is lower than 5%, and the VIF is lower than 10. This shows that the model is stable and can be considered significant. The F-statistic of the method is 290.650 and significant at 0.000, while the total ridge regression SE is very small (~1%), which shows that all the coefficients are optimally significant and found in the range of 0–1. This presents that all the factors are consistent with the economic theory.

Table 2. Results based on ridge regression using ridge parameter.
Moreover, based on the K-parameter, the current study employs 0.65 as the value of K (see Figure 4) because it is almost at the rate that the coefficients seem to have steady. The ridge regression results are based on each factor's coefficients; SE, p-values, and VIF values are presented in Table 2, which explains that the results of ridge regression in this model have positive signs and that more than 90% of the parameters are statistically substantial. Thus, the ridge parameter value is also maintained by VIF due to collinearity and falls in the proper range. These consequences are also reliable with the study of Lin et al. (2022), who analyzed the overall energy and non-energy factors for India. Thus, based on the traditional statistical point of view, nothing seems to be improper with the analysis of the model. Moreover, the major parameters have a positive sign, and all the parameters are statistically significant, which is consistent with the studies of Lin and Wesseh (2013) and Raza (2023).
5.3 Output elasticity and factor substitution
The output elasticity for each input (i.e., φL, φK, and φIEC) was calculated in Table 3 using Equations (5–7). All the outcomes were computed using the parameters in Table 2. That optimistic elasticities have been attained for labor, capital, and industrial energy consumption can be seen, which is a sign of the rising trend of using all factor contributors throughout the duration as the output of the industrial sector rises. The output elasticity of capital is the largest in the industrial sector, followed by energy and labor, which is consistent with Lin et al. (2022). It can also be noted that the average change in the output elasticity of labor, capital, and energy was 1.18, 1.40, and 1.24, respectively, from 1990 to 2020; however, the movement estimations are a little slow. This presents that the effect of increasing return to scale is in line with the industrial sector of India because higher inputs cause higher productivity (Raza and Tang, 2022). Each year, industrial energy is the factor that grew the second most, showing a jumping trend during the interval; however, capital is the factor with a positive impact with consistent results, which is the significant increase in the scale of the economies. Furthermore, the elasticities of all the factors are >1, which means that energy and capital increase by 1% and the income of the industrial division grows at the maximum level. In addition, the production model indicates a rising return to scale for labor and capital, which will increase the output of each factor, especially the employment growth during the period. For example, a study by Yang (2006) on India's industrial sector adopting to the impacts of policy shows that energy efficiency policies and investment in industrial efficiency are significant issues that can enhance productivity. Thus, we suggest that a productive, skilled and physically healthy, labor is required in Indian's industrial sector to enhance economy and energy conservation.

Table 3. Output elasticity of alternative inputs in the industrial sector.
By using Equations (12–14), the substitution elasticities are estimated. The outcomes are provided in Table 4. We substituted all the considered factors, such as capital–labor (σK−L), capital–industrial energy consumption (σK−IEC), and labor–industrial energy consumption (σL−IEC), which are substitutes for each other. We estimated that all the pairs of factor substitutions have a slowly declining trend from 1990 to 2020. As shown in Table 4, the σK−IEC is maximum; however, the trends of σL−IEC and σK−L are comparatively consistent with σK−IEC. The average substitution between and σL−IEC presents the highest substitution at the 0.982 and 0.962 levels, respectively, but the σK−L substitution seemed at the lowest level of 0.858. That all the factors and their substitutions are close to unity (1) is evident, which means that all the factors have a higher possibility of substitutability in the future, which is consistent with Chaturvedi et al. (2021) and Lin et al. (2022). The σK−L factor substituted from 0.83 to 0.85, which confirms that the industrial sector is still in the stage where the technical methods are relatively backward because of unskilled labor and capital investments. The substitution ability of σK−L is lower than theσL−IEC, which can be more advanced and can easily substitute general labor for skilled labor, which is consistent with Mohapatra (2022). The substitutability of σK−IEC falls from 1.04 to 0.98, which suggests that higher investment in the industrial sector can cover the mitigation of energy use; however, the overall decline in σK−IEC from 1990 to 2020 is due to technical developments, such as labor and capital. Conclusively, both labor and capital obviously save energy, which mitigates CO2 emissions. As given in Table 4, the growth in energy utilization and capital in the industrial sector is significantly useful because both are strongly correlated with economic and technological transformation. In the end, all the pairs of factor substitutions are close to 1, which suggests that the factors have the possibility of moving toward progress.

Table 4. The elasticity of substitution of alternative inputs in the industrial sector.
Moreover, for developed countries, which much of the literature concentrates on, there is a stable energy-use pattern, for example, China, which is still in the industrialization and urbanization stage. Yet, we see high and low energy demands for energy in industrial, provincial, and urban areas (Ma et al., 2009; Jiang and Raza, 2023). In addition, the results propose that raising energy output, labor, and capital can be efficiently obtained in the industrial sector. We analyzed that capital and energy are highly substituted during the estimated period, presenting that there is significant changeability in the future. Also, the rising trend of factor substitution presents a maximum gap for improving the energy supply shortage with a maximum contribution, which is consistent with Dhingra et al. (2023). Finally, a remarkable growth rate is needed in India's industrial sector until ecological safety cannot come at the expense of development.
5.4 Technological progress between inputs
Using Equation (15) and its characteristics, we attempted to get the relative changes in technological progress (τij) between factors. This was objected to making adoption of the aggregate trans-log production function of the Indian industrial sector and constructing the output elasticities and evaluated coefficients from Equation (3).
As shown in Figure 5, the τK−L between capital and labor presents an optimistic variation in technological growth during the period. However, the variation between τK−IEC and τL−IEC shows a negative trend between 0.01 to −0.01, which is growing, with rapid growth after 1992. Overall, the outcomes indicate that the τK−L is quicker than that of energy and capital because India has started many industrial projects in the last decade, for example, the National Industrial Corridor Development Programme. NICDP not only an efficient industrial project but also include development, diversification and technological enterprises. Commonly, study results propose that the τK−IEC is significantly intensive and higher than the τL−IEC, which is consistent with Lin et al. (2022). This is because India has signed various energy-related agreements regarding fuel substitution. However, the industrial sector–related productivity accepts technology in attention to reducing production costs because India has set CO2 emission reduction goals to clean the environment and become more energy-efficient. For example, the Indian government anticipated reducing its reliance on oil due to a US$90 billion investment in renewables to attain the goals of the Paris Agreement (Indian Power Industry Report, 2018). Thus, energy utilization is a main concern, which can create more employment in the industrial sector.

Figure 5. TP between outputs.
6 Conclusion and policy recommendations
6.1 Conclusion
This study tried to investigate the inter-factor and inter-fuel substitution possibilities between labor, capital, and energy in the industrial sector of India from 1990 to 2020 by applying the trans-log production method. The ridge regression technique was applied to the model due to a multicollinearity problem in the statistics. The following are the major findings.
First, the covariance matrix indicates that all the analyzed variables are stationary. The output elasticities of all the factors are positively significant and show a growing trend during the studied period. This indicates that all the factors are contributing to the added value of India's industrial sector. The increasing return in the industrial sector is advantageous because of the overall impacts of factor substitution and technical development in the country. Moreover, capital and industrial energy use are the most productive factors, which indicates that the industrial sector is the only developing factor and the share of technical development is significant.
Second, all the factors show an optimistic substitutability but the only substitutability between capital-industrial energy use and labor-industrial energy use presents a strong positive association between them. This presents that capital and energy use proposes an enhancement in energy, technology, and energy security, which will eliminate energy-related subsidies by encouraging capital and labor in the future. In addition, the labor and capital substitution also shows impressive growth during the period, which indicates that labor and capital with gradually grow with the growth of industrial energy, alternatively reducing pollution. Besides, the research adds that capital and energy are substitutes for skilled labor in the production procedure, which will give direction for the Indian energy structure to substitute fossil energy for renewable energy without risk.
Finally, the technological progress between factors lies between −0.01 and 0.01, which indicates that the technological progress of inputs, including capital–energy, labor–energy, and capital–labor could be useful for Indian economic development. Moreover, technological progress between labor–energy and capital–energy is quicker than capital–labor, which shows that energy and capital investment are speedier than labor and capital. The results are fruitful for the future regarding a significant trend; thus, enhancing the technological growth of a particular input may potentially control pairs of factors.
6.2 Policy recommendations
Furthermore, the study provides a few policy recommendations for the industrial sector based on empirical findings. Due to significant input substitution, technological progress suggests that all inputs are rising. Thus, to ensure stability and strong substitutability, the cost of new machines, materials, and production costs should be provided at market levels. This will not only enhance the economy but also help reduce CO2 emissions from the industrial sector. Government policies regarding energy security and the variables' substitution come with a cost, which carries large expenditures that can be sustained with economic development.
As shown in the results, capital and energy have higher substitutions; thus, a renewable share of energy can be added using the technology, which will create a strong and sustainable contribution in the future. Overall, capital has the highest progress compared to labor and energy, which have the highest possibility of being substituted in the long run. Thus, a positive and strong relationship is needed in capital investments, and the government should create awareness about renewable energy consumption. Thus, predicting methods, cost analysis, and causality measures can be done based on the availability of information because the country has already started several industrial projects that will be completed in the future. For example, the Indian government planned to invest US$60 billion by 2024 to build industrial infrastructure in which gas transition is the major concern. This will give substitutive energy-related policies for the country. In addition, with climate change measures as the driving force rather than the resource economies, it is forecasted that there will be a growing demand for gas utilization.
Data availability statement
The original contributions presented in the study are included in the article/supplementary material, further inquiries can be directed to the corresponding authors.
Author contributions
MR: Writing – review & editing, Writing – original draft, Validation, Software, Methodology, Investigation, Formal analysis, Data curation, Conceptualization. BL: Writing – review & editing, Writing – original draft, Validation, Supervision, Software, Methodology, Formal analysis, Data curation, Conceptualization. QJ: Writing – review & editing, Writing – original draft, Validation, Software, Methodology, Formal analysis, Data curation, Visualization.
Funding
The author(s) declare that financial support was received for the research, authorship, and/or publication of this article. This paper was supported by National Natural Science Foundation of China (Key Program, No. 72133003).
Conflict of interest
The authors declare that the research was conducted in the absence of any commercial or financial relationships that could be construed as a potential conflict of interest.
Publisher's note
All claims expressed in this article are solely those of the authors and do not necessarily represent those of their affiliated organizations, or those of the publisher, the editors and the reviewers. Any product that may be evaluated in this article, or claim that may be made by its manufacturer, is not guaranteed or endorsed by the publisher.
Footnotes
1. ^We have analyzed the fossil fuel energy as a whole in the production process. As the industrial sector is a large fossil fuels energy consumer in India, we consider all the energy as industrial energy consumption in India.
2. ^According to the Central Board of Direct Taxes of India (2020) and Lin et al. (2022) find that the δt of an asset should commonly not be higher than 5% of the asset's real cost.
References
Ahlgren, P., Jarneving, B., and Rousseau, R. (2004). co-citation analysis and Pearson's r (letter to the editor). J. Am. Soc. Inf. Sci. Technol. 55:843. doi: 10.1002/asi.20030
Alam, J. B., Wadud, Z., Alam, J. B., and Polak, J. W. (2013). Energy demand and economic consequences of transport policy. Int. J. Environ. Sci. Technol. 10, 1075–1082. doi: 10.1007/s13762-013-0240-1
Alam, M. J., Begum, I. A., Buysse, J., Rahman, S., and Van Huylenbroeck, G. (2011). Dynamic modeling of causal relationship between energy consumption, CO2 emissions and economic growth in India. Renew. Sust. Energ. Rev. 15, 3243–3251. doi: 10.1016/j.rser.2011.04.029
Alam, M. M., Murad, M. W., Noman, A. H. M., and Ozturk, I. (2016). Relationships among carbon emissions, economic growth, energy consumption and population growth: testing environmental Kuznets curve hypothesis for Brazil, China, India and Indonesia. Ecol. Indic. 70, 466–479. doi: 10.1016/j.ecolind.2016.06.043
Bölük, G., and Koç, A. A. (2010). Electricity demand of manufacturing sector in turkey: a translog cost approach. Energ. Econ. 32, 609–615. doi: 10.1016/j.eneco.2010.01.007
Central Board of Direct Taxes of India (2020) Available online at: https://incometaxindia.gov.in/Pages/default.aspx?source=NW_TAC_HMD_BotAd_STD (accessed October 2023).
Chaturvedi, V., Eom, J., Clarke, L. E., and Shukla, P. R. (2014). Long term building energy demand for India: disaggregating end use energy services in an integrated assessment modeling framework. Energ. Policy 64, 226–242. doi: 10.1016/j.enpol.2012.11.021
Chaturvedi, V., Koti, P. N., and Chordia, A. R. (2021). Pathways towards India's nationally determined contribution and mid-century strategy. Energ. Clim. Change 2:100031. doi: 10.1016/j.egycc.2021.100031
Christensen, L. R., Jorgenson, D. W., and Lau, L. J. (1973). Transcendental logarithmic production frontiers. The Rev. Econ. Stat. 11, 28–45. doi: 10.2307/1927992
Das, N., Gangopadhyay, P., Alghamdi, T., Sarwar, S., Haseeb, M., Barut, A., et al. (2023). Understanding the role of efficiency in the electricity generation process for promoting human development in India: Findings from the novel multiple threshold nonlinear ARDL modelling. Utilities Policy 82:101554. doi: 10.1016/j.jup.2023.101554
Davis, S. J., Liu, Z., Deng, Z., Zhu, B., Ke, P., Sun, T., et al. (2022). Emissions rebound from the COVID-19 pandemic. Nat. Clim. Change 12, 412–414. doi: 10.1038/s41558-022-01332-6
Deka, A., Cavusoglu, B., Dube, S., Rukani, S., and Kadir, M. O. (2023). Examining the effect of renewable energy on exchange rate in the emerging economies with dynamic ARDL bounds test approach. Renew. Energ. Focus 44, 237–243. doi: 10.1016/j.ref.2023.01.003
Dhingra, T., Sengar, A., and Sajith, S. (2023). Identifying, analyzing, and prioritizing barriers in the Indian industrial and commercial rooftop solar sector. Solar Energ. 254, 15–26. doi: 10.1016/j.solener.2023.02.056
Felipe, J. (2018). Asia's industrial transformation: the role of manufacturing and global value chains (Part 1). Asian Dev. Bank Econ. Working Paper Series 549:457. doi: 10.22617/WPS189457-2
Ghosh, S., and Kanjilal, K. (2014). Long-term equilibrium relationship between urbanization, energy consumption and economic activity: empirical evidence from India. Energy 66, 324–331. doi: 10.1016/j.energy.2013.12.052
Hoerl, A. E., and Kennard, R. W. (1970). Ridge regression: biased estimation for nonorthogonal problems. Technometrics 12, 55–67. doi: 10.1080/00401706.1970.10488634
IEA (2021). Available online at: https://www.iea.org/reports/india-energy-outlook-2021 (accessed October, 2023).
India Economic Survey (2021). Available online at: https://www.indiabudget.gov.in/economicsurvey/ebook_es2021/index.html (accessed October, 2023).
Indian Power Industry Report. (2018). Available online at: https://rbsa.in/wp-content/uploads/reports/research-reports/RBSA_Report_Indian_Power_Ind.pdf
Jiang, B., and Raza, M. Y. (2023). Research on China's renewable energy policies under the dual carbon goals: a political discourse analysis. Energy Strat. Rev. 48:101118. doi: 10.1016/j.esr.2023.101118
Lin, B., and Fei, R. (2015). Analyzing inter-factor substitution and technical progress in the Chinese agricultural sector. Eur. J. Agron. 66, 54–61. doi: 10.1016/j.eja.2015.02.005
Lin, B., and Raza, M. Y. (2020). Energy substitution effect on transport sector of Pakistan: a trans-log production function approach. J. Clean. Prod. 251:119606. doi: 10.1016/j.jclepro.2019.119606
Lin, B., and Raza, M. Y. (2021). Fuels substitution possibilities and the technical progress in Pakistan's agriculture sector. Journal of Cleaner Production 314, 128021. doi: 10.1016/j.jclepro.2021.128021
Lin, B., and Tian, P. (2016). The energy rebound effect in China's light industry: a translog cost function approach. J. Clean. Prod. 112, 2793–2801. doi: 10.1016/j.jclepro.2015.06.061
Lin, B., and Wesseh Jr, P. K. (2013). Estimates of inter-fuel substitution possibilities in Chinese chemical industry. Energ. Econ. 40, 560–568. doi: 10.1016/j.eneco.2013.08.017
Lin, B., and Xie, C. (2014). Energy substitution effect on transport industry of China-based on trans-log production function. Energy 67, 213–222. doi: 10.1016/j.energy.2013.12.045
Lin, B., Zhu, R., and Raza, M. Y. (2022). Fuel substitution and environmental sustainability in India: perspectives of technical progress. Energy 261:125309. doi: 10.1016/j.energy.2022.125309
Ma, H., Oxley, L., and Gibson, J. (2009). Substitution possibilities and determinants of energy intensity for China. Energ. Policy 37, 1793–1804. doi: 10.1016/j.enpol.2009.01.017
Ma, Y. (2023). A Study on the Estimation of the Desirable Range of Cross-border Capital Flows in Emerging Economies. Beijing: China Social Sciences Press.
MoEFCC (2015). India's Intended Nationally Determined Contribution: Working towards Climate Justice. New Delhi: Government of India.
Mohapatra, S. M. (2022). Export performance: a study of labour and capital intensive manufacturing industries in India. Trans. Corp. Rev. 12, 1–11. doi: 10.1080/19186444.2022.2116898
Ozgur, O., Yilanci, V., and Kongkuah, M. (2022). Nuclear energy consumption and CO2 emissions in India: evidence from Fourier ARDL bounds test approach. Nuclear Eng. Technol. 54, 1657–1663. doi: 10.1016/j.net.2021.11.001
Pavelescu, F. M. (2011). Some aspects of the translog production function estimation. Romanian J. Econ. 32:41. Available online at: https://www.researchgate.net/publication/227441948
Poblete-Cazenave, M., and Pachauri, S. (2021). A model of energy poverty and access: estimating household electricity demand and appliance ownership. Energ. Econ. 98:105266. doi: 10.1016/j.eneco.2021.105266
Prywes, M. (1986). A nested CES approach to capital-energy substitution. Energy Econ. 8, 22–28. doi: 10.1016/0140-9883(86)90022-8
Raza, M. Y. (2023). Fuels substitution possibilities, environment and the technological progress in Bangladesh's transport sector. Heliyon 9:e13300. doi: 10.1016/j.heliyon.2023.e13300
Raza, M. Y., and Dongsheng, L. I. (2023). Analysis of energy-related CO2 emissions in Pakistan: carbon source and carbon damage decomposition analysis. Environ. Sci. Pollut. Res. 22, 1–13. doi: 10.1007/s11356-023-29824-8
Raza, M. Y., Lin, B., and Liu, X. (2021a). Cleaner production of Pakistan's chemical industry: perspectives of energy conservation and emissions reduction. J. Clean. Prod. 278:123888. doi: 10.1016/j.jclepro.2020.123888
Raza, M. Y., and Tang, S. (2022). Inter-fuel substitution, technical change, and carbon mitigation potential in Pakistan: perspectives of environmental analysis. Energies 15:8758. doi: 10.3390/en15228758
Raza, M. Y., Wang, X., and Lin, B. (2021b). Economic progress with better technology, energy security, and ecological sustainability in Pakistan. Sust. Energ. Technol. Assessm. 44:100966. doi: 10.1016/j.seta.2020.100966
Smyth, R., Narayan, P. K., and Shi, H. (2012). Inter-fuel substitution in the Chinese iron and steel sector. Int. J. Prod. Econ. 139, 525–532. doi: 10.1016/j.ijpe.2012.05.021
Solow, R. M. (1956). A contribution to the theory of economic growth. The Q. J. Econ. 70, 65–94. doi: 10.2307/1884513
Vijayalakshmi, S., and Raj, K. (2020). Cointegration analysis of income and vehicular growth in India: an ARDL approach. Trans. Res. Proc. 48, 646–664. doi: 10.1016/j.trpro.2020.08.066
Wang, Q., and Li, R. (2016). Drivers for energy consumption: a comparative analysis of China and India. Renew. Sust. Energ. Rev. 62, 954–962. doi: 10.1016/j.rser.2016.04.048
Wang, Q., and Song, X. (2021). Why do China and India burn 60% of the world's coal? A decomposition analysis from a global perspective. Energy 227:120389. doi: 10.1016/j.energy.2021.120389
Wang, X., Wen, X., and Xie, C. (2018). An evaluation of technical progress and energy rebound effects in China's iron and steel industry. Energ. Policy 123, 259–265. doi: 10.1016/j.enpol.2018.08.016
WDI (2021). Available online at: https://data.worldbank.org/indicator (accessed October, 2023).
Wolde-Rufael, Y. (2010). Bounds test approach to cointegration and causality between nuclear energy consumption and economic growth in India. Energy Policy 38, 52–58. doi: 10.1016/j.enpol.2009.08.053
Keywords: inter-fuel substitution, industrial sector, technical progress, factor productivity, India
Citation: Raza MY, Lin B and Javed Q (2024) Fuel substitution possibilities, factor productivity, and technological progress in the industrial sector of India. Front. Sustain. Energy Policy 3:1351785. doi: 10.3389/fsuep.2024.1351785
Received: 07 December 2023; Accepted: 23 May 2024;
Published: 03 July 2024.
Edited by:
Ming Zhang, China University of Mining and Technology, ChinaCopyright © 2024 Raza, Lin and Javed. This is an open-access article distributed under the terms of the Creative Commons Attribution License (CC BY). The use, distribution or reproduction in other forums is permitted, provided the original author(s) and the copyright owner(s) are credited and that the original publication in this journal is cited, in accordance with accepted academic practice. No use, distribution or reproduction is permitted which does not comply with these terms.
*Correspondence: Muhammad Yousaf Raza, eW91c2FmLnJhemFAeW1haWwuY29t; Boqiang Lin, YnFsaW5AeG11LmVkdS5jbg==; YnFsaW4yMDA0QHZpcC5zaW5hLmNvbQ==