 Paramastri Syafina
 Gbemi Oluleye
95% of researchers rate our articles as excellent or good
Learn more about the work of our research integrity team to safeguard the quality of each article we publish.
Find out more
ORIGINAL RESEARCH article
Front. Sustain. Energy Policy , 02 May 2024
Sec. Policy and Environmental Impact
Volume 3 - 2024 | https://doi.org/10.3389/fsuep.2024.1308441
This article is part of the Research Topic Incentive Policies for Green Innovation, Energy Efficiency, Environmental Protection, and Sustainability View all 3 articles
Lack of effective policies hinder the uptake of Utility-scale solar PV, even though they are projected to play a pivotal role in achieving Indonesia's 2050 net-zero energy target. This study seeks to identify a cost-effective pathway to increase the capacity of utility-scale solar PV in Indonesia through supportive policies that ensure equitable cost distribution between the government and industry. A novel Market Penetration Optimization Model is developed and applied in simulation mode to assess existing policies, and optimization mode to determine new policy recommendations and compare three policy induced diffusion pathways. Results show that current price-based policies are insufficient to stimulate growth in the solar PV market, only covering ~13% of the investment cost required by the industry. Thus, necessitating a reactivation of Feed-in-Tariffs. The optimal tariffs rates required range from 0.39 to 1.47 cents/kWh for the most economic pathway during the initial 10-year post-construction period. The Innovation Diffusion Theory-based pathway necessitates the lowest initial investment cost while yielding the highest revenue from electricity sales, demonstrating its superior cost-effectiveness compared to both the supply-based and linear pathways. This study enriches the literature by exploring the financial implications of policy induced diffusion pathways.
The Paris Agreement constitutes a pressing call for countries to curtail global warming to a maximum of 1.5°C above pre-industrial levels (UN, 2015). Indonesia, the fifth largest contributor to cumulative CO2 emissions from 1850 to 2021 (Evans, 2021), and the world's second-largest coal exporter (Workman, 2023), is part of this effort. Indonesian government has established its NDC outlining a reduction target of 31.89% by 2030 (Government of Indonesia, 2022a). The government's long-term ambition is to achieve net-zero emissions by 2060, or ideally by 2050 for the energy sector with international support (European Commission, 2022). This undertaking requires profound energy decarbonization, as the sector is projected to be the country's main source of CO2 emissions in the future (Sambodo et al., 2022). Indonesia electricity system relies on fossil power plants, predominantly coal-fired power plants, and is yet to make much progress with regards to liberalization, the current energy system is still heavily dependent on state control (Heffron et al., 2022). An energy-only wholesale market for electricity does not exist. Private utility companies may enter the industry as independent power producers (IPP) by selling the electricity generated to the State Electricity Company (SEC), the SEC distributes and sells the electricity to the consumers. Historical reforms of Indonesia's energy system to make renewables more cost-competitive with conventional power plants have been unsuccessful (Heffron et al., 2022). Therefore, the government is in search of a clear policy pathway to accelerate renewables take-up. Multiple integrated assessment modeling studies have determined the necessary capacity required from each renewable energy source. The studies consistently underscore solar as the primary energy source by 2050, contributing at least ~50% with utility-scale solar comprising no <3-quarters of it (IRENA, 2022; Paiboonsin, 2022). However, despite these encouraging forecasts, the present deployment of utility-scale solar PV remains constrained. In 2022, utility-scale solar PV only accounted for <0.1% of the total energy supply, with an installed capacity of just 190 MW (MEMR, 2023), in stark contrast to the country's abundant 3.000 GW solar potential (IRENA, 2022). Despite implementing a range of price-based policies since 2010—including the discontinued feed in tariff (FiT), income tax allowance, and exemptions from various type of import taxes—the deployment rate of utility-scale solar PV still falls behind the necessary level to constrain temperature rise to 1.5°C (IESR, 2022). Furthermore, various solar PV industries have expressed apprehensions about the instability and unattractiveness of these policies (Hamdi, 2019; Suharsono, 2020; Tenggara Strategies, 2022). Yet, there is no systematic way to identify a cost-effective policy induced pathway to increase the capacity of utility-scale solar PV in Indonesia by exploiting supportive policies to achieve the 2050 net-zero target. This requirement has not been addressed in prior scholarly works, creating a research gap that this study endeavors to fulfill by developing a novel market penetration optimization model (MPOM) for Indonesia. The MPOM employs the market penetration concept which states that effective policy support is required to reduce cost and generate sufficient demand-pull to further reduce cost according to the technology learning until a technology becomes cost-effective or an ambition is attained. This paper answers the following questions: (1) How effective are the existing price-based policies in supporting the growth of utility-scale solar PV in Indonesia, and to what extent do they contribute to achieving the 2050 net-zero goal? (2) What are the implications of three different penetration pathways (linear, supply-based, and IDT-based) on the investment cost, government financial support, and revenue generation in the utility-scale solar PV sector from 2022 to 2050? (3) To what degree does the current policy landscape fall short in providing the necessary financial support from the government to the utility-scale solar PV industry, and how does this gap impact the country's progress toward the 2050 net-zero target? (4) How can the Feed-in Tariff (FiT) policy be optimized to bridge the financial discrepancy between government and industry, and what are the specific tariff recommendations for different pathways and scenarios? The subsequent sections will provide a more detailed analysis of literature gaps and contributions of this study.
Indonesia aims to achieve net-zero emissions in the energy sector by 2050, with international coalition support of Just Energy Transition Partnership (European Commission, 2022). The partnership's official roadmap is yet to be published, but several sources have released their own projections detailing the energy mix required to achieve the overall net-zero 2050 target. IRENA (2022) have developed alternative roadmaps with three scenarios emphasizing renewable energy where it accounts for 85, 90, and 100% of the energy mix. Paiboonsin (2022) conducted a similar roadmap with a focus on cost minimization. Although their approach differed, all the scenarios (as presented in Figure 1) consistently indicate that solar energy will be the primary energy source in 2050, contributing at least ~50% of the total energy with no < share stemming from utility-scale installations. This pivotal role of solar in meeting Indonesia's future energy demand is mainly attributed to the country's equatorial positioning with a consistent irradiation of 4.8–5.1 kWh/m2 per day, making solar energy's potential the highest when compared to other energy sources (EKONID, 2022).
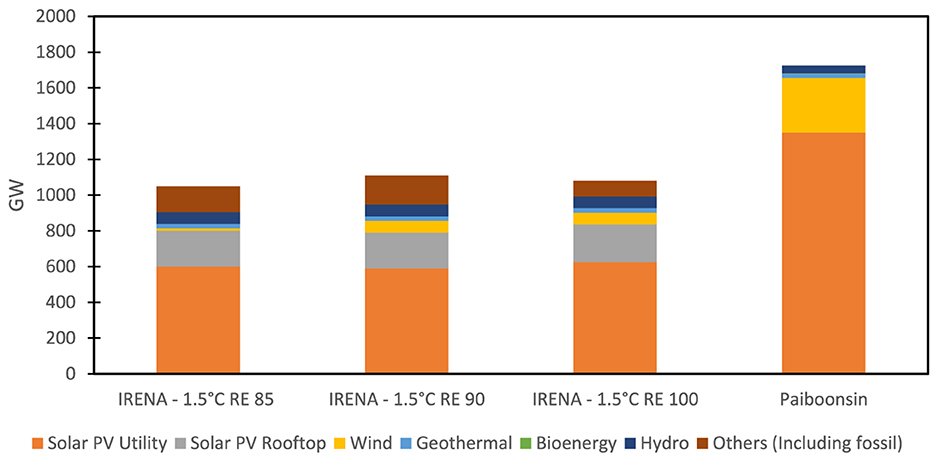
Figure 1. Projections of energy mix by 2050 in Indonesia, adapted from IRENA (2022) and Paiboonsin (2022).
To achieve these targets, IRENA (2022) underscores the need for an investment ranging from $405,000 to $434,000 million for solar PV alone, whereas Paiboonsin (2022) calculated a total cost estimate of $6,200,000 million for the whole energy system decarbonisation. Nevertheless, both studies lack a comprehensive blueprint detailing how the investment and total mitigation costs can be fairly distributed between government and industry through effective policy support. The allocation of governmental support becomes critical, as it must avoid excessive budgeting while also preventing underfunding, which could discourage the emerging solar PV industry. Moreover, neither study determines cost-effective solar PV diffusion up to 2050, nor do they determine the impact of existing policies on demand creation. Thus, there exists a necessity to assess and design cost-effective policy support that attains equilibrium between governmental and industrial costs through an optimisation approach, an aspect that will be integrated into the modeling framework of this research. Market-based policy recalibrates the price signals of energy to stimulate and generate markets that did not previously exist (Bergek and Berggren, 2014; Anbumozhi et al., 2015). Two types of market-based policy are the price-based policy (e.g., taxes, subsidies, FiTs, and allowances) and the quantity-based policy (e.g., tradable permits and emission trading schemes). This study will focus primarily on the price-based policies due to their direct influence on costs and can thus be adjusted on the modeling system.
The implementation of supporting policies for utility-scale solar PV first commenced in 2010, using exemptions on various import taxes such as import-income tax, import duty, and VAT on solar power plant construction materials (Ministry of Finance, 2010). As depicted in Figure 2, these policy interventions had a subtle impact on increasing installed capacity up to 2013 until the FiT was introduced. The FiT provided stable electricity pricing for the solar PV industry, resulting in a sudden surge in capacity. However, the FiT was cut after 1 year (Hamdi, 2019). In 2015, income tax allowance was instituted, offering a certain amount of deduction based on one company's investment to reduce income tax that needs to be paid (Government of Indonesia, 2015). This led to a modest capacity rise, which was further amplified by the well-priced new FiT scheme in 2016. Nonetheless, in 2017, the FiT was benchmarked against the price of conventional electricity. This compelled solar to compete with relatively cheap coal energy (Hamdi, 2019), resulting in a substantial decline in solar installed capacity in the following year. Another existing policy was tax holiday which is excluded in this study due to the policy's challenging requirement for a minimum initial investment, resulted in a low rate of applicants and beneficiaries (Halimatussadiah et al., 2023). The enforcement of the FiT was discontinued and replaced by ceiling tariffs in 2022. This implies that the price of electricity purchased by Indonesia's national utility company, PLN, from solar PV developers is determined only through negotiations with the ceiling tariffs as the upper price limits (Government of Indonesia, 2022b). Consequently, the current's policy scheme in Indonesia for utility-scale solar PV now only relies on tax exemptions/allowances, while the direct incentives like the FiT are absent.
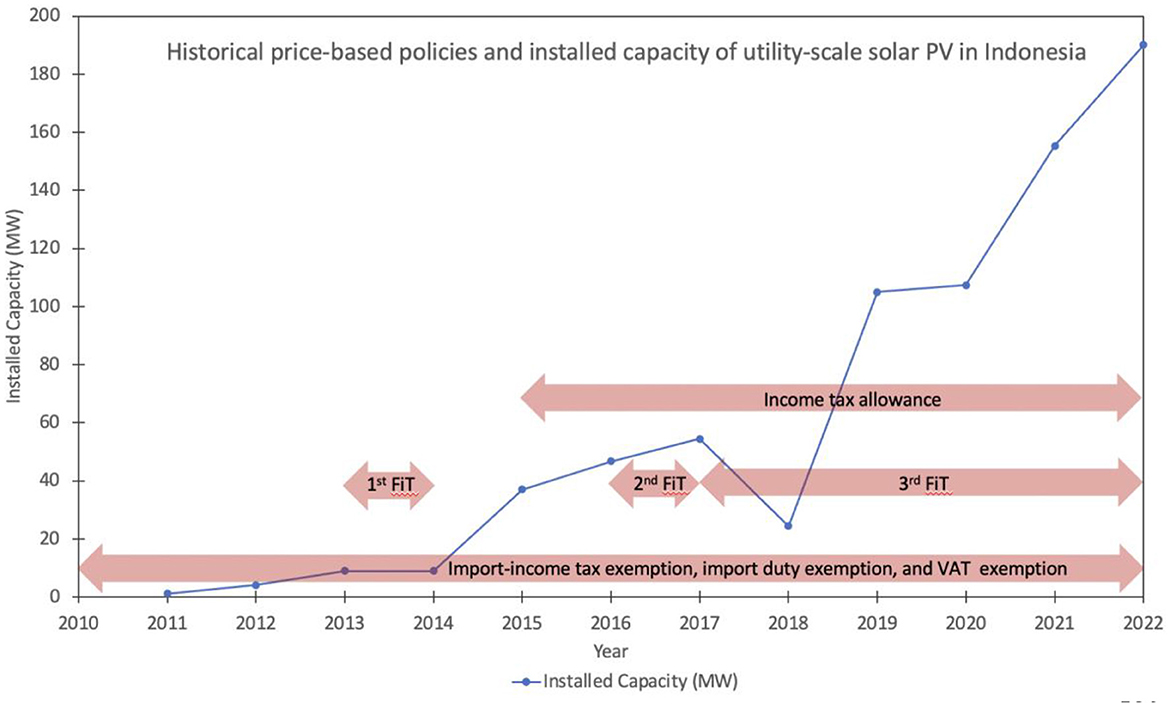
Figure 2. Historical price-based policies and installed capacity of utility-scale solar PV in Indonesia, adapted from Ministry of Finance (2010), Government of Indonesia (2015), and Hamdi (2019).
A distinct lack of research is apparent when it comes to investigating the long-term influence of market/price-based policies aligned with the 2050 agenda incorporating optimisation to account for trade-offs. Despite the parity between the utility-scale solar PV and coal in Indonesia, current deployment is still lagging with a notably limited installed capacity of 190 MW (MEMR, 2023). This current capacity translates to a mere 0.03% of the “IRENA 1.5°C—RE85” target. Leapfrogging the country's solar energy system would require intensive financial investment and robust governmental policy support. Finding a way to cost-effectively finance this transition becomes critical, especially in an emerging country like Indonesia, since the government still needs to allocate the financial resources to other priorities such as public services, social protection, health, and education (Ministry of Finance, 2018).
While achieving a cost-effective transition is critical for Indonesia, it is recognized that the current transition pathways/milestones derived from prevalent integrated assessment models are predominantly based only on the supply potential of clean energy resources, which disregards alternative pathways that could yield a more cost-effective transition (IRENA, 2022; Paiboonsin, 2022). To address this gap, this research compares it to new pathways focusing on the how to grow the market for utility scale solar PV. One new pathway is based on innovation-diffusion theory (IDT) initially formulated by E.M. Rogers in 1962 which takes into account distinct consumer groups characterized by their adoption speed: the early adopters and innovators who swiftly embrace new technologies with minimal persuasion, the majority who adopt them over a middle period, and the laggards who are more hesitant and tend to adopt the latest, often under external pressures (LaMorte, 2022). Several innovations like steel, steamships, electric power, road, central heating, shipping port infrastructure, telegraphs, railways, canals have been shown to penetrate the market with a gradual non-linear process in a characteristic logistic (S-shaped) curve based on the IDT (Grübler, 1996; Meldrum et al., 2023), yet this has still not been integrated into policy formulation. A policy-induced IDT based pathway may be a more cost-effective way to achieve the required take-up of utility scale solar PV, again this has still not been studied. Besides the supply-based and the IDT-based, a linear pathway–which assumes that the utility scale solar PV industry has the capability to grow at a constant rate every year–is also included in this study. These three pathways (supply-based, IDT-based, and linear) will have different implications on mitigation cost, technology cost reduction based on experiential learning [where the investment cost is projected to decrease as demand increases due to improved production skills (Grafström and Poudineh, 2021)]. In that way, this study will compare and determine the most cost-effective pathway for both government and industry to accelerate the uptake of utility scale solar PV. This approach of benefitting from technology cost reduction due to the increased demand have not yet explored before within the context of solar PV in Indonesia. Even though the learning curve logic can provide a quantitative framework to predict how policy induced demand pull can drive down costs, it is yet to be applied to market-based policy design and assessment for utility scale solar PV uptake.
Preceding literature reviews highlight three main gaps. Firstly, prevailing integrated assessment models fail to incorporate strategies for equitable financing that cater to both governmental and industrial entities. Secondly, although research has evaluated the impact of policy measures on the economic viability of solar PV projects, there remains a dearth of studies that model the long-term implications of these policies in supporting the 2050 net-zero agenda. Thirdly, current studies have not yet explored possible pathway choices to cost-effectively grow the market, benefiting from technology cost reduction due to the increased demand, to bridge the discrepancy of utility-scale solar PV capacity in Indonesia. In response to these identified gaps, this study presents a contribution by developing a novel MPOM. The model is applied to compare the three diffusion pathways, and operates in two modes: simulation, to evaluate existing policies, and optimisation, to determine additional policy tariffs that are gap fillers to achieve a win-win between government and industry. The model can be applied to any country. The primary question driving this study is: “How to cost-effectively grow the installed capacity of utility-scale solar PV in Indonesia through supportive policies that result in equitable mitigation costs for both the government and industry, to ultimately attain net-zero target by 2050?” The optimisation model is considered important for policy design due to three key advantages: automated policy decisions within a realistic government budget, elimination of trial-and-error, and easy adjustment of different comparable scenarios (Riguzzi et al., 2012). The MPOM framework established in this research adopts the theory of Market Potential Assessment (MPA), which was originally introduced by Oluleye et al. (2021). Essentially, the MPA evaluates a technology's market share/uptake across diverse policy scenarios and determines the rate of policy implementation needed to attain a required cost reduction or other specific target. It has been applied to nascent, costly technologies and aimed primarily to minimize the total mitigation cost.
A critical contribution is the development of multi-period non-linear market penetration optimisation model for utility-scale solar PV sector in Indonesia in the period 2022 to 2050. The model's degree of freedom is the policy tariff offering and yearly incremental capacities following different diffusion pathways. The model is utilized in two main ways: firstly, to evaluate the existing policy in Indonesia in simulation mode; and secondly, to identify new policy's tariff to fill the gap for a win-win between government and industry using the optimisation mode. In both modes, technology cost reduction due to learning factors are considered, encompassing less optimistic, moderate, and optimistic scenarios to handle uncertainties. The total investment cost necessary to grow utility-scale solar PV capacity to reach 2050 net-zero target is apportioned between the government and industry (Equation 1). The annual cost to the government in year (i) refers to enactment expenses of supportive policies encompassing income tax allowances, import-income tax exemption, VAT exemption, import duty exemption, and FiT as a new recommended policy (Equation 2). Consequently, the remaining cost expected to be covered by the industry is assumed to be equal to the total investment cost minus the cost to the government. The cost associated with existing policies are calculated using Equations (3–6). The income tax allowance is applied to the yearly increase of the investment costs, based on the premise that it is exclusively given to industry developing new projects. The income tax allowance given in year (i) is determined by adding up the annual allowances from the preceding 6 years, following the payment period specified by the Government of Indonesia (2015) as shown in Equation (3). The VAT exemption, import-income tax exemption, and import duty exemption are calculated using Equations (4–6) (Lathifa, 2022; Maulida, 2023; Online Pajak [Online Tax], 2023). The exemptions are applied to 50% of the equipment cost, based on the assumption that industry must import ~ of the equipment due to the efficiency and economic limitations of domestic solar panels (Umah, 2021). The equipment cost alone constitutes 53% of the CAPEX, according to a study conducted by IESR (2019). All the CAPEX is multiplied to the yearly increase of the capacity, as these exemptions are also assumed to only be given to new utility-scale solar PV projects. Investment cost is obtained through the multiplication of the CAPEX by the annual increase of installed capacity, as indicated by Equation (7).
The CAPEX alone is projected to decrease annually as the installed capacity increase, driven by advancements in technology learning and experience (Wiesenthal et al., 2012). This study uses distinct learning rates for every decade spanning from 2021 to 2050 in low, medium, and high scenarios listed in Table 1 leading to less optimistic, moderate, and optimistic modeling scenarios respectively for each diffusion pathway. The meaning of all symbols is provided in the nomenclature.
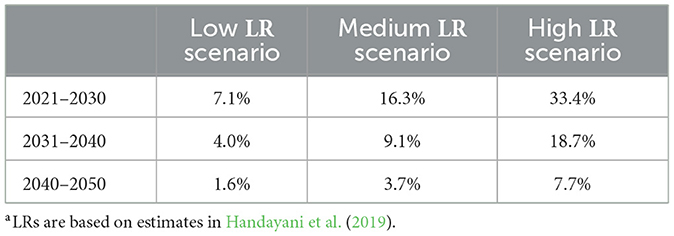
Table 1. Learning rates of utility-scale solar PV.a
Equations (8, 9) incorporates the learning rate into the CAPEX. The unsubsidised initial CAPEX in 2022 value is set at 1,119 USD/kW (IEA, 2020). The utilization of single cost value may oversimplify the cost differences across various regions. Because no public data on regional cost variations was accessible during the research, this study depends on the recent average of CAPEX available for utility-scale solar PV projects in Indonesia. The minimum revenue accrued to the utility operator from installing utility scale solar PV can be estimated using the LCOE. The LCOE is the price to achieve a breakeven point, hence using it gives an indication of the minimum revenue to offset the investment in the technology. This revenue could depend on the diffusion pathway, hence justifying considering several diffusion pathways. This revenue from electricity sales accrued by the utility operator is obtained by multiplying the LCOE with energy produced per year, calculated using Equations (10–12) according to methods previously done by Kadang and Windarta (2021) and Oluleye et al. (2021). LCOE is defined as the price electricity should be sold to achieve a breakeven point lifespan (Tezer et al., 2017). The parameters considered in the annuity factor calculation are shown in Table 2.
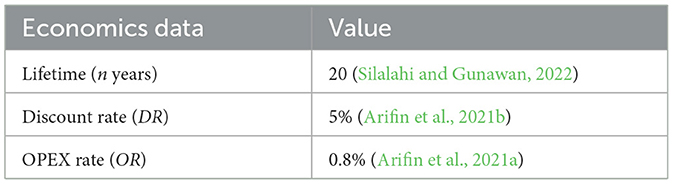
Table 2. Parameters used for annuity factor calculation.
The actual energy produced per year is calculated based on installed capacity data using Equation 13. Capacity factor of 16% is used, following the implementation by Veldhuis and Reinders (2013).
By 2022, the installed cumulative capacity of utility-scale solar PV in Indonesia stands at 190.06 MW (MEMR, 2023), denoted as IC2022. This study particularly adopts the “IRENA 1.5°C—RE85” target, which predicts an installed capacity of around 600 GW by 2050 (IRENA, 2022) denoted as IC2050. The selection of the “IRENA 1.5°C—RE85” target is based on the scenario's high viability compared to other options, as it presents the lowest total renewable energy required to achieve net-zero by 2050. The model determines the annual installed cumulative capacity (IC2023 to IC2049) according to different diffusion pathways. Three diffusion pathways (linear, supply-based, and IDT-based) are explored in this paper (Figure 3). It is essential to note that these pathways are not intended to predict the future, but rather serve as potential strategies to grow the market. The subsequent financial implications regarding the allocation of costs between the government and the industry under each pathway will be determined.
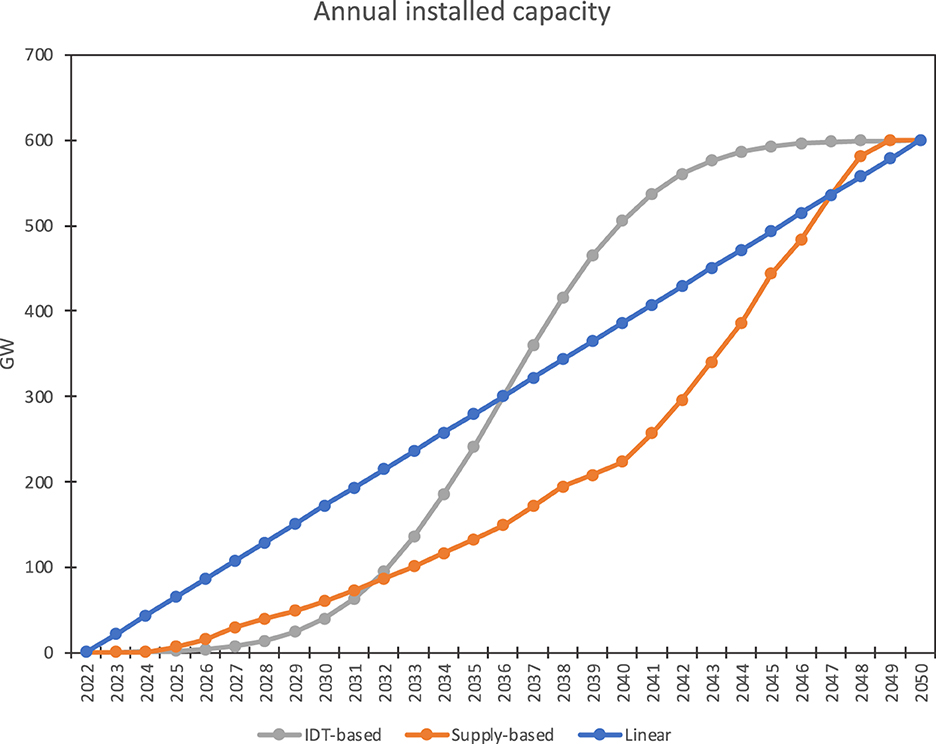
Figure 3. Installed capacities for the three diffusion pathways.
The linear pathway operates on an assumption that all the utility scale solar PV industry can grow at a constant rate (21.42 GW) toward net-zero target, without any delays or accelerations. The supply-based pathway is derived through the amalgamation of outcomes from prior supply-based modeling scenarios, specifically from IRENA (2022) labeled as “IRENA 1.5°C—RE85” and another scenario from Paiboonsin (2022) labeled as “NZ50.” The “IRENA 1.5°C—RE85” scenario is regarded as the most pragmatic option among other choices due to its minimal renewable energy target, and it has been corroborated by both government and renewable technology developers' interviews. However, the dataset lacks information on annual capacity growth. On the other hand, the “NZ50” scenario incorporates yearly capacity growth for utility-scale solar PV but exhibits greater ambition in terms of the overall capacity volume. The supply-based pathway combines the approaches of both methodologies, integrating the growth of “NZ50” into the final target of “IRENA 1.5°C—RE85.” The IDT-based pathway applies the principles of innovation-diffusion theory to delineate the yearly installed capacity, resulting in the overall shape of an S-curve (LaMorte, 2022). The S-curve is developed by using normal distribution function in Microsoft Excel with 3.958 standard deviation. The IDT growth accommodates consumer types with different uptake capability: early adopters and innovators who can promptly take-up the technology, the mainstream majority, and the laggards who exhibit reluctance toward new technologies. As a result, the pathway initially demonstrates a slow rise, followed by significant acceleration during the middle phase, and eventually tapering off toward the end. The research scope is limited to the price-based policy support for utility-scale solar PV in Indonesia, covering the period from 2022 to 2050. It examines the market of utility-scale solar PV with different sizes, technologies, and project locations as a unified entity. This study targets utility-scale solar PV which are connected to the grid and presumes no battery needed. Thus, battery costs are not included in the capital expenditure calculations. Table 3 shows the tariffs of existing price-based policies in Indonesia.
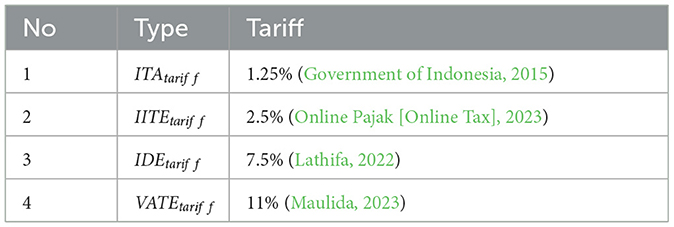
Table 3. Tariffs of existing price-based policies.
The Feed in Tariff is constrained to not exceed the ceiling prices (Table 4) set by the Government of Indonesia (2022b), distinguished between the first 10 years and after 10 years after a project is developed (Equations 14–16).
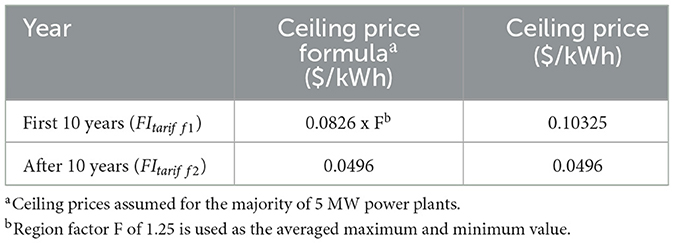
Table 4. Ceiling prices of utility-scale solar PV (Government of Indonesia, 2022b).
This section describes the results and findings from applying the MPO model (Equations 1–16) to compare the linear, supply-based, and IDT-based penetration pathways for Indonesia's utility-scale solar PV from 2022 to 2050, while accounting for the less optimistic, moderate, and optimistic learning factors. Where pertinent, the outcomes of this study will contextualize a broader landscape of renewable technology trends in Indonesia by drawing comparisons with relevant but more extensive bodies of literature.
To Initially, the model is executed in simulation mode to evaluate how much of the existing price-based policy support from the government offsets the investment costs required by industry to establish utility-scale solar PV capacity for reaching Indonesia's net-zero target of 600 GW by 2050. Figure 4 shows the spread of both the policy support and investment costs. In the linear penetration pathway (Figure 4A), the total investment cost from $129,779 to $456,761 million, with a moderate value of $285,317 million. The financial contribution from governmental price-based policies ranges from $15,238 to $56,170 million, with a moderate value of $34,509 million. The average extent of government support toward the investment cost encompassing all three learning factor scenarios amounts to a mere 12.04%. In the context of the supply-based pathway (Figure 4B), the total investment cost spans from $202,828 to $515,769 million, with a moderate value of $369,931 million. Government support through price-based policies is observed to range from $24,617 to $63,495 million, and a moderate value of $45,281 million. The average coverage of government support toward the investment cost across all three learning factor scenarios remains relatively low at 12.23%. Considering the IDT-based penetration pathway (Figure 4C), the total investment cost varies from $107,199 to $456,255 million, with a moderate value of $276,384 million. The financial support attributed to governmental price-based policies spans from $13,978 to $59,667 million, yielding a moderate value of $36,115 million. This results in an average coverage of government support toward the investment cost to be 13.06%.
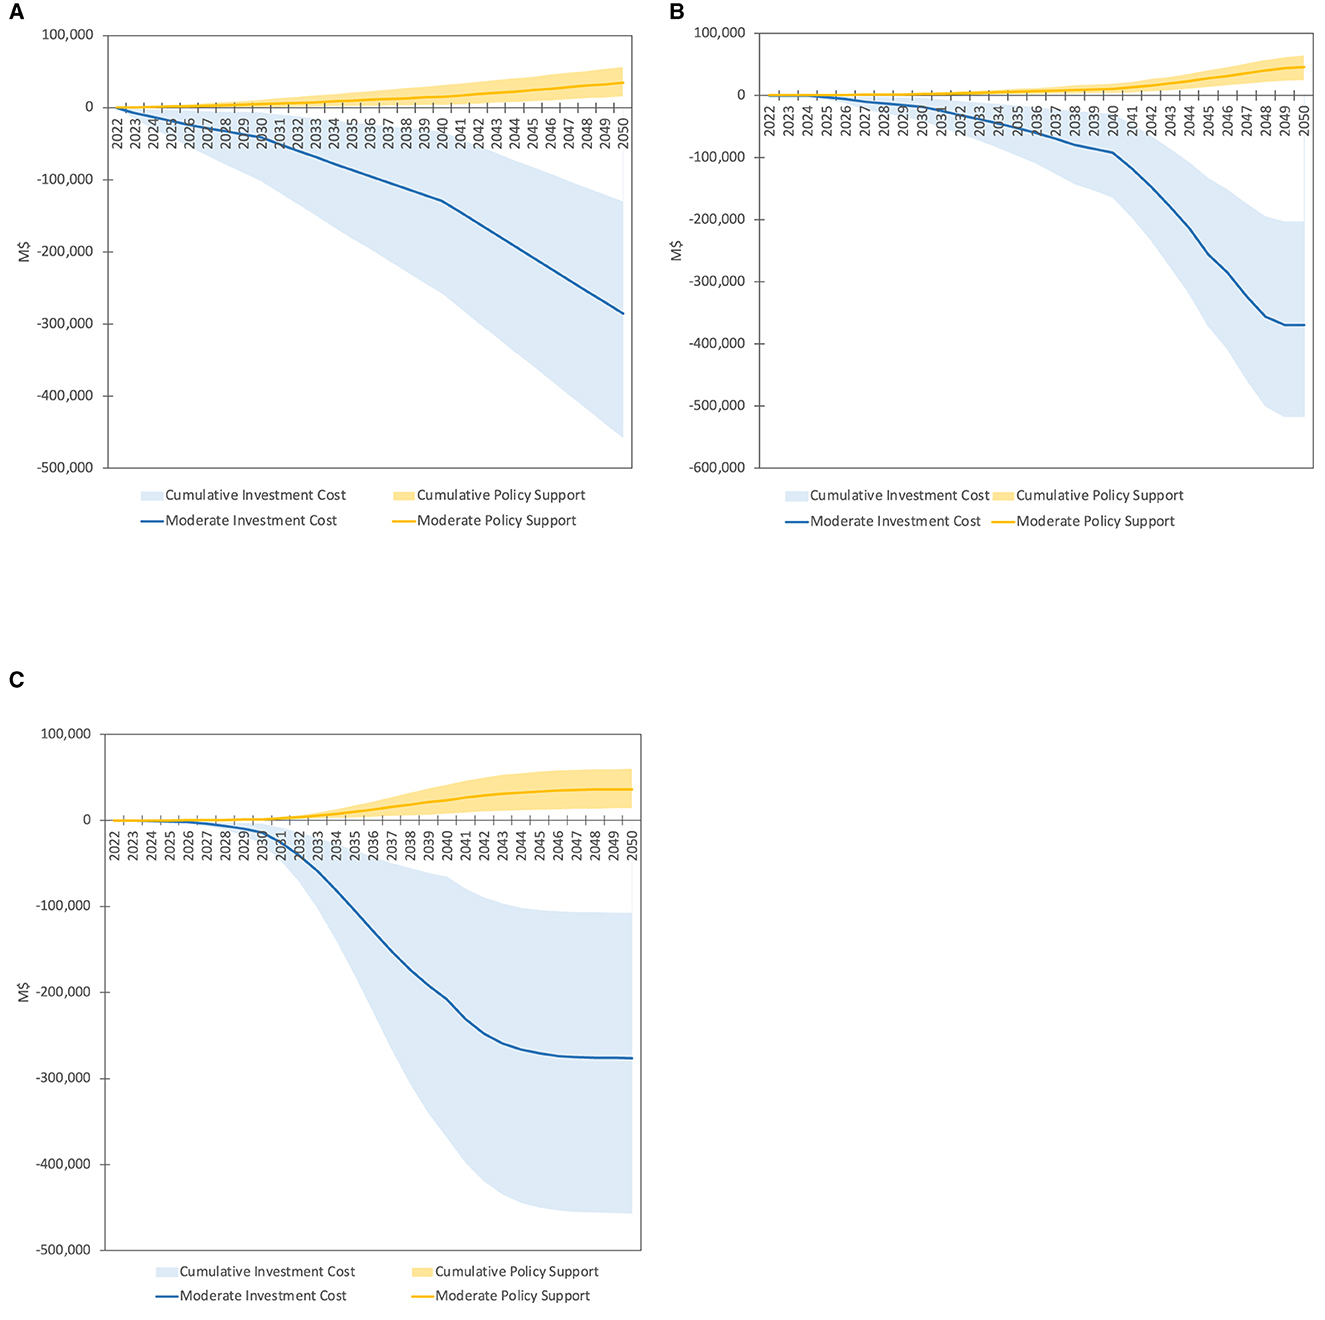
Figure 4. Simulation results (A) linear diffusion pathway, (B) supply-based diffusion pathway, (C) IDT-based diffusion pathway.
The examination of all three distinct diffusion pathways unveils a persistent trend: the government's financial support coverage consistently falls far short. This implies that, under the existing policy framework, the Indonesian government does not allocate sufficient funds to grow the market of utility-scale solar PV to achieve its 2050 net zero goal. These findings resonate with a previous study done by Suharsono et al. (2022) that recorded incentives given by the government to different type of energy sources in Indonesia from 2016 to 2020. The previous investigation underscored that the renewable sectors in Indonesia received <1% of the total government energy support, with the majority directed toward geothermal and undermining the high potential of solar PV. In stark contrast, the fossil-based sector secured a staggering 94% of the total government support. Similarly, another study (ADB, 2020) emphasized the inadequacy of current tax incentives for renewables to stimulate the necessary investments. This insight overall highlights the Indonesian government's lack of prioritization in supporting renewable sectors, particularly utility-scale solar PV, to competently rival fossil-based industry, thereby presenting one explanation for the delayed advancement of solar PV in the country. The contrast between the level of financial support provided by the government and the significant investment required emphasizes the need to include another policy recommendation funneling supplementary incentives. FiT is the policy that is recommended to be reactivated, based on its significant historical influence on the utility-scale solar PV installed capacity as demonstrated in Figure 2. The forthcoming subsection will delve into the optimization results of the FiT.
Figures 5A, B shows the outcome of the designed FiT for two periods in accordance with the regulations stipulated by the Government of Indonesia (2022b). The box plots feature an upper boundary denoting the less optimistic scenario, a lower boundary denoting the optimistic scenario, and the result from moderate scenario in-between. For the first 10 years, the tariffs ranged from 0.24 to 1.59 cents/kWh for linear, 1.07 to 2.57 cents/kWh for supply-based, and 0.39 to 1.47 cents/kWh for IDT-based pathway. After 10 years, the tariffs ranged from 0.63 to 1.16 cents/kWh for linear, 0.39 to 1.35 cents/kWh for supply-based, and 0.19 to 1.20 cents/kWh for IDT-based pathway. Within the initial decade, the supply-based penetration pathway requires higher tariffs compared to the others, while the tariffs for IDT-based and linear penetration pathways exhibit minimal difference. After this period, the moderate tariffs for IDT-based are notably 51 and 70% lower than supply-based and linear pathways, respectively. Despite the FiT being 3% higher than linear in the less optimistic scenario, the tariff for IDT-based in optimistic scenario differs significantly from the linear and supply-based pathways, with a disparity of 33 and 31%. Hence, the preference leans toward the IDT-based penetration pathway due to its generally lower tariffs, particularly after the next 10 years.
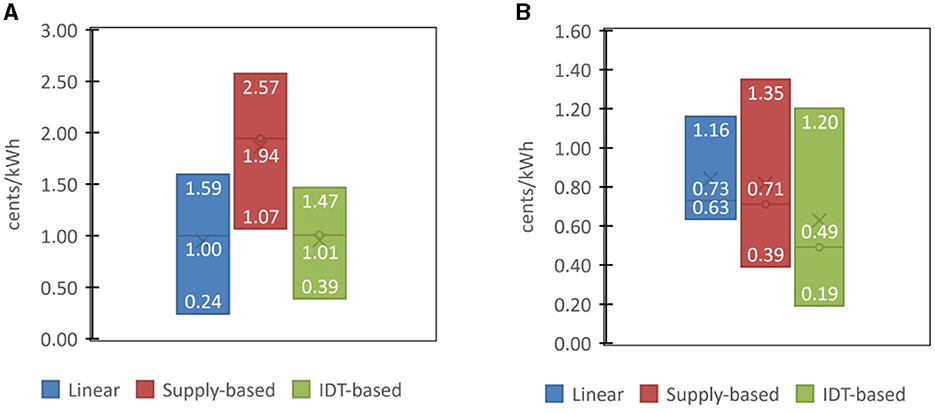
Figure 5. Optimal FiT recommendation (A) FiT before 10 years of projects completion, (B) FiT after 10 years of projects completion.
Figures 6A–C show the increased support from government due to the optimal FiT policy in Figure 5, here the government's financial commitment to support the growth of utility scale solar PV is 50% of the investment cost. These results underscore the IDT-based pathway's comparative advantage in terms of investment cost, exhibiting reductions of 0.1, 3.1, and 17.4% in relation to the less optimistic, moderate, and optimistic scenarios of the linear pathway, and 11.5, 25.3, and 47.1% for the less optimistic, moderate, and optimistic scenarios of the supply-based pathway, respectively. As a result, the IDT pathway emerges with the lowest overall total cost required from government to align with industry expenses. Notably, the IDT pathway necessitates a total FiT range from $39,621 million (optimistic scenario) to $168,460 million (less optimistic scenario), with a moderate value of $102,077 million. This phenomenon can be elucidated by considering the dynamics of cost-reduction technologies. As shown in Table 1, this study acknowledges different learning rates on every decade, referring to data from previous analysis done by Handayani et al. (2019). The data shows the most notable reduction manifest during the initial year of technology adoption and progressively tapering off until 2050. The IDT-based pathway benefit industry the most from expediting power plants capacity installations in 2032 and 2041 when there is still substantial technology cost reduction effect (Figure 7), driven by the engagement of the early and late majority groups of adopters. In contrast, the supply-based pathway exhibits delayed capacity growth, with acceleration predominantly occurring after 2041 when the learning rate effect is minimal, leading to a comparatively diminished cost reduction effect (Figure 7). In the linear pathway, however, the reduction rate remains consistent across all years (Figure 7).
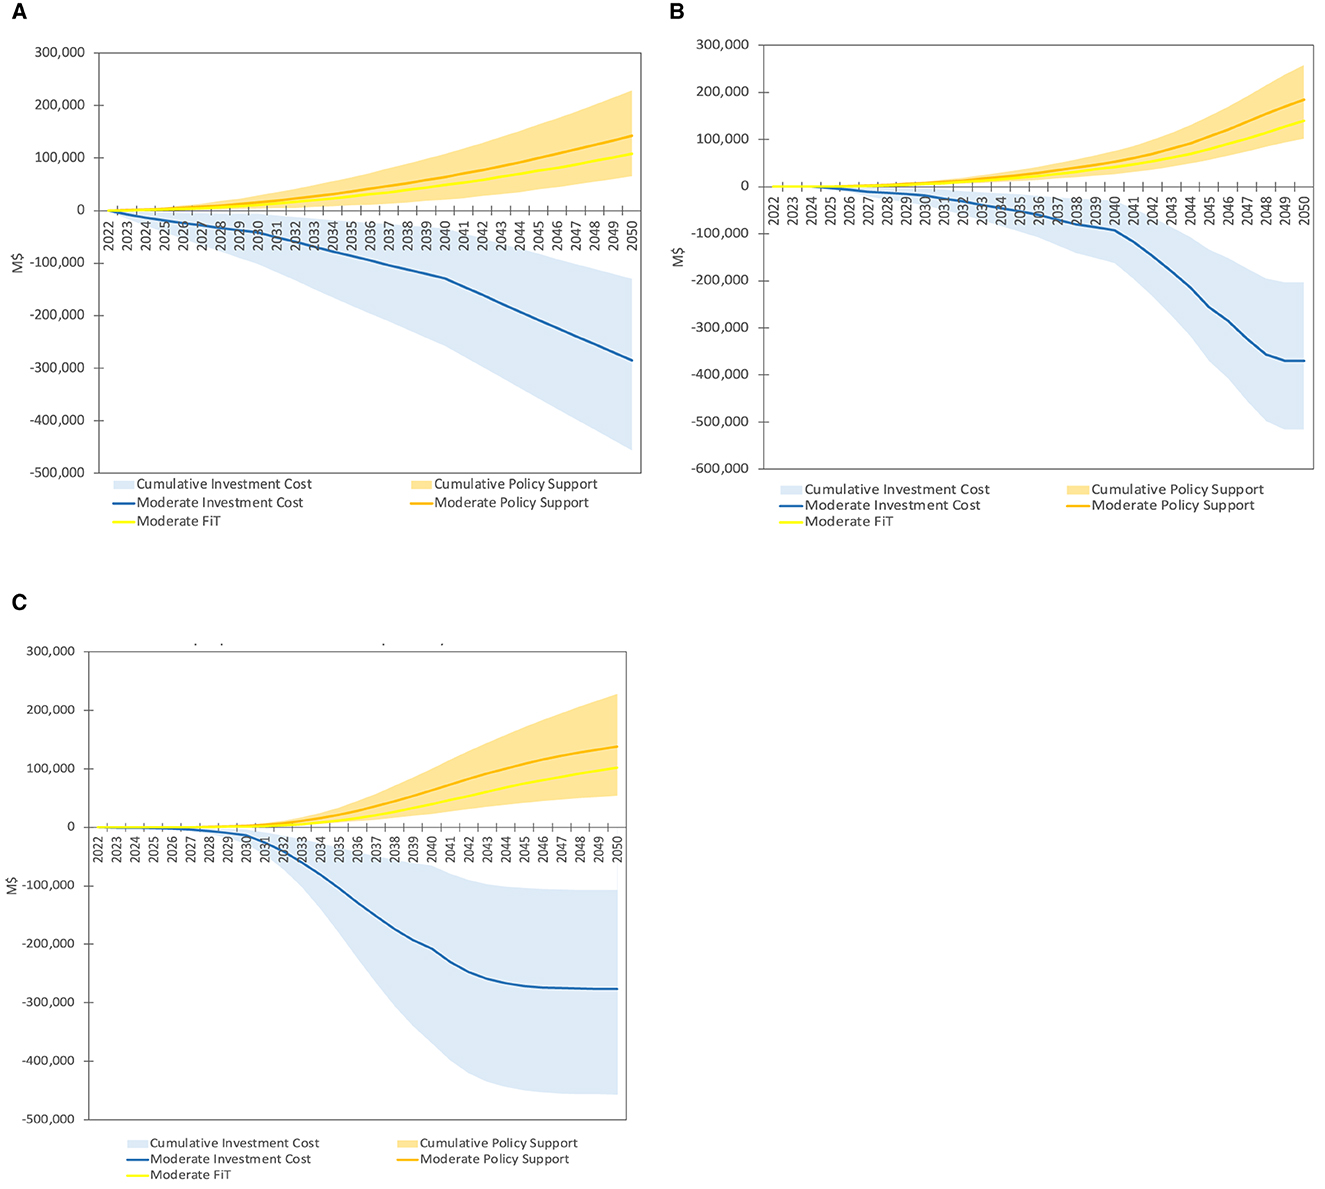
Figure 6. Optimisation results: (A) linear pathway, (B) supply-based pathway, and (C) IDT-based diffusion pathway.

Figure 7. Annual incremental installed capacity growth.
This study also evaluates the revenue generated from electricity sales as another consideration in selecting the most cost-effective penetration pathway. Figures 8–10 reveal that, the linear pathway cumulative revenue ranges from $212,432 to $580,348 million, with a moderate value of $402,641 million. The supply-based pathway cumulative revenue ranges from $183,300 to $436,789 million, with a moderate value of $322,134 million. Conversely, the IDT-based pathway's cumulative revenue spans from $235,302 to $600,615 million, with a moderate value of $431,007 million.
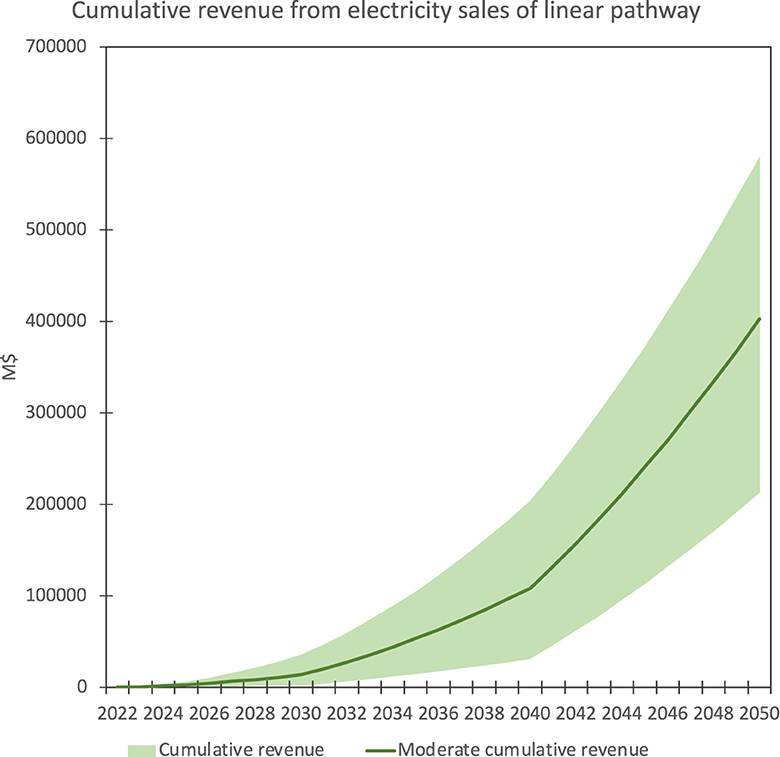
Figure 8. Revenue from linear diffusion pathway.
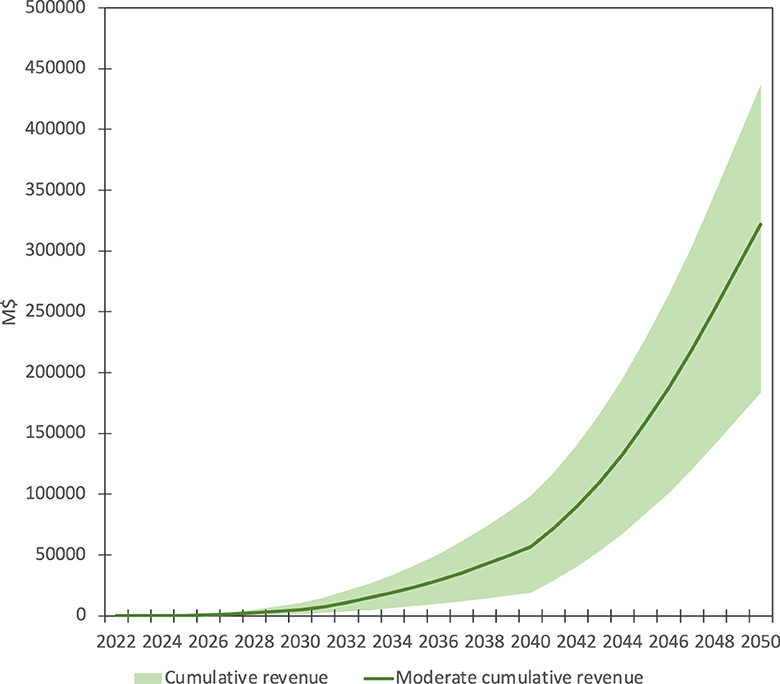
Figure 9. Revenue from supply-based diffusion pathway.
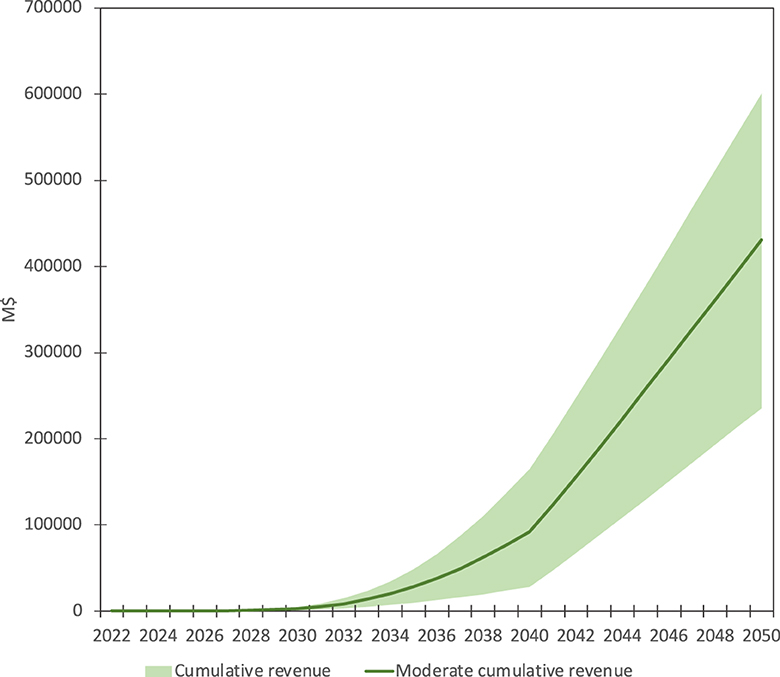
Figure 10. Revenue from IDT-based diffusion pathway.
From these results, the IDT pathway outperforms the linear and supply-based alternatives in terms of revenue generation. These findings emphasize the superior revenue-generating potential of the IDT-based pathway in electricity sales, with respective increases of 3.5, 7, and 10.8% in relation to the less optimistic, moderate, and optimistic scenarios of the linear pathway, and increases of 37.5, 33.8, and 28.4% for the less optimistic, moderate, and optimistic scenarios of the supply-based pathway. A marked surge in revenue from the IDT-based pathway becomes evident after 2035 where the other pathways are being surpassed (Figure 10). This phenomenon is attributed to the rapid expansion of installed capacity in the middle of the period (Figure 7). To illustrate, by 2040, the IDT pathway's annual capacity will exceed 500 GW, indicating that for the next decade, it garners payments for over 500 GW of capacity annually from the public, while the other two pathways still account for half that amount. This trend emphasizes the favorable revenue prospects associated with the IDT pathway's capacity growth and timely adoption.
Due to the lack of available data detailing the cost differentials during the research period, this study relies on the most recently available average CAPEX for utility-scale solar PV projects within Indonesia. The utilization of single CAPEX figure, however, weakens the study's capacity to account for cost variations across distinct Indonesian regions. Hence several scenarios are introduced. To address this limitation, future researchers could collect empirical data from operational utility-scale solar PV installations in different regions in Indonesia, thereby enhancing the validity of the results. The cost utilized in this study exclusively encompasses the investment expenditure for the initial development of utility-scale solar PV. Costs associated with maintenance, operation, and other expenses aimed at mitigating potential effects resulting from solar plant construction, i.e., urban heat, are outside the scope of this study. Another limitation inherent in this study pertains to the gradually decreasing learning rate used across different decades according to data from Handayani et al. (2019), resulting in spikes in the cost reduction trajectory from 2022 to 2050. While these spikes might reflect several technological and design advancements (Abernathy and Wayne, 1974), opportunities exist for future researchers to complement the secondary data with direct interviews involving utility-scale solar PV developers in Indonesia. This approach would allow for a verification of the actual impact of learning factors on the utility-scale solar PV cost reduction. It is crucial to highlight that the model created in this research does not provide an exact forecast of future scenarios, rather it provides a new approach to envision financial implications from the selection of policies and diffusion pathways. The model's adjustable nature in the policy offerings and diffusion pathways accommodates future applications on different technologies, timeframes, and capacity targets.
Existing price-based policies in Indonesia are insufficient to support de-risking investment in utility scale solar PV to achieve 2050 targets (as shown in Figure 1). The reinstatement of the Feed-in Tariff (FiT) policy is strongly recommended, given its historical success in driving solar PV capacity growth. The optimization results propose FiT tariffs ranging from 0.24 to 1.59 cents $/kWh for the linear pathway, 1.07 to 2.57 cents $/kWh for the supply-based pathway, and 0.39 to 1.47 cents $/kWh for the IDT-based pathway in the initial decade, demonstrating contextually optimized incentives. The FiT is not the only policy support for utility scale solar PV in Indonesia; hence the FiT is not the same as the LCOE. Indonesia currently has other policies as shown in Table 3. Hence, the model determines what the minimum value of the FiT needs to be to offset investment in utility scale solar PV by 50% (whilst simultaneously including existing policies and bounded by the government ceiling prices). Offsetting investment by 50% is determined for a win-win between government and industry. This enables the exploration of different diffusion pathways from the same basis. In addition, the Indonesian government is pushing for a collaboration with industry to grow the utility scale solar PV market where government market-based policies contribute at most 50%. The Innovation Diffusion Theory (IDT)-based pathway emerges as the most cost-effective strategy, offering reductions of 0.1–17.4% compared to linear and 11.5–47.1% compared to supply-based pathways. These results present a robust case for embracing IDT principles in policy design, accounting for diverse consumer adoption rates. The phased FiT implementation, scaling up solar PV deployment gradually between 2022 and 2050, aligns with consumer behavior patterns, ensuring optimal market penetration and cost-effectiveness.
To achieve net zero in Indonesia's energy sector by 2050, a massive deployment of utility-scale solar PV is required, however the current installment of utility-scale solar PV remains very low. Leapfrogging to achieve the 2050 target requires financially intensive supporting policies from the government. Nonetheless, the existing policies have been perceived to be unstable and unattractive by the solar PV industry. Given this context, there is a need to find a cost-effective way to grow the installed capacity of utility-scale solar PV in Indonesia, through supportive policies that result in fair cost distribution between government and industry, to ultimately attain the net-zero target by 2050. This study introduces a novel multiperiod non-linear Market Penetration Optimization Model (MPOM) applied to compare three different policy induced penetration pathways–linear, supply-based, and IDT-based–while accounting for the technology cost reduction due to learning effects. Subsequently, the model is deployed in two modes: first, a simulation mode that assesses existing policies, and second, an optimization that determines tariffs of an additional policy, the FiT.
The simulation outcomes indicate that within the current policy landscape, the government's financial support across all diffusion pathways covers a maximum of ~13% of the investment cost required by the industry to achieve the targeted installed capacity in 2050. This highlights the inadequacy of the government's existing price-based incentives. The reactivation of the FiT policy is recommended, given its historically proven influence on the growth of utility-scale solar PV capacity in Indonesia. To achieve win-win between industry and the government, optimization results reveal that required FiT span from 0.24 to 1.59 cents/kWh for the linear pathway, 1.07 to 2.57 cents/kWh for the supply-based pathway, and 0.39 to 1.47 cents/kWh for the IDT-based pathway during the first 10 years period after projects were constructed. In the subsequent period, FiT range from 0.63 to 1.16 cents/kWh for the linear pathway, 0.39 to 1.35 cents/kWh for the supply-based pathway, and 0.19 to 1.20 cents/kWh for the IDT-based pathway. Considering the total investment cost required from 2022 to 2050, the IDT-based pathway exhibits a comparative advantage. It shows decreases of 0.1, 3.1, and 17.4% concerning the less optimistic, moderate, and optimistic scenarios of the linear pathway, and decreases of 11.5, 25.3, and 47.1% for the less optimistic, moderate, and optimistic scenarios of the supply-based pathway. This leads to a lower total FiT budget for the IDT pathway, ranging from $39,621 million (optimistic scenario) to $168,460 million (less optimistic scenario), with a moderate value of $102.077 million. Regarding revenue generated from electricity sales, the IDT-based pathway also stands out, demonstrating increases of 3.5, 7, and 10.8% compared to the less optimistic, moderate, and optimistic scenarios of the linear pathway, and increases of 37.5, 33.8, and 28.4% for the less optimistic, moderate, and optimistic scenarios of the supply-based pathway. Overall, these trends underscore the cost-effectiveness superiority of the IDT-based pathway compared to the linear and supply-based. Considering the substantial historical influence of Feed-in Tariffs (FiT) on the expansion of utility-scale solar PV capacity in Indonesia, it is advisable to re-implement the FiT. Unlike the existing policies, which solely provide tax payment discounts as incentives, FiT can significantly promote market growth. To implement this, a phased approach involving the gradual scaling up of utility-scale solar PV deployment over time is recommended. This approach takes into consideration varying market penetration rates, with the highest market penetration of utility scale solar PV expected during the mid-period, specifically between 2031 and 2042.
The datasets presented in this study can be found in online repositories. The names of the repository/repositories and accession number(s) can be found in the article/supplementary material.
PS: Conceptualization, Data curation, Formal analysis, Investigation, Methodology, Resources, Visualization, Writing—original draft, Writing—review & editing. GO: Conceptualization, Investigation, Methodology, Project administration, Resources, Software, Supervision, Validation, Visualization, Writing—original draft.
The author(s) declare that no financial support was received for the research, authorship, and/or publication of this article.
The authors declare that the research was conducted in the absence of any commercial or financial relationships that could be construed as a potential conflict of interest.
All claims expressed in this article are solely those of the authors and do not necessarily represent those of their affiliated organizations, or those of the publisher, the editors and the reviewers. Any product that may be evaluated in this article, or claim that may be made by its manufacturer, is not guaranteed or endorsed by the publisher.
Abernathy, W., and Wayne, K. (1974). Limits of the Learning Curve. Brighton, MA: Harvard Business Review.
ADB (2020). Renewable Energy Tariffs and Incentives in Indonesia: Review and Recommendations. Manila: Asian Development Bank.
Anbumozhi, V., Bowen, A., and Jose, P. (2015). Market-Based Mechanisms to Promote Renewable Energy in Asia. Economic Research Institute for ASEAN and East Asia. Available online at: https://www.eria.org/ERIADP201530.pdf (accessed June 4, 2023).
Arifin, Z., Septiyanthy, R., Alkano, D., Jufri, F., and Sudiarto, B. (2021b). An optimum financing scheme for baseload thin-film and monocrystalline PV Plants in Indonesia. Int. J. Energy Econ. Pol. 2021:11387. doi: 10.32479/ijeep.11387
Arifin, Z., Setiawan, A., Adi, N., and Supriyono, E. (2021a). Solar levelized cost of energy projection in Indonesia. IEEE 9, 142–146. doi: 10.1109/ICT-PEP53949.2021.9600937
Bergek, A., and Berggren, C. (2014). The impact of environmental policy instruments on innovation: a review of energy and automotive industry studies. Ecol. Econ. 106, 112–123. doi: 10.1016/j.ecolecon.2014.07.016
EKONID (2022). In Decentralizing Energy in Indonesia, Future of Solar Power Remains Bright. Available online at: https://indonesien.ahk.de/en/infocenter/news/newsdetails/indecentralizingenergyinindonesiafutureofsolarpowerremainsbright#:~:text=Solar%20energy%20represents%20the%20highest,112%2C000%20GWp%2Fday%20in%20Indonesia (accessed June 25, 2023).
European Commission (2022). The EU and International Partners launch ground-breaking Just Energy Transition Partnership with Indonesia. Available online at: https://ec.europa.eu/commission/presscorner/detail/en/ip_22_6926 (accessed June 21, 2023).
Evans, S. (2021). Analysis: Which Countries Are Historically Responsible for Climate Change? Available online at: https://www.carbonbrief.org/analysiswhichcountriesarehistoricallyresponsibleforclimate-change/#:~:text=China%27s%20CO2%20output%20has%20more,%25)%20and%20Indonesia%20(4.1%25) (accessed July 12, 2023).
Government of Indonesia (2015). Peraturan Pemerintah Republik Indonesia No.18/2015 tentang Fasilitas Pajak Penghasilan untuk Penanaman Modal di Bidang-Bidang Usaha Tertentu dan/atau di Daerah-Daerah Tertentu [Republic of Indonesia Government Regulation No.18/2015 concerning Income Tax Facilities for Investment in Certain Business Fields and/or in Certain Regions].
Government of Indonesia (2022a). Enhanced Nationally Determined Contribution Republic of Indonesia. Jakarta: Government of Indonesia.
Government of Indonesia (2022b). Peraturan Presiden No. 112/2022 tentang Percepatan Pengembangan Energi Terbarukan untuk Penyediaan Tenaga Listrik [Presidential Regulation No. 112/2022 of the Acceleration of Renewable Energy Development for Electric Power Supply]. Jakarta: Government of Indonesia.
Grafström, J., and Poudineh, R. (2021). A Critical Assessment of Learning Curves for Solar and Wind Power Technologies. The Oxford Institute for Energy Studies. Available online at: https://a9w7k6q9.stackpathcdn.com/wpcms/wpcontent/uploads/2021/02/AcriticalassessmentoflearningcurvesforsolarandwindpowertechnologiesEL43.pdf (accessed August 5, 2023).
Grübler, A. (1996). Time for a change: on the patterns of diffusion of innovation. Daedalus 125, 19–42.
Halimatussadiah, A., Kurniawan, R., Mita, A., Siregar, A., Anky, W., and Maulia, H. (2023). The impact of fiscal incentives on the feasibility of solar photovoltaic and wind electricity generation projects: the case of Indonesia. J. Sustain. Dev. Energy Water Environ. Syst. 11:425. doi: 10.13044/j.sdewes.d10.0425
Hamdi, E. (2019). Indonesia's Solar Policies: Designed to Fail? Institute for Energy Economics and Financial Analysis. Available online at: https://ieefa.org/articles/ieefa-report-indonesias-solar-policies-designed-fail (accessed August 15 2023).
Handayani, K., Krozer, Y., and Filatova, T. (2019). From fossil fuels to renewables: an analysis of long-term scenarios considering technological learning. Energy Policy 127, 134–146. doi: 10.1016/j.enpol.2018.11.045
Heffron, R. J., Körner, M. F., Sumarno, T., Wagner, J., Weibelzahl, M., and Fridgen, G. (2022). How different electricity pricing systems affect the energy trilemma: assessing Indonesia's electricity market transition. Energy Econ. 107:105663. doi: 10.1016/j.eneco.2021.105663
IEA (2020). Capital Costs of Utility-Scale Solar PV in Selected Emerging Economies. Available online at: https://www.iea.org/dataandstatistics/charts/capitalcostsofutilityscalesolarpvinselectedemergingeconomies (accessed May 12, 2023).
IESR (2019). Levelized Cost of Electricity in Indonesia: Understanding The Levelized Cost of Electricity Generation. Jakarta: Insitute for Essential Services Reform (IESR).
Kadang, J., and Windarta, J. (2021). Optimasi Sosial-Ekonomi pada Pemanfaatan PLTS PV untuk Energi Berkelanjutan di Indonesia [Socio-Economic Optimization of the Use of PLTS PV for Sustainable Energy in Indonesia]. Jurnal Energi Baru Dan Terbarukan [New and Renewable Energy Jurnal]. 2:11113. doi: 10.14710/jebt.2021.11113
LaMorte, W. (2022). Diffusion of Innovation Theory. Available online at: https://sphweb.bumc.bu.edu/otlt/mphmodules/sb/behavioralchangetheories/behavioralchangetheories4.html (accessed April 28, 2023).
Lathifa, D. (2022). Bayar Bea Cukai: Ini Tarif dan Tutorial Pembayarannya di OnlinePajak [Pay Customs: These are the Tariffs and Payment Tutorials on OnlinePajak]. Available online at: https://www.onlinepajak.com/tentangpajakpay/bayarbeacukai#:~:text=Biaya%20dan%20Tarif%20Bea%20Cukai&text=Berdasarkan%20peraturan%20di%20atas%2C%20maka,5%25%20dan%20PPN%2011%25 (accessed April 28, 2023).
Maulida, R. (2023). Cara Mudah dalam Menghitung Pajak Pertambahan Nilai (PPN). [The Easy Way to Calculate Value Added Tax]. Available online at: https://www.onlinepajak.com/tentangppnefaktur/caramenghitungppn#:~:text=PPN%20merupakan%20pajak%20yang%20dikenakan,11%25%20x%20DPP (accessed April 28, 2023).
Meldrum, M., Pinnell, L., Brennan, K., Romani, M., Sharpe, S., and Lenton, T. (2023). The Breakthrough Effect: How to Trigger a Cascade of Tipping Points to Accelerate the Net Zero Transition, Systemiq. United Kingdom. Available online at: https://www.systemiq.earth/wpcontent/uploads/2023/01/TheBreakthroughEffect.pdf (accessed August 15, 2023).
MEMR (2023). Handbook of Energy & Economic Statistics of Indonesia 2022. Jakarta: Ministry of Energy and Mineral Resources.
Ministry of Finance (2010). Peraturan Menteri Keuangan Nomor 21/PMK.011/2010 tentang Pemberian Fasilitas Perpajakan dan Kapabeanan untuk Kegiatan Pemanfaatan Sumber Energi Terbarukan [Ministry of Finance Regulation No. 21/PMK.011/2010 concerning Providing Tax and Customs Facilities for Activities Utilizing Renewable Energy Sources]. Indonesia: Minister of Finance.
Ministry of Finance (2018). Kajian Analisis Dampak Insentif Fiskal terhadap Investasi dan Harga Jual Listrik dari Energi Terbarukan [Study of Analysis of the Impact of Fiscal Incentives on Investment and Selling Prices of Electricity from Renewable Energy]. Indonesia: Ministry of Finance.
Oluleye, G., Gandiglio, M., Santarelli, M., and Hawkes, A. (2021). Pathways to commercialisation of biogas fuelled solid oxide fuel cells in European wastewater treatment plants. Appl. Energy 282:116127. doi: 10.1016/j.apenergy.2020.116127
Online Pajak [Online Tax] (2023). Ketahui Perbedaan PPN dan PPh 22 Impor, di Sini! [Know the Difference between VAT and PPh 22 Import, Here!]. Available online at: https://www.onlinepajak.com/tentangppnefaktur/ppndanpph22impor#:~:text=Sedangkan%20PPh%2022%20impor%20merupakan,impor%20maupun%20dari%20harga%20lelang (accessed July 4, 2023).
Paiboonsin, P. (2022). Pathways to Clean Energy Transition in Indonesia's Electricity Sector With OSeMOSYS Modelling (Open-Source Energy Modelling System). London: Imperial College London.
Riguzzi, F., Gavanelli, M., Milano, M., and Cagnoli, P. (2012). “Constraint and optimization techniques for supporting policy making,” in International Symposium on Artificial Intelligence and Mathematics. Available online at: https://api.semanticscholar.org/CorpusID:5936393 (accessed June 12, 2023).
Sambodo, M. T., Yuliana, C. I., Hidayat, S., Novandra, R., Handoyo, F. W., Farandy, A. R., et al. (2022). Breaking barriers to low-carbon development in Indonesia: deployment of renewable energy. Heliyon 8:e09304. doi: 10.1016/j.heliyon.2022.e09304
Silalahi, D. F., and Gunawan, D. (2022). “Solar energy potentials and opportunity of floating solar PV in Indonesia,” in Indonesia Post-Pandemic Outlook: Strategy Towards Net-Zero Emissions by 2060 From the Renewables and Carbon-Neutral Energy Perspectives.
Suharsono, A. (2020). Achieving Low Solar Energy Price in Indonesia: Lessons learned from the Gulf Cooperation Council Region and India. International Institute for Sustainable Development. Available online at: https://www.iisd.org/system/files/publications/low-solar-energy-price-indonesia.pdf (accessed August 2, 2023).
Suharsono, A., Hendriwardani, M., Sumarno, T., Kuehl, J., Maulidia, M., and Sanchez, L. (2022). Indonesia's Energy Support Measures: An Inventory of Incentives Impacting the Energy Transition. Available online at: https://www.iisd.org/system/files/2022-06/indonesia-energy-support-measures.pdf (accessed August 15, 2023).
Tenggara Strategies (2022). Analysis: Jokowi Issues Renewable Energy Regulation With Unattractive Pricing Scheme. The Jakarta Post. Available online at: https://www.thejakartapost.com/opinion/2022/09/28/analysisjokowiissuesrenewableenergyregulationwithunattractivepricingscheme.html (accessed May 1, 2023).
Tezer, T., Yaman, R., and Yaman, G. (2017). Evaluation of approaches used for optimization of stand-alone hybrid renewable energy systems. Renew. Sustain. Energy Rev. 73, 840–853. doi: 10.1016/j.rser.2017.01.118
Umah, A. (2021). RI Dorong PLTS, Tapi Barangnya Masih Banyak Impor! [Republic of Indonesia pushes Solar Power Plants, but the Most of the Materials are Imported!]. CNBC Indonesia. Available online at: https://www.cnbcindonesia.com/news/202110111641554283052/ridorongpltstapibarangnyamasihbanyakimpor (accessed August 29, 2023).
UN (2015). Paris Agreement. United Nations. Available online at: https://unfccc.int/process-and-meetings/the-paris-agreement#:~:text=The%20Paris%20Agreement%20is%20a%20legally%20binding%20international,It%20entered%20into%20force%20on%204%20November%202016 (accessed May 3, 2023).
Veldhuis, A. J., and Reinders, A. H. M. E. (2013). Reviewing the potential and cost-effectiveness of grid-connected solar PV in Indonesia on a provincial level. Renew. Sustain. Energy Rev. 27, 315–324. 10.1016/j.rser.2013.06.010. doi: 10.1016/j.rser.2013.06.010
Wiesenthal, T., Dowling, P., Morbee, J., Thiel, C., Schade, B., Russ, P., et al. (2012). Technology Learning Curves for Energy Policy Support. JRC Scientific and Policy Reports (Issue July 2020).
Workman, D. (2023). Coal Exports by Country. Available online at: https://www.worldstopexports.com/coalexportscountry/ (accessed August 30, 2023).
ADB, Asian Development Bank; CAPEX, Capital Expenditure; EKONID, Perkumpulan Ekonomi Indonesia Jerman (German Indonesian Economic Association); FiT, Feed-in-Tariff; GW, Gigawatt; IDT, Innovation-Diffusion Theory; IEA, International Energy Agency; IESR, Institute for Essential Services Reform; IRENA, International Renewable Energy Agency; kWh, Kilowatt hour; LCOE, Levelized Cost of Electricity; M, Million; MEMR, Ministry of Energy and Mineral Resources; MPOM, Market Penetration Optimization Model; MW, Megawatt; NDC, Nationally Determined Contribution; PLN, Perusahaan Listrik Negara (State Electricity Company); PV, Photovoltaic; RE, Renewable Energy; UN, United Nations; VAT, Value Added Tax.
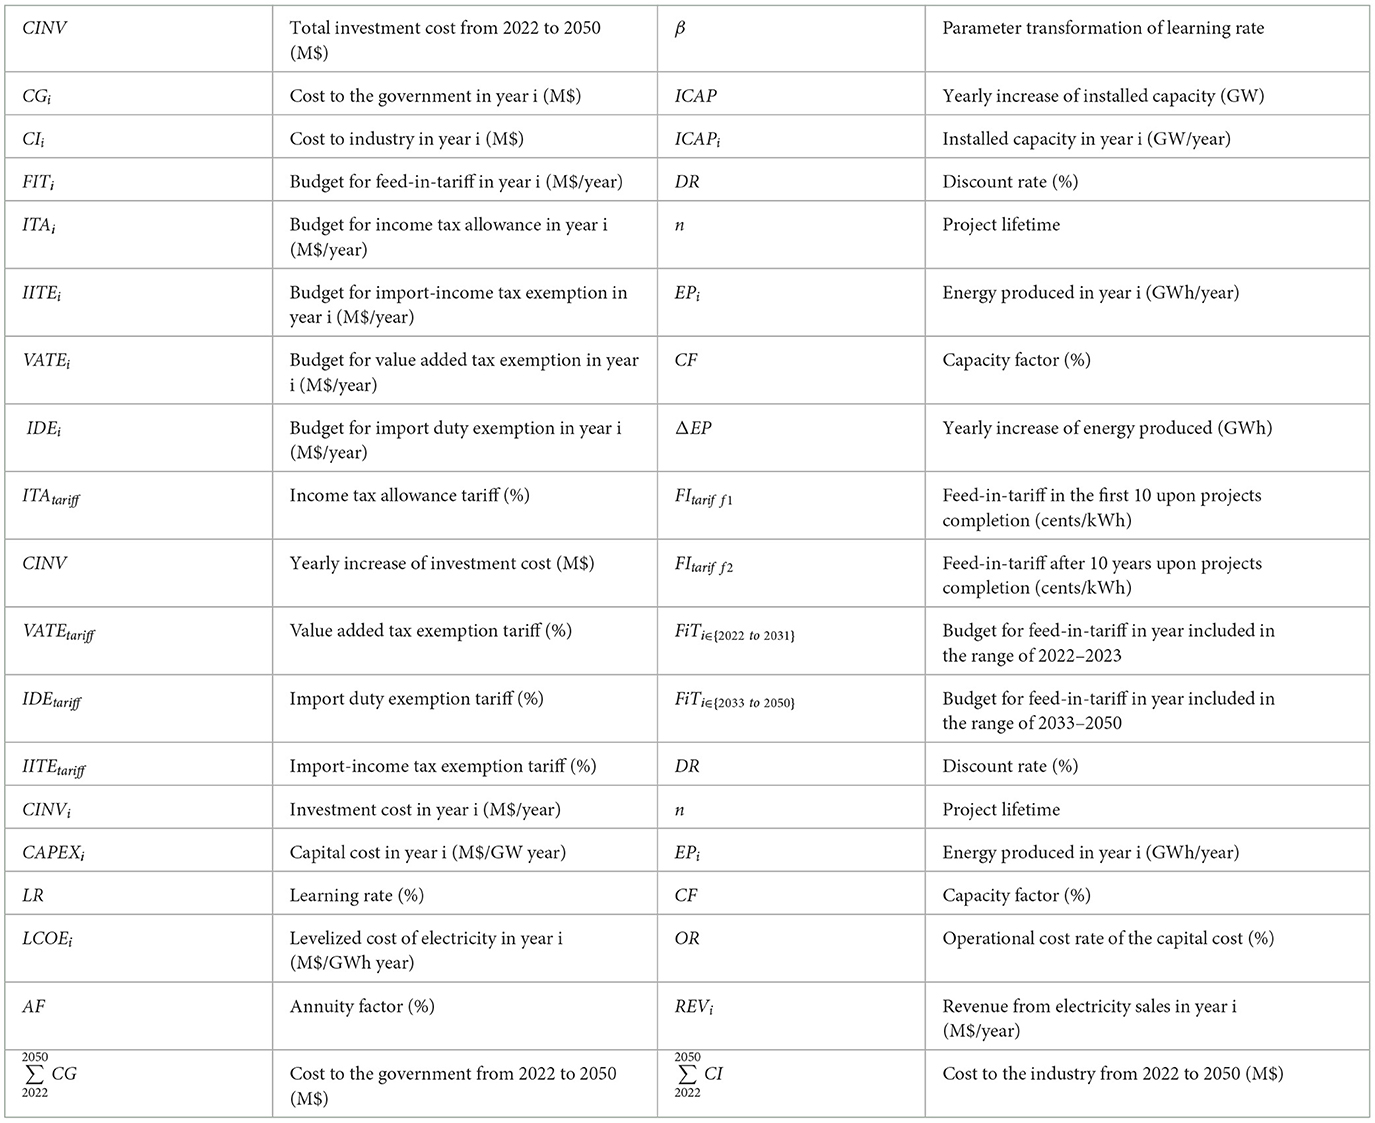
Table A1.
Keywords: utility scale solar PV, Indonesia energy policy, Feed-in Tariff, innovation-diffusion theory, market penetration optimization, clean technology uptake modeling
Citation: Syafina P and Oluleye G (2024) A comparative assessment of policy induced diffusion pathways for utility scale solar PV: case study of Indonesia. Front. Sustain. Energy Policy 3:1308441. doi: 10.3389/fsuep.2024.1308441
Received: 06 October 2023; Accepted: 12 April 2024;
Published: 02 May 2024.
Edited by:
Liang Li, Nanjing University of Information Science and Technology, ChinaReviewed by:
Gibbson Adu-Gyamfi, Nanjing University of Science and Technology, ChinaCopyright © 2024 Syafina and Oluleye. This is an open-access article distributed under the terms of the Creative Commons Attribution License (CC BY). The use, distribution or reproduction in other forums is permitted, provided the original author(s) and the copyright owner(s) are credited and that the original publication in this journal is cited, in accordance with accepted academic practice. No use, distribution or reproduction is permitted which does not comply with these terms.
*Correspondence: Gbemi Oluleye, by5vbHVsZXllQGltcGVyaWFsLmFjLnVr
Disclaimer: All claims expressed in this article are solely those of the authors and do not necessarily represent those of their affiliated organizations, or those of the publisher, the editors and the reviewers. Any product that may be evaluated in this article or claim that may be made by its manufacturer is not guaranteed or endorsed by the publisher.
Research integrity at Frontiers
Learn more about the work of our research integrity team to safeguard the quality of each article we publish.