 Anna Fache
 Mahadev G. Bhat
- Department of Earth and Environment, Florida International University, Miami, FL, United States
The demand for electricity is soaring, propelled not only by population and GDP growth but also the pressing effects of climate change. This study seeks to address the uncertainties surrounding future electricity demand by projecting monthly consumption in Florida, USA, taking into account diverse climate scenarios and their potential impacts. Our approach involves utilizing the degree-day method and constructing an energy consumption regression model grounded in historical data. Key variables, including population, employment, GDP, electricity prices, temperature, and daylight hours, are systematically analyzed. This model acts as the fundamental basis for forecasting future electricity needs in residential, commercial, and industrial sectors across the state of Florida up to the year 2050, considering different climate scenarios. Under the Representative Concentration Pathway (RCP) 4.5 scenario, the residential sector foresees a substantial 63% increase in electricity demand from 2001–2019 to 2050. Under the more extreme RCP 8.5 scenario, this surge climbs to 65%. Meanwhile, the commercial and industrial sectors are expected to witness a 47% and 54% upswing in demand under RCP 4.5 and RCP 8.5, respectively. Intriguingly, heightened demand for cooling during scorching summers outweighs the reduced need for heating in winter, particularly in the residential sector. The current renewable energy policies fall short of addressing the impending climate-driven surge in electricity demand. To combat this, our recommendation is the implementation of a Renewable Portfolio Standard, aimed at significantly enhancing the proportion of renewables in Florida's electricity mix. This paper concludes with a set of crucial policy recommendations, imperative for steering a sustainable transition to renewable energy and effectively managing the impacts of extreme heat on people's lives. These recommendations serve as a strategic roadmap for navigating the evolving landscape of electricity demand amidst the complex challenges posed by climate change.
1 Introduction
With economic growth, regional and national electricity demands have significantly increased (Ferguson et al., 2000) over the last several decades around the globe, especially with fossil fuels (Hasanuzzaman et al., 2017). Major driving factors contributing to these increases include rising populations, economic growth, and improvements of standard of living. An analysis in the Guangzhou region in China found that for a 20% increase in population, the energy consumption would increase by 43.6%. For the same decrease in population, the decrease in electricity consumption would be of 44.6% (Huang et al., 2018).
One of the drivers of energy consumption, which has not received much attention in the energy and climate literature, is the rising in global and regional temperatures. Recent studies (Amato et al., 2005; Ruth and Lin, 2006; Mukherjee and Nateghi, 2017) have begun to recognize that historical regional energy demands had been temperature sensitive. In fact, changing climate and temperatures are shown to have multiple impacts on the energy sector, from a structural change in the demand, to significant changes in the energy supply, infrastructure, and distribution (Schaeffer et al., 2012). Furthermore, even within each energy segment, the degree and nature of climate impacts vary across different energy sources, distribution modes and demand sectors, with either positive or negative effects (Ciscar and Dowling, 2014). Additionally, on a global scale, increases in temperatures will first reduce the need for heating, and therefore, reduce energy demand by 2050, but then will promote heavy use of cooling equipment and overall increase in energy consumption after 2100 (Van Ruijven et al., 2019).
The changes in electricity demand patterns coupled with the limited nature of fossil fuels create a pressing need for a restructuring of the electricity sector. The majority of studies agree that a decarbonized electricity plan needs to be implemented in order to reduce climate change (Sisternes et al., 2016). A least cost optimization model was used to determine that the US could partially decarbonize at a modest cost, but that a full decarbonization would require significant funding (Jayadev et al., 2020). This decarbonization would be led by solar and wind technologies, which would represent at least 40% of the electricity mix by 2050. Breaking down the types of energies utilized and where they come from is important to adapt the sector to climate change (Schaeffer et al., 2012). The main energy resource used in Florida for electricity production in 2021 was natural gas, representing around 74% of the mix. Other sources for electricity production included coal, nuclear power, solar and biomass (EIA, 2023). The residential sector represented 54% of the total electricity demand, which is considered one of the highest shares in the country (EIA, 2023). Sectors with higher electrification rates will have an easier time to transition to renewable energies, while sectors like the industrial sector, which use fossil fuels for higher shares of their energy needs will have to find new ways to integrate cleaner energies. The impacts of future climate change could vary across the consumption sectors depending on the type of energy that they use (Schaeffer et al., 2012).
Previous studies also find that the temperature sensitivity of energy demand varies widely between the regional and seasonal energy requirements relative to their respective temperature levels. For instance, for the residential and commercial sectors the main demand for energy is for heating and cooling purposes. A couple of studies have looked at the changes in energy in the residential and commercial sectors through the use of heating degree days (HDD) and cooling degree days (CDD). For instance, the future residential energy demand in Maryland would be close to the average demand from 1977 to 2000 despite other positive drivers of energy demand (Ruth and Lin, 2006). For the commercial sectors, it was determined that only 10% of the increase in demand was linked to climate change, the rest being increases related to economic growth. On the other hand, in the case of the state of Massachusetts, it was found that under the climate change scenario, there was a 2.1% increase in electricity demand in 2020 compared to the non- climate change scenario (Amato et al., 2005). The natural gas demand was expected to increase at a slower rate under the climate change scenario than the non-climate change scenario.
A recent study analyzed Florida's electricity consumption climate sensitivity by looking at parameters such as degree days, dew point, wind speed, precipitation and cost of electricity (Mukherjee and Nateghi, 2017). It was found that mean dew point was more suitable to predict future electricity consumption compared to degree days. In addition, wind speed and precipitation were found to have significant impact on consumption. Last, it was determined that the residential sector is more sensible to variations in weather than the commercial sector. This study only considered two sectors, residential and commercial, which can be limiting, as other sectors such as industrial will be needing additional inputs of electricity, for example to cool down equipment to maintain efficiency. In another study (Elkamel et al., 2020), Florida electricity consumption was estimated through a multifaceted approach, entailing a traditional regression model and Convolutional Neural Networks (CNNs). The purpose of this study was primarily to develop a best possible predictive model without going into actual future electricity forecast under alternative climate scenarios nor exploring policy implications of climate-related energy demand. This paper departs from the above studies in that we are interested in the impacts of alternative future climate scenarios, measured in terms of degree days, and of other causal variables like energy prices and demographic factors. Additionally, the our study explores future energy policies necessary to cope with the climate-driven electricity demand. The policy recommendations we provide should empower decision-makers with actionable insights, fostering informed choices for energy planning and infrastructure modernization. By amalgamating robust data analysis with policy foresight, our study aspires to contribute significantly to the formulation of forward-thinking strategies that will shape the future of energy consumption and sustainability.
2 Problem description and research objective
Florida is a particularly interesting state because of its unique climate sensitivity (Mukherjee and Nateghi, 2017): climate change is expected not only to have a significant impact on future temperatures, but also promote more extreme weather events. Florida is a heterogeneous state with respect to temperatures: the north faces much lower temperatures than the south, a difference that impacts the type of conditioning used. Additionally, electricity demand is expected to increase not only due to warmer temperatures, but also due to increases in population, which will have cascading effects on employment and GDP. Finally, it is important to note that Florida ranks among the states with the lowest proportion of renewable energy sources in its energy portfolio, and the government's stance on supporting the transition to renewable energy has been somewhat inconsistent.
Depending on the size of its increase, future electricity demand may put intense pressure on the electricity cost, and the ability of the region to align the energy supply with the demand. To effectively address this challenge, policymakers require accurate projections and insights into future energy demand trends (Elkamel et al., 2020). These projections are essential for making informed decisions about regional energy planning and the development of renewable energy infrastructure.
The primary objectives of this research are to assess how the future climate change will influence the electricity demand and to evaluate if the current energy policies in place are adequate to meet the future energy demand in a sustainable fashion. We achieve these goals by first estimating future electricity demand until 2050 for the state of Florida for residential, commercial and industrial sectors under three scenarios: Stable Climate, and two future climate scenarios, which are otherwise known as Representative Concentration Pathway (RCP). These RCPs are useful to demonstrate how climate changes will play out under different scenarios of actions (more or less) taken to reduce the human environmental impacts. RCP 4.5 is considered to be an average impact scenario, while RCP 8.5 is viewed as an extreme scenario. The future electricity consumptions for the residential and commercial and industrial sectors are estimated based on the various temperature scenarios under the above RCPs. Applying multiple scenarios is necessary given the uncertainties associated with the future climate change. Using a regression analysis, we explore various climate as well as non-climate-related factors that drive energy demand in Florida for the two sectors chosen for the study. This research aims to offer insights that will enable policymakers to assess the necessary policy measures required to ensure a future characterized by accessible and affordable electricity from clean sources. Understanding projected future energy demand enables efficient allocation of funds toward the development of renewable energy infrastructure. This not only contributes to the reduction of greenhouse gas emissions but also enhances energy security, aligning particularly with the United Nations Sustainable Developmen Goal #7 which aims to ensure that populations can access clean and affordable energy.
This study also analyzes any existing energy policies in Florida and determines if they promote or slow down the state's ability to adapt to climate change. The above analysis will help us determine which areas of the electricity sector need to be targeted to promote an energy transition. For example, if electricity cost is a significant driver of electricity consumption, economic incentives may be necessary to be given out to utilities that produce more renewable energies, and in turn, to consumers who may otherwise experience higher economic burdens of electricity price increase and climate-driven electricity demand increase. If temperature is the biggest driver, more efficient measures can be developed, like the installation of energy efficient appliances which will reduce energy demand, coupled with promoting renewable energy integration, which will reduce greenhouse gas emissions and slow down climate change.
The rest of the paper is organized as follows. In the next section, we discuss the Materials and Methods adopted in this study, including historical data, the conceptual model linking historical monthly temperature, cooling and heat degree days and other factors with the monthly electricity demand for residential and industrial/commercial sectors, and the models for future predictions of temperature and other variables. In Section 3, we describe the Results of our analysis on historical and future predictive climate-driven electricity demand. Section 4, Discussion, is devoted to analyzing how future climate and socio-economic variables will influence the electricity demand and what implications they will have for renewable energy policies in Florida. The Conclusion section summarizes our findings and develops policy recommendations.
3 Materials and methods
3.1 Historic data
To project future electricity demand under the influence of climate, demographic and market factors, historical data was used to create a climate sensitivity model. Following (Amato et al., 2005; Ruth and Lin, 2006) we used monthly electricity demand and degree day data. Monthly demand data series provides more data points and captures the seasonal variability in energy consumption better than the annual time-series. The degree day establishes a balance point temperature above which consumers will need air conditioning, or below which heating will be needed. Mukherjee and Nateghi (Mukherjee and Nateghi, 2017) noted that the model based on dew point temperature was better than the one on degree day. Because of the limitations on the future data availability needed for dew point temperature, we chose the degree day approach. Electricity consumption data for the state of Florida was obtained through the EIA (EIA, 2023). For this study, we considered three demographic drivers influencing electricity consumption, namely, total Florida population, employment, and gross domestic product (GDP) (U. S. Census Bureau, 2001; Bureau of Economic Analysis, 2023; US Bureau of Labor Statistics, 2023).
3.1.1 Energy data
We focused on the residential sector and the combination of industrial and commercial sectors. The same data source provides the price of electricity for different sectors in cents per kWh. For the commercial and industrial sectors, their electricity prices were averaged. The data was collected from January 1990 until December 2020 monthly.
Figure 1 shows the average historical monthly sales for residential and commercial and industrial sectors. The two sectors have similar trends where demand for electricity increases during the summer months, due to a higher need for cooling. It is worth noticing that the residential sector demand increases at a higher rate in the summer than the industrial sector demand. This reflects a strong association between the rising temperature and the cooling energy need particularly in summer months.
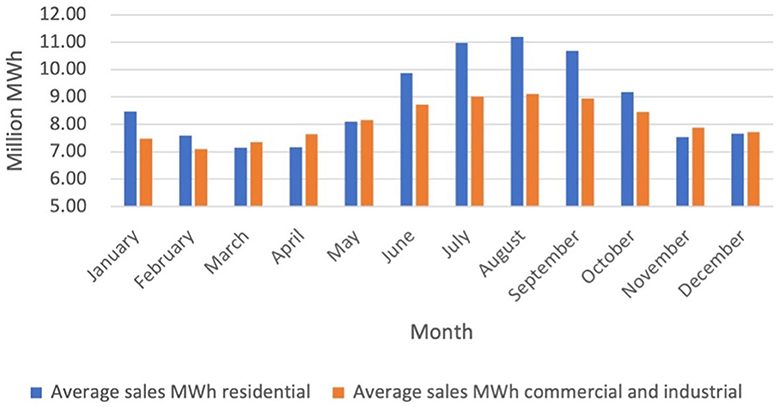
Figure 1. Monthly average electricity consumption in Florida, 1990–2020 (Source: EIA).
Over the years, electricity consumption has been increasing steadily from a combined total for residential, industrial, and commercial sectors of 139 million MWh in 1990 to 238 million MWh in 2020, a 71% increase (Figure 2). This increase can be attributed to different factors, such as changes in population, employment, and changes in weather. During periods of high temperatures, more cooling will be needed by the residential sector (Mukherjee and Nateghi, 2017). Depending on the nature of business, some commercial and industrial sectors will need to also increase their electricity consumption for cooling of machinery. The residential sector has a higher demand for electricity than the commercial and industrial sectors.
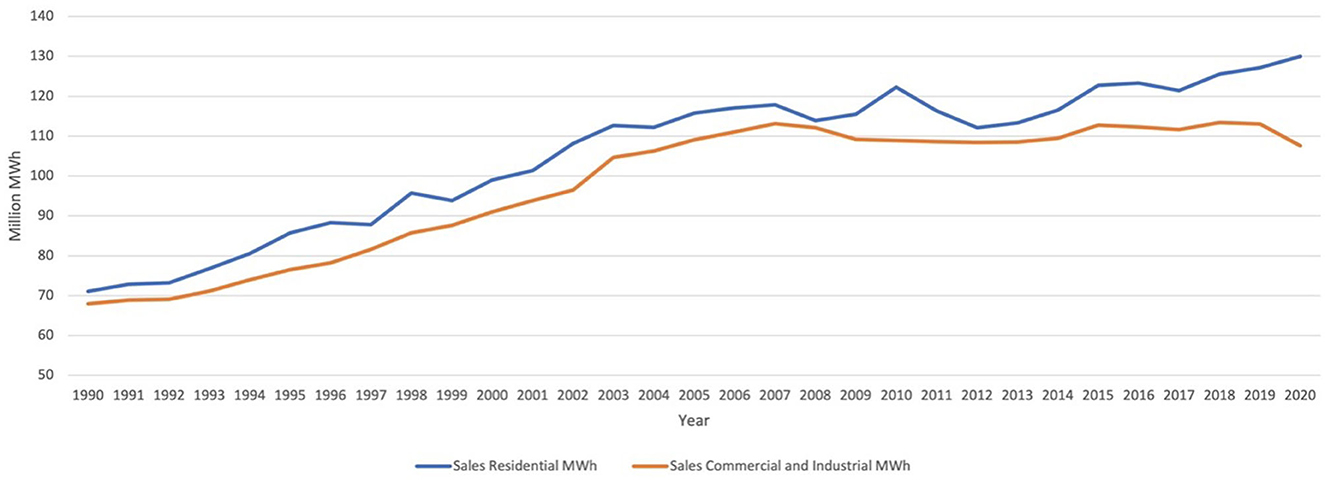
Figure 2. Historical electricity consumption in Florida, 1990–2020 (Source: EIA).
3.1.2 Climate data
Temperature data was obtained from the Florida Climate Center (Florida Climate Center, 2023) for the period of 1997 to 2020. Daylight hours were also obtained for the period of 2001 to 2020 (Time and Date, 2023) for Jacksonville, Ocala, Ft Myers, Miami, and Panama City to average for the state.
Degree days were first calculated by subtracting 69.98 degrees from the average temperature for the residential sector and by subtracting 64.98 degrees from the average temperature for the commercial and industrial sector. To get the monthly degree days, the daily degree days were multiplied by the number of days in each month for the period of interest. If the monthly degree day value was negative, it would mean that consumers need to turn on the heating since the average temperature was lower than the balance points of 69.98°F or 64.98°F (Figure 3). This would give a positive value to the heating degree days. On the other hand, if the monthly degree day value was positive, it means that consumers would turn the cooling on as the temperature is higher than the balance point. This would translate into cooling degree days.
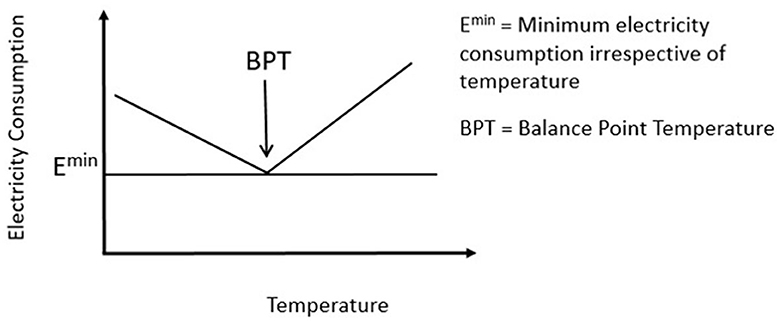
Figure 3. Theoretical relationship between temperature and energy use (modified from Amato et al., 2005).
Daylight hours are important because the longer the day, the less lighting people will need. However, longer day light hours tend to be correlated with temperature, which in turn affects electricity use (Amato et al., 2005). For parts of southern Florida that is more densely populated, the day light hours are generally longer than northern parts of the state. Longer day light hours increase electricity needs for cooling during the daytime and decreases lighting electricity needs and results in almost no heating electricity needs in the evening times. This is almost a mirror image of shorter day light hours that we normally see in the northern states. Having daylight hour in the regression model serves as a control that minimizes bias in the econometric estimates of energy consumption sensitivity to temperature variable (e.g., HDD and CDD) (Amato et al., 2005).
3.2 Data projections
The second stage of our analysis involved projecting future electricity sales for the residential and commercial and industrial sectors for Florida. We need to have future projections of various climate and economic predictor variables. The price of electricity was kept constant for future projections by using average monthly prices from 2015 to 2020. The average monthly price in cents per kWh varied from 10.17 cents/kWh for the month of May to 10.73 for February for residential sector, and 8.11 in May to 8.f in February for commercial/industrial sector.
The temperature projections estimated from Bayissa et al. (2021) were used to compute HDD, CDD and daylight hours. The temperature projections were available for RCP 4.5 and RCP 8.5 in monthly intervals until 2050 and computed using Regional Climate Models (RCM) driven by Global Circulation Models (GCM). They adapted four RCMs (CanRCM4, CRCM5-UQAM, RCA4, and HIRHAM5) based on three GCMs (CanESM2, EC-EARTH, and MPI-ESM-LR). We further estimated the daylight hours using their temperature data for the future and a regression model that we estimated using the Florida historical data. For brevity, we present historic and future estimated temperature trajectories for a winter month (January) and a summer month (July) in Figures 4, 5. The above regional climate models also provided temperature estimates for historical period. We did see a slight discrepancy between the model estimated historical monthly temperature and the observed temperatures reported by the Florida Climate Center. Therefore, we applied these monthly temperature differences to the model predicting future temperature under RCP 4.5 and RCP 8.5 as well.
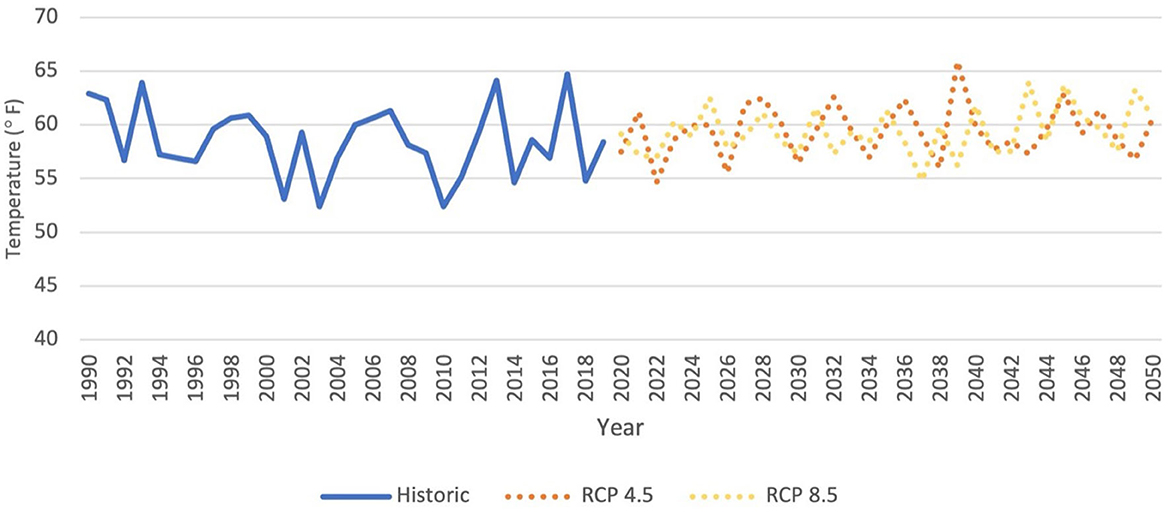
Figure 4. Historic average January temperatures and temperature projections for RCP 4.5 and RCP 8.5.
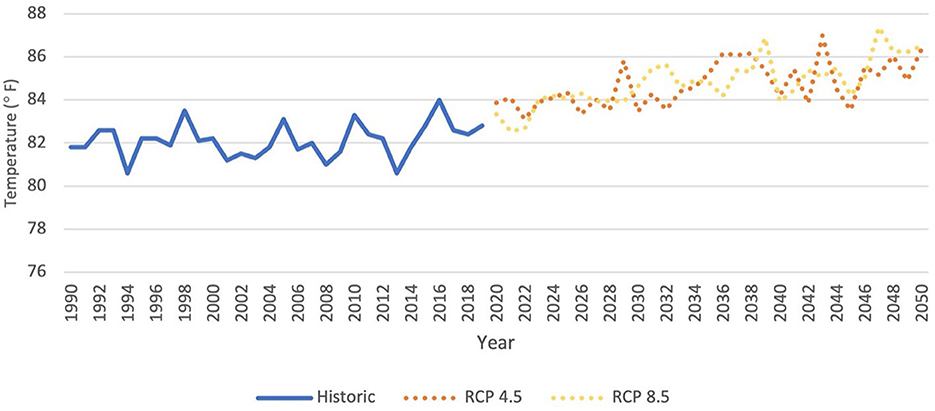
Figure 5. Historic average July temperatures and temperature projections for RCP 4.5 and RCP 8.5.
Once the temperatures were gathered, the HDD and CDD values for the two sectors under each scenario were calculated in the same manner as they were for the historical baseline. As indicated before, historical daylight hours and temperature were closely related. Therefore, future daylight hours under alternative scenarios were projected using a simple regression model of past daylight hours over past monthly temperature. The estimated equation of daylight hours is as follows.
where DL is the average daily daylight hours for the current month, TEMP is the average temperature for the current month and LAGTEMP is the average temperature for the previous month. The numbers in the parentheses are the standard errors of the model parameter estimates.
Annual CDD is expected to increase by 41% for the residential sector under RCP 4.5 when comparing the historic baseline to 2050, and by 52% under the RCP 8.5 scenario. HDD will decrease by 7% under the RCP 4.5 scenario and by 50% under the 8.5 scenario. For the commercial and industrial sector, CDD will increase by 27% under RCP 4.5 and by 40% under the RCP 8.5 scenario. HDD will decrease 13% under RCP 4.5 and by 69% under RCP 8.5.
Next, the GDP per employee and per capita were estimated by forecasting future GDP, population, and employment using simple linear trends. The forecast values steadily increased throughout the study period. The use of forecast values of the above three variables will allow us to control for the impacts of those variables on future electricity consumption in our model.
3.3 Empirical model
Electricity demand was assumed to be a function of not only climate variables but also a host of socio-economic factors, particularly income and energy prices. We also assumed a significant difference in the temperature-energy consumption relationship between residential sector and commercial sector (Sailor, 2001). Formally, the empirical model of climate-induced electricity consumption is expressed as,
where i represents consumption sector (residential, commercial, and industrial), E is the monthly electricity sales; HDD is the monthly Heating Degree Days; CDD is monthly Cooling Degree Days; DL is the Daylight hours; PEi is the Price of Electricity for each sector and GDP refers to the Gross Domestic Product per capita for the residential sector and GDP per employee for the commercial and industrial sector, and lastly, ϵi is the error. Note that the dependent variable, ln[Ei] represents the monthly electricity sales per capita or per employee in natural log form. Similarly, the per capita or per employee income variable is expressed in natural log form.
Our empirical model serves as a robust tool for projecting future electricity data across the residential, commercial, and industrial sectors spanning the timeframe from 2020 to 2050. Leveraging the comprehensive data projections detailed in Section 3.2 as essential inputs, our model derives its predictive power from the coefficients elucidated in Section 4.1. These coefficients, grounded in rigorous analysis, facilitate the projection of electricity demand in the coming decades. In order to use our estimated model for future use, the user has to first project the future values of the model input variables, including monthly average temperature under appropriate climate scenario of interest, population, employment, GDP, and electricity prices. Using the average monthly temperature, HDD and CDD variables used in the model will have to be computed. Utilizing the future estimated temperature and Daylight Hour-Temperature equation in (1), one can estimate the future Daylight Hours variable necessary for the electricity forecast model.
With the data on future projections of the model variables, users can then apply them to project future electricity demand for the desired years. This process allows for tailored and climate-specific projections, enabling stakeholders and policymakers to assess the energy landscape and make informed decisions aligned with the specific conditions and dynamics of the point in the future. In essence, our model serves as a versatile template, adaptable to a wide range of geographical contexts and climate and economic senarios, and empowers users to gain valuable insights into future electricity demand trends.
3.4 Scenarios
3.4.1 Stable climate scenario
The stable climate scenario is the business-as-usual situation for comparison purposes. The average temperatures and daylight hours over the period of 2015–2020 are used for the future years and kept constant for each year until 2050. The future values of other variables such as GDP, population, employment, and electricity prices were held at their future projected levels as described in the previous sections and kept the same across all model scenarios.
3.4.2 RCP 4.5
This scenario uses future monthly temperatures projected for the state of Florida under the RCP 4.5 scenario (Bayissa et al., 2021; Chanda, 2021). The RCP 4.5 is an intermediate GHG emission scenario with radiative forces of 4.5 W m−2. Compared to 1850–1900, temperatures are expected to increase between 1.1 and 2.6°C by the end of the 21st century (International Panel on Climate Change, 2015). This scenario represents a medium effort to reduce greenhouse gas emissions. The daylight hours are projected using a statistically significant regression model of day light hour as a function of current and lag temperature variables, with an adjusted R2 of 0.81. Both the coefficients of temperature and lag of temperature were significant at 1%.
3.4.3 RCP 8.5
This scenario uses the projected future Florida temperatures under the RCP 8.5 scenario. The RCP 8.5 is a high GHG emission scenario with radiative forces of 8.5 W m−2. Compared to 1850–1900, temperatures are expected to increase between 2.6 and 4.8°C by the end of the 21st century (International Panel on Climate Change, 2015). This scenario represents a low effort to reduce greenhouse gas emissions. It is considered an extreme scenario of climate change and adaptation.
4 Results
4.1 Model results
The coefficients derived from the regression analysis represent the percentage change in electricity consumption in response to a percent increase in predictor variables, with the exception of the price and income variables. The coefficient of log of price represents the percent change in electricity consumption resulting from a percent change in price. The CDD and HDD parameter coefficients show the percent change in electricity consumption associated with absolute changes in degree days. The daylight hours coefficient measures the percent changes in electricity consumption resulting from one more hour of daylight. Last, the coefficient of GDP per capita or per employee shows the percent change in electricity consumption due to a percent change in per capita or per employee income.
4.1.1 Residential sector
The results of the residential sector model are presented in Table 1. Because of longitudinal data, the model was corrected for autocorrelation using the Durbin Watson method (D-W Rho = 0.37). The adjusted R2 value of 0.76 suggests a high goodness of fit. A balance point temperature of 69.98°F was used for the HDD and CDD analysis.
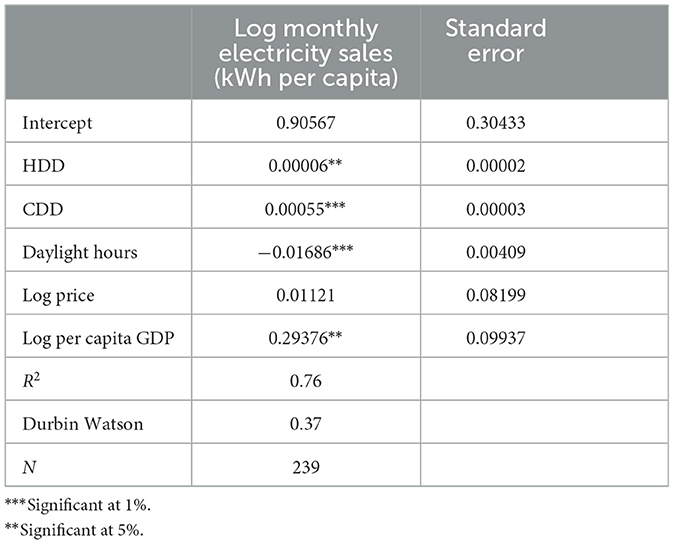
Table 1. Regression results for Florida residential sector.
The intercept shows the changes in electricity demand for the residential sector per capita per month that are not related to temperature changes. The model shows four variables that are statistically significant at 5% or at 1%. The log of price shows a negative relationship with electricity consumption, which can be explained by consumers being aware of the cost of electricity, and when that cost is high, people will consume less electricity. However, the log of price did not emerge to be significant. The residential electricity demand shows a significant relationship with CDD at 1% level: with a 100-unit increase in CDD, there is a 5.5% increase in monthly electricity sales, which can be justified by consumers wanting to cool down their residence due to higher temperatures. The residential electricity demand shows a significance of 5% with HDD: the increase in electricity sales when temperature drops is still significant, but not as important as the previous relationship. This relative difference in the impact of CDD and HDD on electricity sales has an interesting implication for our study region. Parts of Florida (especially northern part of the state) could see a reduction in electricity sales due to warmer temperature. However, the higher relative impact of rising CDD on electricity sales in the South, which is more sub-tropical in nature, due to future temperature increase might offset any temperature-induced electricity savings experienced in the North. Daylight hours showed a negative, yet statistically significant impact on electricity sales at 1%, i.e., an additional hour of daylight will reduce electricity consumption by 1.6%. Log of per capita GDP was significant at 5%: the more income the household receives, the higher their electricity demand will be. The regression model explains 76% of the variability of electricity sales to the residential sector for the period of 2001–2020.
4.1.2 Commercial and industrial sector
The results of the commercial and industrial sector model are presented in Table 2. The model was corrected for autocorrelation using the Durbin Watson method (D-W Rho = 0.74). The adjusted R2 value of 0.60 suggests a reasonably good model of fit. The period used for this regression analysis was 2001–2020. A balance point temperature of 64.98°F was used for the HDD and CDD analysis.
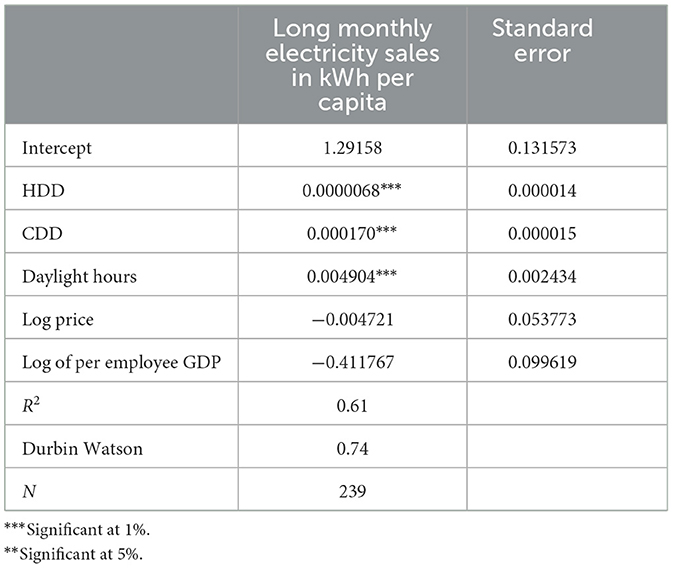
Table 2. Regression results for commercial and industrial sector.
The intercept shows the changes in electricity demand for the commercial and industrial sector per employee per month that are not related to temperature changes. The model shows four variables that are significant at 1%. The log of price shows a negative relationship with electricity consumption, which can be explained by businesses being careful of their energy expenses: the higher the cost of electricity, the more conservative businesses and industries will be. For the period of analysis of this research, however, the log of price showed no significant impact toward electricity sales. The commercial and industrial electricity demand shows a significance of 1% with CDD: with a 100-unit increase in CDD, there is a 1.7% increase in monthly electricity sales, which supports the view that some businesses needing cooling for their equipment or for their produce. The commercial and industrial electricity demand shows a significance of 1% with HDD, meaning for the commercial and industrial sector, the increase in electricity sales when temperature drops is still significant, but not as important as the CDD. Daylight hours showed a positive and statistically significant relationship at 1%: an additional hour of daylight will increase electricity consumption by 4.9%. This could be justified by businesses staying open longer and therefore needing more electricity expenses for lighting or even cooling purposes. Log of per employee GDP was significant at 1% with electricity sales: the more prosperous the economy is, the more energy will be needed to power different businesses and industries, which will result in higher electricity consumption. The regression model explains 61% of the variability of electricity sales to the residential sector for the period of 2001–2020.
Using the estimated regression models, we projected future electricity consumptions under three different climate scenarios for the period of 2020 to 2050, namely, stable climate, RCP 4.5 and RCP 8.5 scenarios.
4.2 RCP 4.5
As seen in Figure 6, there is a significant increase in monthly electricity sales all twelve months between 2020 and 2050. Because of the seasonal consumption behavior of individuals, we notice peak demands during summer and a decreased demand during winter months. Under RCP 4.5, March is the lowest average demand month with 10.43 MWh while July has the highest demand on average for the years 2020, 2030, 2040, and 2050, with 17.06 million MWh consumed, which is 64% higher than in March. The 2030 projected consumption is expected to exceed 2 standard deviation above the average 2001–2019 consumption, which is a significant increase in the span of a decade, i.e., more than 29.5 additional million MWh will be required by the state. The rapid surge in the electricity demand in a mere decade underscores the urgency for policymakers to enact a variety of initiatives aimed at bolstering the adoption of renewable energy sources. Such initiatives may also include policies that incentivize shift consumer behavior toward lower energy consumption and efficiency upgrades.
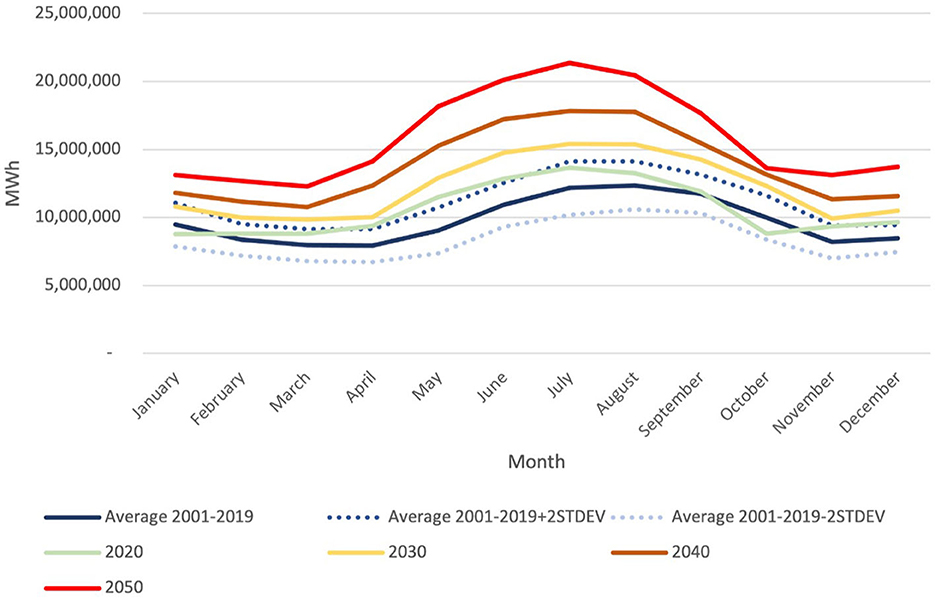
Figure 6. Monthly electricity sales residential sector RCP 4.5.
Since Florida is a humid and hot region during summer months, consumers need to use cooling to feel comfortable. Florida does not usually use much heating during colder months; however, the Northern portion of the state can face some lower temperatures during that period, which would force consumers to turn on the heating. Interestingly, we can see such a behavior in the numbers: average consumption first decreases from October to November, but then peaks in December and slows back down until April where it increases again. The increase in cooling during summer months (April–September) is much higher than the change in electricity sales during winter (October–March). Overall, between 2020 and 2050, electricity consumption for the residential sector increases by 50% under the RCP 4.5 scenario, which is very significant. A similar energy trend was observed for China (Zhang et al., 2022). Their projections indicate that by the end of the century, the residential sector in China could experience up to 47.70% surge in energy demand. Notably, like Florida, China currently derives a significant portion of its electricity—over 70%—from fossil fuels. The above authors advocate for efficiency upgrades and the implementation of robust renewable energy policies, not only as a means to combat climate change but also to effectively address the mounting energy demands in both regions.
The commercial and industrial sector has a much more even distribution of electricity sales across months in each study year than the residential sector sales (Figure 7). Under RCP 4.5, January is the lowest average demand month with 11.09 million MWh while July has the highest demand on average for the years 2020, 2030, 2040, and 2050, with 14.73 million MWh consumed, which is 33% higher than in January. Interestingly, the increase in energy demand between the historic baseline (2001–2019) and 2030 is greater for the commercial and industrial sector than the increase in the electricity demand for residential sector: an additional 42.5 million MWh (39% increase for commercial and industrial sector, compared to 25% increase for the residential sector). Therefore, as with the residential sector, policymakers may direct their efforts toward facilitating the transition of businesses and industries to employ more efficient materials, such as advanced insulation for buildings. This objective can be accomplished by enhancing energy codes to mandate the use of more efficient materials within industrial processes. Additionally, policymakers may consider mandating that companies and businesses procure a specific percentage of their electricity from renewable sources, thereby incentivizing utilities to expand their renewable energy generation capacity.
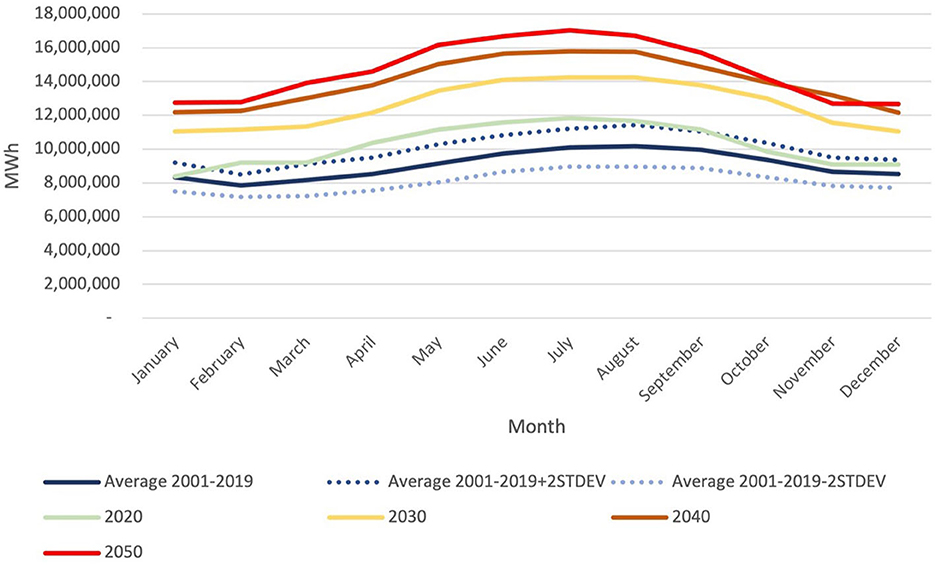
Figure 7. Monthly electricity sales commercial and industrial RCP 4.5.
The monthly variation in electricity demand is much less pronounced for the commercial and industrial sector compared to the residential one, which suggests that businesses keep their offices or warehouses at a stable temperature throughout the year for customers, but also for equipment efficiency. However, we find significantly higher level of electricity sales in uniformly all months in the future years. Overall, between 2020 and 2050, electricity consumption for commercial and industrial sector increases by 43% under the RCP 4.5 scenario. Of particular note, it is intriguing to observe that future projections for the commercial and industrial sector can exhibit a higher degree of uncertainty compared to the residential sector. A comprehensive study delving into the prospective electricity demand for the industrial and transportation sectors has revealed figures that are notably more variable. Specifically, under the SSP3 climate change scenario, it is uncovered that the electricity demand could range from 1.4 to 2.2 times greater by 2050 and 1.3 to 2.6 times greater by 2100 (Edelenbosch et al., 2020). This heightened variability underscores the intricate interplay of factors influencing energy demands within these sectors, making it imperative for policymakers and industry stakeholders to adopt robust and adaptable strategies in anticipation of a dynamically changing energy landscape.
4.3 RCP 8.5
Figure 8 is similar to Figure 6 in terms of electricity consumption pattern. Under RCP 8.5, March is the lowest average demand month with 10.38 million MWh, which is 0.42% lower compared to the RCP 4.5 scenario, while July still has the highest demand on average for the years 2020, 2030, 2040, and 2050, with 17.15 million MWh consumed, which is 0.49% higher compared to the RCP 4.5 scenario. Overall, under the RCP 8.5 scenario, yearly demand increased by 55% between 2020 and 2050, which was only 5% more than the percent increase during the same period under RCP 4.5. Therefore, it is abundantly clear that the state is poised to confront substantial increases in electricity demand in the coming decades under either climate scenario, placing immense strain on the grid infrastructure. These forthcoming electricity projections should serve as a compelling catalyst for policymakers to initiate proactive measures aimed at ensuring continued access to electricity for the residential sector. Without effective management and strategic planning, the grid is at risk of facing undeniable strain, potentially resulting in power shortages that could adversely impact the well-being of a significant portion of the population. Furthermore, in the face of escalating energy demand, the electricity prices will likely rise, which can exert substantial financial strain on low-income households. To mitigate this challenge, governments can play a pivotal role by providing assistance through subsidies and incentivizing the adoption of renewable energy sources (Elavarasan et al., 2023). The decreasing cost of renewable energies presents a promising avenue for addressing this issue. Remarkably, the residential sector, primarily reliant on electricity consumption, has significant potential for embracing renewable energy solutions, even in the midst of surging demand. This sector's adaptability underscores the feasibility of transitioning toward cleaner and more affordable energy sources, thus presenting a pathway toward greater sustainability and affordability for households across the socioeconomic spectrum.
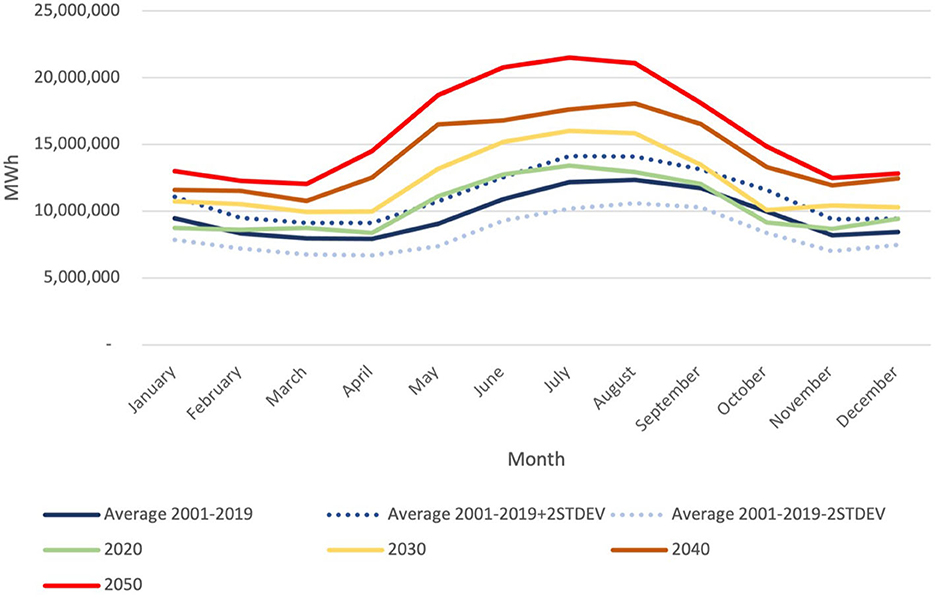
Figure 8. Monthly electricity sales residential sector RCP 8.5.
Similar increases are projected to realize under RCP 8.5 for commercial and industrial sectors (Figure 9). Under this scenario, January shows the lowest demand on average, with 11.10 million MWh, which is 0.1% higher than compared to the RCP 4.5 scenario, while July still has the highest electricity demand on average for the years 2020, 2030, 2040, and 2050, with 14.76 million MWh consumed, which is 0.2% higher compared to the RCP 4.5 scenario. Overall, under the RCP 8.5 scenario, yearly demand increased by 52% between 2020 and 2050, which is 9% more than the percent increase under RCP 4.5. In the context of the commercial and industrial sectors, any strain on the grid has the potential to impede the state's economic growth. These sectors are the key to Florida's economy, contributing substantially to job creation, revenue generation, and overall prosperity. A faltering grid could disrupt business operations, lead to production downtimes, and result in financial losses for industries that rely heavily on a stable and consistent power supply. The economic repercussions of grid instability extend beyond the immediate disruptions, affecting long-term competitiveness and investment attractiveness. Businesses seek locations with reliable energy infrastructure, and any doubts about the grid's capacity to meet growing demands could deter potential investors and hinder the state's ability to attract and retain industries critical to its economic vitality (Chen et al., 2022).
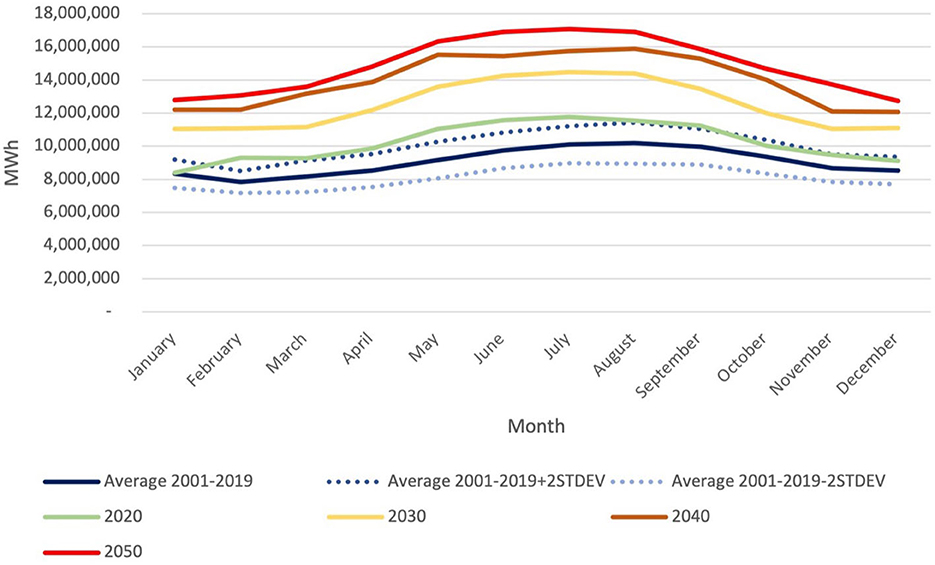
Figure 9. Monthly electricity sales commercial and industrial sector RCP 8.5.
In a comprehensive study focusing on a panel of Asian countries, compelling evidence surfaced highlighting the multifaceted benefits of expanding renewable energy shares within a nation's energy portfolio (Chen et al., 2022). The study not only underscored the role of increased renewable energy adoption in mitigating environmental degradation but also illuminated its capacity to spur robust economic growth. Integrating renewable energy sources with traditional power generation methods could yield substantial economic dividends for these nations. The economic growth generated from investments in renewable energy infrastructure, such as solar and wind farms, not only creates jobs but also stimulates innovation and enhances energy security. Moreover, it positions nations favorably in the global market as they embrace sustainable and forward-thinking energy solutions. These findings emphasize the potential for a harmonious coexistence of traditional power sources and renewable energies in a nation's energy mix.
4.4 Stable climate
To understand the weight of climate change in the future electricity sales for Florida, a Stable Climate Scenario was created, under which daylight hours and temperature were kept constant at the average 2015–2020 monthly level while the per capita income and per employee income was allowed to change. This allowed us to obtain projections in a similar manner as for the RCP 4.5 and RCP 8.5 scenarios, but without any increases in temperature. This is done to be able to compare how much electricity demand increase could be attributed solely to climate change, compared to other variables such as employment, population, or GDP.
Under the Stable Climate scenario for the residential sector, August is the highest demand month on average, which differs from RCP 4.5 and 8.5 scenarios, where July is the month recording the highest increase. Under the Stable Climate scenario, the highest demand month (August) demand is lower by 1.54% than the RCP 4.5 highest demand month (July), and by 2 % compared to the RCP 8.5 highest demand month (July). March is the lowest month, with 10.92 million MWh consumed, which is 4.7% higher than RCP 4.5, and 5.2% higher than to RCP 8.5. In 2050, total electricity consumption for the whole year for the residential sector under Stable Climate scenario totals 188.83 million MWh, compared to 190.38 million MWh for the RCP 4.5 scenario and 192.22 million MWh for the RCP 8.5.
Similarly, as for the residential sector, even under a Stable Climate scenario, Florida's commercial and industrial energy demand will increase throughout time (Figure 10), which is primarily due to increases in population. Under the Stable Climate scenario, July is the highest demand month on average, which is the same as RCP 4.5 and 8.5 scenarios. Under the Stable Climate scenario, July demand is lower by 3.0% than the RCP 4.5 and RCP 8.5 July demands. January is the lowest month, with 10.65 million MWh consumed on average, which is 1.4% lower than RCP 4.5, and 1.5% lower than RCP 8.5. Unlike the residential sector, the Stable Climate scenario had a lower average consumption during its lowest demand month compared to the RCP 4.5 and 8.5 scenarios. In 2050, total electricity consumption for the residential sector under Stable Climate scenario totals 154.61 million MWh, compared to 159.78 million MWh for the RCP 4.5 scenario and 160.22 million MWh for the RCP 8.5.
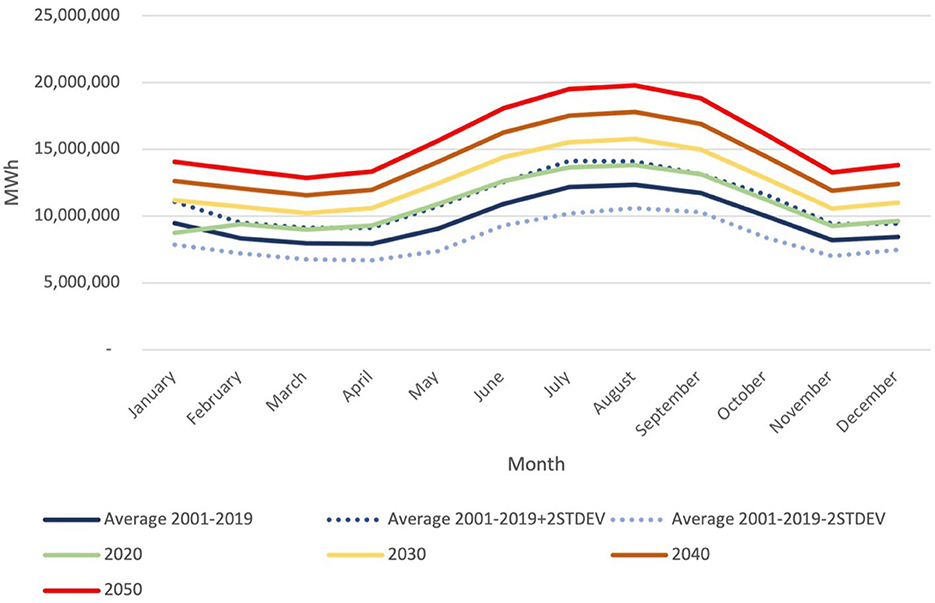
Figure 10. Monthly electricity sales residential sector stable climate.
Just as many regions around the world, Florida will face a major increase in temperature because of climate change. With an increase in temperatures comes an increase in electricity consumption. As it is evident from Figures 12, 13, which show the temperature difference between a Stable Climate scenario and the two scenarios of interest, RCP 4.5 and RCP 8.5, there will be a notable increase in temperature during the summer months in the next decades. The RCP 8.5 scenario will result in higher temperatures on average for the years of 2020, 2030, 2040, and 2050 during the months of January, May, June, July, August, September, November, and December compared to RCP 4.5. Interestingly, in the Stable Climate scenario, the months of October, November and December have higher temperatures compared to the RCP 4.5 and 8.5 average projected values, which can be justified by 2015–2020 having warmer temperatures than usual.
We also observe that during the winter months, the inverse relationship happens (Figures 12, 13). There will be a decrease of electricity demand because temperatures will rise, meaning that northern counties that usually require heating will not need to as much energy as they do during the winter months because of warmer temperatures. However, the higher the temperature, especially during the summer months the more electricity will need to be delivered to consumers to live comfortably once the balance point has been reached. Under the RCP 4.5 scenario, the residential sector will see a 63% increase in electricity demand in 2050 compared to the 2001–2020 baseline. Under the RCP 8.5 scenario, there will be a 65% increase in demand for the same period. For the commercial and industrial sector, there will be an increase of 47% under the RCP 4.5 and 54% under the RCP 8.5 when comparing average consumption for 2001–2019 and 2050 (Figure 11).
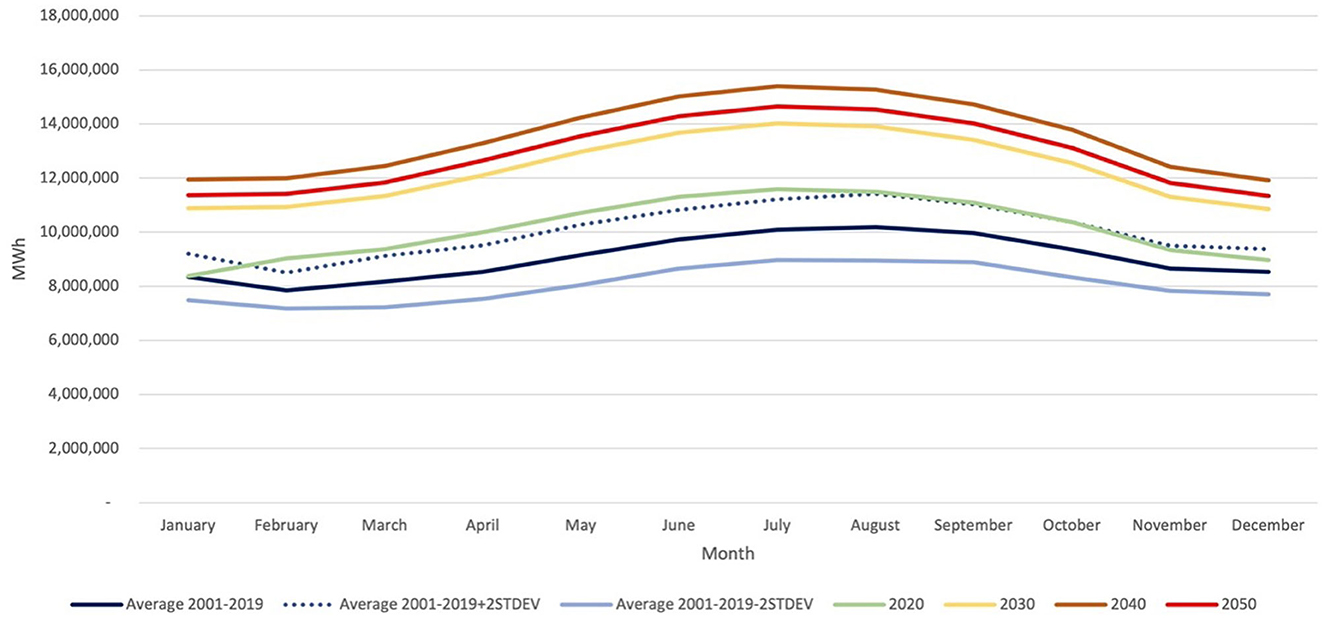
Figure 11. Monthly electricity sales commercial and industrial sector stable climate.
These figures (Figures 12, 13) vividly illustrate the substantial increases in temperature and their ramifications under both moderate and extreme climate change scenarios. Notably, the projections indicate higher winter temperatures, which will reduce the demand for heating and alleviate stress on the electric grid during colder months. However, the significant temperature spikes anticipated during the summer months pose a dual challenge. Firstly, the heightened demand for electricity to power air conditioning and cooling systems will necessitate increased energy supply. Given the finite availability of fossil fuels and the potential safety concerns associated with intensified nuclear power production, there is a compelling argument for a swift transition to renewable energy sources. Secondly, the existing electric grid infrastructure is designed to handle a specific quantity of electricity, necessitating a revision and modernization of the grid to avert potential blackouts. Such blackouts could have far-reaching consequences, impacting lives and the economy. Consequently, it is imperative that proactive measures are implemented to fortify the electric infrastructure and initiate the transition toward a more sustainable and resilient energy landscape.
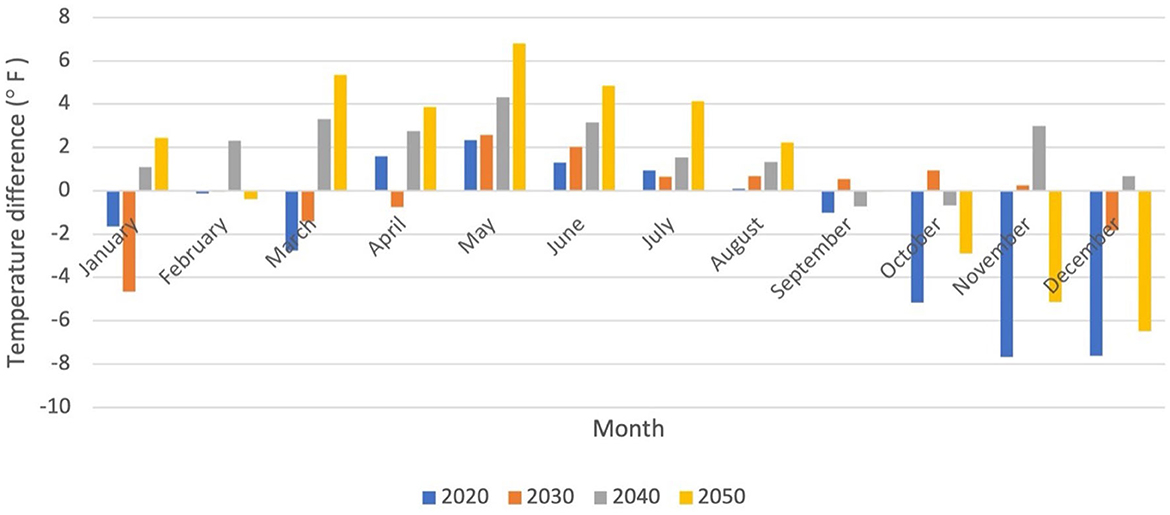
Figure 12. Temperature difference between Stable Climate and RCP 4.5.
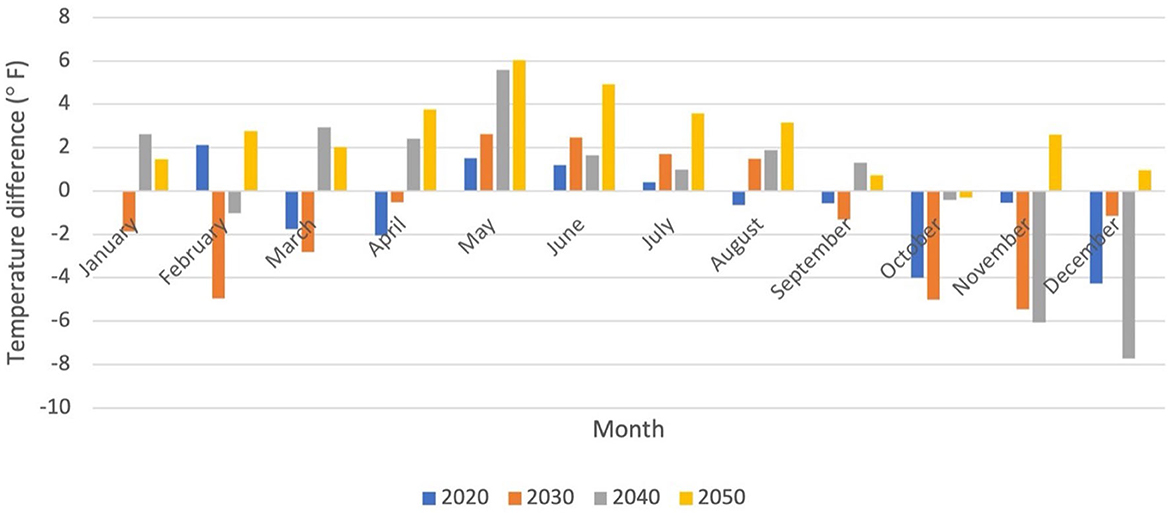
Figure 13. Temperature difference between Stable Climate and RCP 8.5.
5 Discussion
The results of this study primarily help us understand the degree to which future climate uncertainty will influence the electricity demand. As electricity access is a basic need for humans, the threat of climate change leaves many to wonder if the current structural capacity of the electricity sector can handle the future uncertainty. As discussed in the first section of this paper, the electricity sector could be threatened by climate change in terms of infrastructural, transmission and demand load impacts. In a state like Florida, with tens of millions of people concentrated in a generally warm area, the state cannot afford frequent power disruptions. Planning is a necessity for regions around the state to guarantee a stable, constant and affordable energy supply. Building a historical baseline for the state is the first step to analyzing future energy demand. In this paper, we were able to establish a relationship between electricity sales, price of electricity, GDP, population, employment, temperature, and daylight hours. There are many other variables that could also be included in a projection like ours, such as evolution of technology, increased access to electricity or even energy policies.
This research estimates future electricity demands for the residential and the commercial and industrial sectors in Florida until 2050 under future climate changes. The RCP 8.5 scenario will result in higher temperatures on average for the years of 2020, 2030, 2040, and 2050 during the months of January, May, June, July, August, September, November and December than RCP 4.5. Using the degree day methodology, it is determined that the residential sector will see a 63% increase in electricity demand from 2001–2019 to 2050 under the RCP 4.5 scenario, and a 65% increase under the RCP 8.5 scenario. The commercial and industrial sector will see a 47% and 54% increase in electricity demand under RCP 4.5 and RCP 8.5, respectively, during the same period. This could lead to peak demands and shut offs if the structure cannot handle the demanded load. Non access to electricity could lead to health issues or even death for more vulnerable people and could endanger national security as a whole. Furthermore, CDD, HDD, daylight hours and GDP per capita or employee will have significant impacts on electricity consumption for both residential and commercial and industrial.
This study also demonstrates that population increase is a significant contributor to increasing electricity demand: with a growing number of people, we expect more housing units to be built, leading to more spaces that need to be either heated or cooled. A higher number of individuals in households also means higher electricity needs for other uses, such as lighting, heating of water or cooking purposes. An interesting potential study could focus on determining these future needs based on the type of housing individuals move in (apartments compared to free standing houses). Similarly, for the commercial and industrial sectors, employment is a driving factor of energy consumption. Depending on the activity/business, electricity needs will vary.
As seen in other studies, the increases in summer months are more pronounced than in the winter months (Amato et al., 2005). For Florida, residential sector demand will experience a much higher percent increase than the commercial and industrial sector. Furthermore, because of the large spatial gradient in temperature across North and South Florida, climate-induced rising temperature in the future will have slightly different impacts in the two regions. Warmer temperature may lower the heating energy needs in winter months in the Northern region. However, more pronounced future increases in summer temperatures will increase the heating electricity demand in the Southern region more than the energy savings that the Northern region will see in winter. Therefore, overall annual electricity sales in the state will drastically increase by 2050 due to not only population and economic growth, but more prominently due to climate change.
The increasing electricity demand in Florida, particularly from the residential sector, over the next two to three decades due to rising temperatures presents a pressing challenge for the state. Florida, which heavily relies on fossil fuels, notably natural gas, faces a twofold challenge: firstly, the finite nature of these resources raises concerns about long-term energy security, and secondly, this reliance on fossil fuels hinders progress toward sustainable energy transition goals. While Florida has made strides in promoting renewable energy sources, such as solar power, its potential in this regard remains largely untapped. The state boasts abundant solar resources, making it an ideal candidate for solar energy development. However, there's a need for comprehensive policy support to fully harness this potential. Policymakers must prioritize investments in renewable infrastructure, expand incentives for residential solar adoption, and explore innovative financing models to accelerate the transition toward cleaner, more sustainable energy sources. By addressing these policy gaps and transitioning toward renewable energy, Florida can not only meet increasing electricity demand sustainably, but also reduce its dependence on finite fossil fuels while making the most of its abundant solar resources.
The above trends will have major implications for the state energy policies and programs. While we realize that there is a degree of uncertainty around the future climate change, what is abundantly clear is that Florida is going to experience significant climate change, long-term temperature increase, and as a result, increase in state-wide electricity demand. Government agencies, electrical utilities, industries, and the public alike will soon grapple with the question how to meet this sizable increase in electricity demand. As mentioned earlier, a significant portion of the state's energy consumption relies on fossil fuel, especially petroleum and natural gas. The Florida Department of Environmental Protection's Oil and Gas Program oversees the regulation and the conservation of these two resources. Additionally, it is worth noting that hydraulic fracking is allowed in Florida. There are no legislations that limit the amount of fossil fuels used in the state. This lax regulation combined with rising climate pressure may increase the consumption of fossil fuel energy including nuclear power.
The policies put in place on a regional, state, national or even international scale will dictate how our energy consumption, and therefore, electricity supply and usage will vary. It will also allow for increased renewable energy share in the consumption mix. Increased electrification is a goal for many states or countries: it would allow for more renewable energies to be integrated in the consumption, since these energies are not usually stock able at a large scale due to availability of components (Wadia et al., 2011). This would however mean that electricity infrastructure needs to be enhanced to carry the extra load, leading to additional costs. Additionally, many U.S. states are aiming to electrify their transportation sector, although Florida is not a leader (Howard et al., 2021). However, the transportation might need additional time and resources to be able to make the switch. Transportation is still heavily reliant of fossil fuels, and the alternatives for gas powered vehicles are not yet strong enough to compensate for the demand (Stančin et al., 2020). In any case, an increase in electricity used by the transportation sector will put additional pressure on the electricity sector.
Florida has implemented some programs to increase the share of renewable sources in the energy mix, especially solar power. For once, the state has exempted solar systems from sales taxes to promote their sales. Similarly, the state provides a 100% tax exemption on residential renewable energy and 80% exemption for non-residential, which creates incentives for consumers to use more renewable energies to meet their energy needs. The Florida Department of Agriculture and Consumer Services has implemented a variety of programs to promote renewable energies while increasing efficiency. However, the net metering policy is still lacking in the state: anyone with solar panels and excess electricity can only resell back to the utility company, and not to other consumers. This creates a dominance by utility companies over the energy market and limits the consumers' willingness to install renewable energies.
Unfortunately, several energy policies in Florida that promote renewable energy are still in infancy. Unlike 36 other states (EIA, 2022), the state has not implemented Renewable Portfolio Standards, which would require the state to mandate a minimum share of electricity produced from renewable energies. This could be justified by political affiliation in the state, especially climate change propaganda, which impacts climate change related actions (Hermas et al., 2023). To address the growing electricity demand and transitioning to renewable energy sources, Florida may adopt a comprehensive policy framework that includes a Renewable Portfolio Standard (RPS). An RPS would require utilities to have a minimum share of electricity generated from renewable sources in their portfolios, thereby accelerating the integration of clean energy into the grid. This would allow the state to handle the significant increases in demand for both sectors that are projected in this study. Simultaneously, significant improvements are needed in the state's net metering policy to empower residential areas to become active contributors to the energy grid. Streamlining and expanding net metering programs will allow households to efficiently sell excess renewable energy back to the grid, fostering a more distributed and resilient energy system. Furthermore, overhauling the state's electricity grid is imperative to address the dual challenges of increasing demand and the impacts of climate change. Strengthening the grid infrastructure is crucial to ensure reliability, enhance resilience in the face of extreme weather events, and accommodate the variable nature of renewable energy sources. A modernized grid can efficiently manage energy flows, incorporate advanced technologies like energy storage, and provide the necessary infrastructure for electric vehicle adoption, further reducing emissions. By implementing these policies, Florida can create a sustainable and forward-looking energy landscape, benefitting both the environment and its residents in the years to come.
Transitioning to renewable energies seems to be one of the most important steps to reduce climate change and promote a more sustainable way of living. Furthermore, climate-induced increase in future temperatures may be turned into an opportunity for producing more solar energy because of both increase in temperature, longer day hours and warmer months. The energy transition provides for an increase in renewable energies, which emit little CO2, but their production is highly dependent on the weather (in the short term) and the climate (in the long term). Measuring and predicting climatic parameters such as temperature, wind, precipitation is essential for the management of renewable energy resources. Florida is a prime candidate for solar power: however, that means that temperatures, hours of daylight or even cloudiness must be projected to be able to estimate how much electricity could be produced at a certain point in time.
Responding to climate-driven increases in future electricity demand will require a more comprehensive set of strategies. Such strategies will not only include supply-side initiatives resulting in faster transition to renewable energy, but also broader demand-side initiatives and conservation measures. In the case of Florida, it would be essential to include other variables such as technology development or policies that could affect power demand as well. For instances, buildings and their energy consumption will be greatly impacted by climate change. If not insulated properly, the buildings will face significant losses of energy because of various phenomena of conduction, convection, and radiation (Harish and Kumar, 2016). This demonstrates the importance of improving the thermal performance of buildings through the implementation of various energy efficiency measures such as: thermal insulation or optimal orientation and compactness of the building (Sadineni et al., 2011). Additionally, incentivizing and implementing more efficient appliances could promote more sustainable energy use.
Lastly, climate change is also associated with more frequent extreme heat conditions (Turek-Hankins et al., 2020). By 2050, Florida will be needing electricity at 50%−60% higher than the current demand level. The extreme heat conditions will put additional pressure on the energy system at times of abrupt demand spikes. Meeting energy demand during such events not only come at high economic costs, but also with possible equity implications since extreme heat impacts people of different communities differently (Hamstead et al., 2018). Public agencies and utilities will face additional responsibilities for managing energy demand not only efficiently but also equitably.
The findings of our student may suffer the following limitations. First, the study results might have been affected by the uncertainties associated with forecasting future variables such as population growth, employment trends, electricity pricing, GDP fluctuations, and climate variables. These uncertainties stem from a complex interplay of factors, including unforeseen technological advancements, geopolitical shifts, and natural disasters. The accuracy of our projections relies heavily on the quality and reliability of historical data and the assumptions made in our modeling. Furthermore, climate change, with its unpredictable impacts on energy demand and renewable resource availability, adds an additional layer of uncertainty. As such, while this research strives to offer informed guidance, policymakers should approach the findings with caution and remain flexible in adapting strategies to evolving circumstances and new data.
Nonetheless, there is room for improvement in this research by expanding the scope to incorporate additional variables, such as technological advancements and a broader range of environmental parameters like wind patterns, precipitation levels, and sun cover. By doing so, the model can attain a higher level of complexity and accuracy, thus providing more robust projections. Additionally, while the research serves as a valuable tool for policymakers on both state and national levels to predict electricity demand, it is crucial to emphasize that short-term assessments are inherently more reliable than long-term forecasting. Short-term assessments allow for more precise predictions, as they are less susceptible to the myriad uncertainties associated with long-term trends. Therefore, policymakers should consider the research findings as valuable guidance for immediate and mid-term policy planning, with a commitment to regularly revisiting and updating strategies to adapt to changing conditions and emerging data.
6 Conclusion
This research study aims to project future electricity consumption in Florida up to the year 2050 across three different climate scenarios. The methodology employed involves utilizing a regression model based on historical data, enabling the projection of potential future consumption trends for the state.
The findings of this study indicate that even in the absence of significant climate change impacts, electricity demand in Florida is poised to experience moderate growth. This growth is attributed to factors such as population expansion, increased employment opportunities, and overall economic growth as measured by GDP. However, when factoring in the influence of climate change, particularly under the RCP 4.5 and RCP 8.5 scenarios, the residential sector is projected to witness a surge in electricity demand, with an estimated increase of over 63% and 65%, respectively, from the 2015–2020 baseline. Similarly, the commercial and industrial sectors are expected to experience growth rates of 47 and 54% under the RCP 4.5 and RCP 8.5 scenarios, respectively, from the baseline.
These findings underscore two critical challenges facing the state of Florida. Firstly, the state remains heavily reliant on fossil fuels, which constitute more than three-quarters of its electricity generation mix. Given the finite nature of these resources, it is imperative that policymakers prioritize the adoption of renewable energy sources like solar and biomass to meet the growing demand for electricity. However, this transition to cleaner energy sources must be thoughtfully planned, particularly in Florida, where abundant solar energy potential exists. The intermittency of solar power generation necessitates the implementation of energy storage technologies and non-intermittent resources such as nuclear power to bridge the gap between supply and demand.
Secondly, there is a pressing concern relating to future electricity grid demand, especially during peak hours. A comprehensive grid modernization plan should be devised for the entire state. While utilities currently manage their own grid updates, a coordinated effort is essential to enhance grid resilience in the face of climate change impacts and to accommodate the increased electricity production associated with the greater use of renewable energy sources. This is especially crucial to ensure a reliable and sustainable electricity supply for Florida's future.
The approach developed in this study is applicable to other states or nations for forecasting future electricity requirements across diverse temperature scenarios, while keeping in mind the role of uncertainties that comes with such a study. Such application enables policymakers to design necessary measures to ensure a sustainable electricity provision.
Data availability statement
The raw data supporting the conclusions of this article will be made available by the authors, without undue reservation.
Author contributions
AF: Writing—original draft, Conceptualization, Data curation, Formal analysis, Investigation, Methodology. MB: Writing—review & editing, Conceptualization, Methodology, Supervision.
Funding
This work was partially supported by a grant from the USDA National Institute of Food and Agriculture (Award # 2022-77040-37619).
Conflict of interest
The authors declare that the research was conducted in the absence of any commercial or financial relationships that could be construed as a potential conflict of interest.
Publisher's note
All claims expressed in this article are solely those of the authors and do not necessarily represent those of their affiliated organizations, or those of the publisher, the editors and the reviewers. Any product that may be evaluated in this article, or claim that may be made by its manufacturer, is not guaranteed or endorsed by the publisher.
References
Amato, A. D., Ruth, M., Kirshen, P., and Horwitz, J. (2005). Regional energy demand responses to climate change: methodology and application to the commonwealth of Massachusetts. Clim. Change 71, 175–201. doi: 10.1007/s10584-005-5931-2
Bayissa, Y., Melesse, A., Bhat, M. G., Tadesse, T., and Shiferaw, A. (2021). Evaluation of regional climate model (RCM) simulations of daily precipitation and temperature-based climate indices: a case study of Florida, USA. Water 13, 2411. doi: 10.3390/w13172411
Bureau of Economic Analysis (2023). Gross Domestic Product. Available online at: https://www.bea.gov (accessed April 10, 2023).
Chanda, S., Bayissa, Y., Bhat, M., Parra, C., Shetty, K. G., Mesia, R., et al. (2021). Florida Tomato and Strawberry Supply Chains: Strategies for a Resilient Future. Report for SERC Contribution Number 1033. Miami, FL: Institute of Environment, Agroecology Program, Florida International University.
Chen, J., Su, F., Jain, V., Salman, A., Tabash, M. I., Haddad, A. M., et al. (2022). Does renewable energy matter to achieve sustainable development goals? The impact of renewable energy strategies on sustainable economic growth. Front. Energy Res. 10, 829252. doi: 10.3389/fenrg.2022.829252
Ciscar, J. C., and Dowling, P. (2014). Integrated assessment of climate impacts and adaptation in the energy sector. Energy Econ. 46, 531–538. doi: 10.1016/j.eneco.2014.07.003
Edelenbosch, O. Y., Van Vuuren, D. P., Blok, K., Calvin, K., and Fujimori, S. (2020). Mitigating energy demand sector emissions: the integrated modelling perspective. Appl. Energy 261, 114347. doi: 10.1016/j.apenergy.2019.114347
EIA (2022). Renewable energy explained. Portfolio Standards. Available online at: https://www.eia.gov/energyexplained/renewable-sources/portfolio-standards.php (accessed November 15, 2022).
EIA (2023). Florida Electricity Sector. Available online at: https://www.eia.gov/electricity/data.php#summary (accessed April 14 2023)
Elavarasan, R. M., Nadarajah, M., Pugazhendhi, R., Sinha, A., Gangatharan, S., Chiaramonti, D., et al. (2023). The untold subtlety of energy consumption and its influence on policy drive towards Sustainable Development Goal 7. Appl. Energy 334, 120698. doi: 10.1016/j.apenergy.2023.120698
Elkamel, M., Schleider, L., Pasiliao, E. L., Diabat, A., and Zheng, Q. P. (2020). Long-term electricity demand prediction via socioeconomic factors—a machine learning approach with Florida as a case study. Energies 13, 3996. doi: 10.3390/en13153996
Ferguson, R., Wilkinson, W., and Hill, R. (2000). Electricity use and economic development. Energy Policy 28, 923–934. doi: 10.1016/S0301-4215(00)00081-1
Florida Climate Center (2023). State Average Temperature. Available online at: https://climatecenter.fsu.edu/products-services/data/statewide-averages/temperature (accessed April 10, 2023).
Hamstead, Z. A., Farmer, C., and McPhearson, T. (2018). Landscape-based extreme heat vulnerability assessment. J. Extreme Events 5, 1850018. doi: 10.1142/S2345737618500185
Harish, V. S. K. V., and Kumar, A. (2016). A review on modeling and simulation of building energy systems. Renew. Sustain. Energy Rev. 56, 1272–1292. doi: 10.1016/j.rser.2015.12.040
Hasanuzzaman, M., Zubir, U. S., Ilham, N. I., and Seng Che, H. (2017). Global electricity demand, generation, grid system, and renewable energy polices: a review. Wiley Interdiscip. Rev. Energy Environ. 6, e222. doi: 10.1002/wene.222
Hermas, A., Presley, K. W., and Boqiang, L. (2023). Does political propaganda matter in mitigating climate change? Insights from the United States of America. J. Manag. Sci. Eng. 8, 386–397. doi: 10.1016/j.jmse.2022.12.006
Howard, B., Vaidyanathan, S., Cohn, C., Henner, N., and Jennings, B. (2021). “The state transportation electrification scorecard,” in American Council for an Energy-Efficient Economy. Available online at: https://www.aceee.org/research-report/t2101
Huang, H., Du, Z., and He, Y. (2018). The effect of population expansion on energy consumption in canton of China: a simulation from computable general equilibrium approach. Int. J. Eng. Sci. Manag. Res. 5, 19–26. Available online at: https://paper.researchbib.com/view/paper/145598
International Panel on Climate Change (2015). Climate Change 2014 Synthesis Report. Available online at: https://ar5-syr.ipcc.ch/ipcc/ipcc/resources/pdf/IPCC_SynthesisReport.pdf (accessed April 10, 2023).
Jayadev, G., Leibowicz, B. D., and Kutanoglu, E. (2020). U.S. electricity infrastructure of the future: Generation and transmission pathways through 2050. Appl. Energy 260, 114267. doi: 10.1016/j.apenergy.2019.114267
Mukherjee, S., and Nateghi, R. (2017). Climate sensitivity of end-use electricity consumption in the built environment: an application to the state of Florida, United States. Energy 128, 688–700. doi: 10.1016/j.energy.2017.04.034
Ruth, M., and Lin, A. C. (2006). Regional energy demand and adaptations to climate change: methodology and application to the state of Maryland, USA. Energy Policy 34, 2820–2833. doi: 10.1016/j.enpol.2005.04.016
Sadineni, S. B., Madala, S., and Boehm, R. F. (2011). Passive building energy savings: a review of building envelope components. Renew. Sustain. Energy Rev. 15, 3617–3631. doi: 10.1016/j.rser.2011.07.014
Sailor, D. J. (2001). Relating residential and commercial sector electricity loads to climate—evaluating state level sensitivities and vulnerabilities. Energy 26, 645–657. doi: 10.1016/S0360-5442(01)00023-8
Schaeffer, R., Szklo, A. S., De Lucena, A. F. P., Borba, B. S. M. C., Nogueira, L. P. P., Fleming, F. P., et al. (2012). Energy sector vulnerability to climate change: a review. Energy 38, 1–12. doi: 10.1016/j.energy.2011.11.056
Sisternes, F. J., Jenkins, J. D., and Botterud, A. (2016). The value of energy storage in decarbonizing the electricity sector. Appl. Energy 175, 368–379. doi: 10.1016/j.apenergy.2016.05.014
Stančin, H., Mikulčić, H., Wang, X., and Duić, N. (2020). A review on alternative fuels in future energy system. Renew. Sustain. Energy Rev. 128, 109927. doi: 10.1016/j.rser.2020.109927
Time and Date (2023). Daylights Hours. Available online at: https://www.timeanddate.com/sun/usa/miami?month=1 (accessed April 10, 2023).
Turek-Hankins, L. L., Hino, M., and Mach, K. J. (2020). Risk screening methods for extreme heat: implications for equity-oriented adaptation. PLoS ONE 15, e0240841. doi: 10.1371/journal.pone.0240841
US Bureau of Labor Statistics (2023). Florida Unemployment. Available online at: https://data.bls.gov/timeseries/LASST120000000000005?amp%253bdata_tool=XGtableandoutput_view=dataandinclude_graphs=true (accessed April 10, 2023).
U. S. Census Bureau (2001). Florida Population. Available online at: https://www.macrotrends.net/states/florida/population (accessed April 10, 2023).
Van Ruijven, B. J., De Cian, E., and Wing, I. S. (2019). Amplification of future energy demand growth due to climate change. Nat. Commun. 10, 1–12. doi: 10.1038/s41467-019-10399-3
Wadia, C., Albertus, P., and Srinivasan, V. (2011). Resource constraints on the battery of energy storage potential for grid and transportation applications. J. Power Sources 196, 1593–1598. doi: 10.1016/j.jpowsour.2010.08.056
Keywords: electricity demand, climate change, renewable energy transition, representative concentration pathways, energy policy, degree-day method
Citation: Fache A and Bhat MG (2024) Temperature sensitive electricity demand and policy implications for energy transition: a case study of Florida, USA. Front. Sustain. Energy Policy 2:1271035. doi: 10.3389/fsuep.2023.1271035
Received: 01 August 2023; Accepted: 29 November 2023;
Published: 03 January 2024.
Edited by:
Khalid Ahmed, Sukkur IBA University, PakistanReviewed by:
Ridwan Ibrahim, University of Lagos, NigeriaReza Hafezi, National Research Institute for Science Policy (NRISP), Iran
Bareerah Khan, Xi'an Jiaotong University, China
Copyright © 2024 Fache and Bhat. This is an open-access article distributed under the terms of the Creative Commons Attribution License (CC BY). The use, distribution or reproduction in other forums is permitted, provided the original author(s) and the copyright owner(s) are credited and that the original publication in this journal is cited, in accordance with accepted academic practice. No use, distribution or reproduction is permitted which does not comply with these terms.
*Correspondence: Anna Fache, YW5uYS5mYWNoZTI4QGdtYWlsLmNvbQ==