 Samuel Dekolo
 Matthew I. Ekum
 Omobolanle K. James
 Clinton Aigbavboa4
- 1Department of Urban and Regional Planning, College of Environmental Design and Technology, Lagos State University of Science and Technology, Ikorodu, Nigeria
- 2Department of Mathematical Sciences, College of Basic Science, Lagos State University of Science and Technology, Ikorodu, Nigeria
- 3Department of Urban and Regional Planning, Faculty of Engineering and Built Environment, University of Johannesburg, Johannesburg, South Africa
- 4School of Civil Engineering and Built Environment, Faculty of Engineering and Built Environment, University of Johannesburg, Johannesburg, South Africa
Africa is experiencing unparalleled urbanization, with projections suggesting that by 2030, more than 50% of its inhabitants will live in urban areas. Uncontrolled spatial expansion threatens sustainability, especially in megacities like Lagos. Urban sprawl in peri-urban areas has led to the loss of valuable agricultural lands, food security risks, and breaking the link between rural and metropolitan regions. This study investigates the proximate factors driving urban sprawl on statutory agricultural lands in peri-urban areas of Lagos. An interdisciplinary methodology that employs remote sensing, land change analysis, field surveys, and structural equation modeling was adopted. The findings revealed that built-up areas in the Ikorodu municipality increased by 127% over 32 years, leading to fragmented and uncontrolled development in statutory agricultural zones. The structural equation modeling for 322 homeowners sampled shows a lack of policy awareness and weak development control as major underlying drivers, explaining 37% of peri-urban expansion. Also, declining per capita arable lands indicate risks to regional food self-sufficiency. A strategic land management approach is needed to leverage rural–urban linkages that safeguard food provisioning services and achieve resilient African megacities. Also, rapidly growing African cities should adopt spatial planning incorporating agroecological perspectives and collaborative governance of urban and rural lands for a sustainable future.
1 Introduction
Urbanization is a worldwide trend that reshapes the twenty-first century’s landscapes, economies, and communities. According to the United Nations (2018), by 2050, 68% of the world’s population is projected to live in urban areas, with almost 90% of the growth occurring in Africa and Asia. Also, India, China, and Nigeria alone will account for 35% of the world’s population growth between now and 2050. Nigeria will be the 3rd most populous country in the world, at par with the United States of America, with a population of 375 million (United Nations, 2018, 2022). However, the urbanization rate in these regions presents significant global and local sustainability challenges (Bhatta, 2010; Seto et al., 2011; Verburg et al., 2013; van Vliet, 2019).
In African cities, the sustainability challenges come from the spatial expansion of cities related to informal land use, environmental degradation, loss of agricultural land, and diminution of forest and high-biodiversity wetlands (Lambin et al., 2001; Huang et al., 2020; Simkin et al., 2022). Furthermore, some researchers have linked these sustainability challenges in sub-Saharan African cities to a sprawling peri-urbanization process (Mbiba and Huchzermeyer, 2002; Agbola and Agunbiade, 2009; Cobbinah and Amoako, 2012; Amoateng et al., 2013; Areola et al., 2014). Sub-Saharan Africa’s sustainability challenge of shrinking provisioning ecosystem services has been associated with converting farmlands and forest land to urban land uses in peri-urban areas (Appiah et al., 2014; Pullanikkatil et al., 2016) (see Figure 1).
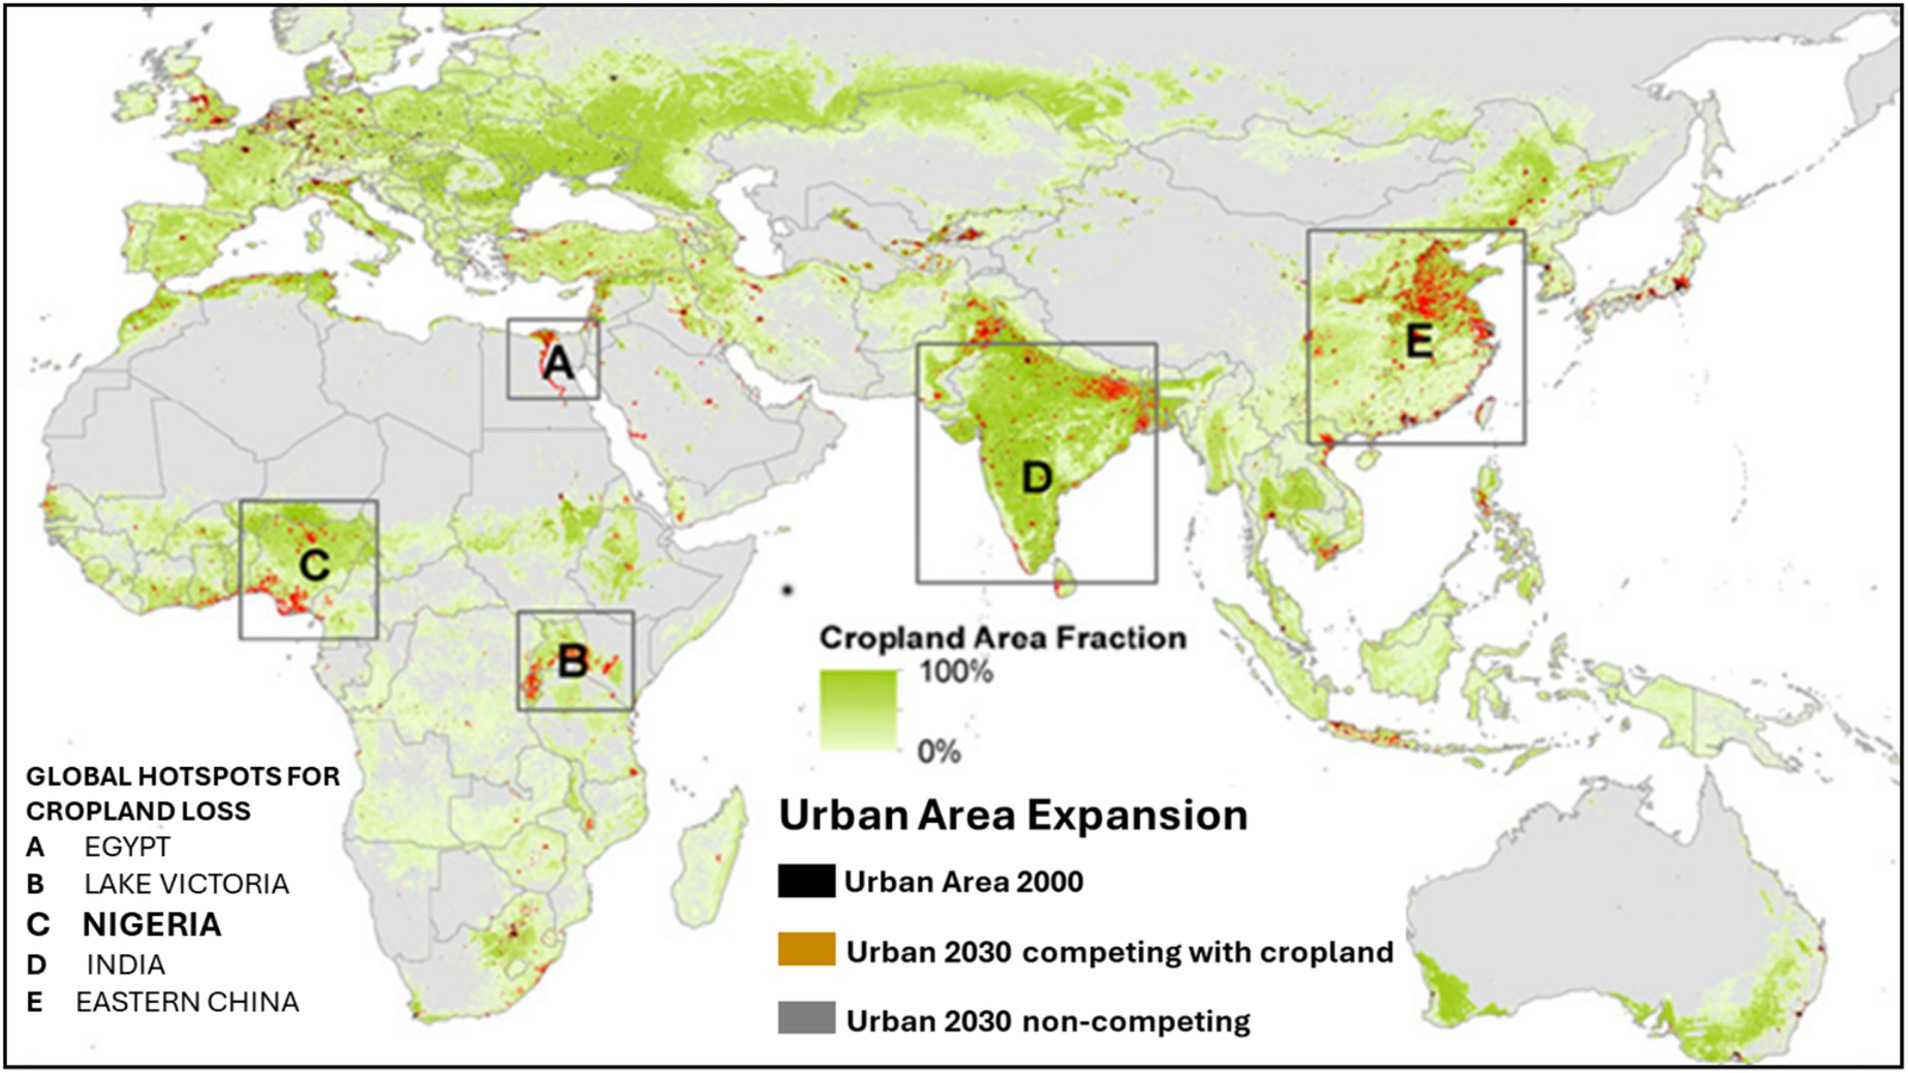
Figure 1. Global hotspots for future urban expansion and cropland loss (Bren d’Amour et al., 2017).
Nigeria’s rapid population growth and corresponding decline in agricultural lands pose substantial risks to urban development and food security. The World Development Indicator shows that Nigeria’s total population grew from 49.9 million in 1965 to 208.3 million in 2020. However, arable land per person in Nigeria dwindled from 0.49 hectares in 1965 to 0.17 hectares in 2020, with a decline rate of approximately 2% (World Bank, 2024). This trend is greater than the global and sub-Saharan Africa (SSA) average, with decline rates of 1.15 and 1.88%, respectively. Agricultural land loss in PUAs of African cities could exceed 2% yearly (Lasisi et al., 2017; Coulibaly and Li, 2020; Molla et al., 2024), thus creating serious food security problems. According to land use policies and ineffective urban planning have exacerbated the loss of agricultural land in peri-urban areas of a rapidly growing megacity like Lagos.
The Lagos Megacity in Nigeria typifies the global urbanization trends. It is one of the world’s fastest-growing cities, with a population exceeding 20 million. It typifies the complexities of the African city and its sustainability capabilities. Like some African cities, Lagos has sprawled into peri-urban areas, transforming agricultural and forest landscapes, thereby exerting pressure on available ecosystem services (Dekolo et al., 2015; van Vliet, 2019). In research investigating future urban expansion and the implications on global croplands, Bren d’Amour et al. (2017) identified the Lagos Megacity Region as one of the hotspots for rapid global cropland loss. The research predicted that by 2030, Nigeria would lose 2.1 Mha of its croplands to urban expansion, equivalent to 6% of the global croplands. Another study by Abiodun et al. (2017) predicts a 56% increase in urban expansion of the Lagos Megacity Region by 2030 due to rapid urban growth, implying more loss of agricultural land that provides ecosystem services. Another example is the PUA study of Greater Cairo, which investigated the impact of uncontrolled urban sprawl for 20 years, leading to agricultural land fragmentation and loss (Salem and Tsurusaki, 2024). Ecosystem services (ES) are natural benefits that directly or indirectly contribute to human well-being (Powledge, 2006; van Oudenhoven, 2015). Naeem et al. (2003) identified four types of ES; these include provisioning services (food, water, raw materials, medicinal resources), regulatory services (climate regulation, flood control, air, and water quality), cultural (tourism. Aesthetics, spiritual) and supporting services (biodiversity, soil formation). Due to continuous expansion into peri-urban areas in Lagos, these services are threatened, often leading to habitat degradation, biodiversity diminution, and agricultural land loss, thereby compromising the ability of these areas to provide essential ES (Braimoh and Onishi, 2007).
The need for promoting mutual interdependence between rural and urban areas, especially in peri-urban areas (PUAs) through linked ecosystem services, has been emphasized in literature (Feng et al., 2021; Gebre and Gebremedhin, 2019; Tacoli, 2003, 1998; Wu et al., 2017). Also, previous studies have focused on quantifying peri-urban land use change and the effect of urban sprawl on agricultural land and ecosystem services. These studies have predominantly applied remote sensing spatial metrics to quantify the extent of change and the underlying drivers like the economy, population growth, urbanization, and agro-ecological factors (Ingwani et al., 2024; Molla et al., 2024). However, the proximate factors, such as behavior, perception, and socio-demographic inclinations, which are more elusive, have often been overlooked, especially in the Lagos context and other SSA countries. Understanding the complex relationships between human decisions and land use change requires robust models that transcend existing spatial and statistical models, which often do not account for these proximate factors in the form of latent variables. The study aims to fill this gap using Structural Equation Modelling (SEM) to understand the proximate drivers of urban sprawl on statutory agricultural lands in Lagos’ PUA, Ikorodu.
This research aims to detect urban sprawl from land cover transitions in Ikorodu between 1984, 2000, and 2016 and to determine the proximate drivers of sprawl in agricultural lands by applying SEM. The longitudinal study was limited to 2016 because another subregional master plan will be operational from 2016 to 2036. The statutory agricultural lands were based on the Lagos State Regional Plan 1980–2000 and the revised edition effective till 2016. The study integrates geospatial techniques and field survey data to understand the urban expansion dynamics and motives that drive land use change decisions using SEM, thereby providing valuable insight for effective land resource planning and management in rapidly growing cities of Africa in comparable contexts. This study suggests the need for integrated urban planning approaches that contemplate both spatial and human dimensions of land use change decisions. The findings from this study inform policymakers on effective strategies for sustainable urban growth management in Lagos and contribute to the broader debate of sustainable development in rapidly growing cities.
2 Methodology
2.1 The study area: Ikorodu, Lagos State, Nigeria
Ikorodu is a municipality (Local Government Area) in the peri-urban area of Lagos, the fastest-growing megacity in sub-Saharan Africa. The study area is found at the northeastern fringe of the Lagos megacity, approximately 36 km Northeast of Lagos Central Business District, and lies between longitude 3.43oW and 3.7oW and latitude 6.68oN and 6.53oN. Ikorodu is approximately 396.5 square kilometers. The existence of perennial rivers and streams, abundant wetlands, and closeness to the Lagos Lagoon endeared the Lagos State Government to zone 66% of its landmass for agriculture, forestry, and conservation land uses in the 1980–2000 Lagos State Regional Plan. Ikorodu was predominantly rural, but the expansion of Lagos stimulated its growth into a significant secondary city (see Figure 2).
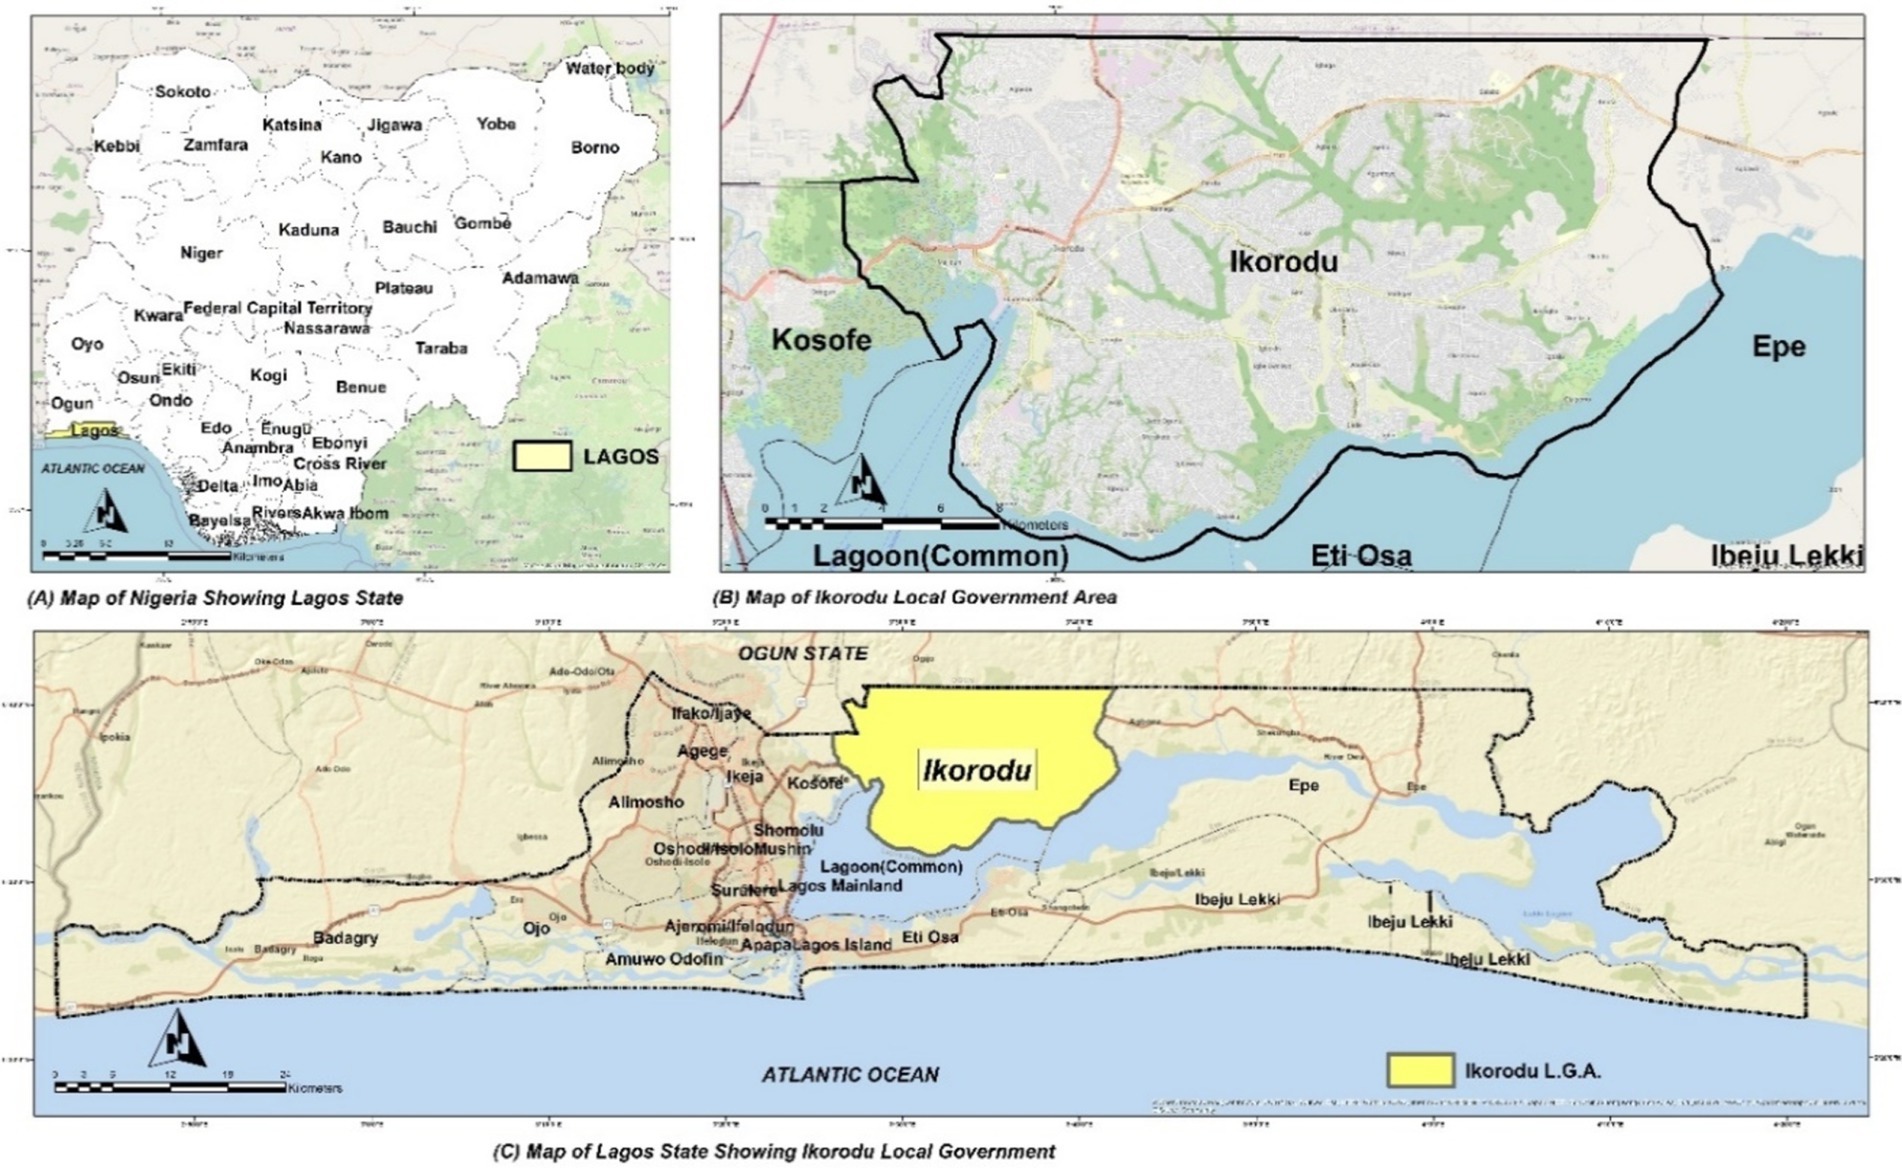
Figure 2. The study area: Ikorodu, Lagos, Nigeria.
Historically, the primary livelihood sources of the locals are farming, fishing, and trading. Ikorodu recorded a 186% population increase between the 1991 and 2006 census years (i.e., from 184,674 to 527,917), and its present population estimate is over a million, ranking 13th among Nigeria’s 20 largest urban agglomerations shown in Table 1. Ikorodu has a light port and Nigeria’s most significant industrial estate, with 1,582.27 hectares, attracting population growth.
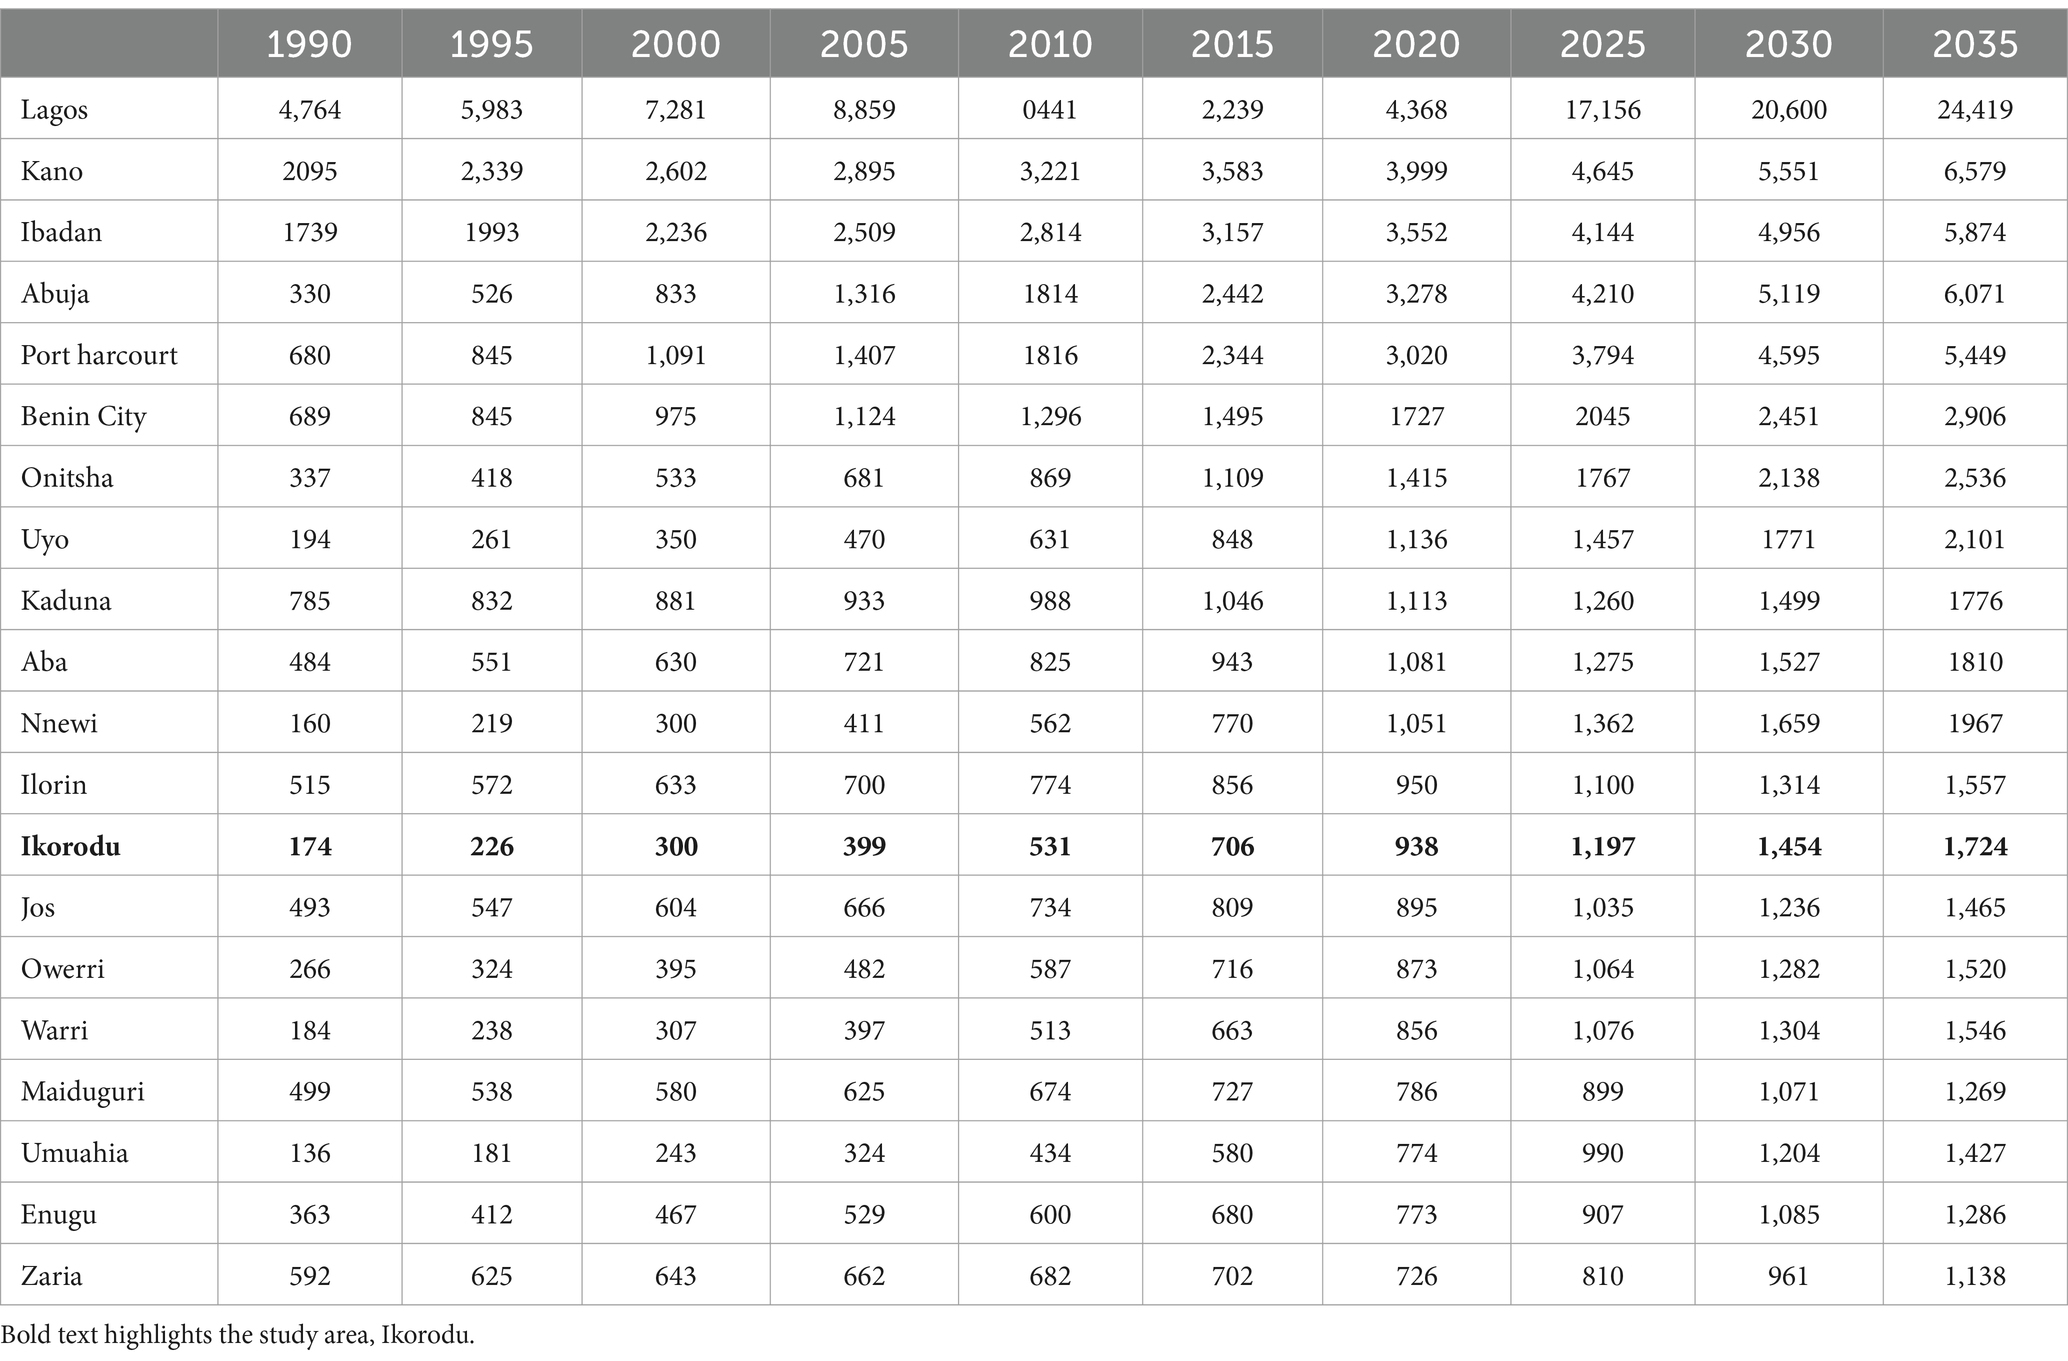
Table 1. Population of Nigeria’s 20 largest cities (1990–2035) in thousands ('000).
2.2 Data collection and analysis
2.2.1 Land use and land cover change analysis
2.2.1.1 Spatial and temporal resolutions
The study utilized Landsat imagery from 1984, 2000, and 2016 to analyze land cover changes (see Table 2). These specific years aligned with significant policy changes and developmental milestones in Lagos State, where the state adopted a new master plan for the Ikorodu subregion in 2016. A 30 m spatial resolution was adopted for the study.
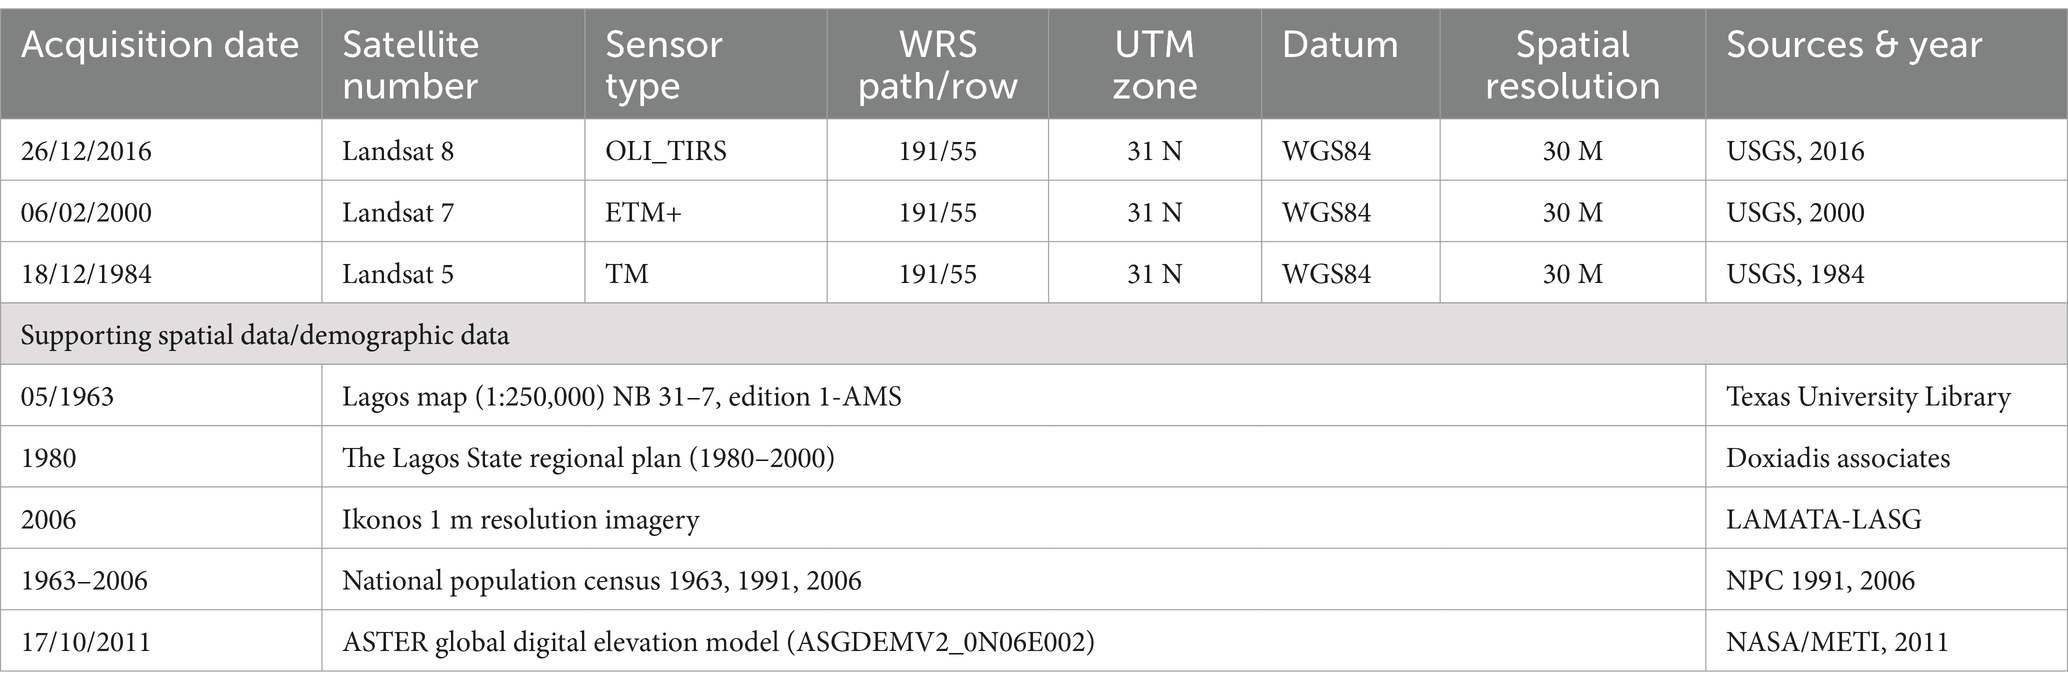
Table 2. Data sources.
2.2.1.2 Classification process
Land cover classification was done using an unsupervised cluster algorithm and post-classification method. Geospatial analysis and modeling Software (i.e., ArcGIS 10.2.1 and Idrisi Terrset Modeling Software) were used for land change modeling. To simplify urban sprawl detection and land use change modeling in this research, urban/built-up, forested land, agricultural land, and water bodies created four classes of land cover. Level 1 of classes will produce change statistics, while level 2 will describe various land uses and land cover classes. Post-classification accuracy assessment was done using the Percentage Correct method by selecting 60 random GPS points across the entire study area, and clusters were compared with high-resolution imageries from Google Earth historical archives. The overall correctness of sampled points was 96% (see Table 3).
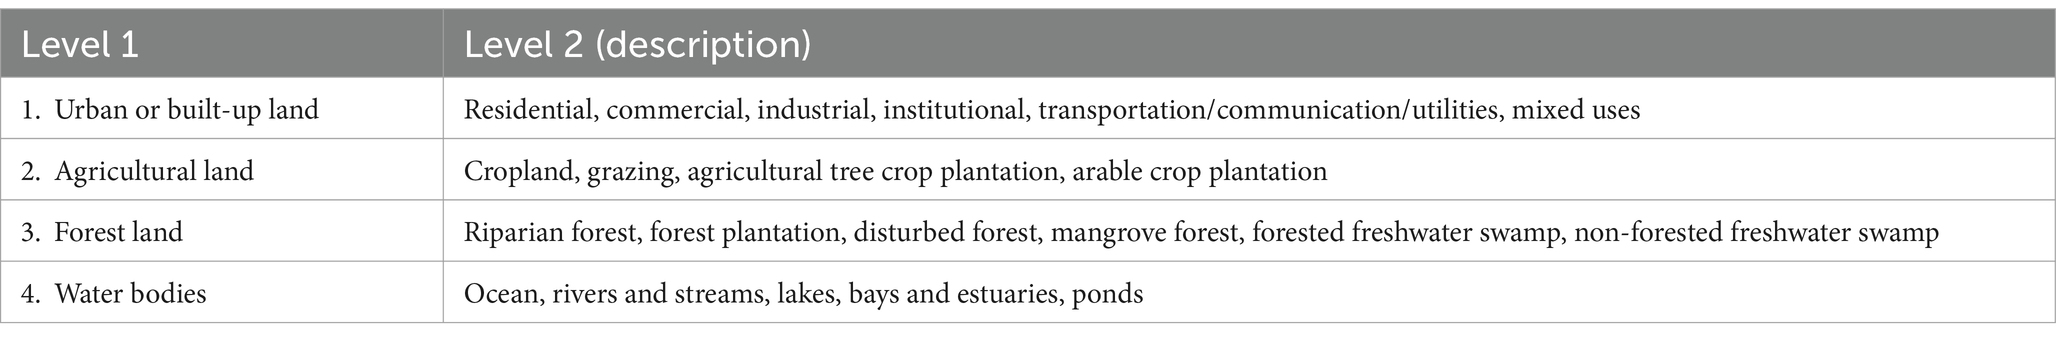
Table 3. Land use land cover classification.
2.2.2 Fractal analysis for sprawl detection
Fractal analysis was used to assess the growth pattern. Few studies have used fractal analysis to measure sub-Saharan African urban sprawl (Bonsu and Bonin, 2023; Dekolo et al., 2015; Mundia and Murayama, 2010). Fractal analysis offers a quantitative sprawl measurement, distinguishing between dispersed and compact growth. Highly patchy built-up areas signify a sprawling pattern with few fractal dimensions, while compaction and regularity attract a higher figure (Frankhauser and Tannier, 2005; Tannier and Pumain, 2005). Urban areas for the three periods (1984, 2000, and 2016) were extracted from the land cover maps of Ikorodu using a Boolean operation, and rasters were analyzed with Fractalyse Software (version 2.4.1) to measure the fractal dimension. The results from the fractal analysis were interpreted in the context of the land use policies and implications, linking sprawl patterns to potential impacts on ecosystem services.
2.2.3 Ecosystem service assessment
The study focuses on the provisioning services of agricultural land, that is, the ability of the agricultural landscape to supply food, thereby evaluating how land use and land cover changes affect the capacity for providing a critical ES like food. By correlating land cover changes with population growth, the study assesses the sustainability of local food production and the broader implications for food security in a rapidly urbanizing area. This method differs from previous economic valuation-based approaches used in ES existing research in sub-Saharan Africa (Nelson et al., 2010; Egoh et al., 2012; Adekola et al., 2015). The challenges of applying economic valuation in ES assessment in sub-Saharan Africa include a lack of consistency in the following datasets: prices per hectare, yield per hectare, measurements, exchange rates, and diverse socioeconomic value systems. The non-monetary approaches can overcome some of the challenges identified above (Burkhard et al., 2009; Verburg et al., 2009; Wolff et al., 2015; Haas and Ban, 2017).
In this case study, the effect of urban sprawl on the ES potentials of the PUAs surrounding Ikorodu town emerged by associating the SPUs and SBAs in the three periods (1984, 2000, and 2016). Agricultural landscapes are SPUs supplying food to urban areas, which are SBAs. SPU-SBA relationship may be in-situ, omnidirectional, directional, or decoupled (Burkhard et al., 2014). The United Nations Food and Agricultural Organisation specifies 2,360 Kcal/capita/day as sub-Saharan Africa’s total food consumption requirement per capita per day in 2015 (Alexandratos and Bruinsma, 2012). The minimum land required per capita for a diversified diet is obtained in North America and Europe at 0.5 hectares. However, the global average is between 0.2 and 0.25 hectares, while the absolute minimum is 0.07 hectares (Myers, 1999; Goswami and Nishad, 2017). The study examines the relationship between the ES demanded by relating the population and food density with the spatial capacity of the agricultural land to supply per capita dietary requirements of the SBAs. This approach aims to uncover the intricate dynamics of urban sprawl in the study area and its implications for provisioning ES.
2.2.4 Field survey and data analysis
2.2.4.1 Questionnaire design
A structured questionnaire was developed to capture homeowners’ perceptions, motivations for residential development in agricultural land, and land use and policy awareness levels. Additionally, the tool gathered socioeconomic data, such as income levels, migration patterns, and household size, which were incorporated to contextualize the changes observed in land cover. Data was collected to determine the proximate drivers of homeowners’ development decisions in PUAs.
2.2.4.2 Sampling technique
A stratified random sampling technique was adopted to ensure representation across different neighborhoods. Three hundred eighty-five owners of residential properties across 75 neighborhoods in the 6 Local Council Development Areas (LCDAs) of Ikorodu Municipality were given questionnaires with an overall response rate of 83.07% (see Table 4). Based on the building footprint count of 139,694 residential properties extracted from high-resolution satellite imageries in the study area, 383 was the recommended sample size, with a confidence level of 95% and a margin of error of 5% (see Figure 3).
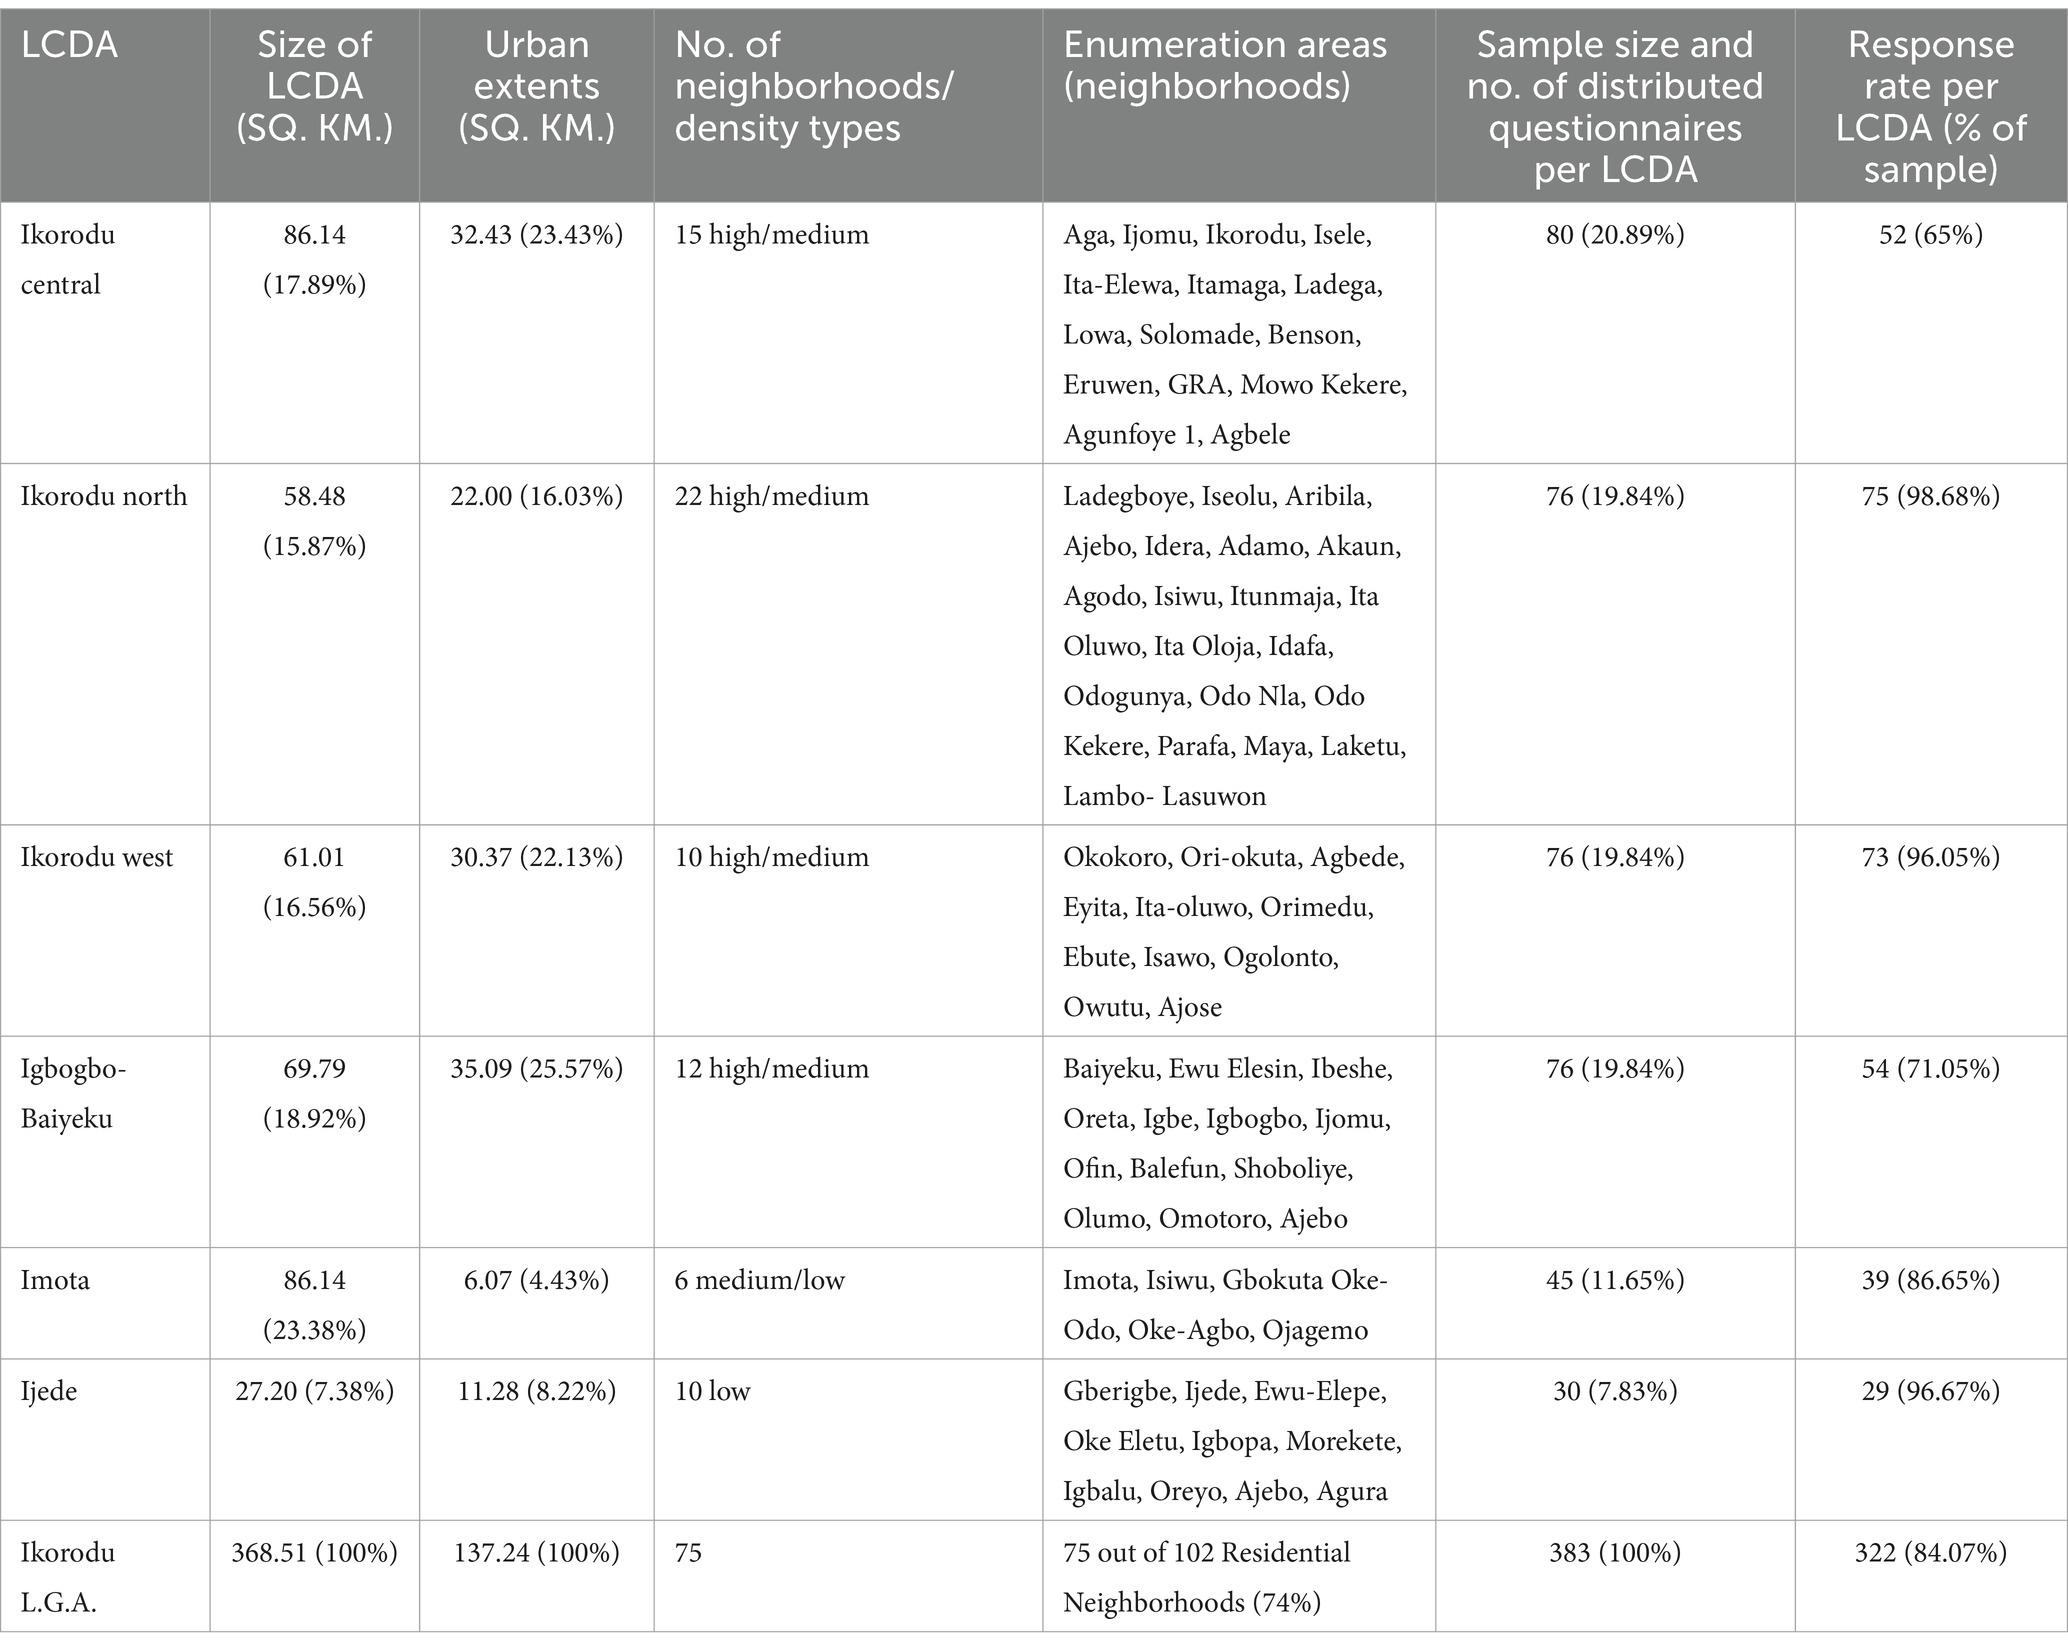
Table 4. Sample size and ratio for local council development areas in Ikorodu.
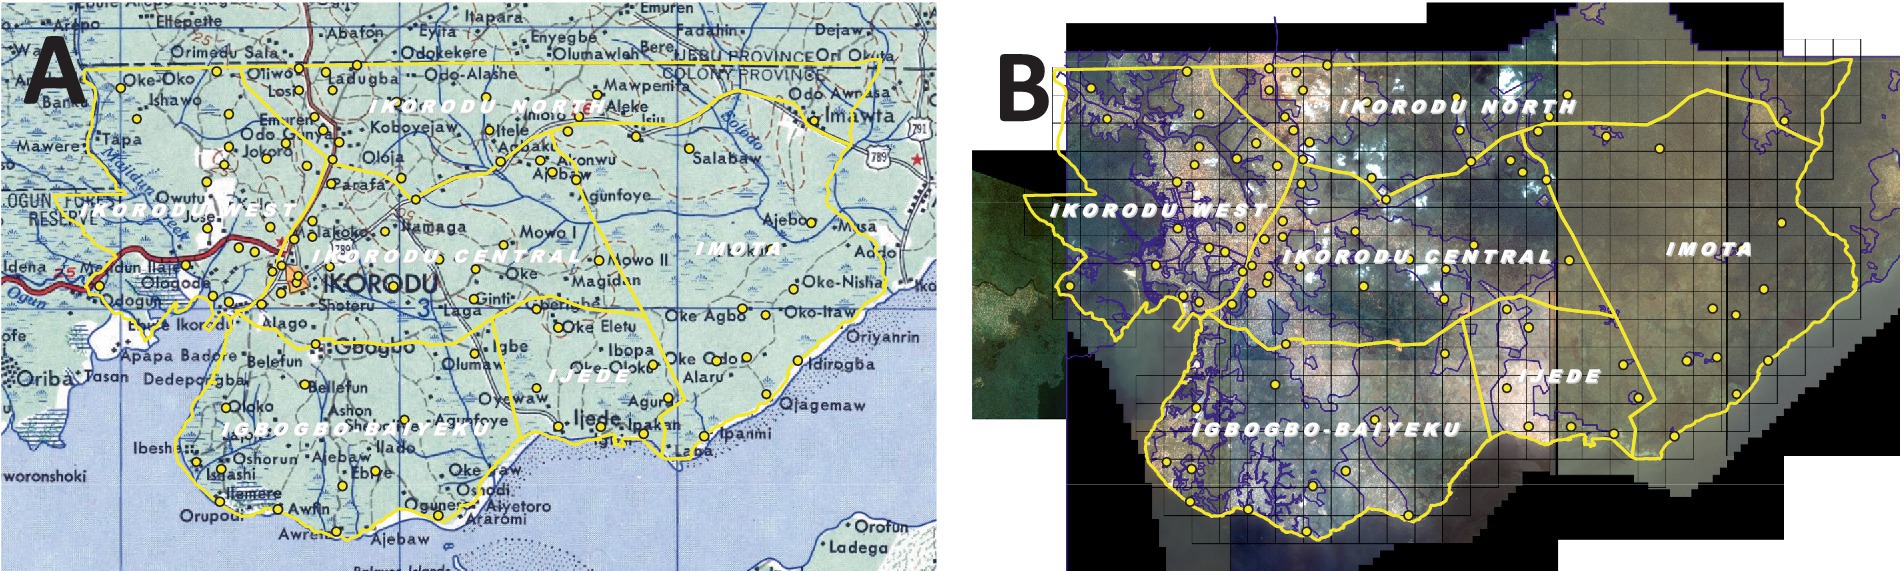
Figure 3. (A) Map of Ikorodu municipality showing neighborhoods (source: Lagos map), sheet NB 31–7 (1963); (B) satellite imagery of Ikorodu showing six (6) LCDAs and sampled neighborhoods.
2.2.4.3 Sample size suitability
The suitability of the data and sample size was examined by the use of the Kaiser-Meyer-Olkin Measure of Sample Adequacy (KMO) and Bartlett’s test of sphericity, in which the KMO result obtained was 0.767, and Bartlett’s significance value is 0. This result confirms the suitability of the data and sample size used for factor analysis (for adequate data, the KMO must be 0.6 minimum, and Bartlett’s significance value must be 0.5 or less).
2.2.4.4 Data analysis
Responses to the field survey were analyzed using statistical software (Statistical Package for Social Sciences, SPSS) and AMOS to identify correlations and key drivers influencing land use decisions.
2.2.4.5 Exploratory factor analysis
EFA was employed as an initial step to reduce the dimensionality of the data and extract the key drivers of decisions for residential development in agricultural and forested lands. Principal Component Analysis (PCA) with varimax rotation was used to identify components or factors with eigenvalues exceeding 1.0, based on an initial pool of 50 variables from the questionnaire. Sixteen (16) factors initially accounted for 67.21% of the total variability in the data. However, the selection of the final components was guided by both statistical and theoretical considerations. A parallel analysis using Monte Carlo Simulation Software and a scree plot indicated that eight (8) components provided a more robust and interpretable solution. These eight components explained 63.69% of the total variance in the data, focusing on the 29 variables with factor loadings of 0.4 or higher (see Table 5). The decision to enforce eight components aligns with theoretical constructs and domain relevance, ensuring the retained factors meaningfully represent the drivers of residential development.
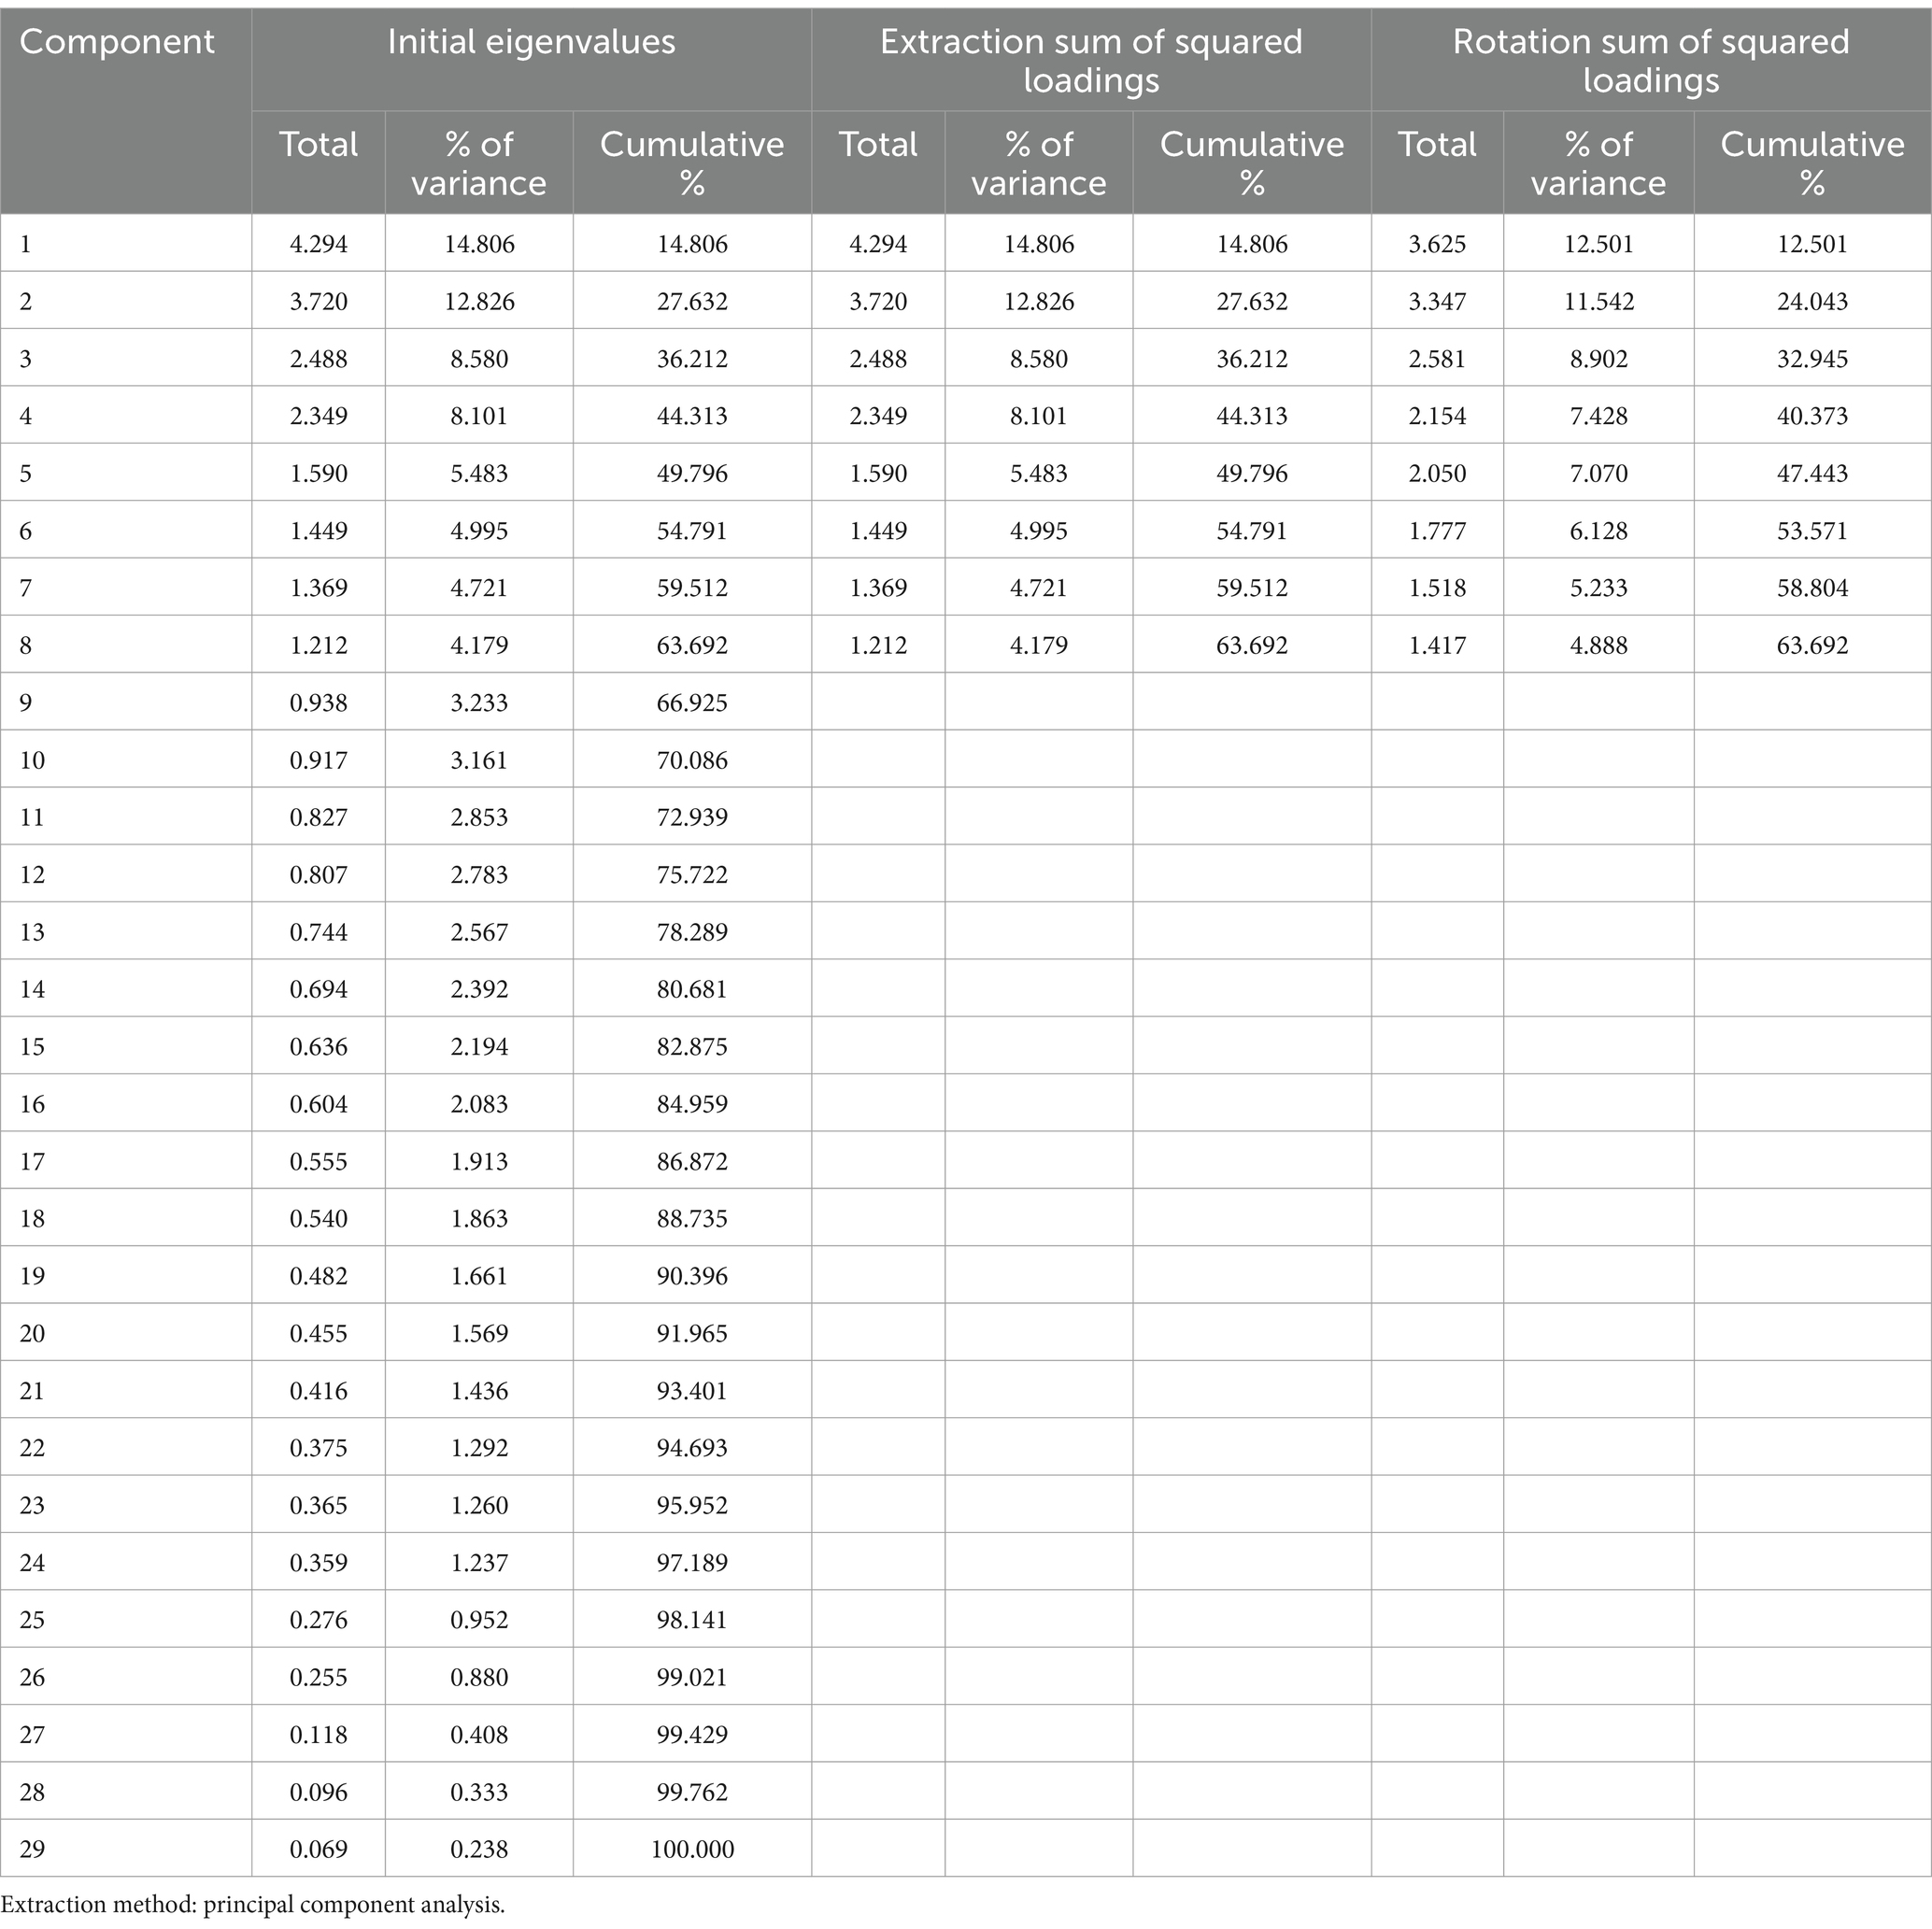
Table 5. Exploratory factor analysis result showing total variance explained.
2.2.4.6 Confirmatory factor analysis
The variable with the highest loadings was used in a CFA using SPSS Amos (version 23) to determine the relationships between the various variables that drive residential development on agricultural land use zones. A close assessment of the Rotated Component Matrix in the Table 6 indicates a cluster of variables with similarity in each of the eight (8) components or factors. These components are intangible or unobserved variables known as “latent variables” on which the theoretical constructs and hypothesis are hinged (e.g., Policy Awareness is a latent variable for indicators like awareness of Building Permits, Regional Plan 1980, etc.).
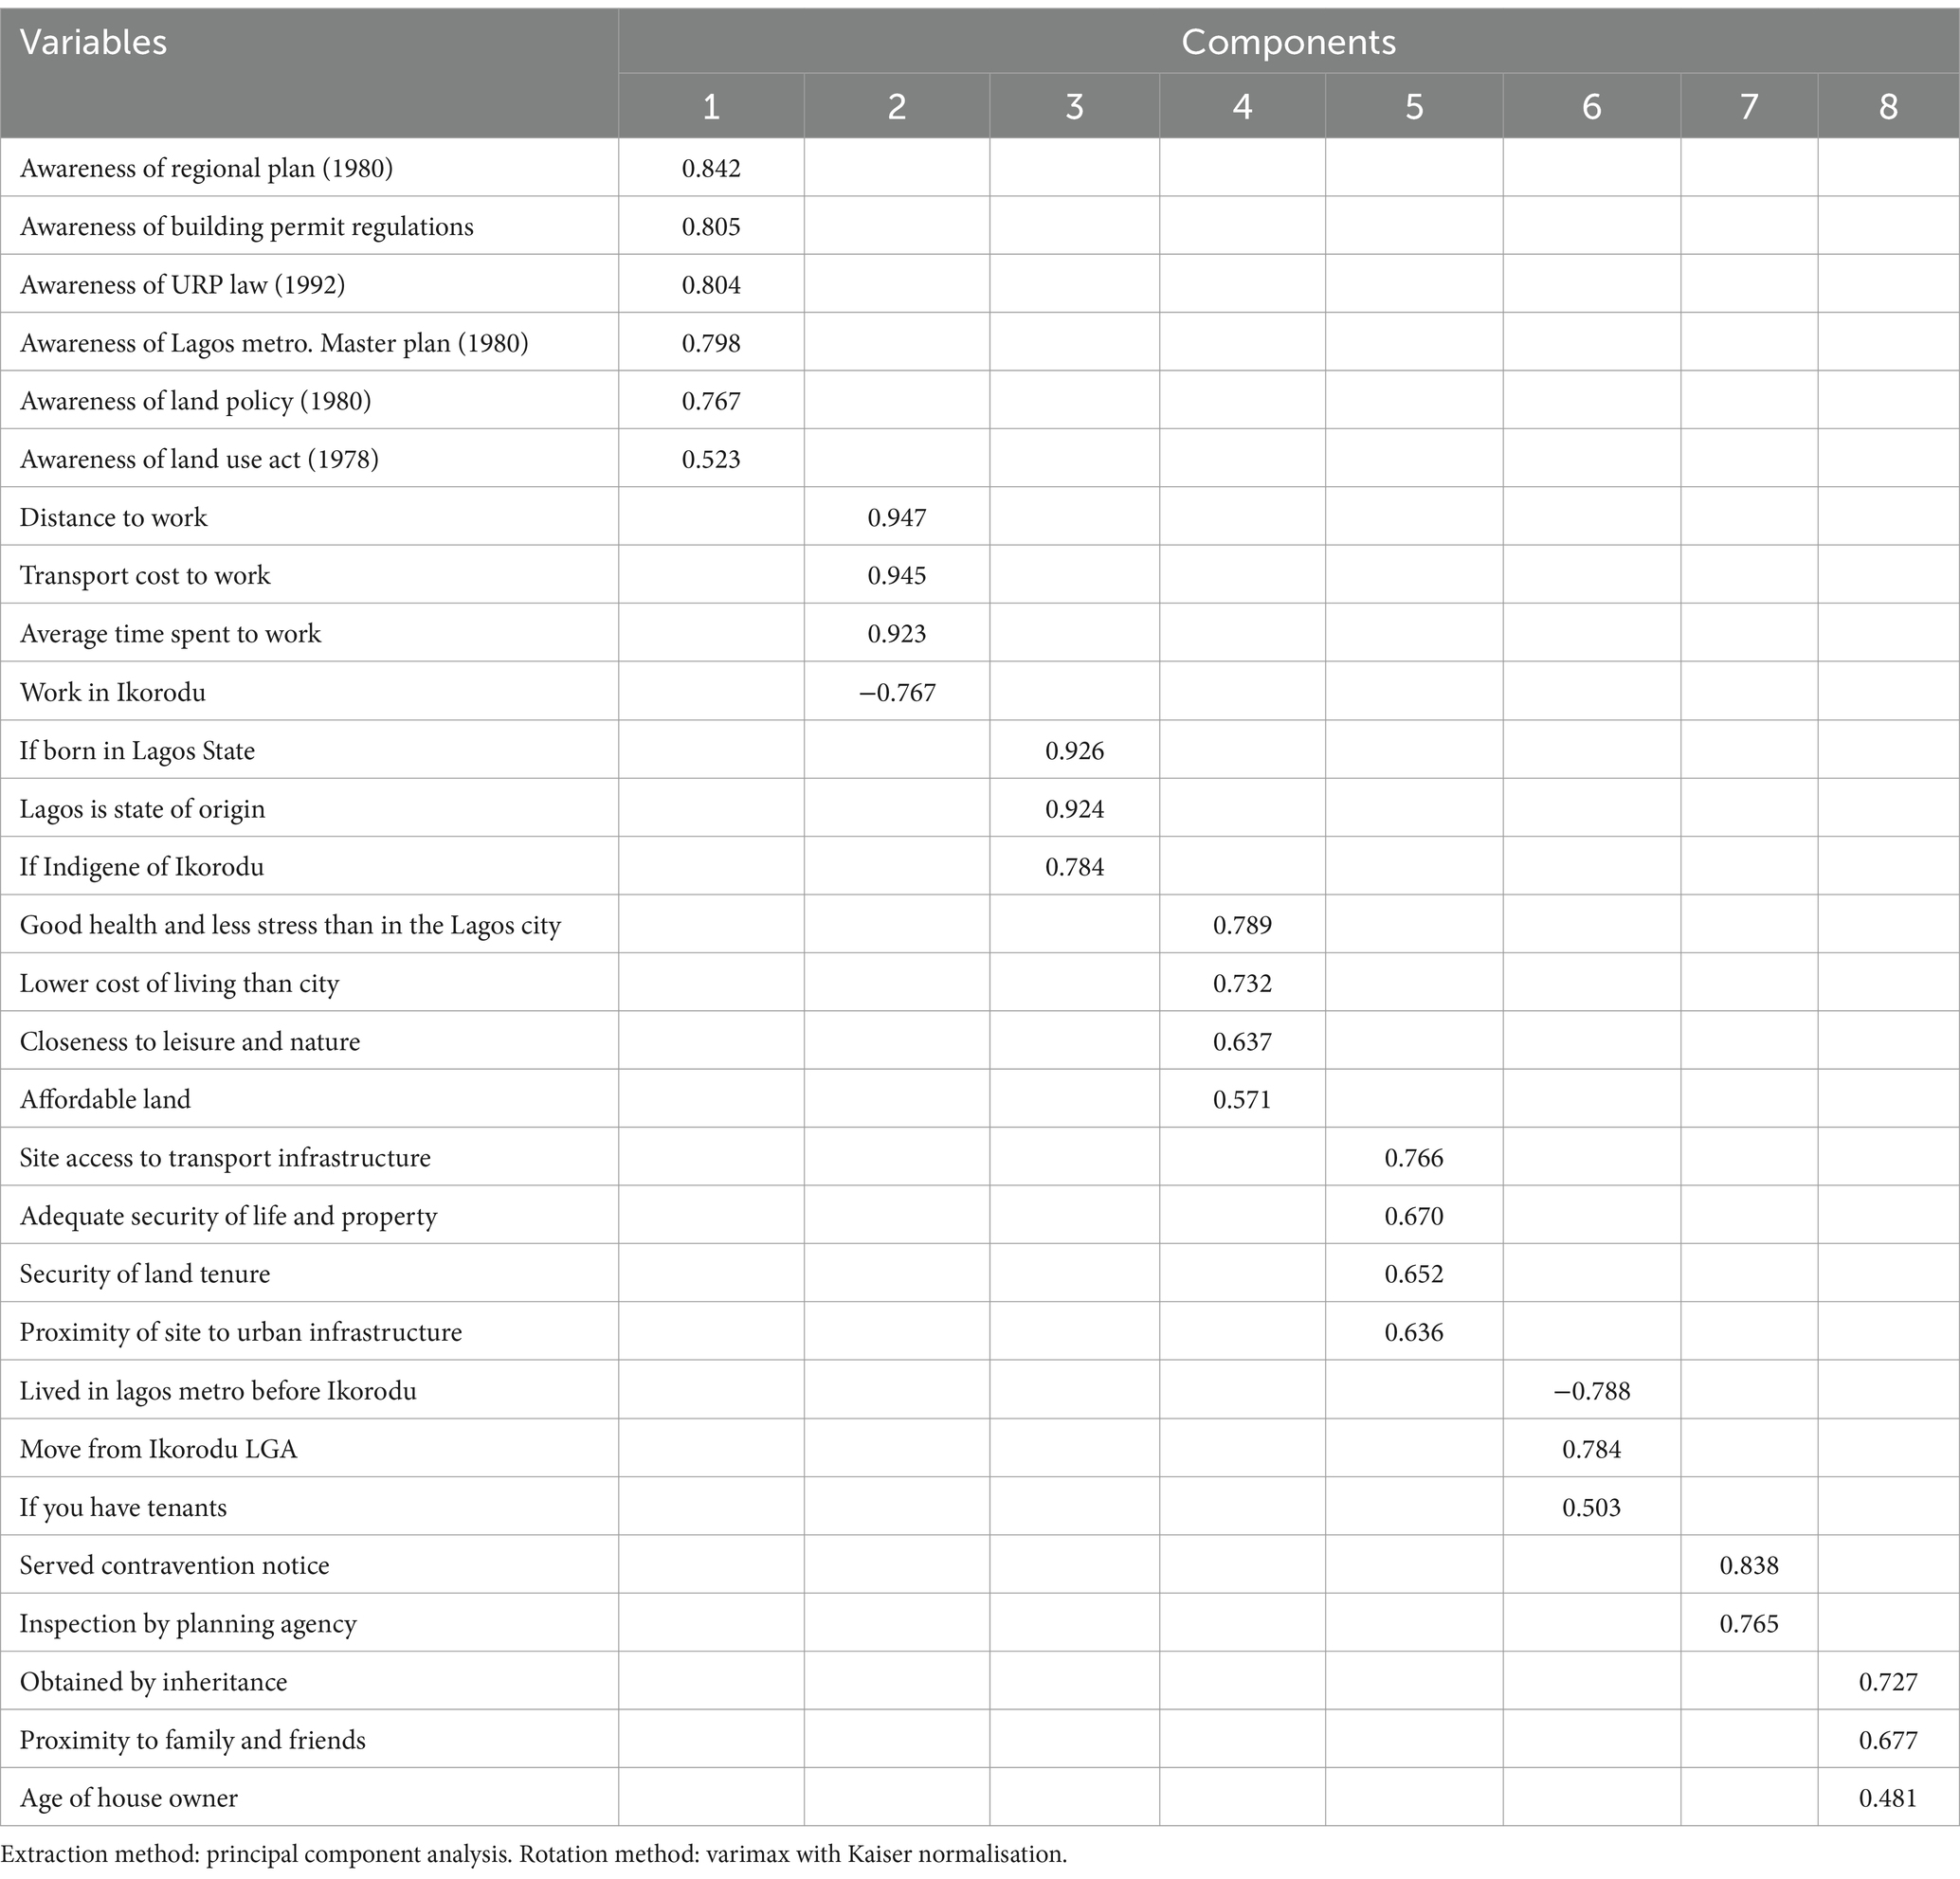
Table 6. Rotated component matrix.
The role of the CFA is to measure the relationship between each variable in the model if they are consistent with existing theoretical models. Each component was named according to the dominant variables consistent with the theoretical constructs. The path model in Figure 4 shows the correlation estimates between each latent variable (in curved lines with arrows on each end) and Regression estimates between the latent and observed variables (unidirectional arrows).
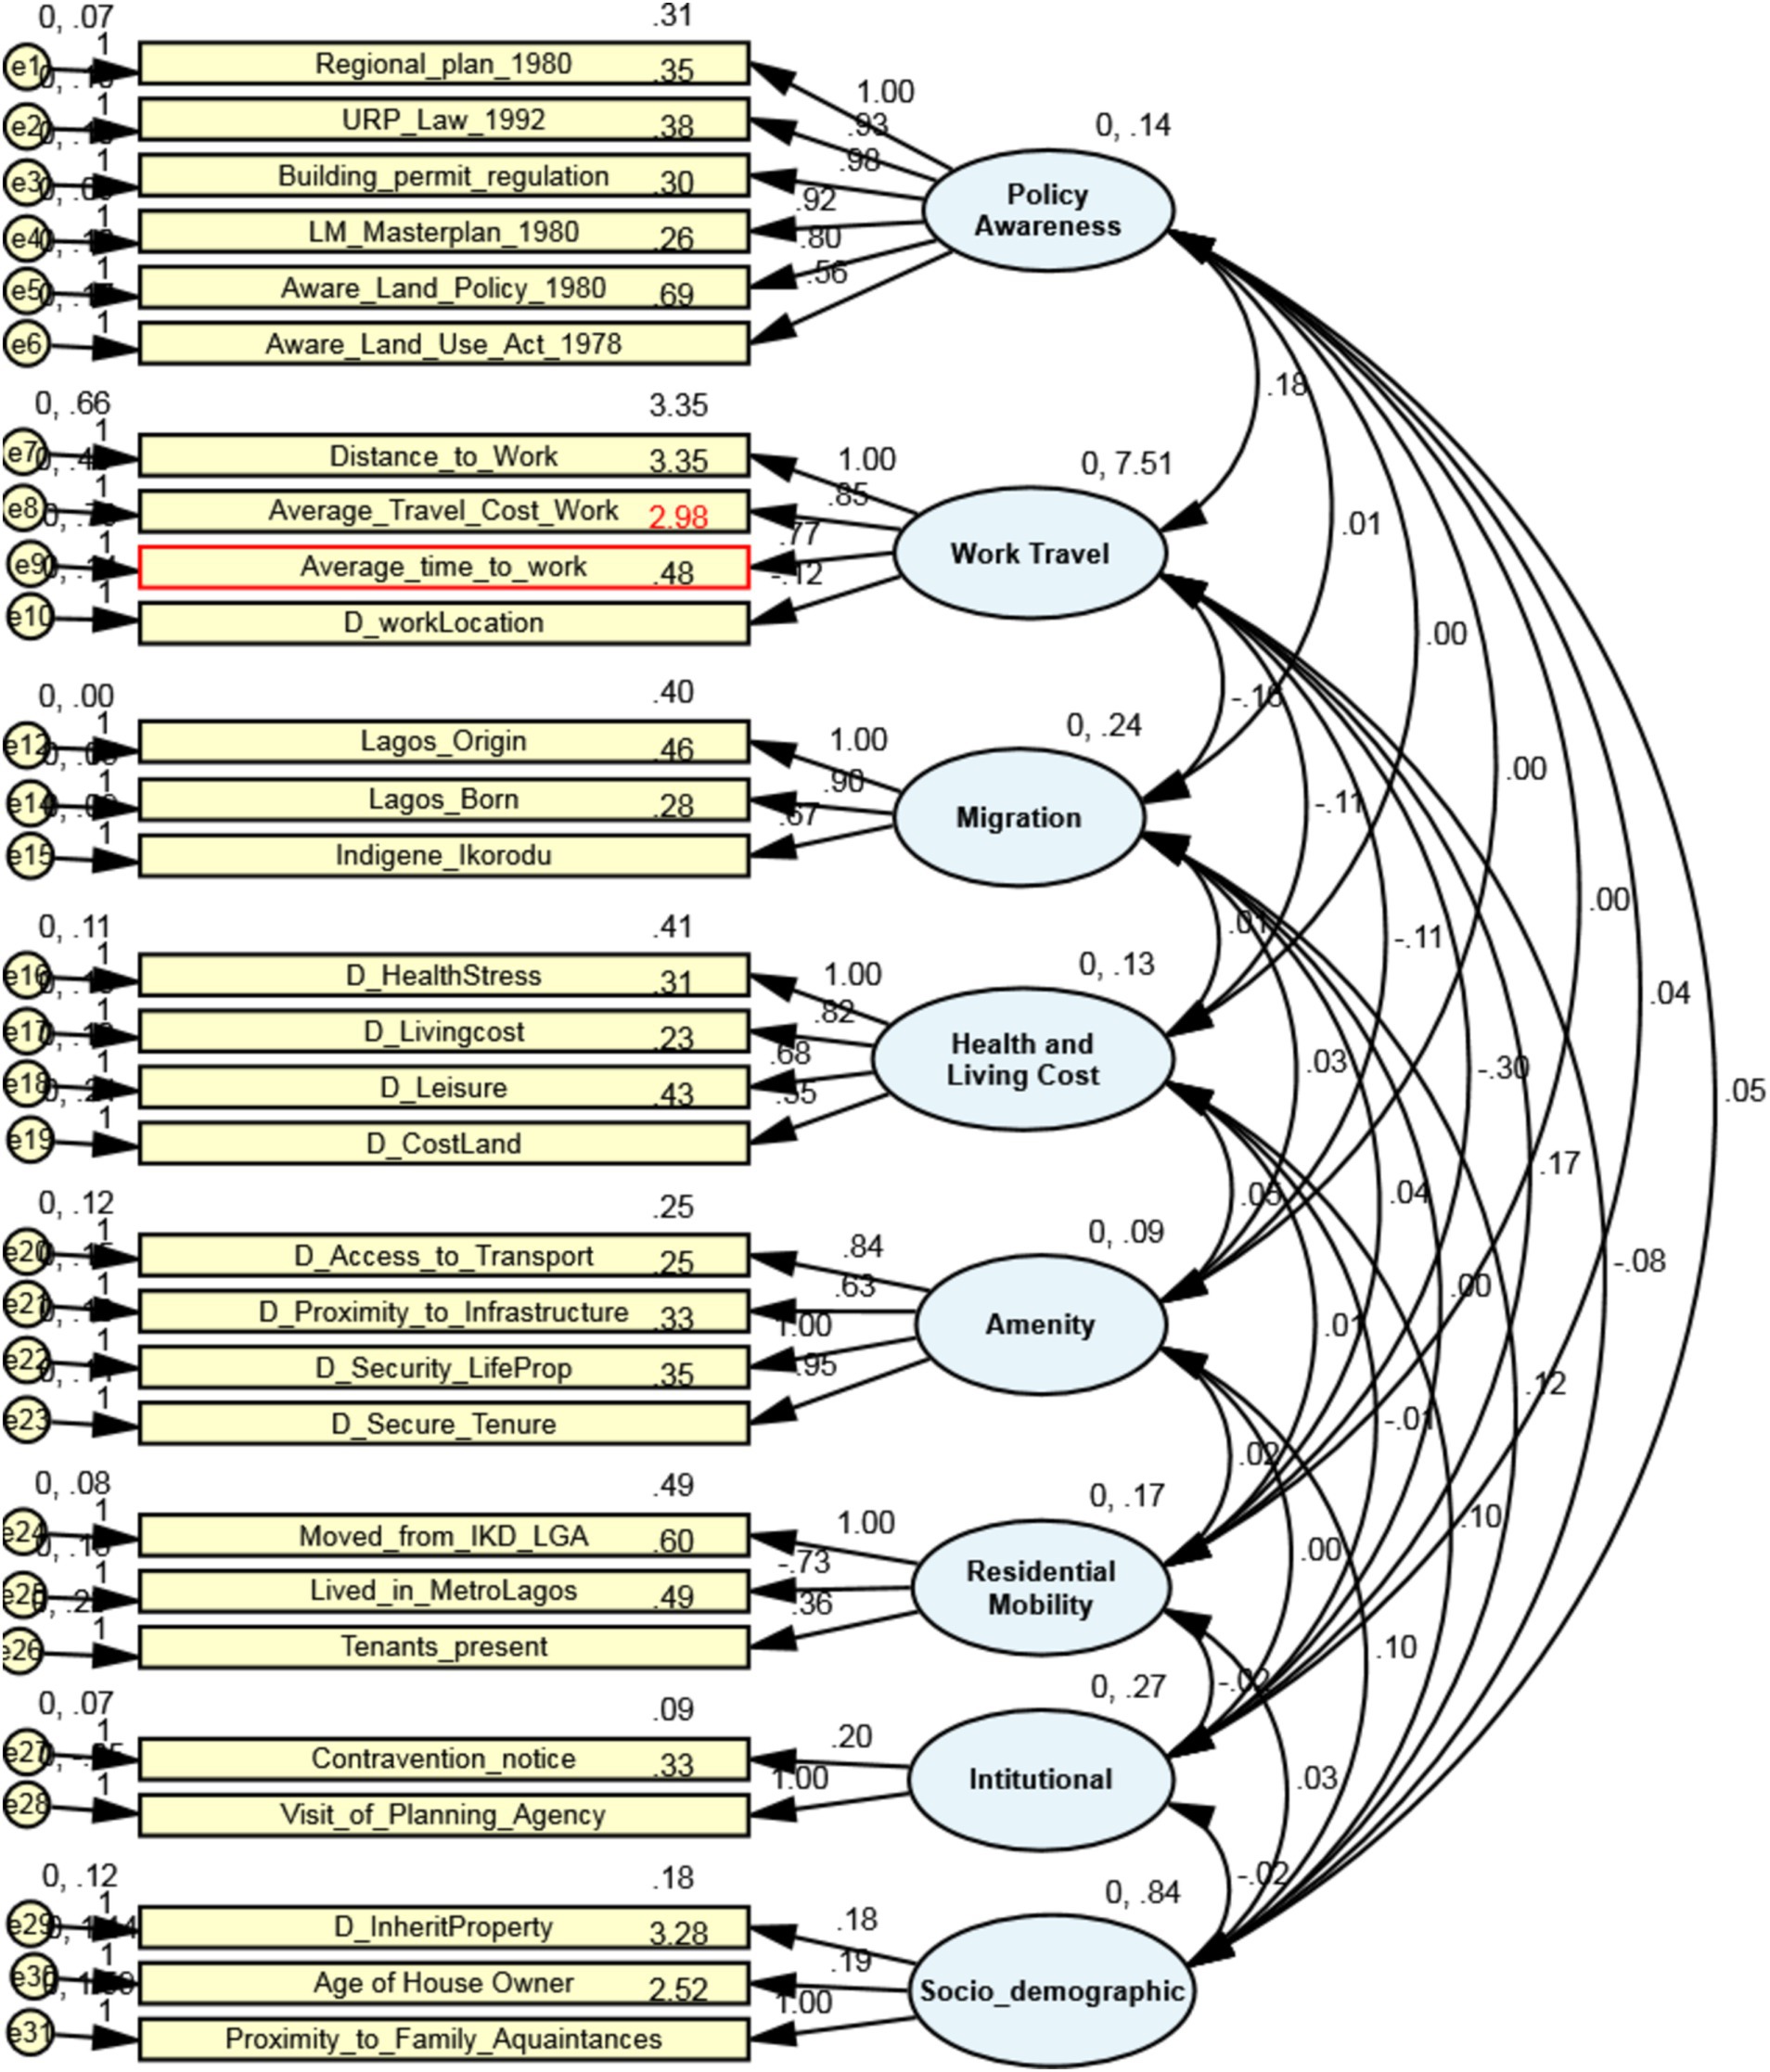
Figure 4. Path model of the confirmatory factor analysis (CFA).
2.2.4.7 Structural equation modelling
SEM was applied to determine the drivers of residential development in Ikorodu’s agricultural and forest lands. While previous studies depended on statistical and econometric models to explain drivers of land use change, these models were limited in handling complex endogenous and exogenous variables associated with land use decisions. This limitation has motivated the application of SEMs in determining the drivers of agricultural land conversion in recent times (Azadi et al., 2015). SEM, or covariance structure analysis, is a statistical technique to quantitatively assess cause-effect relationships among variables. SEM measures the relationships between observed variables and unobserved (latent variables) and the relationship between latent variables (Hair et al., 2021). Latent variables are research constructs or abstractions, which may be impossible to directly measure but observed (e.g., Ethnic prejudice, travel behavior, user perceptions, etc.). SEM was applied using SPSS Amos version 23 Software. SEM requires five essential steps: model specification, identification, model estimation, model fitting, and interpretation of estimates. Lastly, model re-specification is used if it is poor or reporting is good (Teo et al., 2013; Kline, 2016). Based on the result of the CFA, the SEM developed for the study has one (1) dependent manifest variable (Y), eight exogenous independent latent variables (Z), and 29 endogenous independent manifest variables (X) (see Table 7).
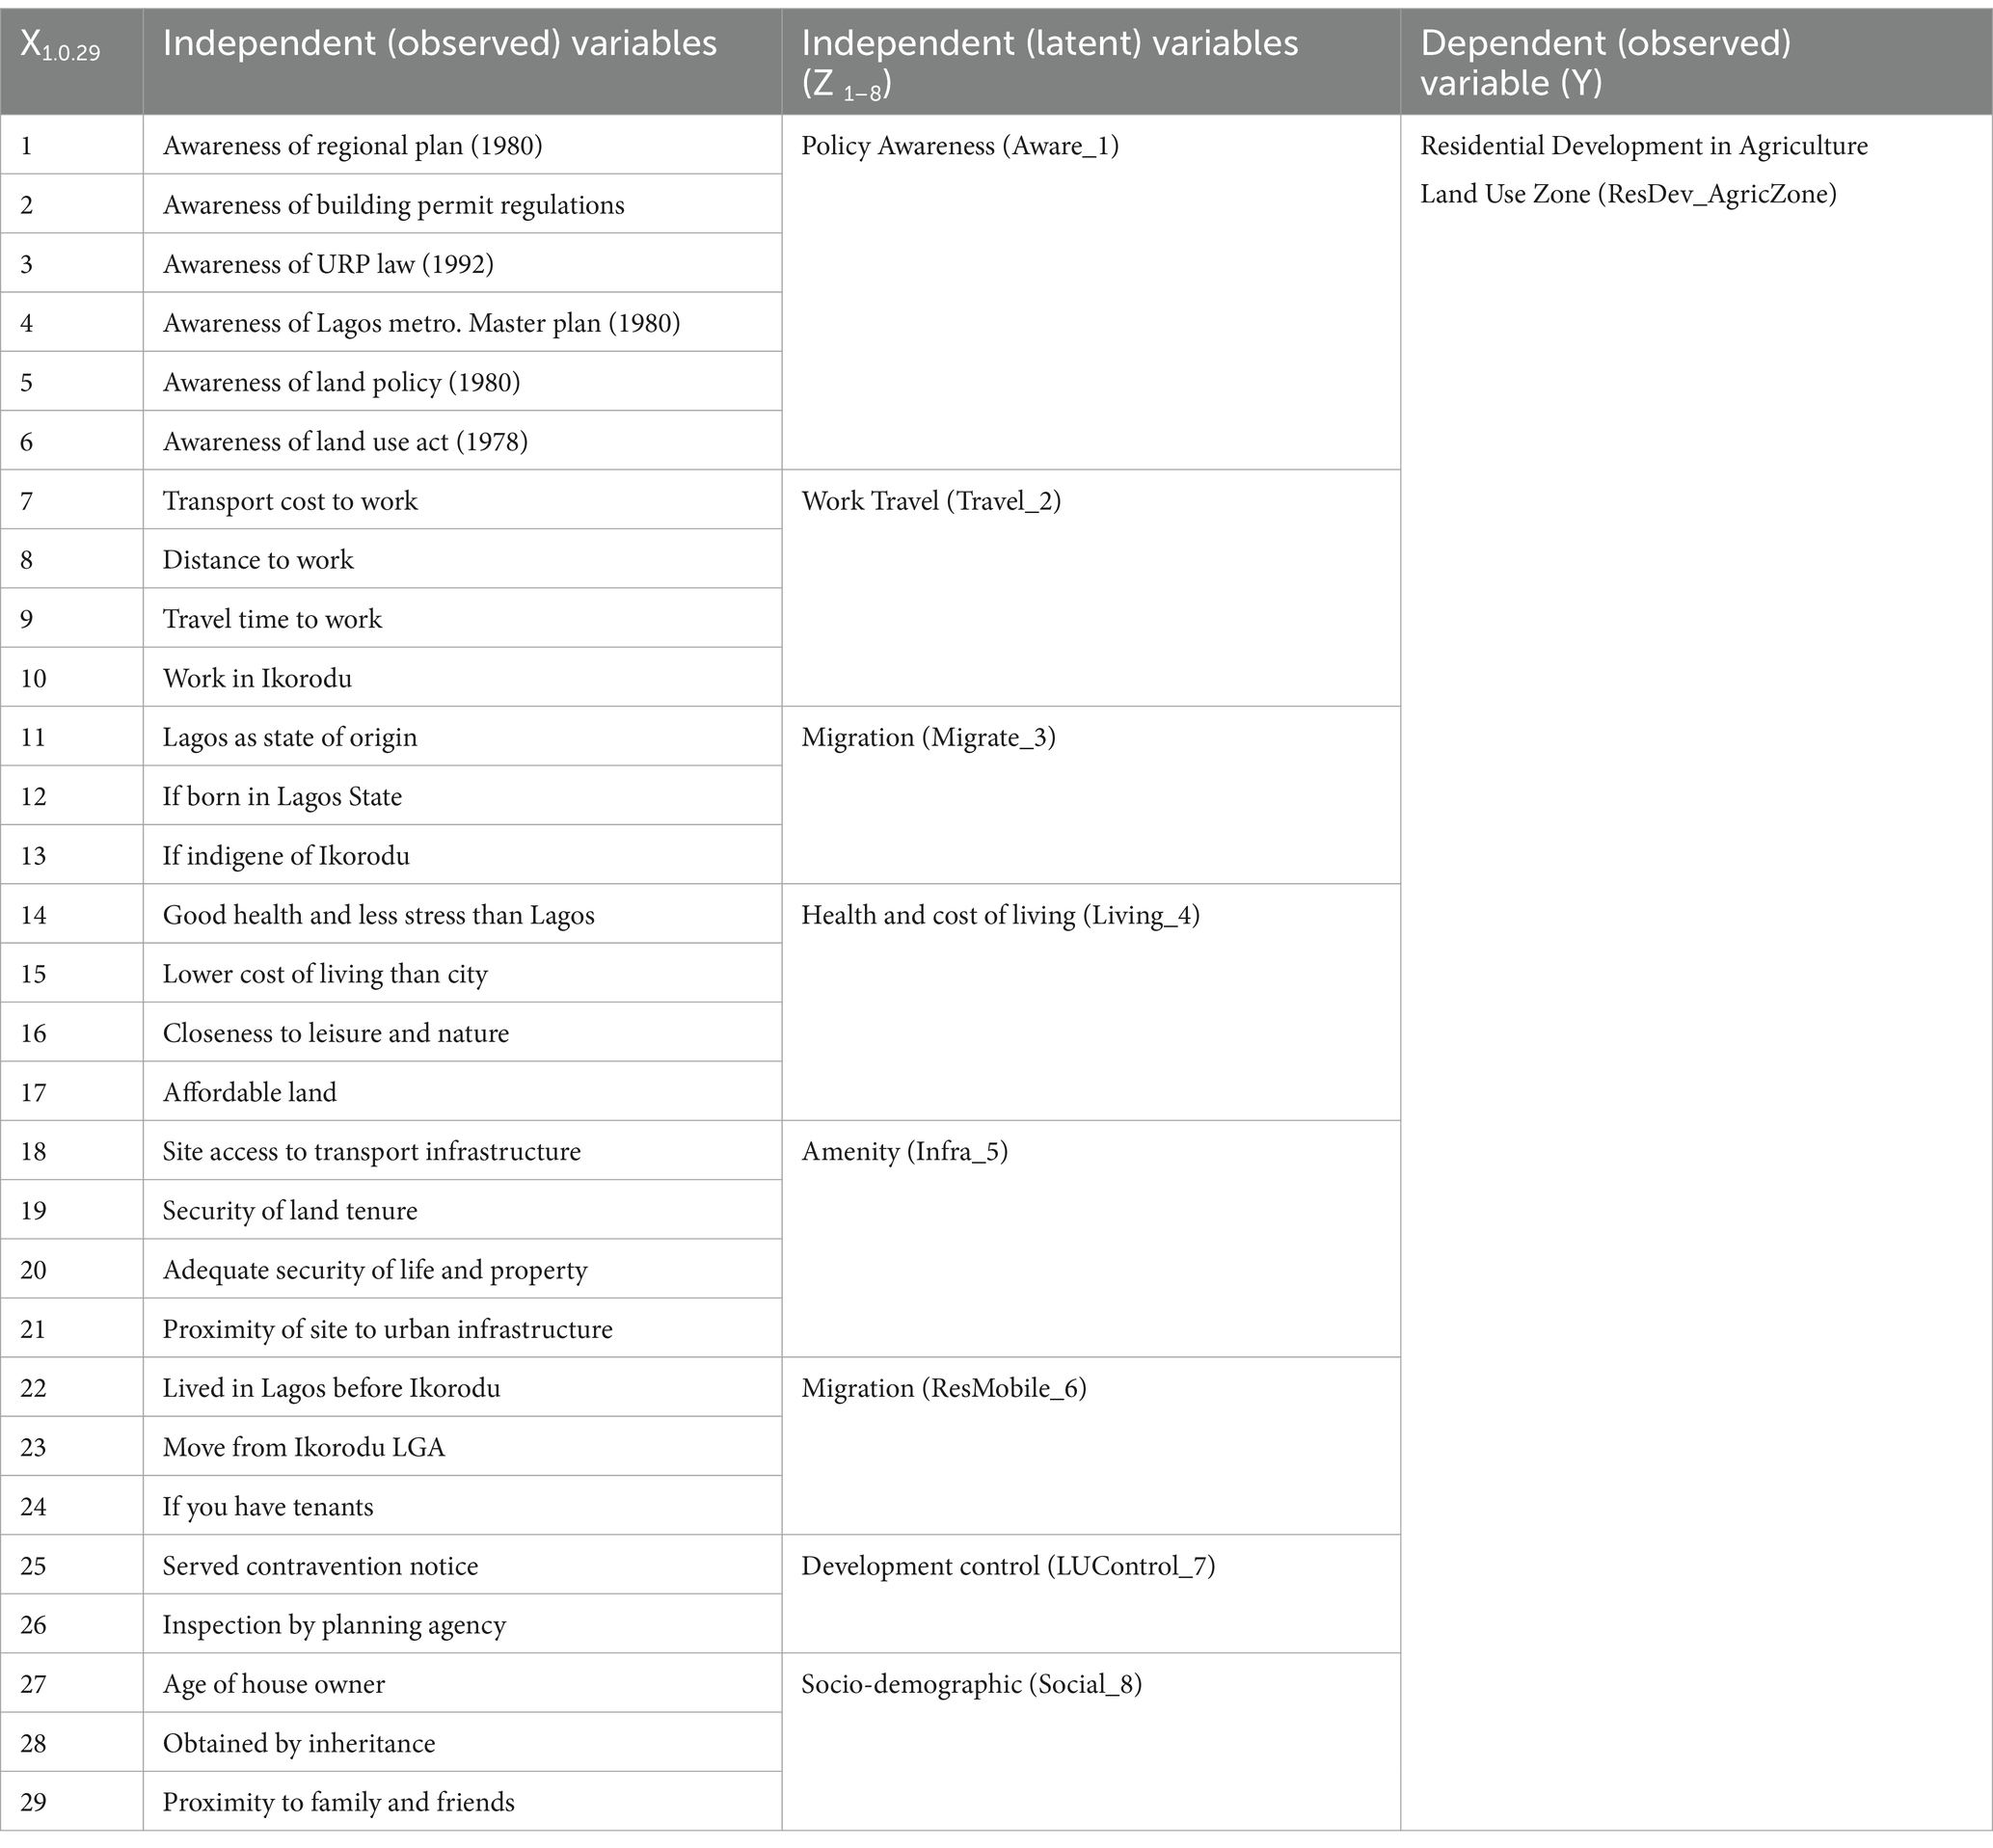
Table 7. Variables specification.
2.2.5 Model specification
The “Model of Residential Growth” developed by Chapin and Weiss (1968) was modified for this research as follows:
Using the model above, the dependent variable is land use change from agricultural and forest land to residential, and the explanatory variables (X1, X2, X3…Xn) are factors responsible for change (e.g., proximate factors like socio-demographic, work-travel, etc.,) and regression coefficients are , while the residual or random error term is . The multivariate regression model in Equation 1 is consistent with the structural level of the SEM in which the latent variable Z predicts the observed dependent variable Y. Moreover, (Z 1…8) are the mediating variables between the observed (X 1…29) and the dependent variable (Y).
The residential growth model was adapted for this research as follows:
Structural model:
Where, y = Residential Development in Agro-ecological Zone, β = coefficient of regression of Z predicting y, Z1 = Policy Awareness, Z2 = Work Travel, Z3 = Migration, Z4 = Health and Living Cost, Z5 = Amenity, Z6 = Residential Mobility, Z7 = Development Control, Z8 = Socio-demographic
Measurement model:
Hence, the new structural equation model for residential development in the agricultural and forested land is proposed as follows:
Where:
y = (n x 1) matrix or column vector of cases or sample size (n = 322).
X = (n x p) matrix, where p is the total number of observed variables (p = 29).
β = (p x 1) matrix of unknown parameters (coefficient) to be estimated.
ε = (nx1) matrix of residual or error.
On model identification, the SEM model is over-identified, with 30 endogenous variables and 38 exogenous variables, totaling 68 parameters. It has positive degrees of freedom (df = 370), which is the measure for identification. Moreover, its Chi-Square test shows it is statistically significant (X2 = 552.351, p = 0.000). Therefore, the model is suitable for hypothesis testing.
2.2.6 Model fitting and summary
The validity of the structural equation model (SEM) was assessed using a combination of global fit indices; while the Chi-Square test statistic (X2 = 552.351, p = 0.000) indicates statistical significance, it is acknowledged that large sample sizes (n = 322) can inflate the Chi-Square value, potentially overestimating poor fit (Kline, 2016). Therefore, additional fit indices were employed to provide a more comprehensive evaluation of the model’s goodness of fit, as shown in Table 8.
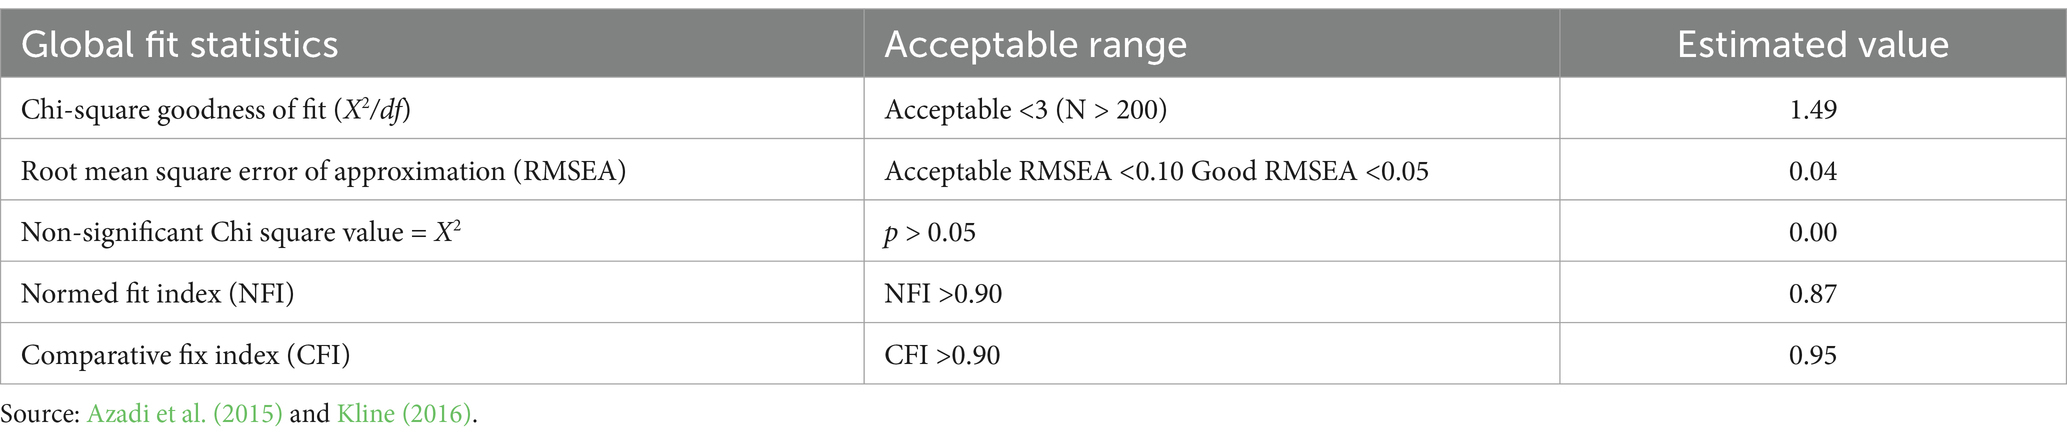
Table 8. Model fit statistics.
The model satisfies the five commonly recommended fit criteria. The ratio of the Chi-Square statistics to degrees of freedom (1.49) is below the recommended threshold of 3, indicating an acceptable fit for large sample sizes. Root Mean Square Error of Approximation (RMSEA) value of 0.04 is within the “good fit” range (<0.05). Although the p-value is 0.00, which is statistically significant, this is expected given the sample size and does not necessarily indicate poor model fit. Normed Fit Index (NFI) of 0.87, while slightly below the threshold of 0.90, is close to the acceptable range and consistent with other fit indices. A comparative Fit Index (CFI) value of 0.95 exceeds the recommended threshold of 0.90, indicating a strong comparative fit. By considering multiple indices beyond the Chi-Square statistic, the results demonstrate an overall acceptable fit for the model, balancing the limitations of individual measures with a holistic assessment of goodness-of-fit.
3 Results
This section presents the detailed analysis results of the impacts and proximate drivers of urban sprawl in Lagos’ peri-urban areas, focusing on converting statutory agricultural land in Ikorodu. Results were derived from a multidisciplinary approach that combines spatial analysis of land use change patterns through the application of remote sensing and fractal analysis and modeling of the proximate behavioral and socioeconomic factors that drive the changes through the application of SEM.
3.1 Urban expansion and loss of agricultural lands
The land use and land cover change analysis of Ikorodu for 1984, 200, and 2016, as presented in Figure 5 and Table 9, reveals significant growth in urban land and diminution of agricultural and forested lands. On the one hand, Built-up areas increased from 1,819.26 hectares in 1984 to 14,580.72 hectares in 2016, about 127.46% over the 32-year study period, revealing an unambiguous transformation in the landscape. On the other hand, agricultural and forested lands lost 32.65 and 51.29% consecutively during the same period. The loss of agricultural and forested lands underscores the pressure of urban expansion on local food production and ecosystem service provisioning, which has implications for achieving SDG 2. Also, forested land loss inhibits biodiversity and ecological balance, having implications for achieving SDG 15. This study’s result aligns with previous studies’ findings, which have revealed similar trends of agricultural land loss due to peri-urban expansion in SSA. For example, in Uganda, 66.7% of Kampala’s peri-urban agricultural lands were encroached upon by urban expansion between 1989 and 2015 (Williamson and Feeney, 2001; Muchelo et al., 2024). Similarly, the PUAs of Greater Cairo lost 51.7% of its agricultural land to urban encroachment between 2001 and 2021(Salem and Tsurusaki, 2024), revealing a common trend in the global south.
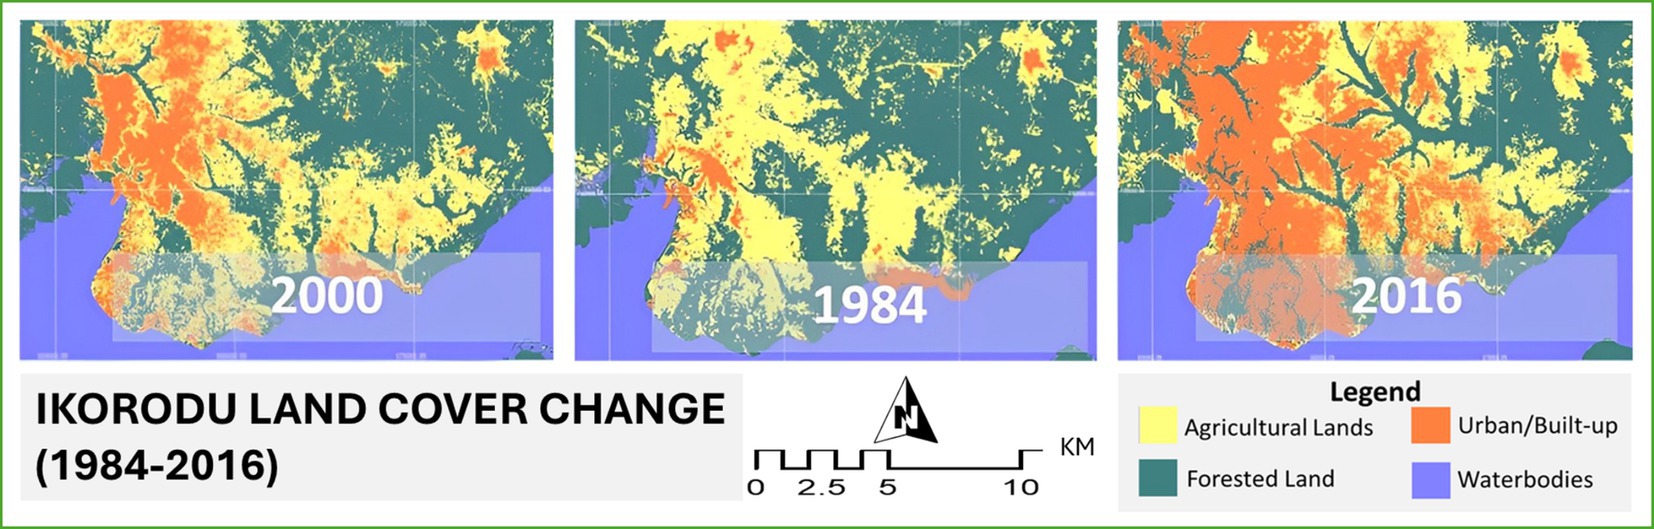
Figure 5. Ikorodu land cover change (1984–2016).
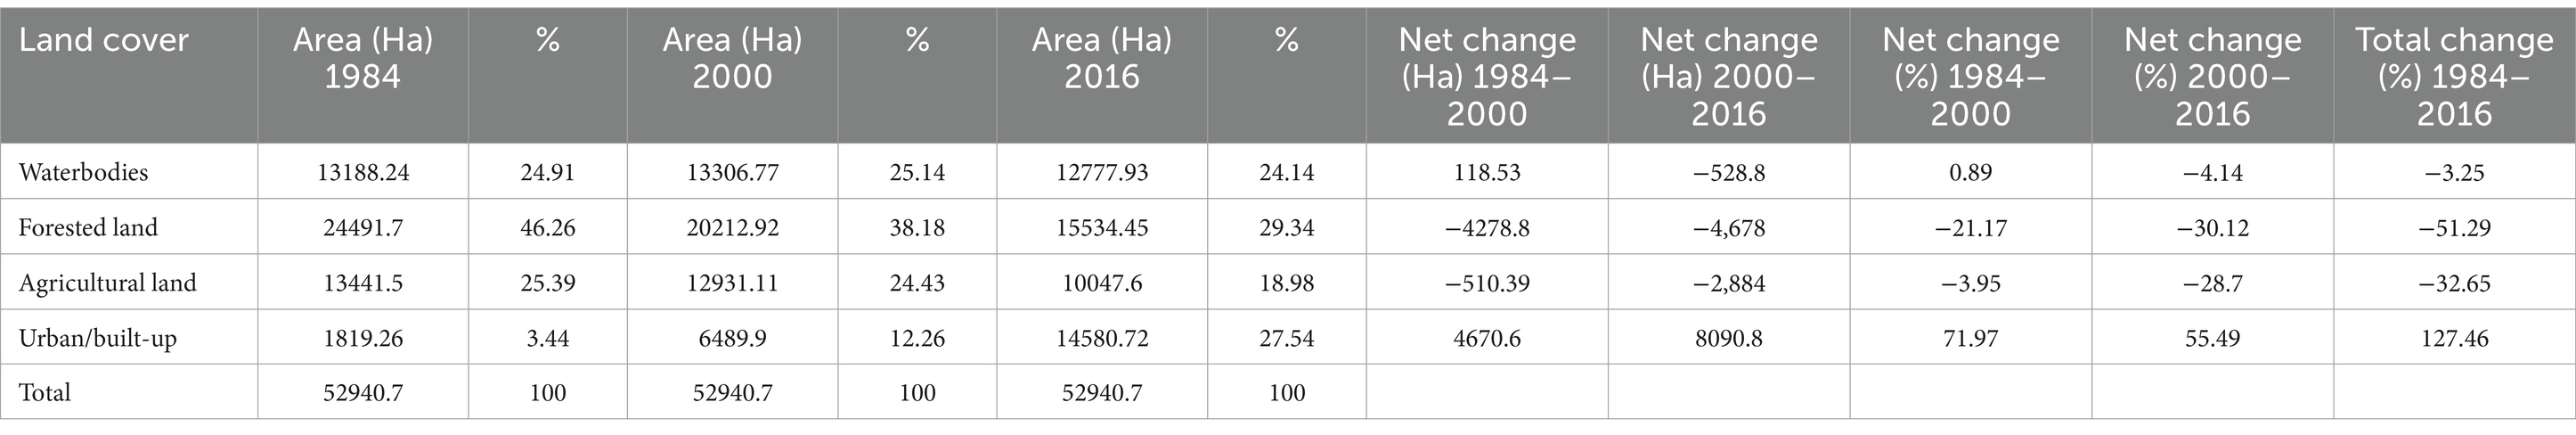
Table 9. Ikorodu land cover change (1984–2016).
3.2 Sprawl detection through fractal analysis
Further investigation of the landscape pattern using fractal analysis shows fragmentation. This is evident from the patchy and scattered agricultural lands caused by the increasingly sprawling unplanned residential development. The fractal dimension for 1984 was 0.94 value, while the values for 2000 and 2016 were 0.96 and 1.56, respectively. Highly fragmented built-up areas have small fractal dimensions, while compaction and regularity will attract a higher figure (Thomas et al., 2008). Metastatic growth of settlement will have a fractal dimension value between 1.26 and 1.54, while values between 1.54 and 1.78 indicate rapid growth and metastatic consolidation. Fractal dimension values close to 1.0 or less show dispersed urban areas, while those close to 2.0 are consolidated compact settlements (Encarnação et al., 2012). This spatial pattern of development has far-reaching implications for the existing farmlands, which are fragmented and finally displaced. Such loss of valued cultivated lands to urban development has an enormous consequence on the ecosystem provisioning food production services in the study area (see Figure 6).
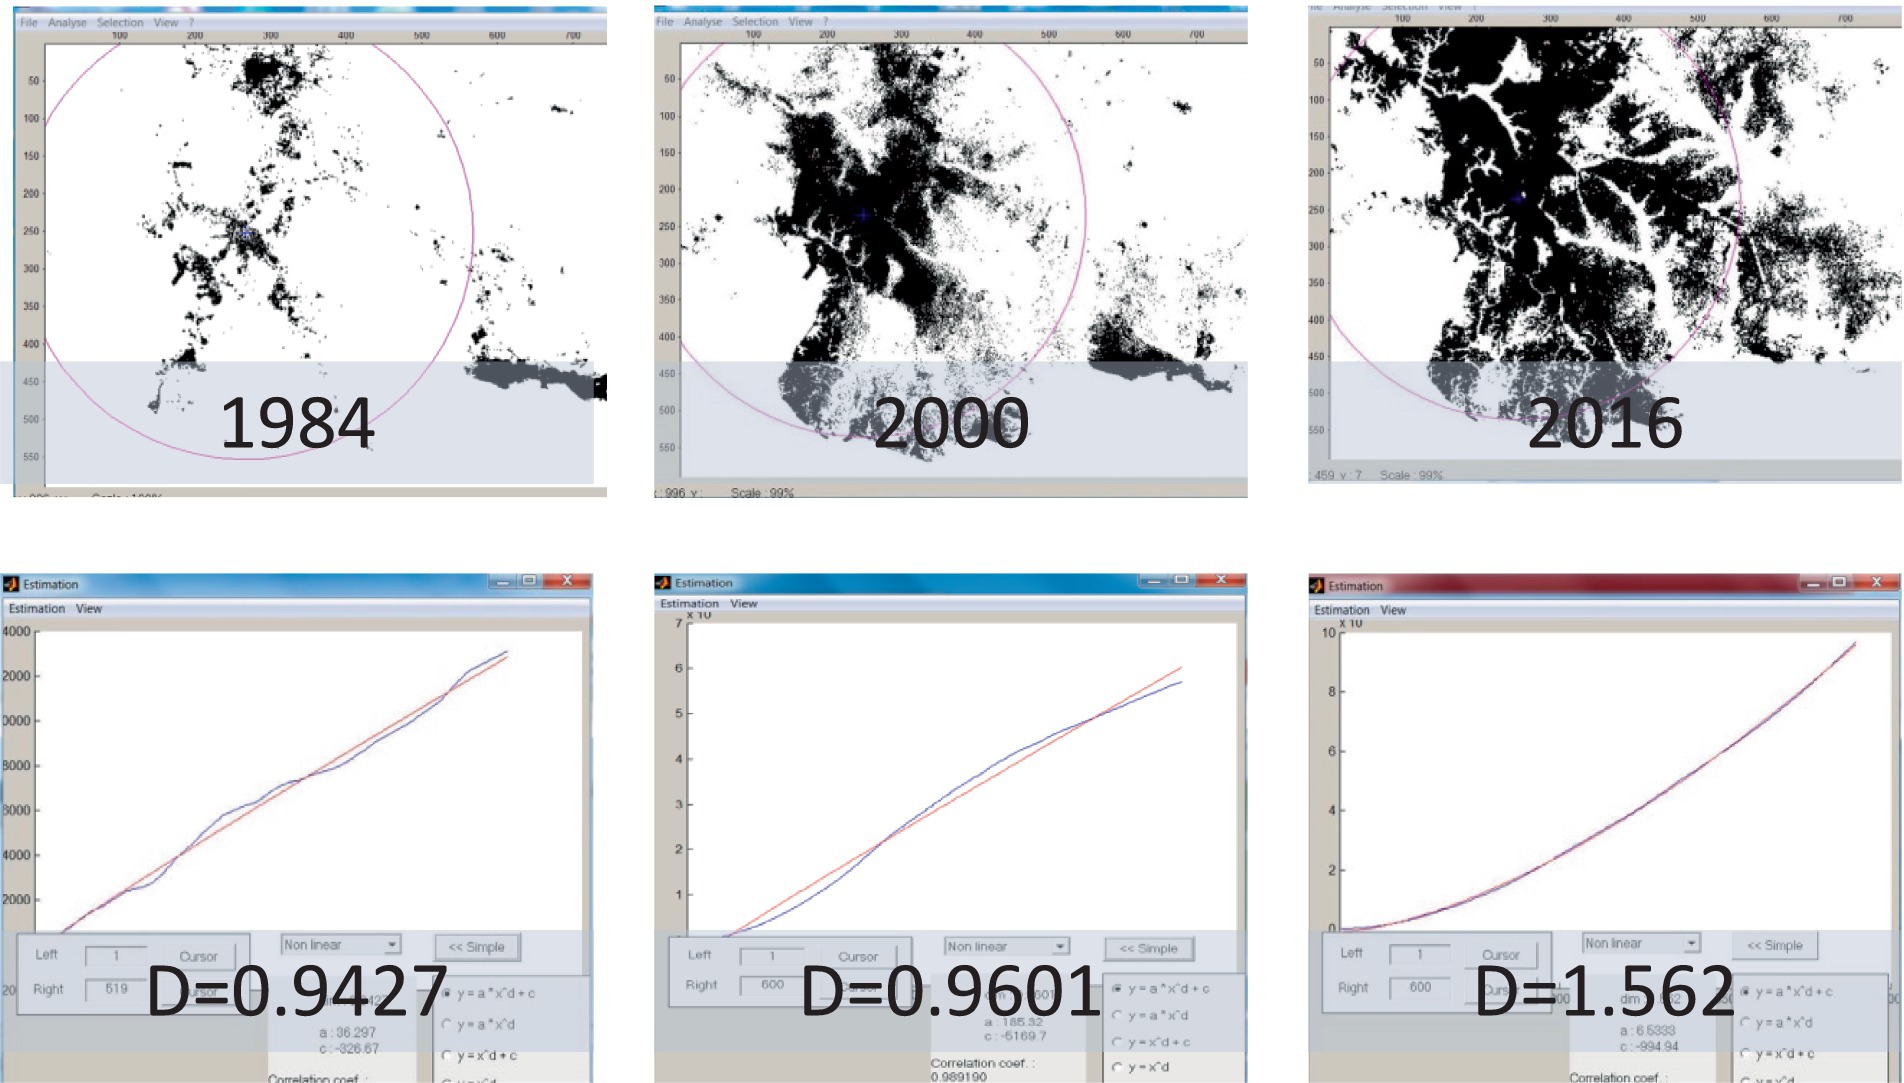
Figure 6. Fractal dimension of the urban spatial pattern (1984–2016).
3.3 Agricultural land fragmentation and capacities for food security
In the study, the decline in agricultural land per capita was juxtaposed with the population increase, which paints a worrying picture for food security. Table 10 shows that agricultural land per capita declined from 0.08 to 0.01 hectares per capita, revealing how urban expansion diminishes land vital for food production, with potential long-term implications for the cities’ sustainability.
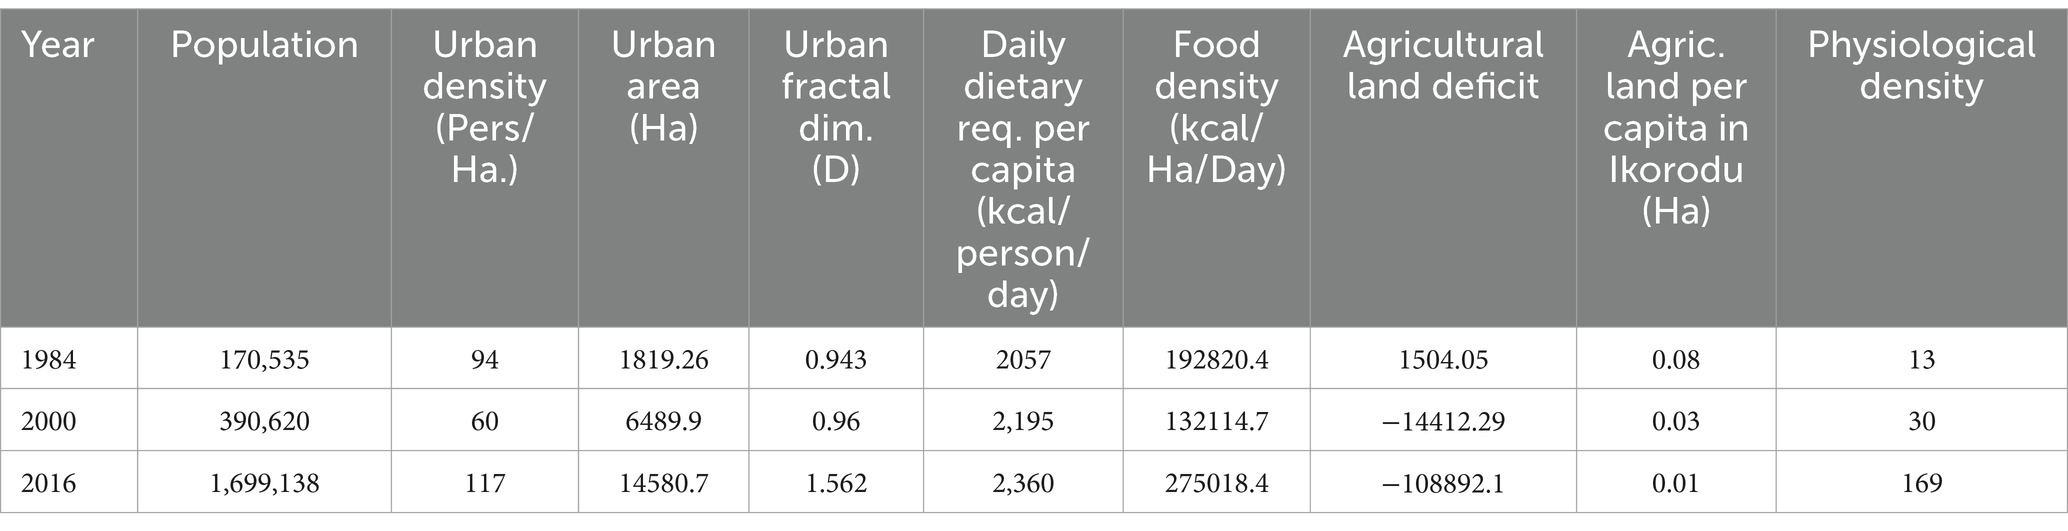
Table 10. Agricultural land required for providing daily dietary requirements.
The result also confirms a continuous decline in the potential of the available agricultural land to provide the daily dietary requirement per person for Service Benefiting Areas (SBAs). The food density of Ikorodu increased from 192,820 kcal/hectare/day to 275018.36 kcal/hectares/day while the agricultural land per capita (ALPC) fell below the absolute minimum, i.e., from 0.08 hectare per capita to 0.01 hectares per capita as seen in Table 10. The implication is that the minimum land required to feed a single person dropped from 0.08 in 1984 to 0.01 in 2016, which is far below the absolute minimum of 0.07 hectares specified (Myers, 1999; Goswami and Nishad, 2017), even though the food supply to Ikorodu could be omnidirectional, directional or decoupled, the fact remains that this an indication of food insecurity.
Fragmentation and displacement of agricultural land are rarely noticed without spatiotemporal analysis of land cover change. However, the magnitude of change is better understood when comparisons are made from local to global scales. Comparing the findings of this study with global trends shows that Ikorodu’s experience resonates with broader land cover change patterns of PUAs from urban expansion, often at the expense of ecological and agricultural lands (Seto et al., 2011; Güneralp and Seto, 2013), as can be revealed in recent studies from Ghana, Uganda and Egypt (Muchelo et al., 2024; Salem and Tsurusaki, 2023; Sumbo et al., 2023).
Figure 7 shows the gradual decline of ALPC at global, continental, and national scales. The global decline is an aggregation of local, national, and regional land cover changes due to urban expansion. Globally, ALPC decreased from 1.45 hectares in 1961 to 0.61 hectares in 2021, while Africa’s ALPC reduced from 4.20 hectares to 0.83 hectares during the same period. At national levels, Nigeria’s ALPC decreased significantly from 1.18 hectares in 1961 to 0.32 hectares in 2021 compared to South Africa’s decrease from 5.96 hectares to 1.62 hectares. These decline trends across Africa are red flags for urgent action.
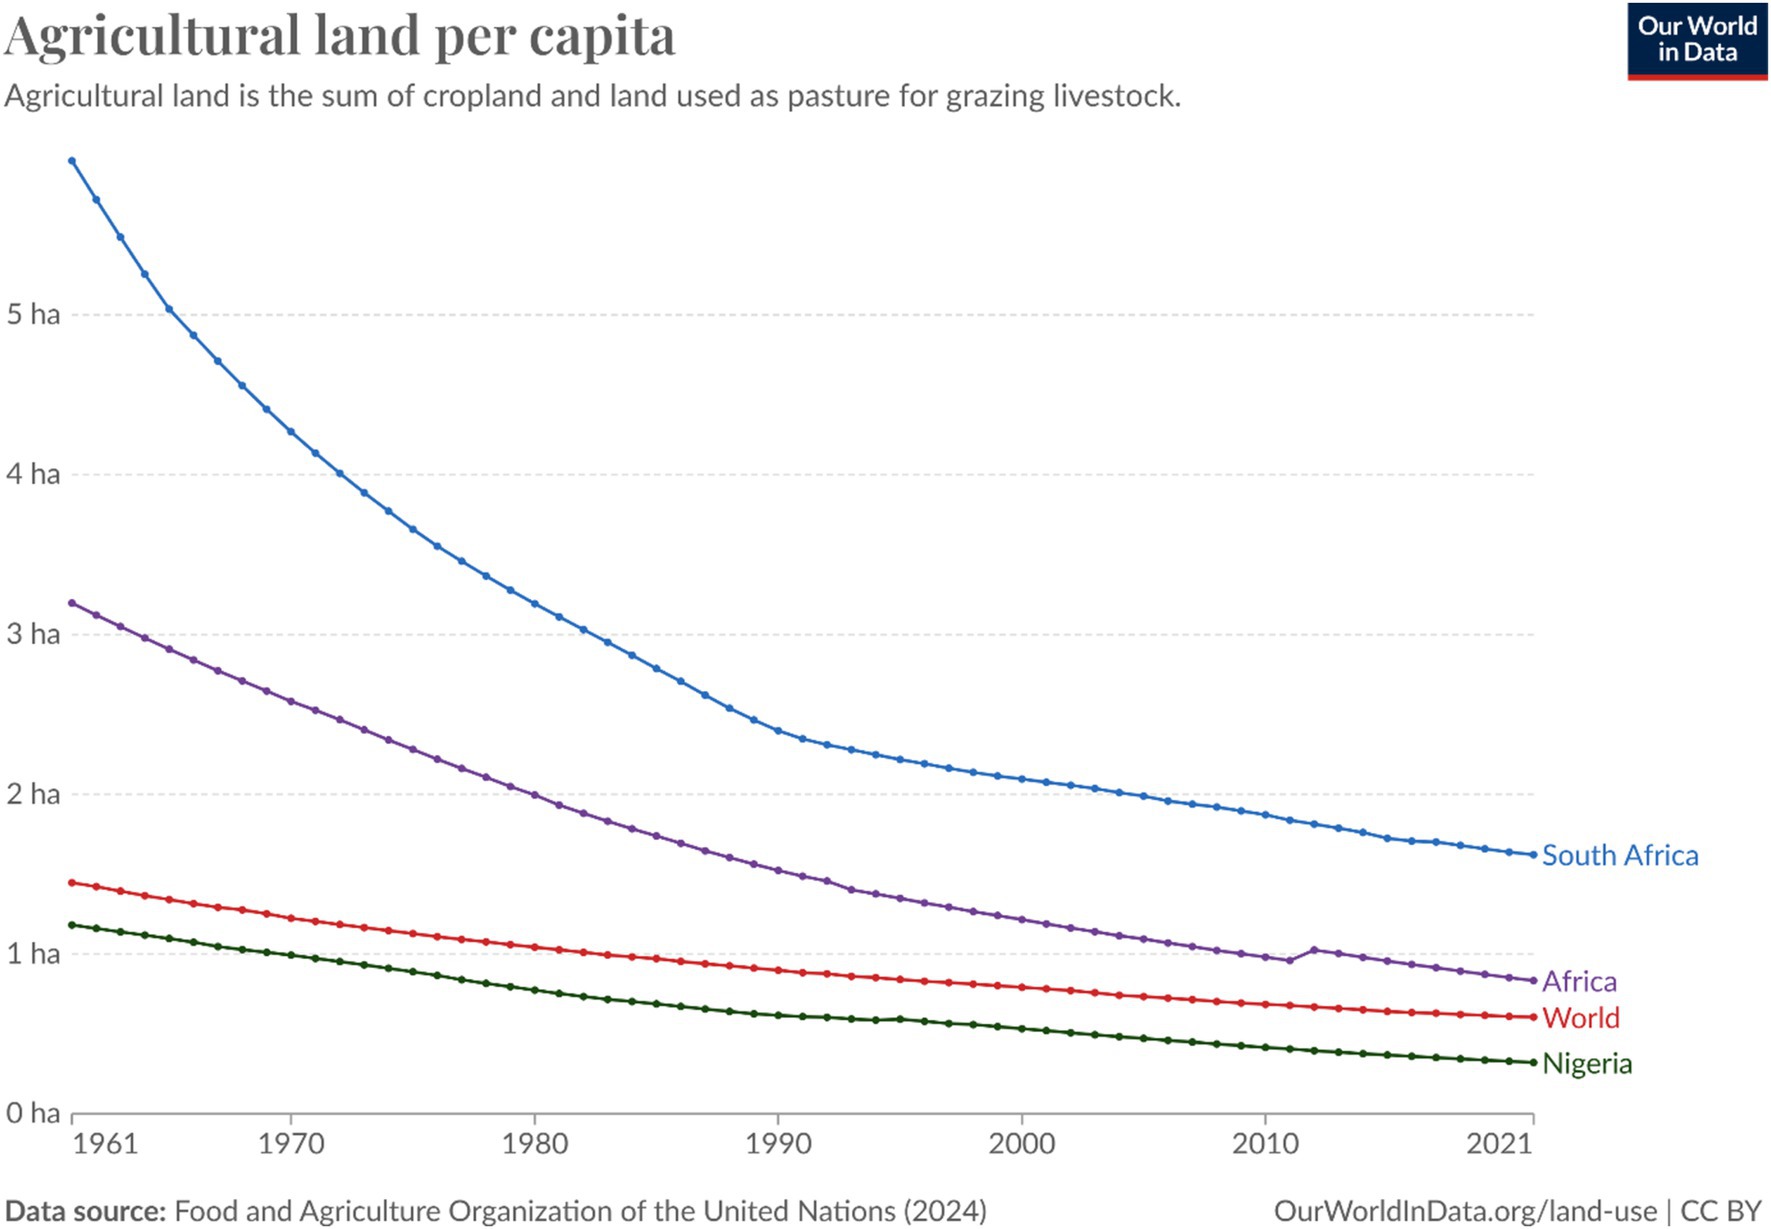
Figure 7. Decline trends in agricultural land per capita.
3.4 Modeling the drivers of residential development in agricultural lands
The SEM analysis presented in this section reveals the proximate drivers of urban sprawl in Lagos’ peri-urban area. Table 11 shows the unstandardized and standardized regression scores of the manifest (observed) variables. The observed variables can be used to explain the underlying latent variables; the higher the standardized R2 value of the observed variable, the stronger the association and representation of the latent factor.
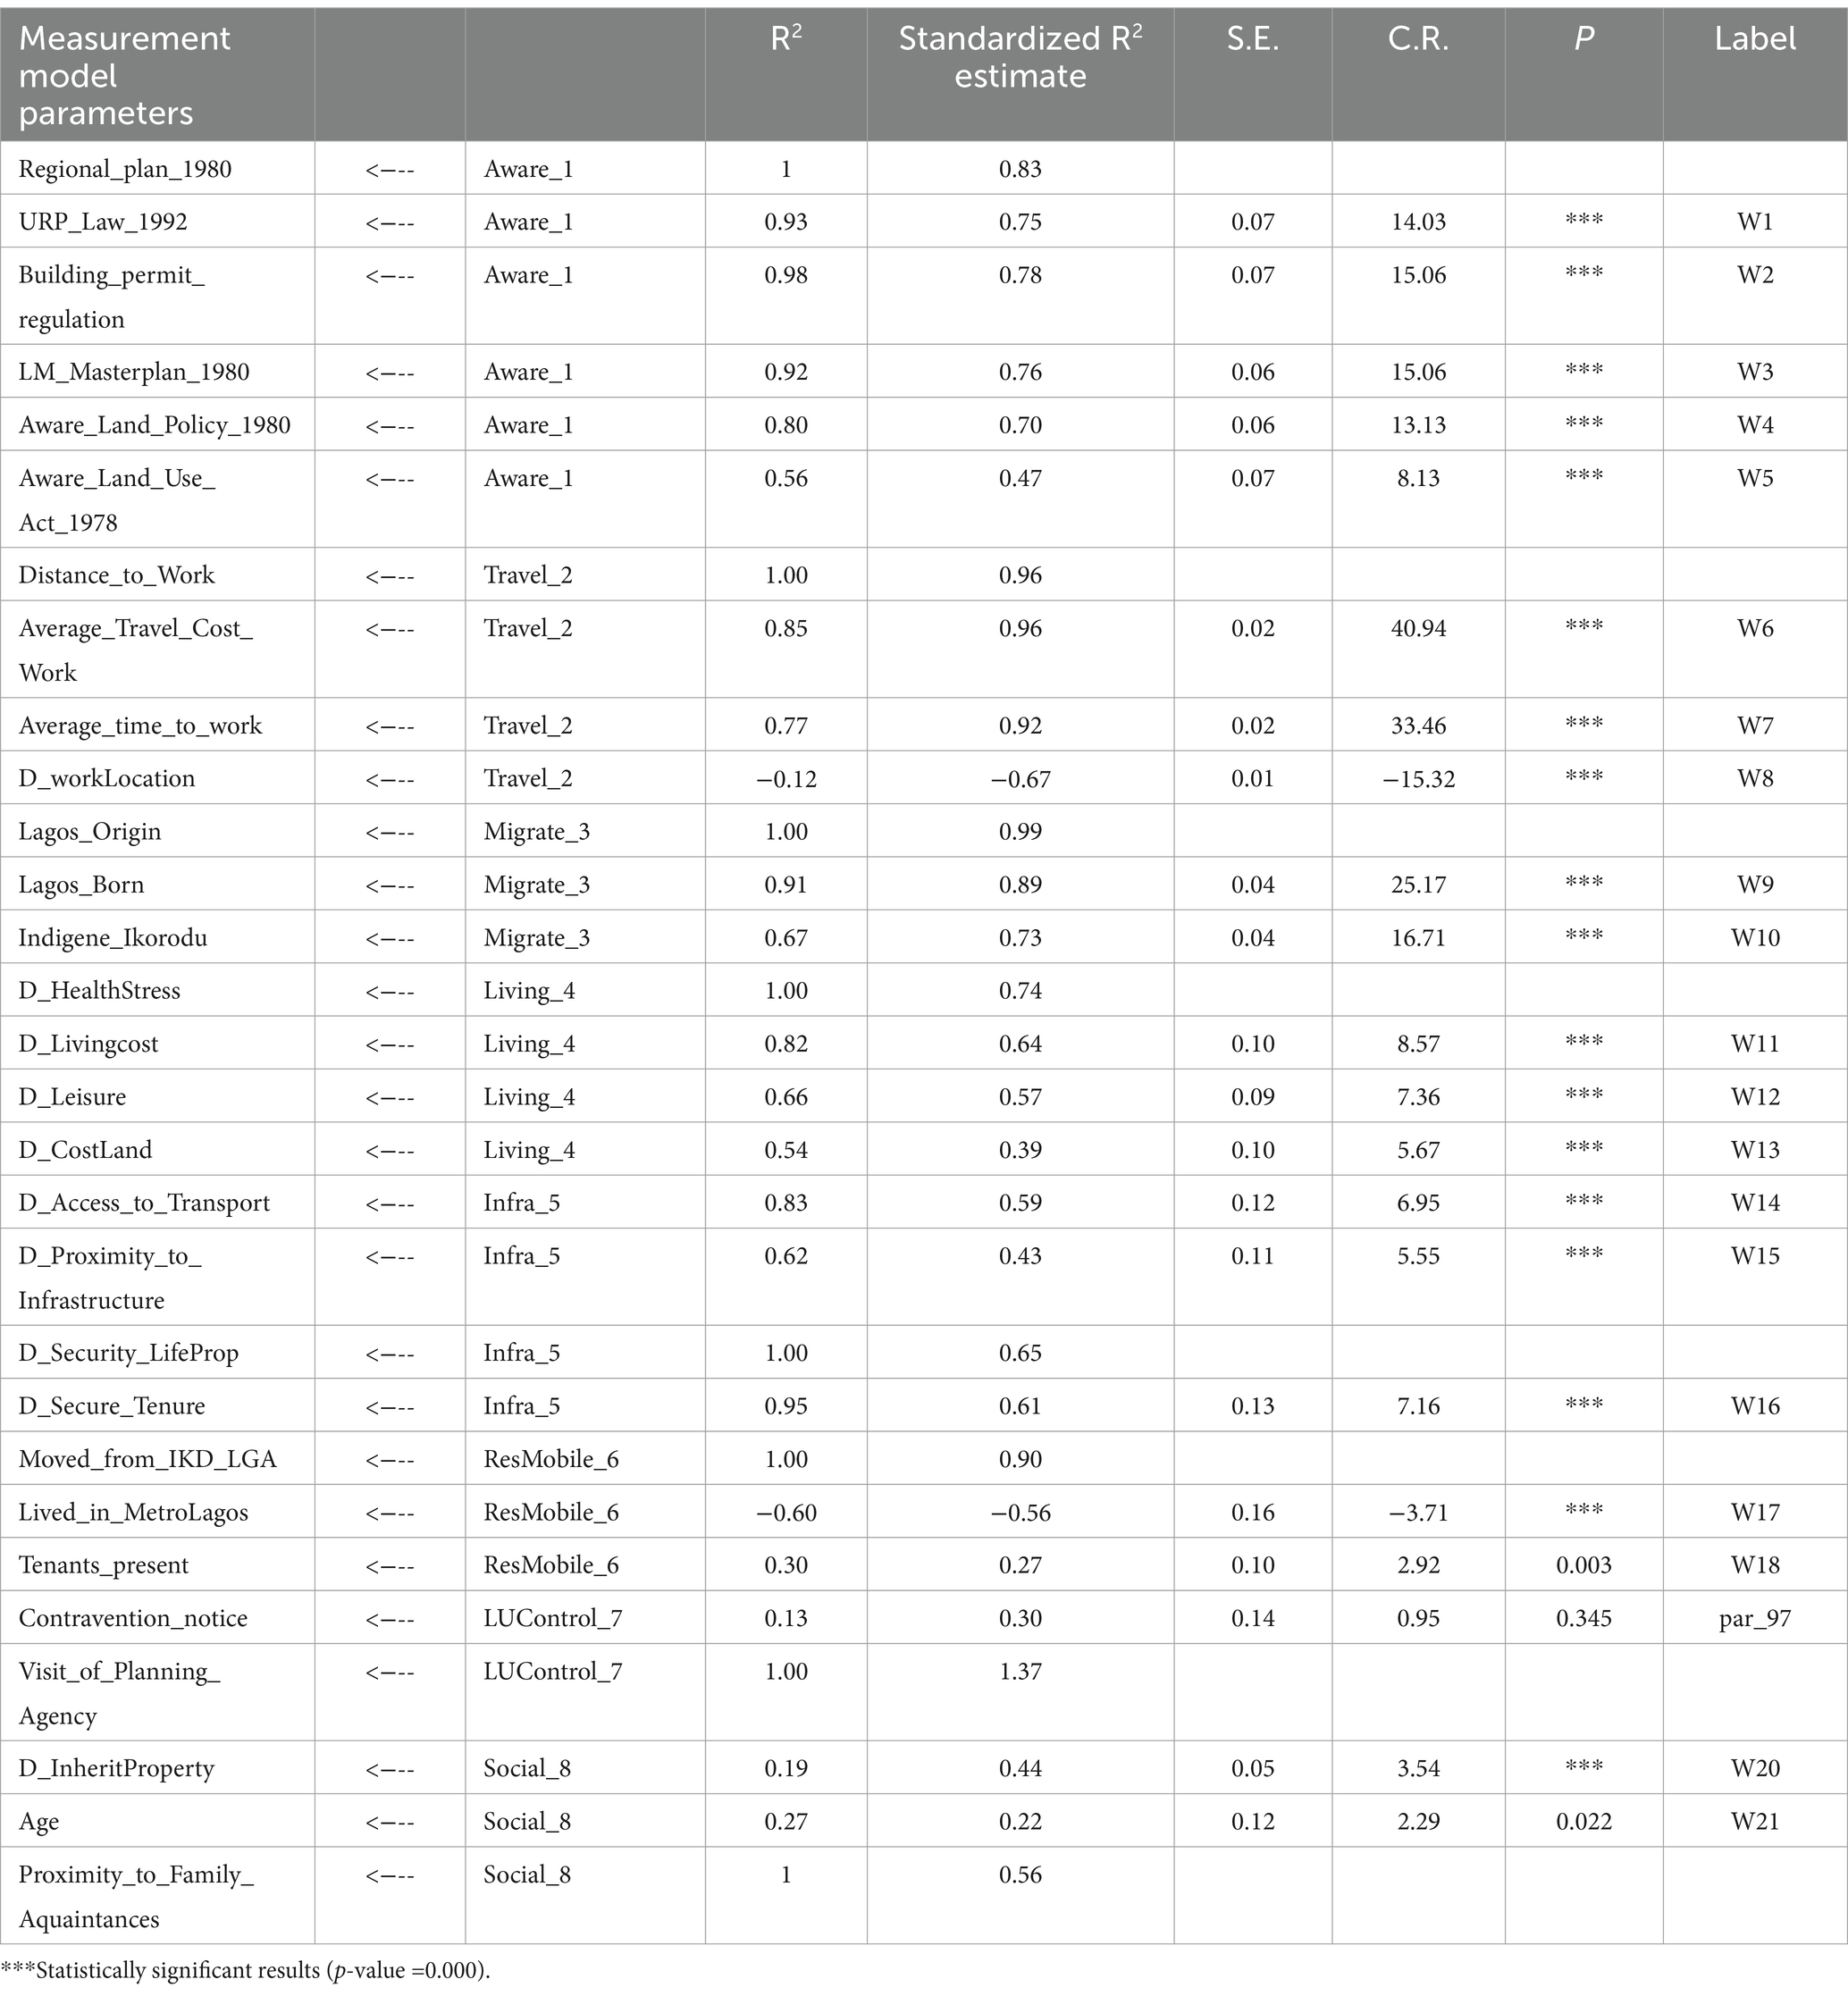
Table 11. Unstandardized and standardized regression score of manifest variables.
However, Table 12 results give insights into the total effects (direct and indirect) of drivers influencing change from agricultural to residential land use. Four factors had a statistically significant relationship (p < 0.05) with the dependent variable (ResDev_AgricZone-Residential Development in Agricultural Zone); they included policy awareness, migration, health, cost of living, and socio-demographic factors as significant drivers (see Figure 8).
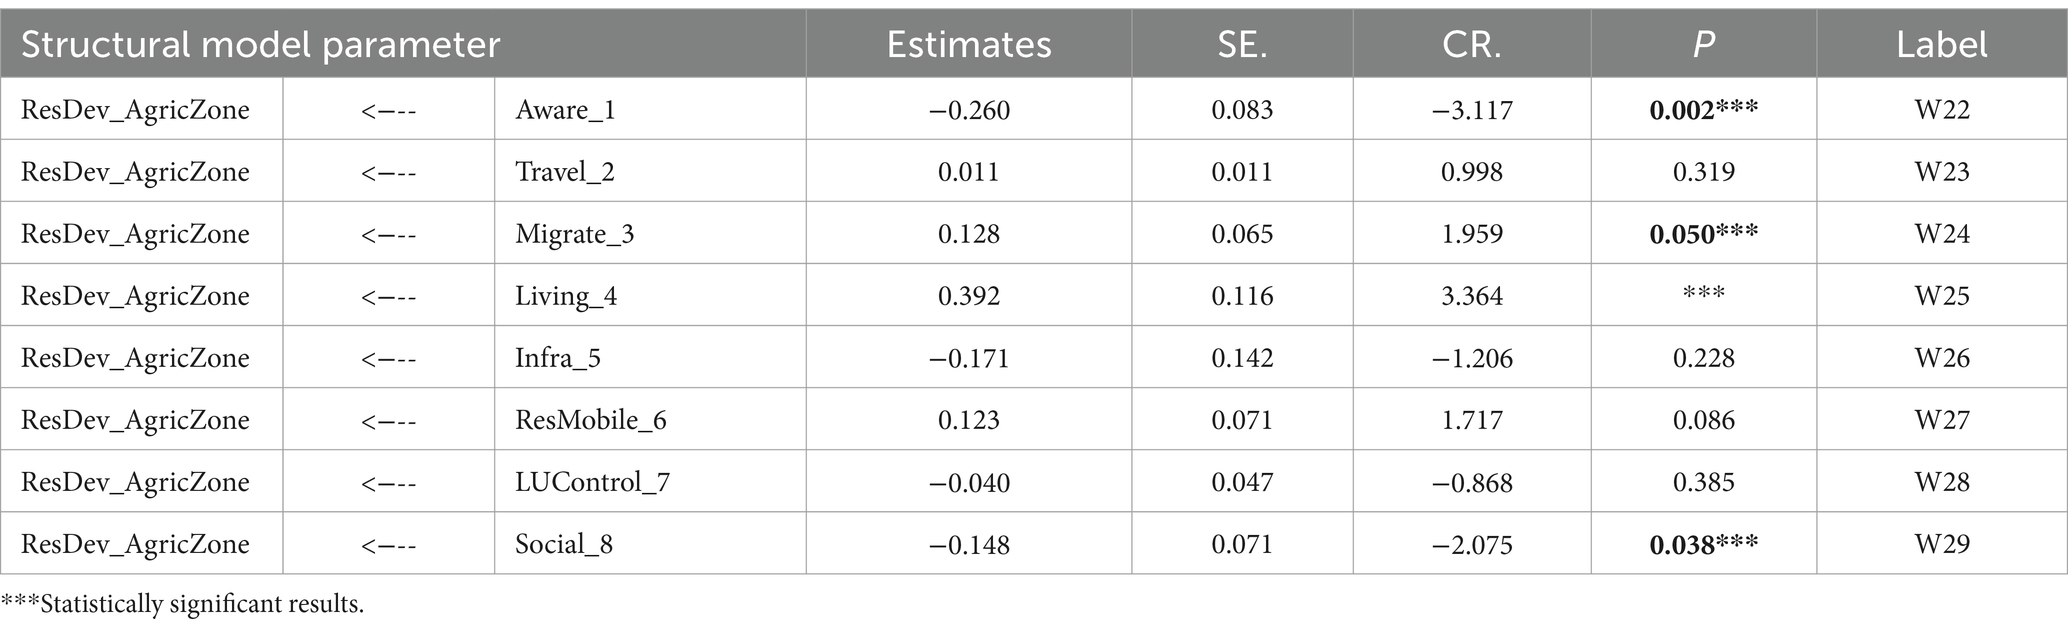
Table 12. Total effect of drivers on agricultural land use change (structural model).
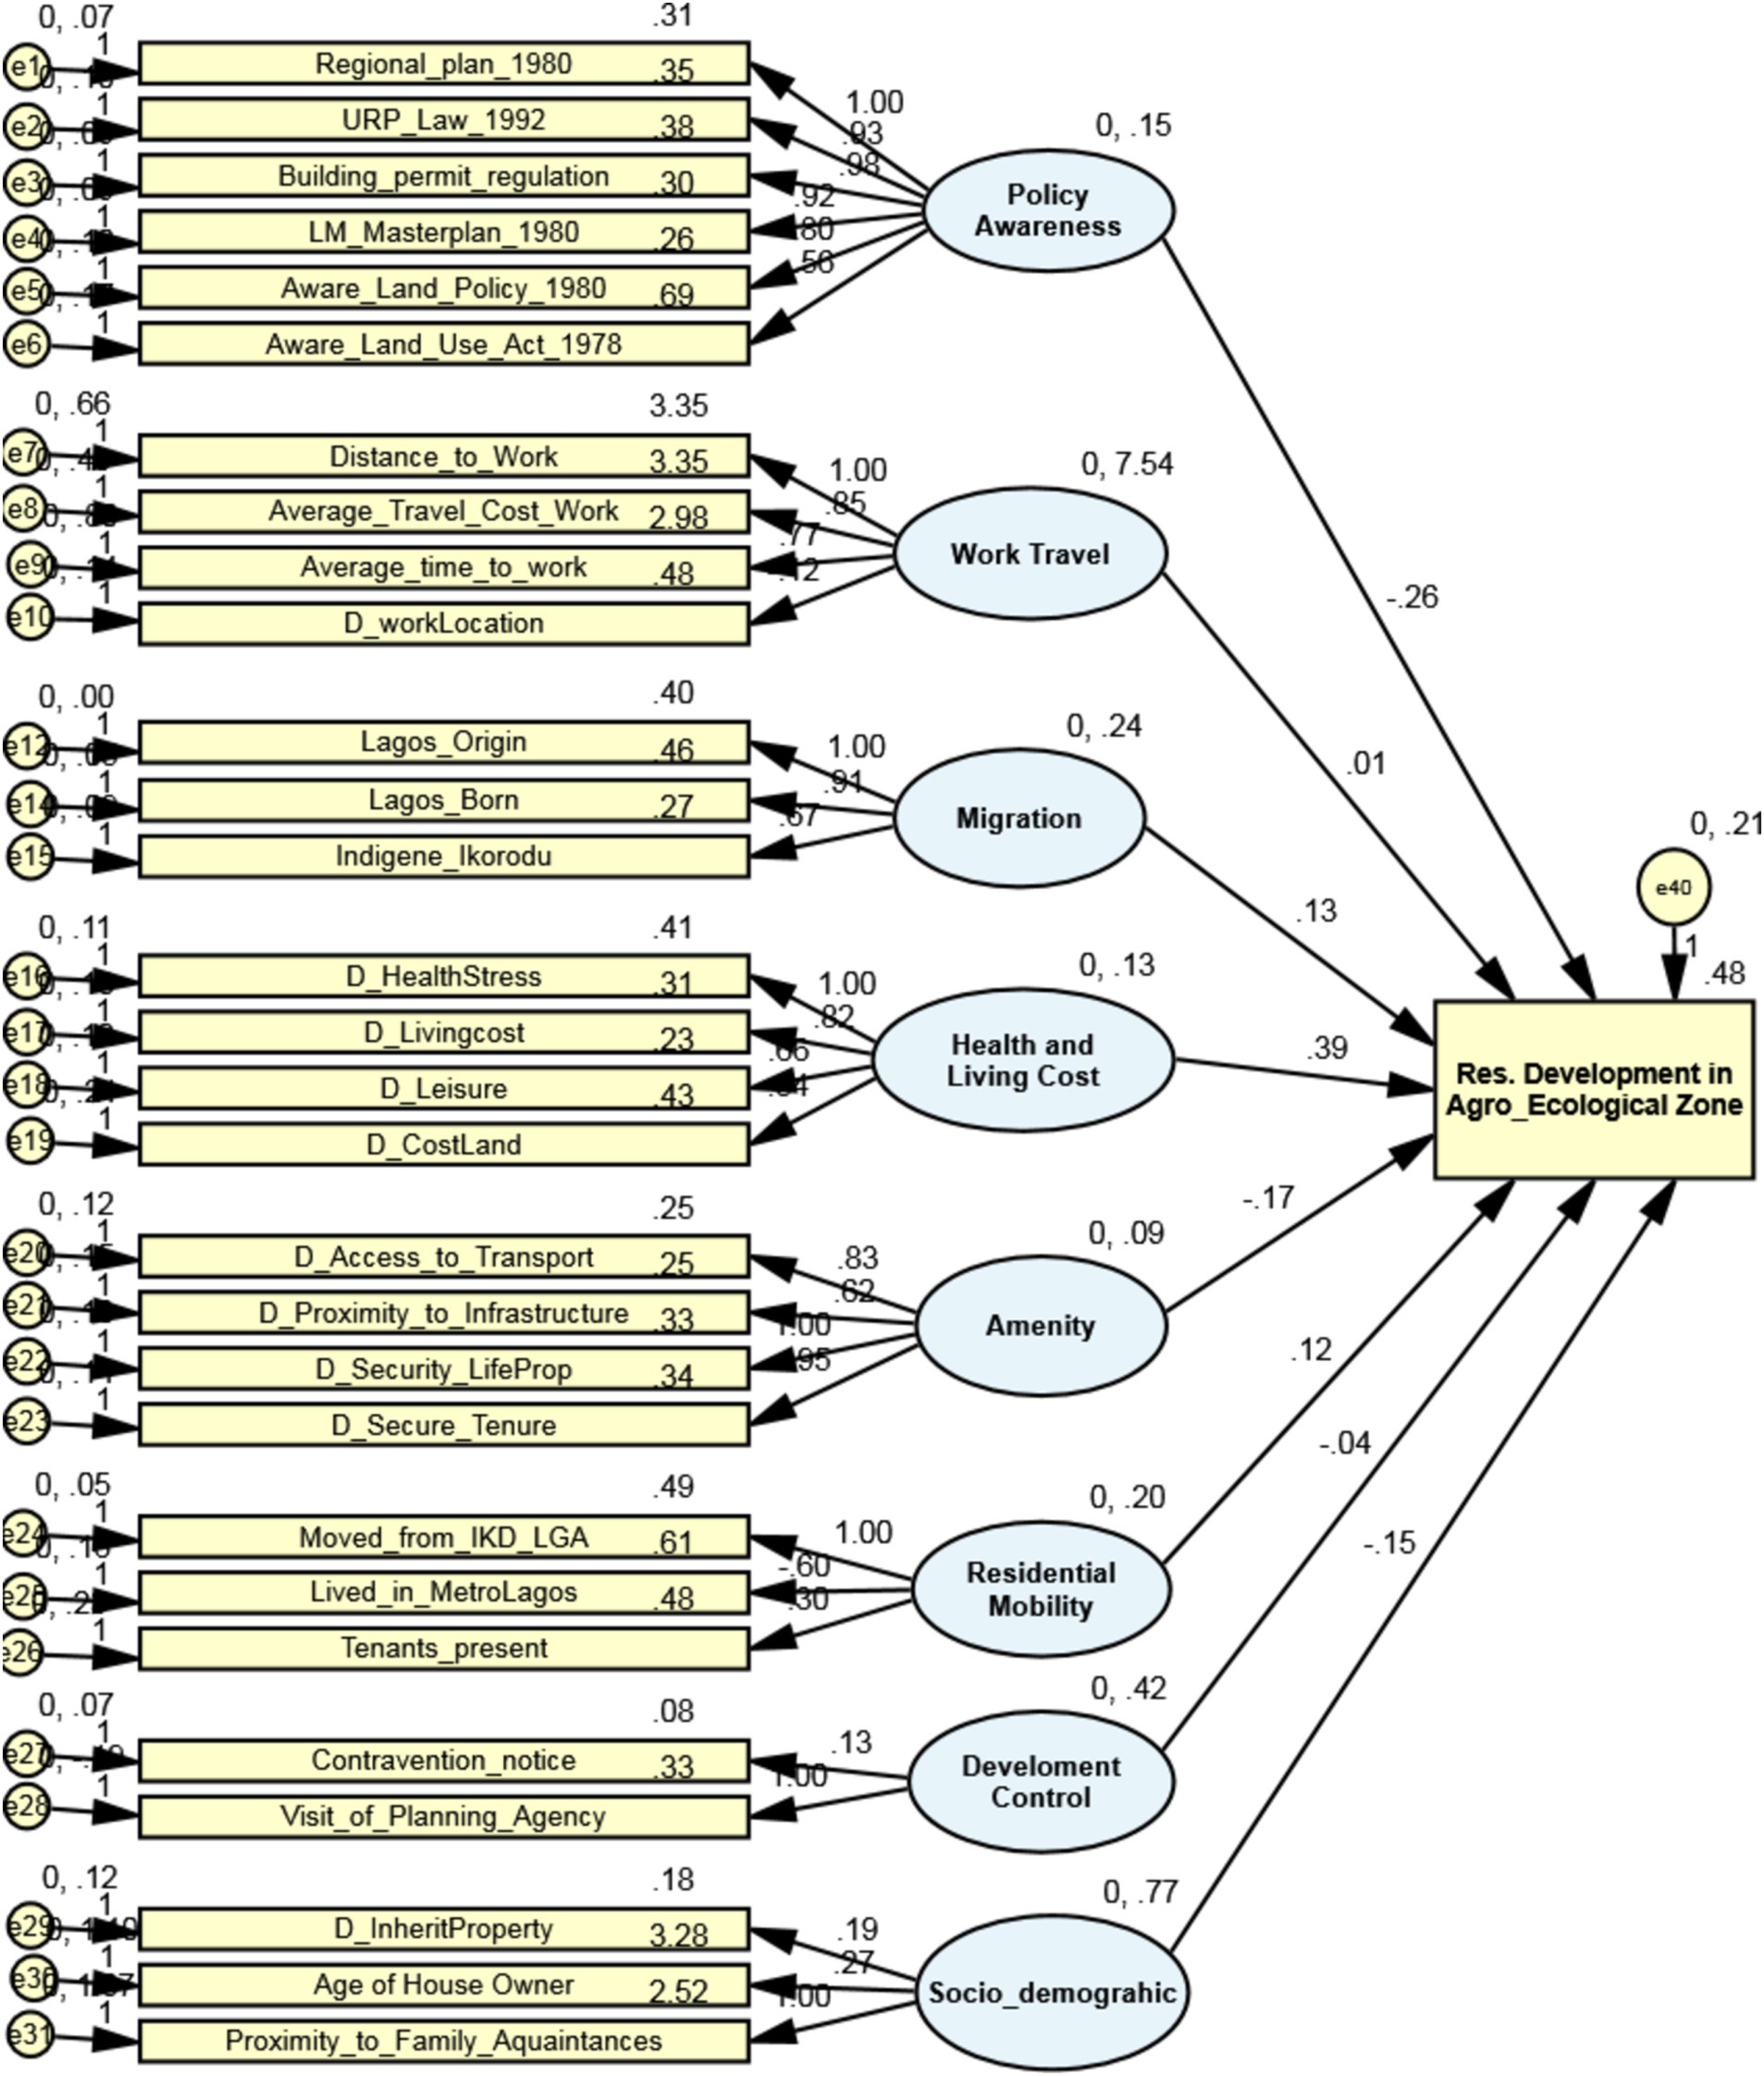
Figure 8. Structural equation model (path model) for residential development on agricultural lands in Ikorodu.
3.4.1 Structural model interpretation
The total effects of the eight (8) latent variables (independent variables) on the dependent variable (ResDev_AgricZone-Residential Development in Agricultural Zone) are discussed below:
Policy awareness (β = −0.260, p < 0.002): The result shows that policy awareness (Aware_1) has a significant negative effect on residential developments in agricultural zones, with a regression factor of −0.26, meaning it predicts 26% of the total variation explained by the eight (8) factors. This suggests that increased awareness of planning regulations (e.g., Urban and Regional Planning Law of 1992) will reduce residential development conversion of agricultural land. When ‘Aware_1’ (policy awareness) increases by one standard deviation, ‘ResDev_AgricZone’ (residential development in agricultural zones) decreases by 0.26.
Work travel (β = 0.01, p = 0.32): Work travel, measured by distance, cost, and time to work, does not significantly influence residential development in agricultural lands. With a regression factor of 0.01, it only predicts 1% of the variance explained by residential development in agricultural land. This result is not statistically significant since the p-value is 0.32.
Migration (β = 0.128, p = 0.05): Migration contributes 12.8% of the total variance in residential development in agricultural lands with a regression factor score of 0.128; it has a positive statistical significance (p = 0.05), meaning when migration increases by one standard deviation, residential development in the agricultural zone increases by 0.128. Table 13 also shows that only 25.5% of Ikorodu homeowners originate in Ikorodu, while 16.5% come from other parts of Lagos; 58% migrated from different parts of Nigeria or are Foreigners. Migration has a positive relationship with peri-urban growth, consistent with recent research on peri-urbanization in SSA (Ingwani et al., 2024; Korah et al., 2024; Salem and Tsurusaki, 2024).
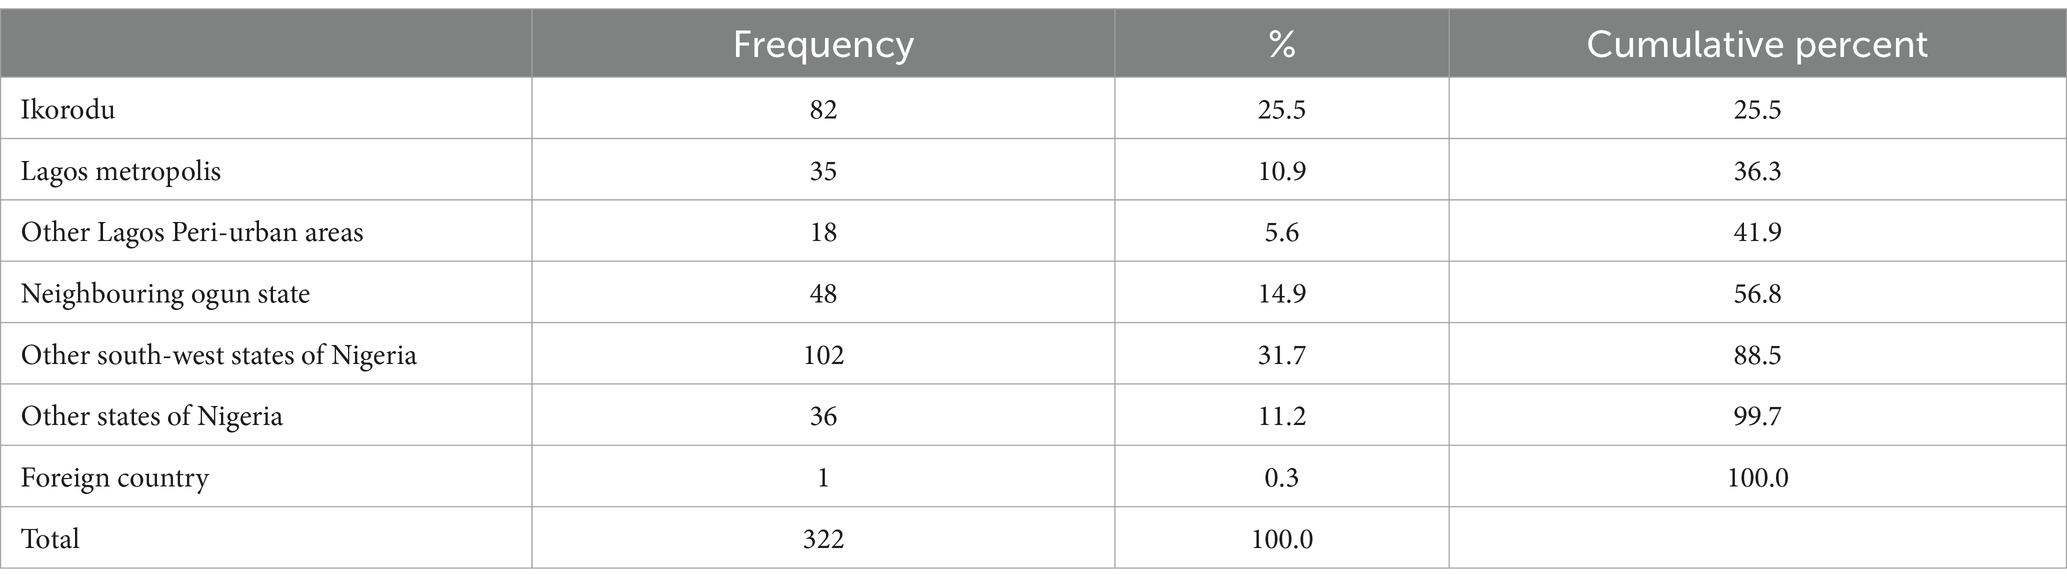
Table 13. Place of origin of homeowners in Ikorodu.
Health and living cost (β = 0.392, p < 0.001): Health and Living Costs significantly drive residential development in peri-urban agricultural lands by contributing 39.20% of the total variance explained with a regression score of 0.392, which is statistically significant (p = 0.00). This implies that when ‘Living_4’ goes up by one standard deviation, ‘ResDev_AgricZone’ goes up by 0.392. Higher living costs in the city, land costs, health stress, and leisure-related factors positively drive peri-urban growth and agricultural land conversion. The findings of previous studies reveal similar trends in SSA and developed countries. In a similar study of peri-urban land, system changes in Greater Copenhagen between 1984 and 2004, where 92% of homeowners’ decisions to build in peri-urban areas were motivated by recreational and ecological opportunities (Busck et al., 2006). A study of the Swiss Alps shows that proximity to suburban green spaces is a primary motivation (Conedera et al., 2015). Also, a recent study of the growth of Ikorodu attributed the cost of living and cheaper land compared with other parts of Lagos to be a major driver of residential development in Ikorodu (Adedire, 2018).
Amenity (β = −0.171, p = 0.23): Access to transportation infrastructure and proximity to other amenities has a negative but non-significant effect on residential development on agricultural land, with a regression score of −0.188 and p-value of 0.19.
Residential mobility (β = 0.111, p = 0.09): Residential mobility positively affects the conversion of agricultural land but is not significant. The total effect of residential mobility on residential development in agricultural land is 0.111 (p-value = 0.09). Due to the total effects of residential mobility, when ‘ResMobile_6’ goes up by one standard deviation, ‘ResDev_AgricZone’ goes up by 0.111. The implication is that there is more pressure on agricultural land due to the increased demand for housing due to population shifts, primarily from migrant tenants.
Development control (β = −0.04, p = 0.39): Development control has a weak and a negative statistically non-significant effect on agricultural land conversion. The total effect of development control on residential development in agricultural land is −0.040 (p value = 0.39). That is when development control goes up by one standard deviation, residential development in the agricultural zone decreases by 0.04. However, the non-significance suggests ineffective enforcement of planning and land use regulations. Ineffective development control in PUAs in other African states is closely linked with agricultural land loss (Anane and Cobbinah, 2022; Dekolo et al., 2015; Sumbo et al., 2023).
Socio-demographic factors (β = −0.148, p = 0.04): The total effect of social and demographic factors on residential development on agricultural land is −0.148 (p-value, 0.04). That is when Social and demographic factors increase by one standard deviation, residential development in the agricultural zone decreases by 0.148. Socio-demographic factors like family inheritance patterns and proximity to family in established communities may resist pressures to sell farmland for residential developments (Sumbo et al., 2023).
The SEM analysis proves that policy awareness, migration dynamics, health and living costs, and socio-demographic factors are critical drivers of agricultural land use conversion in Lagos’ peri-urban areas.
4 Discussion
4.1 In-depth analysis and awareness of urban sprawl and ecosystem service depletion
The findings from Ikorodu reflect a broader global challenge where urban expansion often occurs at the cost of essential ecosystem services. The change analysis revealed a significant transformation in Ikorodu’s landscape, resonating with worldwide trends in rapidly urbanizing regions (Seto et al., 2011; Güneralp and Seto, 2013; Salem and Tsurusaki, 2024). While fractal dimensions have been applied in various SSA cities, synthesizing 45 urban areas shows heterogeneity in growth patterns and diverse degrees of regional fragmentations (Forget et al., 2020). A comparison of the Fractal Dimension Index (FDI) of Ikorodu and Greater Cairo reveals some commonalities and differences in urban growth patterns in African cities. In Ikorodu, FDI rose from 0.94 in 1984 to 1.56 in 2016, transitioning from a fragmented to a more consolidated urban development on agricultural, while Greater Cairo’s FDI increased from 1.44 in 1973 to 1.75 in 2021, indicating a fragmented landscape due to both planned and unplanned urban expansions (Salem et al., 2024). Both cities show fragmented and unplanned growth in agricultural lands. Cairo’s higher FDI is attributed to leapfrogging satellite expansions on farmland and desert areas, while Ikorodu is limited to expanding low-density developments on peri-urban agricultural lands. Even though both cities’ sprawl challenges are at different scales and driven by different factors, they reflect weak development control and planning regulations, which call for cohesive policy interventions targeted to their peculiarities.
4.2 Global urbanisation challenge and comparative insights
Urban sprawl evidence in Ikorodu, characterized by the extension of built-up areas into agricultural lands, reflects the pattern of peri-urban development seen in cities across sub-Sahara Africa (Cobbinah and Amoako, 2012; Yiran et al., 2020). It also underscores the global challenge of urban sprawl on provisioning ES, as seen in previous studies, and the need for sustainable urban land management practices (Madallah and Tarawneh, 2014; Rubiera Morollón et al., 2016).
4.3 Sustainable urban planning strategies and land governance
The findings on the lack of policy awareness and development control in Ikorodu resonate with the need for effective urban land governance to preserve ES, aligning with literature emphasizing the importance of integrated policy approaches that balance urban growth with environmental sustainability (Eppler et al., 2015; Perveen et al., 2017). Insights from the study underscore the need for an integrated urban planning approach, emphasizing the need to incorporate ES assessments into urban development strategies. Planning that goes beyond land use and emphasizes land functions and the value of ES would birth more resilient and sustainable urban environments. Also, a participatory approach involving all local stakeholders will make policies more acceptable and effective (Kenter et al., 2011; Wu et al., 2017).
5 Conclusion
This study’s in-depth analysis of Ikorodu, Lagos, provides critical insights into the dynamics of urban sprawl and its implications for ES. Significant land cover changes were characterized by a 127.46% increase in built-up areas and a cumulative decrease of 83.49% in agricultural lands (−51.29%) and forested lands (−32.65%). This trend reflects a broader global trend of urban expansion at the cost of agricultural and forested lands. The fractal analysis results underline a persistent sprawling pattern, indicating that despite becoming more compact in some areas, Ikorodu’s growth largely remains uncoordinated and dispersed.
The study underscores the urgent need for spatial planning frameworks to integrate ES considerations. Urban expansion undermines the ES function of land—from food provisioning to climate regulation. The decreased ALPC in Ikorodu is a plain reminder of the potential threats to food security and local livelihoods in the face of unrestrained urban growth. Such insights are invaluable for policymakers and urban planners balancing urban development with environmental sustainability. This study recommends a multidimensional approach to urban planning encompassing land use regulation, public awareness campaigns, and the integration of ES valuation into development decisions. Policymakers should consider strengthening public awareness and education on land use policies, improving capacities for development control, investing in and incentivizing affordable housing projects, and promoting sustainable and inclusive land governance.
Future studies suggested include longitudinal studies that could further explore the dynamic interplay between urban sprawl and ES. Comparative research across different urban contexts could provide deeper insights into the relationships between migration and peri-urban sprawl and practical strategies for managing urban expansion while preserving ES. In addition, studies are needed to focus on the socioeconomic dimensions of urban sprawl in African cities.
The transition of Ikorodu from an agricultural PUA to an urbanized landscape sums up the challenges and opportunities inherent in managing rapid urban growth in African cities. Aligning urban planning with ES will allow cities like Ikorodu to evolve into models of sustainable development, offering a high quality of life for their residents while preserving the ecological intricacies upon which they depend. The findings from this study contribute to the growing discourse on sustainable urbanization in Africa, providing a compelling case for integrating agroecological considerations in urban development planning.
Data availability statement
The original contributions presented in the study are included in the article/supplementary material, further inquiries can be directed to the corresponding author.
Author contributions
SD: Conceptualization, Formal analysis, Writing – original draft, Writing – review & editing. ME: Writing – original draft, Writing – review & editing. OJ: Visualization, Writing – review & editing. CA: Resources, Writing – review & editing. TG: Resources, Writing – review & editing.
Funding
The author(s) declare financial support was received for the research, authorship, and/or publication of this article. TET Fund partly supported this research.
Conflict of interest
The authors declare that the research was conducted in the absence of any commercial or financial relationships that could be construed as a potential conflict of interest.
Generative AI statement
The author(s) declare that no Generative AI was used in the creation of this manuscript.
Publisher’s note
All claims expressed in this article are solely those of the authors and do not necessarily represent those of their affiliated organizations, or those of the publisher, the editors and the reviewers. Any product that may be evaluated in this article, or claim that may be made by its manufacturer, is not guaranteed or endorsed by the publisher.
References
Abiodun, O. E., Olaleye, J. B., Olusina, J. O., and Omogunloye, O. G. (2017). Multicriteria regression approach to modeling urban expansion in greater Lagos, Nigeria. J. Urban Plan. Dev. 143. doi: 10.1061/(ASCE)UP.1943-5444.0000389
Adedire, F. M. (2018). Peri-urban Expansion in Ikorodu, Lagos: Extent, Causes, Effects, and Policy Response. Urban Forum, 29, 259–275. doi: 10.1007/s12132-018-9336-5
Adekola, O., Mitchell, G., and Grainger, A. (2015). Inequality and ecosystem services: the value and social distribution of Niger Delta wetland services. Ecosyst. Serv. 12, 42–54. doi: 10.1016/j.ecoser.2015.01.005
Agbola, T., and Agunbiade, E. M. (2009). Urbanization, slum development and security of tenure: the challenges of meeting millennium development goal 7 in metropolitan Lagos, Nigeria. Urban Popul. Dyn. Dev. World Case Stud. Lessons Learn. 77–106. Available at: http://www.populationenvironmentresearch.org/workshops.jsp#W2007
Alexandratos, N., and Bruinsma, J. (2012). World agriculture towards 2030/2050: the 2012 revision. Rome 20:375. doi: 10.1016/S0264-8377(03)00047-4
Amoateng, P., Cobbinah, P. B., and Owusu-Adade, K. (2013). Managing physical development in peri-urban areas of Kumasi, Ghana: a case of Abuakwa. J. Urban Environ. Eng. 7, 96–109. doi: 10.4090/juee.2013.v7n1.096109
Anane, G. K., and Cobbinah, P. B. (2022). Everyday politics of land use planning in peri-urbanisation. Habitat Int. 120:102497. doi: 10.1016/j.habitatint.2021.102497
Appiah, D. O., Bugri, J. T., Forkuor, E. K., and Boateng, P. K. (2014). Determinants of peri-urbanization and land use change patterns in peri-urban Ghana. J. Sustain. Dev. 7, 95–109. doi: 10.5539/jsd.v7n6p95
Areola, A. A., Gwebu, T. D., and Sebego, R. J. (2014). A spatio-temporal analysis of peri-urbanisation in sub-Saharan Africa: a case study from Lobatse, Botswana. African Geogr. Rev. 33, 174–201. doi: 10.1080/19376812.2013.862477
Azadi, H., Barati, A. A., Rafiaani, P., Raufirad, V., Zarafshani, K., Mamoorian, M., et al. (2015). Agricultural land conversion drivers in Northeast Iran: application of structural equation model. Appl. Spat. Anal. Policy 9, 591–609. doi: 10.1007/s12061-015-9160-4
Bhatta, B. (2010). Analysis of urban growth and sprawl from remote sensing data. Berlin, Heidelberg: Springer-Verlag.
Bonsu, K., and Bonin, O. (2023). Urban growth process in Greater Accra metropolitan area: characterization using fractal analysis. J. Geovisualization Spat. Anal. 7:21. doi: 10.1007/s41651-023-00149-x
Braimoh, A. K., and Onishi, T. (2007). Spatial determinants of urban land use change in Lagos, Nigeria. Land use policy 24, 502–515. doi: 10.1016/j.landusepol.2006.09.001
Bren d’Amour, C., Reitsma, F., Baiocchi, G., Barthel, S., Güneralp, B., Erb, K.-H., et al. (2017). Future urban land expansion and implications for global croplands. Proc. Natl. Acad. Sci. 114, 8939–8944. doi: 10.1073/pnas.1606036114
Burkhard, B., Kandziora, M., and Hou, Y. (2014). Ecosystem service potentials, Flows and Demands Quantification. Landsc. Online 34, 1–32. doi: 10.3097/LO.201434
Burkhard, B., Kroll, F., Müller, F., Windhorst, W., and Burkhard, B. (2009). Landscapes’ capacities to provide ecosystem services—a concept for land-cover based assessments. Landsc. Online 15, 1–22. doi: 10.3097/LO.200915
Busck, A. G., Kristensen, S. P., Præstholm, S., Reenberg, A., and Primdahl, J. (2006). Land system changes in the context of urbanisation: examples from the peri-urban area of greater Copenhagen. Geogr. Tidsskr. J. Geogr. 106, 21–34. doi: 10.1080/00167223.2006.10649554
Chapin, F. S., and Weiss, S. F. (1968). A probabilistic model for residential growth. Transp. Res. 2, 375–390. doi: 10.1016/0041-1647(68)90103-2
Cobbinah, P. B., and Amoako, C. (2012). Urban sprawl and the loss of Peri-urban land. Int. J. Soc. Hum. Sci. 6, 388–397. Available at: http://www.researchgate.net/publication/232957200_Urban_Sprawl_and_the_Loss_of_Peri_Urban_Land_in_Kumasi_Ghana/file/d912f509af6f7c7ef5.pdf
Conedera, M., Del Biaggio, A., Seeland, K., Moretti, M., and Home, R. (2015). Residents’ preferences and use of urban and peri-urban green spaces in a Swiss mountainous region of the southern Alps. Urban For. Urban Green. 14, 139–147. doi: 10.1016/j.ufug.2015.01.003
Coulibaly, B., and Li, S. (2020). Impact of agricultural land loss on rural livelihoods in peri-urban areas: empirical evidence from sebougou, Mali. Land 9, 1–20. doi: 10.3390/land9120470
Dekolo, S., Oduwaye, L., and Nwokoro, I. (2015). Urban sprawl and loss of agricultural land in Peri-urban areas of Lagos * 1 Leke Oduwaye Immaculata Nwokoro keywords: Reg. Stat 5, 20–33. doi: 10.15196/RS05202
Egoh, B. N., O’Farrell, P. J., Charef, A., Josephine Gurney, L., Koellner, T., Nibam Abi, H., et al. (2012). An African account of ecosystem service provision: use, threats and policy options for sustainable livelihoods. Ecosyst. Serv. 2, 71–81. doi: 10.1016/j.ecoser.2012.09.004
Encarnação, S., Gaudiano, M., Santos, F. C., Tenedório, J. A., and Pacheco, J. M. (2012). Fractal cartography of urban areas. Sci. Rep. 2. doi: 10.1038/srep00527
Eppler, U., Fritsche, U. R., and Laaks, S. (2015). Urban-rural linkages and global sustainable land use. Berlin, Darmstadt.
Feng, H., Squires, V. R., and Wu, J. (2021). Ecosystem Services Provisioning, Urban Growth and the Rural–Urban Interface: A Case Study from China. Land 10. doi: 10.3390/land10040337
Forget, Y., Shimoni, M., Gilbert, M., and Linard, C. (2020). Mapping 20 years of urban expansion in 45 urban areas of sub-Saharan Africa. Remote Sens. 13:525. doi: 10.3390/rs13030525
Frankhauser, P., and Tannier, C. (2005). A multi-scale morphological approach for delimiting urban areas. Comput. Urban Plan. Urban Manag., 1–28.
Gebre, T., and Gebremedhin, B. (2019). The mutual benefits of promoting rural-urban interdependence through linked ecosystem services. Glob. Ecol. Conserv. 20, e00707. doi: 10.1016/j.gecco.2019.e00707
Goswami, P., and Nishad, S. (2017). “Ensuring self-sufficiency and sustainability in the Agrofood sector” in Sustainability challenges in the Agrofood sector (Wiley), 307–342.
Güneralp, B., and Seto, K. C. (2013). Futures of global urban expansion: uncertainties and implications for biodiversity conservation. Environ. Res. Lett. 8:014025. doi: 10.1088/1748-9326/8/1/014025
Haas, J., and Ban, Y. (2017). Mapping and monitoring urban ecosystem services using high-resolution satellite data. IEEE J. Sel. Top. Appl. Earth Obs. Remote Sens. 10, 669–680. doi: 10.1109/JSTARS.2016.2586582
Hair, J. F., Hult, G. T. M., Ringle, C. M., Sarstedt, M., Danks, N. P., and Ray, S. (2021). “An introduction to structural equation modeling BT—partial least squares structural equation modeling (PLS-SEM) using R: a workbook” in. eds. J. F. Hair, G. T. M. Hult, C. M. Ringle, M. Sarstedt, N. P. Danks, and S. Ray (Cham: Springer International Publishing), 1–29.
Huang, Q., Liu, Z., He, C., Gou, S., Bai, Y., Wang, Y., et al. (2020). The occupation of cropland by global urban expansion from 1992 to 2016 and its implications. Environ. Res. Lett. 15. doi: 10.1088/1748-9326/ab858c
Ingwani, E., Thynell, M., Gurure, L. R., Ekelund, N. G. A., Gumbo, T., Schubert, P., et al. (2024). The impacts of Peri-urban expansion on municipal and ecosystem services: Experiences from Makhado Biaba town. South Africa: Springer Netherlands.
Kenter, J. O., Hyde, T., Christie, M., and Fazey, I. (2011). The importance of deliberation in valuing ecosystem services in developing countries-evidence from the Solomon Islands. Glob. Environ. Chang. 21, 505–521. doi: 10.1016/j.gloenvcha.2011.01.001
Kline, R. B. (2016). Principles and practice of structural equation modeling. Available at: http://search.ebscohost.com/login.aspx?direct=true&scope=site&db=nlebk&db=nlabk&AN=1078917
Korah, A., Koch, J. A. M., and Wimberly, M. C. (2024). Understanding urban growth modeling in Africa: dynamics, drivers, and challenges. Cities 146:104734. doi: 10.1016/j.cities.2023.104734
Lambin, E. F., Turner, B. L., Geist, H. J., Agbola, S. B., Angelsen, A., Bruce, J. W., et al. (2001). The causes of land-use and land-cover change: moving beyond the myths. Glob. Environ. Chang. 11, 261–269. doi: 10.1016/S0959-3780(01)00007-3
Lasisi, M., Popoola, A., Adediji, A., Adedeji, O., and Babalola, K. (2017). City expansion and agricultural land loss within the Peri-urban area of Osun state. Nigeria. Ghana J. Geogr. 9, 132–163.
Madallah, W., and Tarawneh, A. (2014). Urban sprawl on agricultural land (literature survey of causes, effects, relationship with land use planning and environment) a case study from Jordan (Shihan municipality areas), vol. 4, 97–125.
Mbiba, B., and Huchzermeyer, M. (2002). Contentious development: peri-urban studies in sub-Saharan Africa. Prog. Dev. Stud. 2, 113–131. doi: 10.1191/1464993402ps032ra
Molla, M. B., Gelebo, G., and Girma, G. (2024). Urban expansion and agricultural land loss: a GIS-based analysis and policy implications in Hawassa city, Ethiopia. Front. Environ. Sci. 12:1499804. doi: 10.3389/fenvs.2024.1499804
Muchelo, R. O., Bishop, T. F. A., Ugbaje, S. U., and Akpa, S. I. C. (2024). Patterns of urban sprawl and agricultural land loss in sub-Saharan Africa: the cases of the Ugandan cities of Kampala and Mbarara. Land 13. doi: 10.3390/land13071056
Mundia, C. N., and Murayama, Y. (2010). Modeling spatial processes of urban growth in African cities: a case study of Nairobi City. Urban Geogr. 31, 259–272. doi: 10.2747/0272-3638.31.2.259
Myers, N. (1999). The next green revolution: its environmental underpinnings. Curr. Sci. 76, 507–513. Available at: http://www.jstor.org/stable/24100752
Naeem, S., Carpenter, S. R., Castilla, J. C., Groot, R. S., de Mooney, H. A., Reid, W. F., et al. (2003). “Ecosystems and their services,” in Millennium Ecosystems Assessment: Ecosystems and human well-being: a framework for assessment, eds. Alcamo, J., and Bennett, J. M. (Washington: Island 710 Press), 49–70. doi: 10.1007/s13398-014-0173-7.2
Nelson, F., Foley, C., Foley, L., Leposo, A., Loure, E., Peterson, D., et al. (2010). Payments for ecosystem services as a framework for community-based conservation in northern Tanzania. Conserv. Biol. 24, 78–85. doi: 10.1111/j.1523-1739.2009.01393.x
Perveen, S., Kamruzzaman, M., and Yigitcanlar, T. (2017). Developing policy scenarios for sustainable urban growth management: a Delphi approach. Sustain. For. 9. doi: 10.3390/su9101787
Powledge, F. (2006). The Millennium Assessment. Bioscience, 56, 880. doi: 10.1641/0006-3568(2006)56[880:TMA]2.0.CO;2
Pullanikkatil, D., Palamuleni, L. G., and Ruhiiga, T. M. (2016). Land use/land cover change and implications for ecosystems services in the Likangala River catchment, Malawi. Phys. Chem. Earth 93, 96–103. doi: 10.1016/j.pce.2016.03.002
Rubiera Morollón, F., González Marroquin, V. M., and Pérez Rivero, J. L. (2016). Urban sprawl in Spain: differences among cities and causes. Eur. Plan. Stud. 24, 207–226. doi: 10.1080/09654313.2015.1080230
Salem, M., and Tsurusaki, N. (2024). Impacts of rapid urban expansion on Peri-urban landscapes in the global south: insights from landscape metrics in greater Cairo. Sustain. For. 16:2316. doi: 10.3390/su16062316
Salem, M., Tsurusaki, N., Xu, X., and Xu, G. (2024). Revealing the transformation of spatial structure of greater Cairo: insights from satellite imagery and geospatial metrics. J. Urban Manag. 13, 565–579. doi: 10.1016/j.jum.2024.10.008
Seto, K. C., Fragkias, M., Güneralp, B., and Reilly, M. K. (2011). A Meta-analysis of global urban land expansion. PLoS One 6, e23777–e23779. doi: 10.1371/journal.pone.0023777
Simkin, R. D., Seto, K. C., McDonald, R. I., and Jetz, W. (2022). Biodiversity impacts and conservation implications of urban land expansion projected to 2050. Proc. Natl. Acad. Sci. USA 119, e2117297119–e2117297110. doi: 10.1073/pnas.2117297119
Sumbo, D. K., Anane, G. K., and Inkoom, D. K. B. (2023). ‘Peri-urbanisation and loss of arable land’: indigenes’ farmland access challenges and adaptation strategies in Kumasi and Wa, Ghana. Land use policy 126:106534. doi: 10.1016/j.landusepol.2022.106534
Tacoli, C. (1998). Rural-urban interactions: a guide to the literature. Environ. Urban. 10, 147. doi: 10.1177/095624789801000105
Tacoli, C. (2003). The links between urban and rural development. Environ. Urban. 15, 3–12. doi: 10.1177/095624780301500111
Tannier, C., and Pumain, D. (2005). Fractals in urban geography: a theoretical outline and an empirical example. CyberGeo 1–22. doi: 10.4000/cybergeo.3275
Teo, T., Tsai, L. T., and Yang, C.-C. (2013). Applying structural equation modeling (SEM) in educational research: an introduction.
Thomas, I., Frankhauser, P., and Biernacki, C. (2008). The morphology of built-up landscapes in Wallonia (Belgium): a classification using fractal indices. Landsc. Urban Plan. 84, 99–115. doi: 10.1016/j.landurbplan.2007.07.002
United Nations (2018). World urbanization prospects 2018. Available at: https://population.un.org/wup/
United Nations (2022). World population prospects 2022. Available at: www.un.org/development/desa/pd/
van Vliet, J. (2019). Direct and indirect loss of natural area from urban expansion. Nat. Sustain. 2, 755–763. doi: 10.1038/s41893-019-0340-0
van Oudenhoven, A. P. E. (2015). Quantifying the effects of management on ecosystem services. Wageningen. Available at: http://edepot.wur.nl/328322
Verburg, P. H., Erb, K. H., Mertz, O., and Espindola, G. (2013). Land system science: between global challenges and local realities. Curr. Opin. Environ. Sustain. 5, 433–437. doi: 10.1016/j.cosust.2013.08.001
Verburg, P. H., Willemen, L., van de Steeg, J., Veldkamp, A., and Willemen, L. (2009). From land cover change to land function dynamics: a major challenge to improve land characterization. J. Environ. Manag. 90, 1327–1335. doi: 10.1016/j.jenvman.2008.08.005
Williamson, I. P., and Feeney, M.-E. (2001). Land administration and spatial data infrastructures: trends and developments. 25–28. Available at: http://minerva-access.unimelb.edu.au/handle/11343/33892
Wolff, S., Schulp, C. J. E., and Verburg, P. H. (2015). Mapping ecosystem services demand: a review of current research and future perspectives. Ecol. Indic. 55, 159–171. doi: 10.1016/j.ecolind.2015.03.016
World Bank (2024). World development indicators. Washington, D.C.: IINAS: Int. Institute for Sustainability Analysis and Strategy Available at: https://data.worldbank.org/indicator/AG.LND.AGRI.ZS
Wu, Y., Fan, P., Li, B., Ouyang, Z., Liu, Y., and You, H. (2017). The effectiveness of planning control on urban growth: evidence from Hangzhou, China. Sustainability 9:855. doi: 10.3390/su9050855
Keywords: urban sprawl, peri-urban area, agricultural lands, fractal analysis, land cover change, structural equation modeling
Citation: Dekolo S, Ekum MI, James OK, Aigbavboa C and Gumbo T (2025) Safeguarding rural-urban linkages: modeling drivers of peri-urban sprawl and impacts on ecosystem services. Front. Sustain. Cities. 7:1535619. doi: 10.3389/frsc.2025.1535619
Edited by:
Gabriella Maselli, University of Salerno, ItalyReviewed by:
Paunita Iuliana Boanca, University of Agricultural Sciences and Veterinary Medicine of Cluj-Napoca, RomaniaMuhammad Salem, Cairo University, Egypt
Copyright © 2025 Dekolo, Ekum, James, Aigbavboa and Gumbo. This is an open-access article distributed under the terms of the Creative Commons Attribution License (CC BY). The use, distribution or reproduction in other forums is permitted, provided the original author(s) and the copyright owner(s) are credited and that the original publication in this journal is cited, in accordance with accepted academic practice. No use, distribution or reproduction is permitted which does not comply with these terms.
*Correspondence: Samuel Dekolo, ZGVrb2xvLnNAbGFzdXN0ZWNoLmVkdS5uZw==