 Teymour Heydari1
 Mansour Yeganeh
- 1Department of Architecture, Islamic Azad University of Shahrekord, Shahr-e Kord, Iran
- 2Department of Architecture, Tarbiat Modares University, Tehran, Iran
- 3Department of Architecture, Central Tehran Branch, Islamic Azad University, Tehran, Iran
Various research has been conducted to enhance thermal comfort as a disturbed indicator in the unbalanced development of built environments. Some researchers have focused on the form and geometry of urban blocks as influential factors. Also, some have studied the effect of greenery in urban walls on improving thermal comfort. By defining six categories and 22 subgroups of the geometry of urban blocks in Tehran, this research is focused on identifying the effect of green walls on urban blocks in Tehran and the effect on thermal comfort in summer. Different geometries were changed based on changes in the direction of wind corridors, the height of blocks, and shading. The simulation of scenarios to conduct studies has been done in ENVI-met software. The results showed that changing the building typology (even by applying green walls) was insufficient to provide outdoor thermal comfort in Tehran; however, the separate cubes scenario provided better outdoor thermal conditions. The results of this study highlighted the importance of solar shading for outdoor spaces, as well as considering adaptive opportunities in site design for landscape architects and site designers.
1 Introduction
Climate change, as one of the most significant environmental challenges facing the world, has extensive consequences for ecosystems and human societies. The unprecedented increase in temperatures and the frequent occurrence of heatwaves in recent years have revealed both the direct and indirect effects of this phenomenon on the environment and human life. This phenomenon is not limited to rising temperatures; it is also associated with changes in precipitation patterns, increased intensity and frequency of extreme events such as storms and floods, and the depletion of water resources. Reconsidering the designing of buildings and cities is essential for adaptation to these climate changes. Urban form is one of the fundamental factors affecting urban microclimate (Elnabawi et al., 2015; Middel et al., 2014), outdoor thermal comfort (Taleghani et al., 2015), urban heat island (Aflaki et al., 2017) and, ultimately, human health (Sanagar Darbani et al., 2021; Sharbafian et al., 2024). Several studies tried to evaluate the environmental performance of urban forms, which were summarized in Table 1. Urbanized urban air temperatures affect the buildings’ energy performance and outdoor thermal comfort (Tsoka et al., 2018).
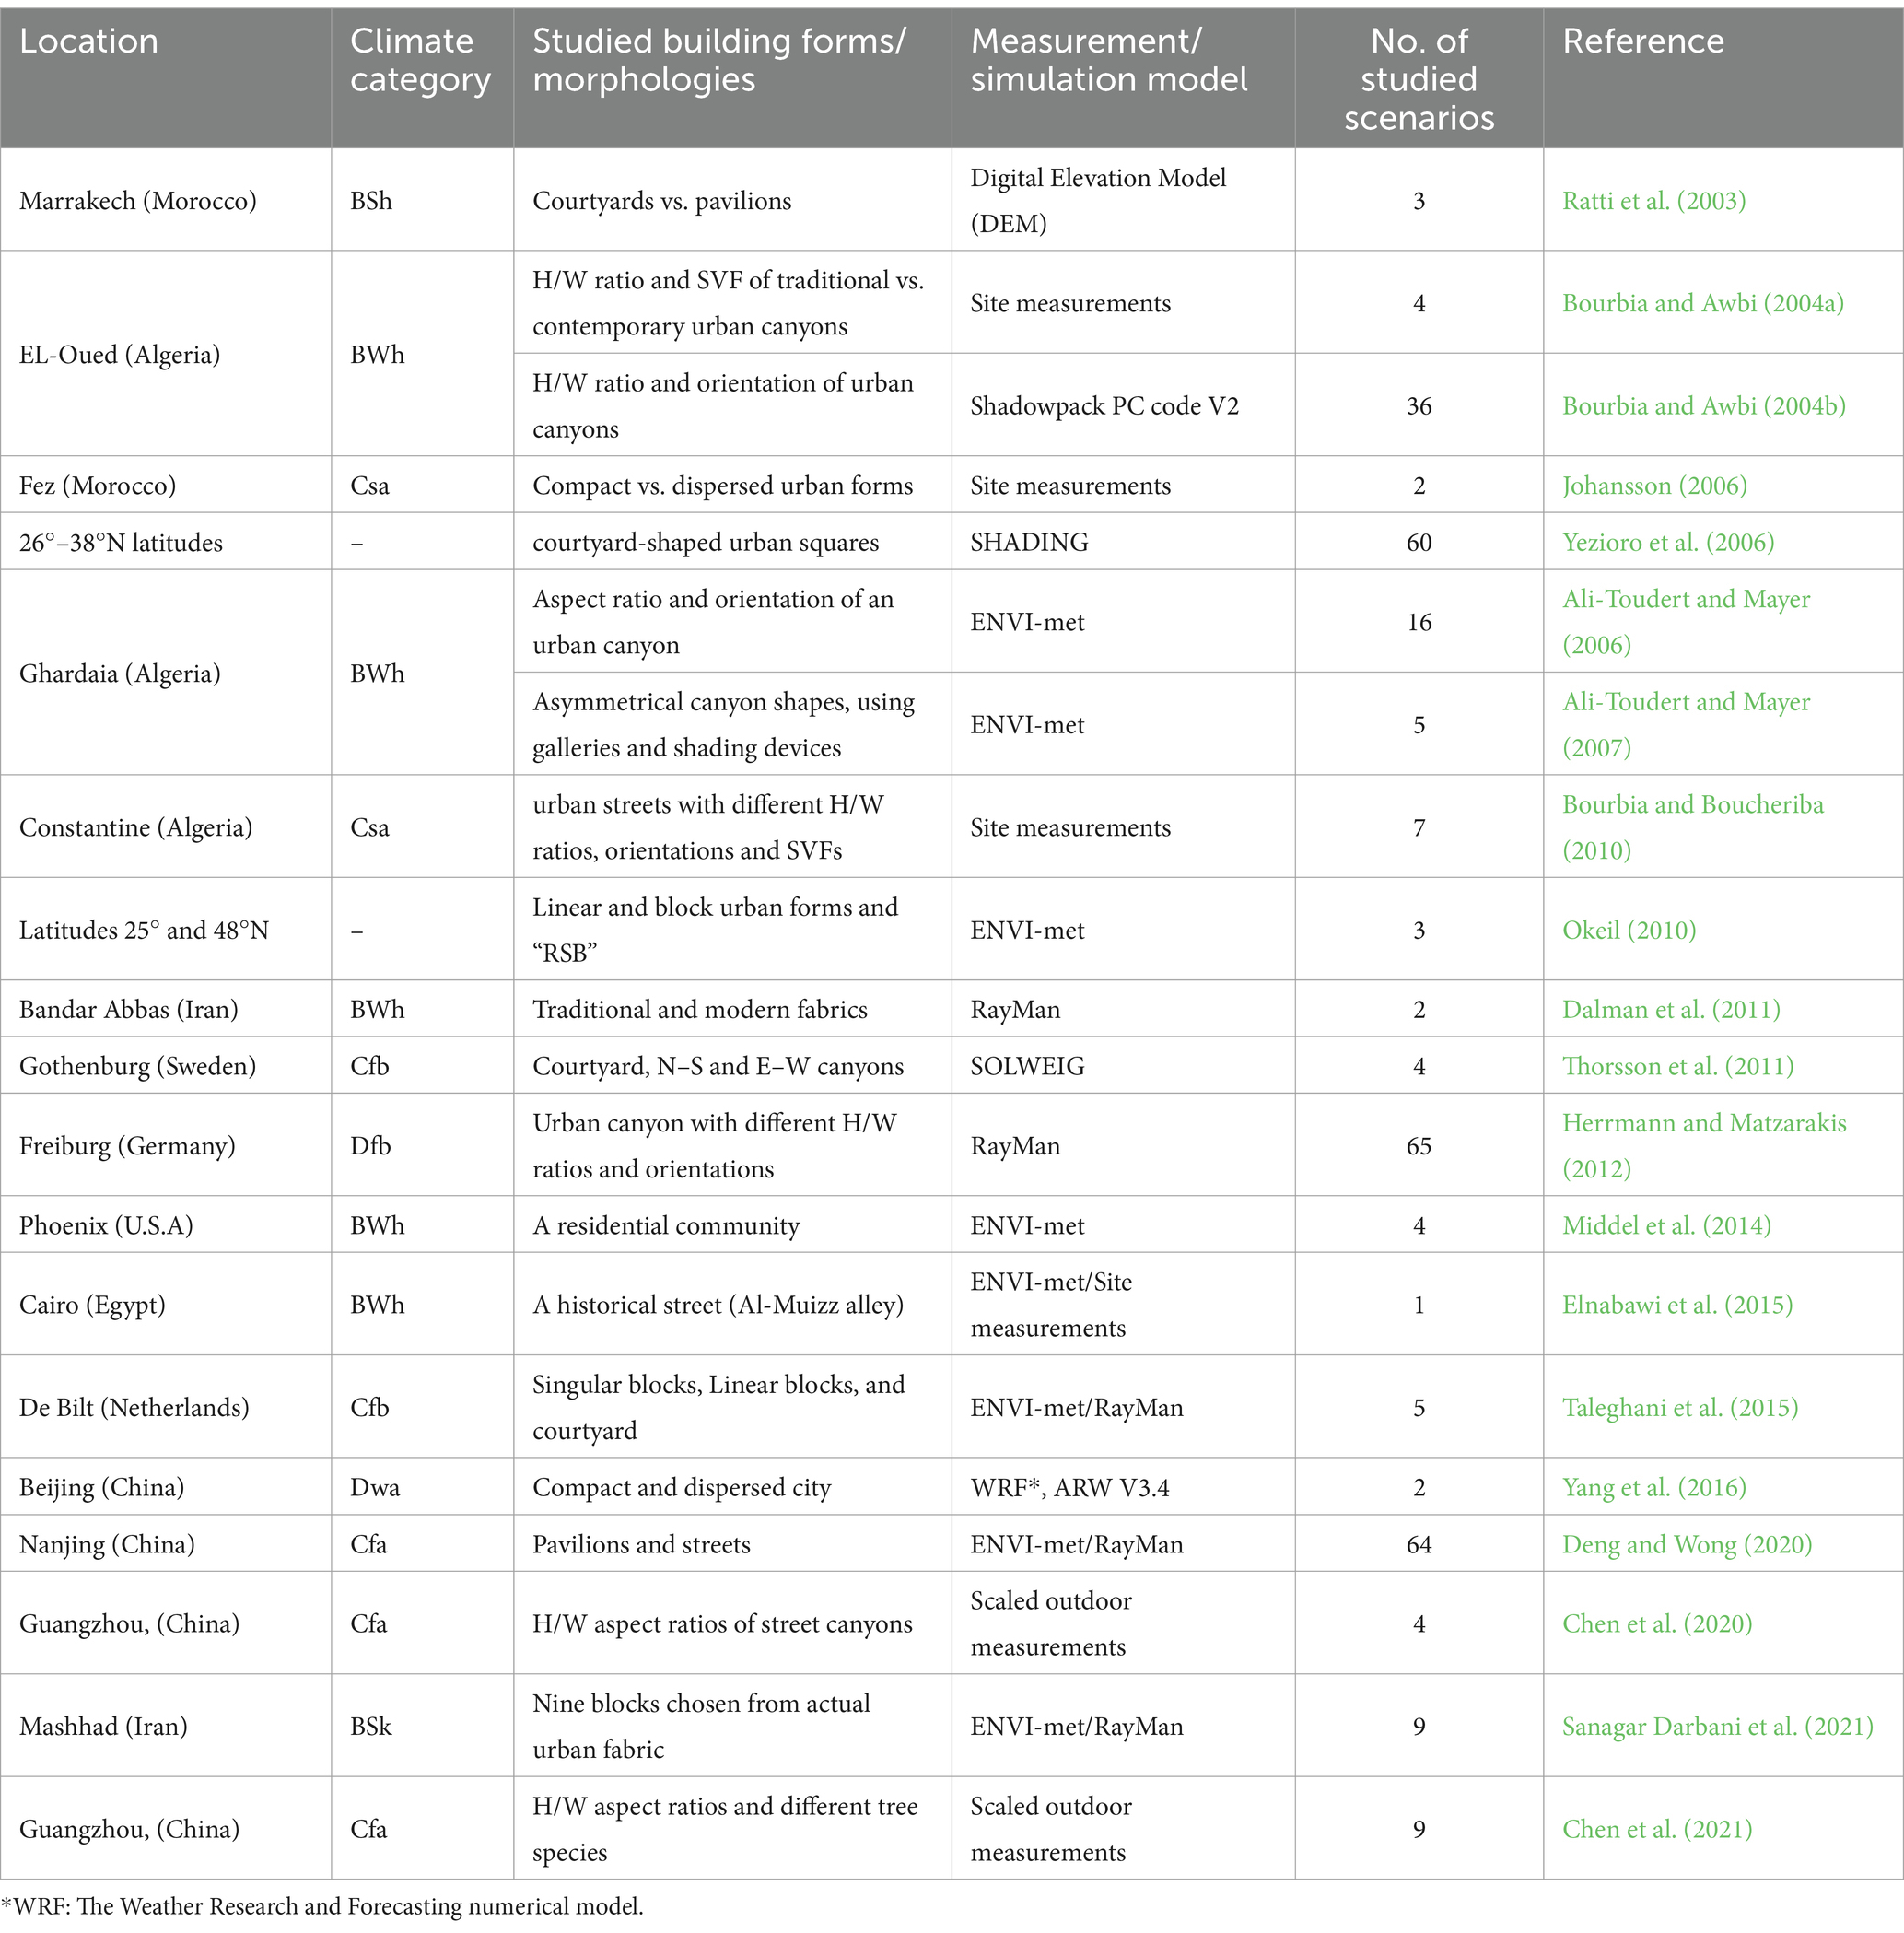
Table 1. Previous studies considering the impacts of urban form on outdoor thermal comfort.
Ratti et al. (2003) and Goharian et al. (2023) compared the environmental performance of the courtyards with pavilions and found large courtyards to be environmentally suitable in cold climates. Bourbia and Awbi (2004a, 2004b) investigated the effects of height-to-width (H/W) ratio and sky view factor (SVF) in traditional and contemporary urban canyons on the urban microclimate and solar shading and proposed design guidelines for preventing excessive temperature increase in urban canyons. Yezioro et al. (2006) simulated 15 different courtyard-shaped urban squares in four orientations, using SHADING software, and found a rectangular courtyard facing North–South responding better for cooling purposes. Ali-Toudert and Mayer studied the effects of the H/W ratio and orientation of an urban canyon (Ali-Toudert and Mayer, 2006) as well as asymmetrical canyon shapes and using galleries/shading devices in various orientations (Ali-Toudert and Mayer, 2007) on outdoor thermal comfort using ENVI-met simulation. They found lower air temperatures in higher H/W ratios. Johansson (2006) compared outdoor thermal comfort in two neighborhoods using field measurements and found compact urban forms more suitable in the summer, while dispersed forms were more favorable in the winter. Okeil (2010) proposed a building form called “Residential Solar Block (RSB)” and compared its thermal performance with linear slabs and pavilion courtyards, and found RSB to be more energy-efficient than others in the hot and humid climate. Middel et al. (2014) studied outdoor thermal comfort in four residential neighborhood landscape types in a residential community at a university campus. The studied neighborhoods had different orientations, surrounding surfaces, and vegetation types while building forms and morphologies were almost identical. Deng and Wong (2020) studied the impacts of urban canyon geometries (including aspect ratio and orientation) on outdoor thermal comfort and the street microclimate. However, few building morphologies were assessed in each of the mentioned studies. There is still a need to perform a comprehensive study that compares the environmental performance of multiple urban forms. Also, another study investigates the effect of greeneries (Type and Position) in urban canyons on thermal comfort and air pollution. Results stated that coniferous trees on sidewalks have the weakest, and Deciduous trees in the median strip alone can have the most favorable effect on improving air quality and thermal comfort in different seasons (Hosseini Alamdari et al., 2022).
It is worth mentioning that Thorsson et al. (2011) compared outdoor thermal comfort in urban squares with courtyard and N–S/E–W canyons and found unshaded open squares to be warmer than the street canyons in summer. A comparison of outdoor thermal comfort between singular building blocks, linear blocks, and courtyard blocks was also conducted by Taleghani and colleagues. They found shapes with a longer duration of solar radiation to have the worst comfort situation. However, these studies were conducted in the De-Bilt (Netherlands) and Gothenburg (Sweden) Marine West Coast climates, and investigations in other climates should be conducted (Taleghani et al., 2015).
Finally, Chen et al. (2020, 2021) studied the effects of different aspect ratios and tree species on wind speed and thermal environment. They conducted scaled outdoor experiments in a SOMUCH platform (Scaled Outdoor Measurement of Urban Climate and Health), including 33-row North–South street canyon models in Guangzhou, China. They found that vegetation can reduce wind speed by 29–70% at the pedestrian level while better shading is provided by single-row.
Based on the analysis of previous studies (Table 1), it has been identified that each research focuses on specific parameters depending on its objectives. However, only a limited number of studies have comprehensively and simultaneously evaluated the impact of these parameters. This highlights a scientific gap that the present study aims to address. The innovation of this research lies in the diversity and breadth of scenarios and parameters considered, particularly those related to thermal comfort. The primary aim of this study is to identify and analyze the significance of design parameters utilized in prior research and their impact on enhancing thermal comfort in buildings integrated with greenery elements. Overall, this study seeks to contribute to the improvement of the design process for buildings that prioritize sustainability and thermal comfort by offering a comprehensive approach (Acero and Herranz-Pascual, 2015; Salata et al., 2016).
In this research, we aim to identify the typical patterns of urban blocks in Tehran. After classifying these patterns into six main groups, we will discuss the effect of green walls on thermal comfort on a human scale. Therefore, 22 patterns were defined in six groups (Acero and Herranz-Pascual, 2015).
Changing the orientation of the forms and the height of different parts of the blocks in each group led to the construction of different subgroups. These changes lead to effects on lighting, changes in wind direction, and wind tunnels and chimney effects. Identifying the effect of these changes in the appearance of green walls on thermal comfort was one of the goals of this research, which was done by computer optimization in Envi-met software and measuring various indicators related to thermal comfort (Cortes et al., 2022; Wang and Zacharias, 2015).
2 Methods
2.1 Study area
The study was conducted in the city of Tehran (Figure 1), which is the capital of Iran (35.62°N; 51.42°E; 1,190.8 m Elevation), with a hot and semi-arid climate, classified between Csa (in the northern areas) and BWk (in the southern regions) in the Köppen-Geiger classification system. As shown in Figure 1, August is the warmest month (mean Ta = 30.1°C), and January is the coldest (mean Ta = 3.9°C); while max Ta exceeds 40.0°C in July, the minimum air temperature surpasses −5.0°C in January. The average relative humidity is highest in January (60%) and lowest in June (22%) (Hedquist and Brazel, 2014).
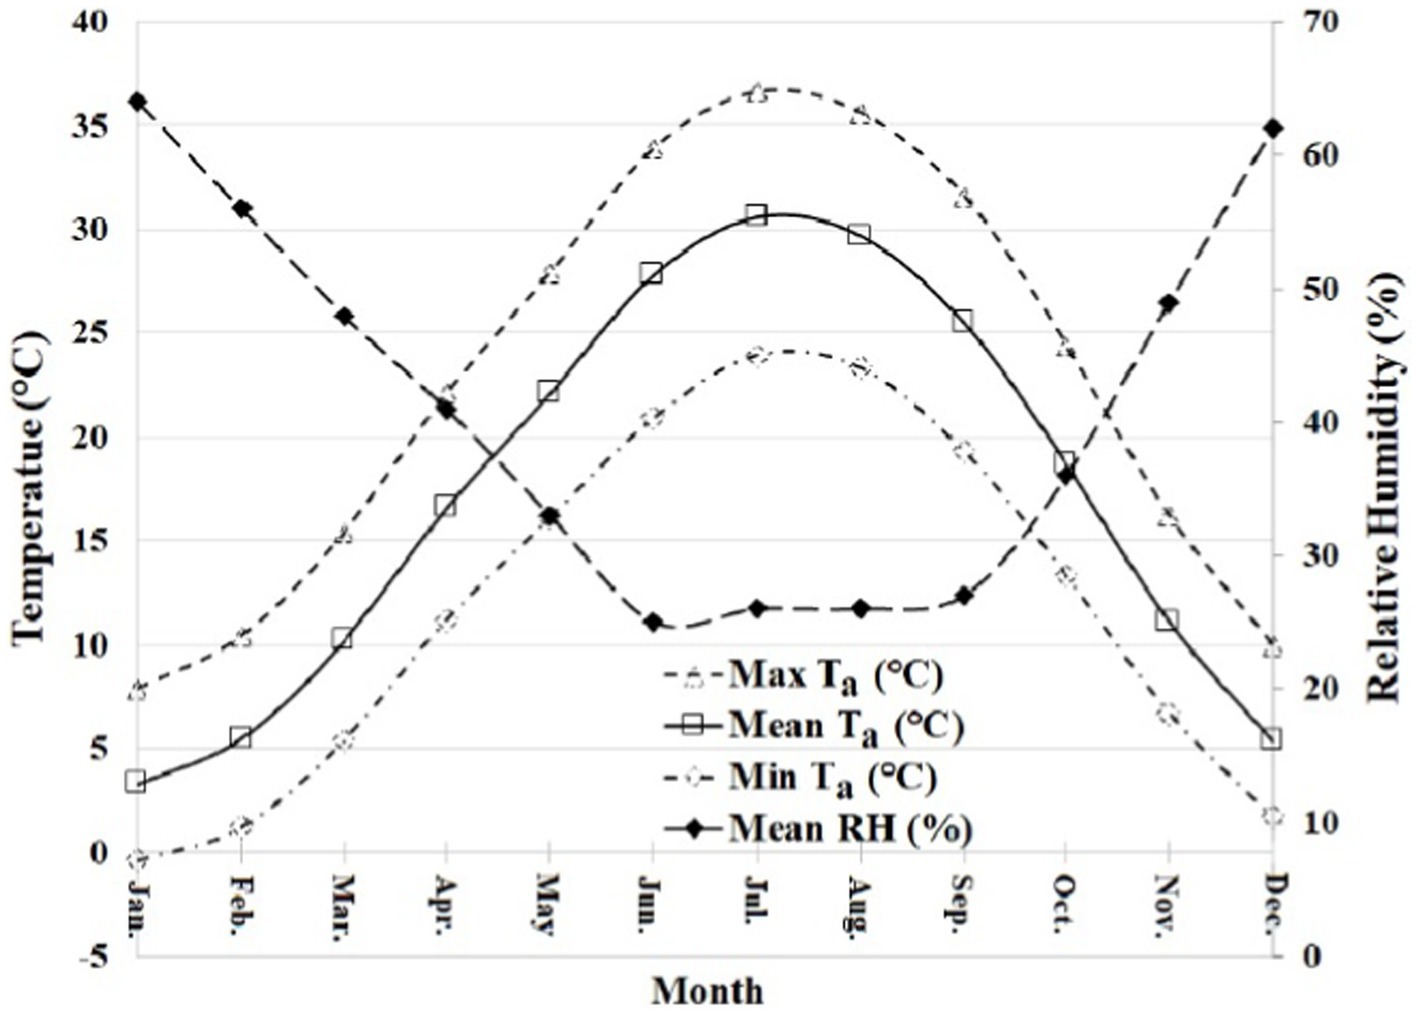
Figure 1. The monthly average of min and max temperature and relative humidity average in Tehran, Iran (based on the experimental study in Tehran by the Iran Meteorological Organization).
Considering that there have been no significant climate changes in the last few years in the city of Tehran, the climate data for 2019 is considered a typical climate year for the city of Tehran. The diagram in Figure 1 can be a basis for the present research. They are also considering that in this research, the amount of temperature change and indicators related to thermal comfort due to the amount of greenness and the type of tissue typologies and urban blocks are considered. Therefore, in case of slight changes in metrological parameters, the study’s results will not be affected. However, based on the data of the Iranian Meteorological Organization, the above diagram has been a reference for the modeling of this research.
2.2 Microclimatic model and simulation
Computational Fluid Dynamics (CFD) simulation software is the most effective technique for evaluating the impacts of urban forms on microclimatic variables and thermal comfort (Aflaki et al., 2017). ENVI-met is an easy-to-use CFD modeling software commonly used by researchers in various disciplines focused on the urban environment (e.g., landscape architecture, urban planning, civil engineering, and urban climate). The model’s relatively simple input scheme and user-friendly interface allow almost any researcher with minimal expertise to simulate complex urban geometries and vegetation. It is widely employed not only for investigating existing outdoor microclimate environments but also for assessing the performance of urban heat island mitigation strategies and studying outdoor air quality based on the dispersion and deposition of pollutants.
ENVI-met relies on RANS equations to solve the model physics (Fischereit and Schlünzen, 2018). The design of the model interface is intuitive and simple enough for any researcher to be able to quickly set up an experimental domain and begin to conduct simulations with the software (Faragallah and Ragheb, 2022; Ghaffarianhoseini et al., 2015).
2.3 Model validation
2.3.1 Validation of ENVI-met
ENVI-met (Bruse and Fleer, 1998) is an on-hydrostatic Computational fluid dynamics (CFD) model used to simulate microscale interactions between surfaces, vegetation, and the atmosphere in the urban canopy layer. The ENVI-met model is one of the most widely employed dynamic simulation tools (Tsoka et al., 2018). The analysis revealed that the model can be considered as a helpful tool for urban climate analysis, provided that its limitations and features are accounted for by the user during the interpretation of the simulation outcome (Tsoka et al., 2018).
Many previous studies validated the ENVI-met simulation results; e.g., Simon et al. (2018) found that ENVI-met can accurately simulate microclimate models in a complex urban environment. Some other studies found strong correlations between simulated and observed meteorological variables. The reported coefficient of determination (R2) between the simulated and measured values was between 0.783 and 0.976. The reported Root Mean Square Error (RMSE) values indicated the average error between 0.26 and 0.626, indicating ENVI-met as an appropriate tool for simulating the outdoor thermal environment with acceptable accuracy (Jänicke et al., 2015).
Several studies validate their results for air temperature using observed vs. modeled error metrics, but they have not examined how sensitive the model is to its parameters (Chow and Brazel, 2012; Emmanuel and Fernando, 2007; Middel et al., 2014; Yang et al., 2013). Some researchers have also recommended for more thorough testing of numerical modeling of the environment because they are less confident in ENVI-ability met’s to accurately describe heat transfer between buildings and the atmosphere (Buccolieri et al., 2015; Maggiotto et al., 2014). There are statistical disparities amongst models, but according to Crank et al. (2018), these differences aren’t as significant as the shift in surface albedo. As a result, the estimated variations in mitigation measures are less significant than the relative amount of the error associated with model resolution (Ketterer and Matzarakis, 2015; Lee et al., 2016).
Crank et al. mentioned some failures of grid independence in the “flat” domain simulations. Relief methodologies result in temperature changes that are an arrange of greatness bigger than the blunders presented by network reliance for the level space, a need for network freedom itself does not fundamentally nullify the utilize of ENVI-met for warm relief inquiries (Crank et al., 2018).
2.3.2 Measurement versus simulation
In this step, one ENVI-met model (the courtyard shape as a sample) was validated through a comparison between field measurements and simulation results. The measurements were done in Tehran according the Figure 2.
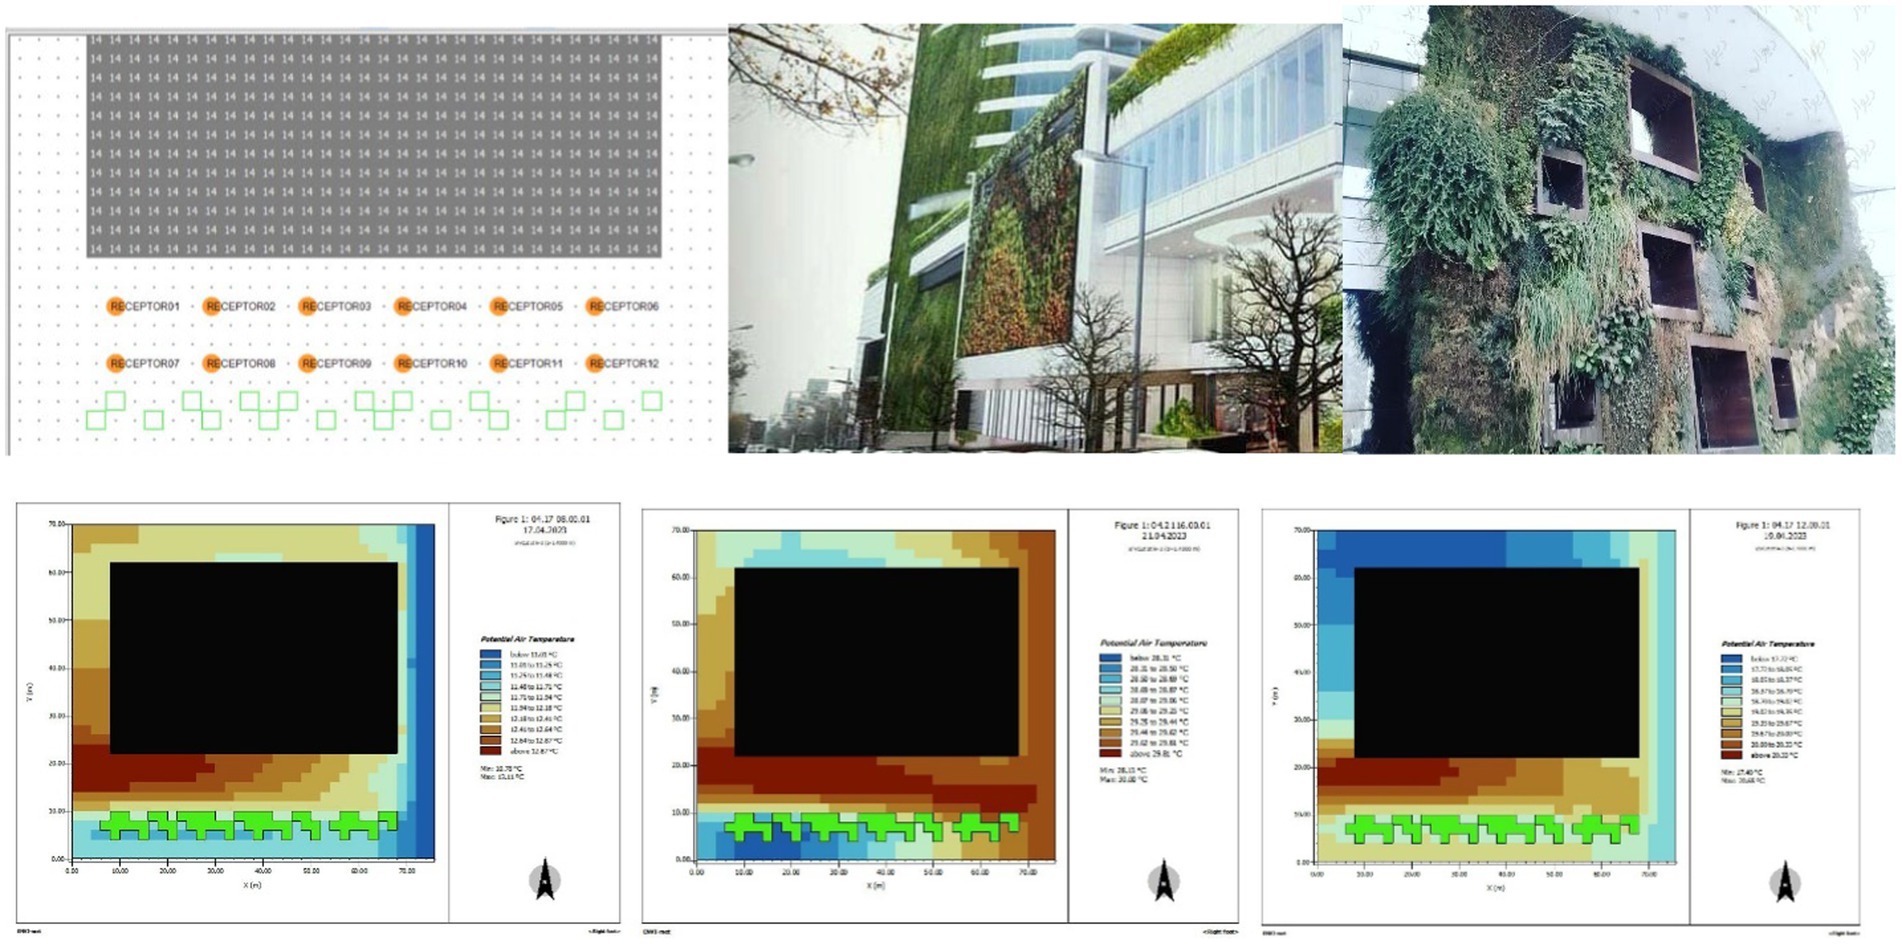
Figure 2. Plan of the simulation space based on the existing situation in an east–west street and the views of the buildings in the wall (Top). Heatmap for air temperature index on May 17, 19 and 21, 2023. From left to right, respectively (Bottom).
To validate the simulation within the software, a comparative analysis has been conducted between the software-generated data and environmental measurement data. The typology selected for validation follows the East–West linear pattern. Based on the current condition of the street wall, the modeled cut spans a length of 60 m. This street runs east to west, with one side featuring a continuous row of tall trees approximately 14 m in length, while the opposite side consists of a row of buildings incorporating green walls in various sections of the facade, along with plants and green spaces (Figure 2). The simulation inputs in the software are precisely based on the parameters and characteristics of the existing situation.
The simulation was conducted for the temperature variable, with a comparative analysis performed over 3 days: May 17, 19, and 21, 2023. The simulation hours on these days ranged from 7: 00 am to 10:00 pm. During each hour, the simulation outputs and field measurements were recorded and compared. The data from the simulation and temperature measurements were collected at points 2, 5, 7, and 10 (Figure 2, bottom). A comparative analysis of the field measurements and simulation outputs was carried out, ensuring that both sets of data were captured at a height of 140 cm above the ground. The data collection locations and methods were consistent at points 2, 5, 7, and 10, and a detailed comparison between simulation results and field measurements was performed. As it is clear from the heat map maps in 3 days, the temperature varies noticeably on different days and hours.
Figure 3 has been prepared to determine the degree of difference between simulation-generated data and real-world data. Specifically, these data were collected from four distinct points between the blocks, covering the time period from 7 a.m. to 10 p.m. An analysis of the results indicates the presence of a clear and identifiable pattern between the data obtained from the two methods used. This pattern accurately and transparently illustrates the trends over different time intervals and reflects a relative consistency between the information recorded by the two methods. Analyzing such a pattern can contribute to a deeper understanding of the processes and various aspects of the data and provide a credible basis for evaluating and refining future methodologies in this field. Therefore, by highlighting the meaningful correlation between these datasets, greater clarity can be achieved in analyzing and interpreting the results, which plays a significant role in decision-making processes (Figure 3, bottom).

Figure 3. Comparative air temperature comparison using simulation and field measurement data and correlation between them (Bottom).
To evaluate the quality and reliability of simulated data compared to real-world data, a linear correlation chart has been utilized. This chart systematically and accurately illustrates the relationship between the two datasets. Statistical analysis conducted on these data reveals that the calculated correlation coefficient is 0.92, indicating a strong and meaningful relationship between the simulated and real data. This finding significantly underscores the credibility of the modeling approach and the precision of the simulation methods. The positive linear correlation between these two datasets demonstrates that the methods used in the simulation process have effectively predicted the actual behavior of the system. This alignment highlights the efficiency of the models in adapting to real-world conditions and their capability to deliver reliable results for use in research and practical projects. The final conclusion of this analysis confirms the accuracy and applicability of the simulation tools, as well as the alignment of predicted data with existing realities. This serves as a solid foundation for making informed decisions and designing optimized solutions for future applications (Figure 3, bottom).
2.4 Modeling process
Based on the buildings ‘form, simulation scenarios were divided into six main groups. Each group consisted of several subsets. The independent variables included form, height, the orientation of the buildings, and the percentage of the external walls covered by each material (concrete wall, glazing, and green wall). In contrast, the dependent variables included biometeorological indices (PET, PMV, PPD, and SET). The material types were similar in all scenarios.
2.4.1 Simulation scenarios
In the process of selecting the morphological types under investigation, every effort was made to carefully consider all essential factors to ensure that the research results are comparable with prior related studies. Accordingly, the morphological types chosen as the primary basis are those that have been utilized in credible modeling and previous research related to the city of Tehran. This selection was aimed at achieving more accurate results while enhancing the scientific validity of the study (Figure 4).
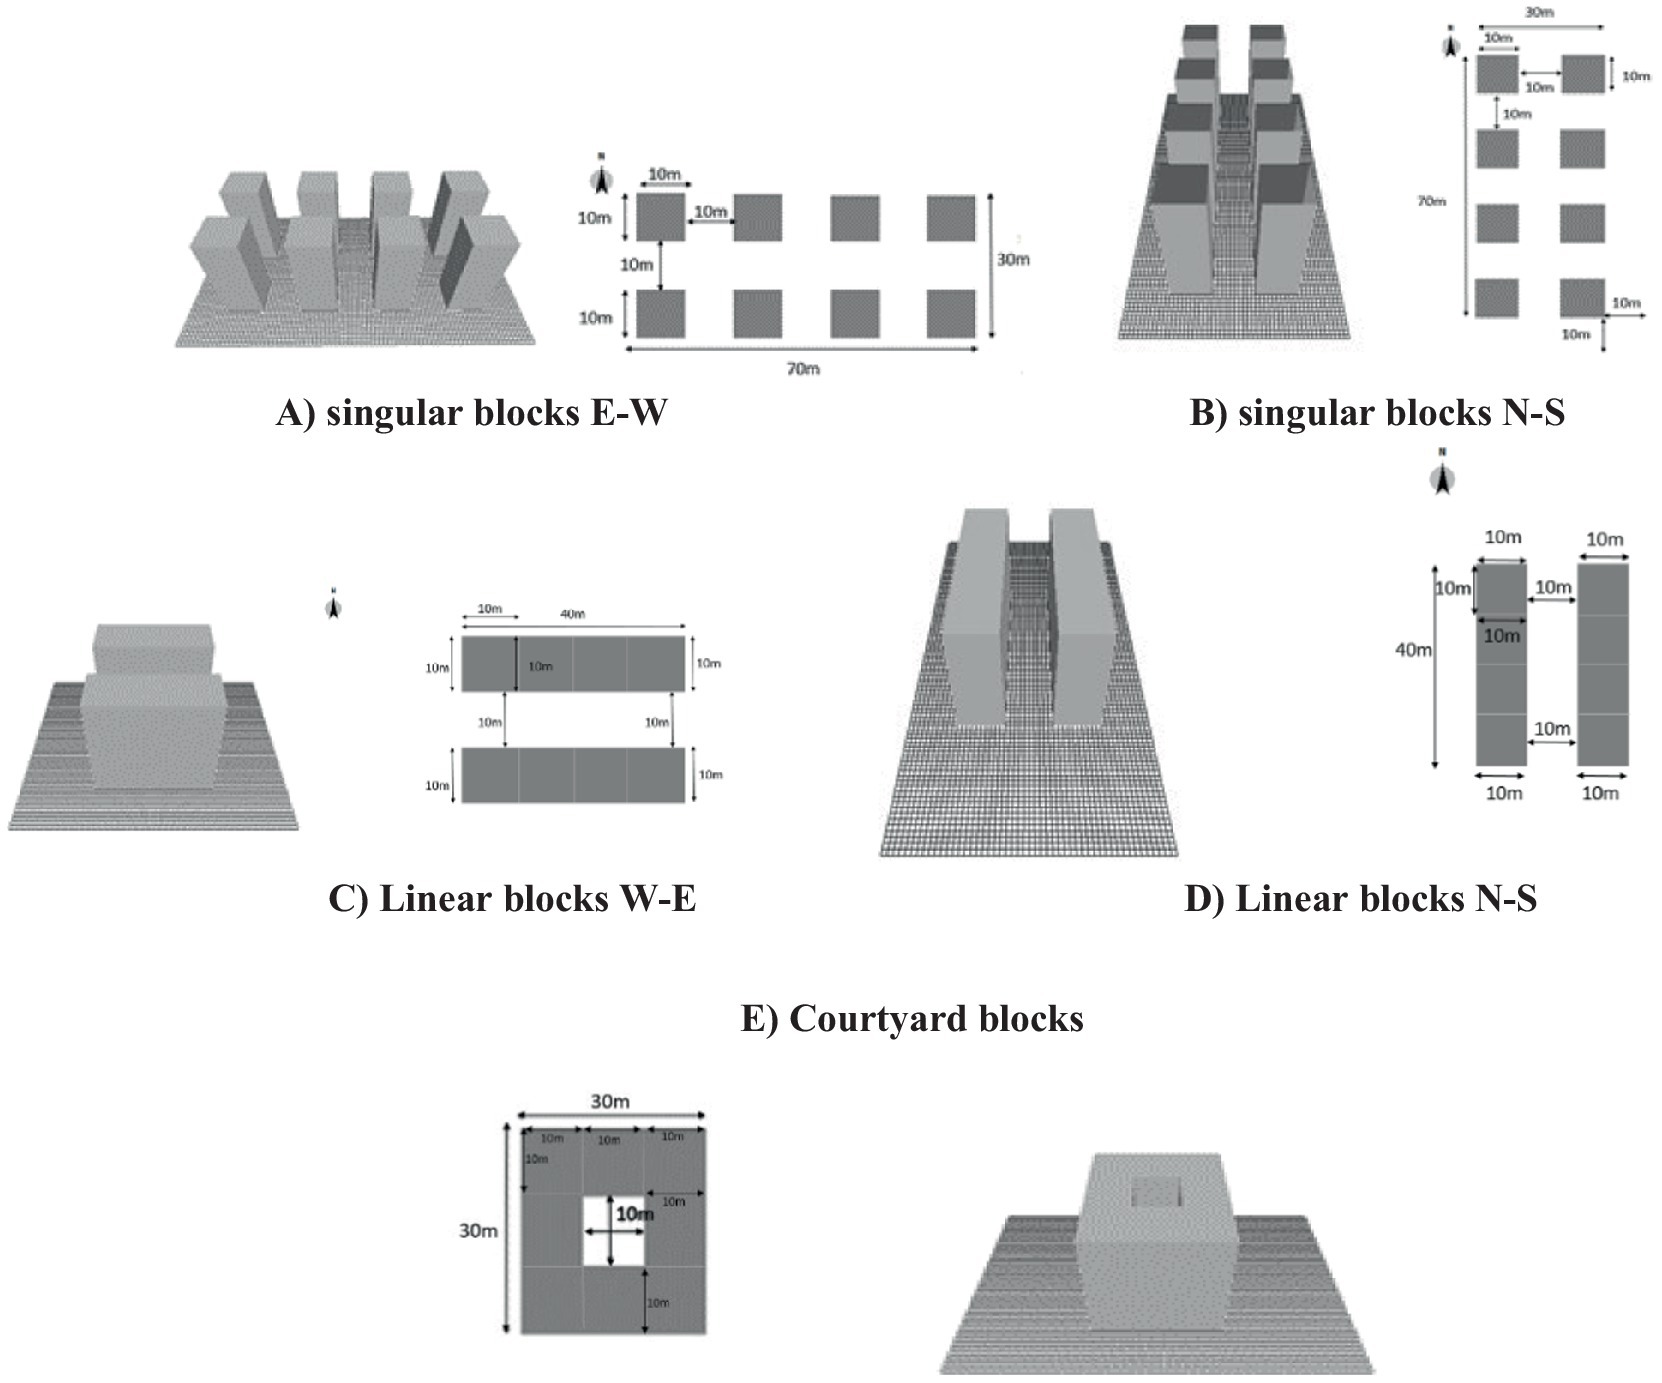
Figure 4. Blocks selected from related research to compare results and blocks recognized as valid and valid in previous research (Taleghani et al., 2014).
Furthermore, to ensure complete compatibility of the selected morphological types with the urban fabric and construction characteristics of Tehran, only common and widely-used types that are aligned with the city’s urban structures were taken into account. This approach, considering the structural diversity and unique features of Tehran, has enabled more precise analysis and effective application in both practical and research-oriented contexts. Therefore, the selection of morphological types was carried out in a manner that aligns with research requirements as well as the practical needs associated with urban planning (Figure 5).
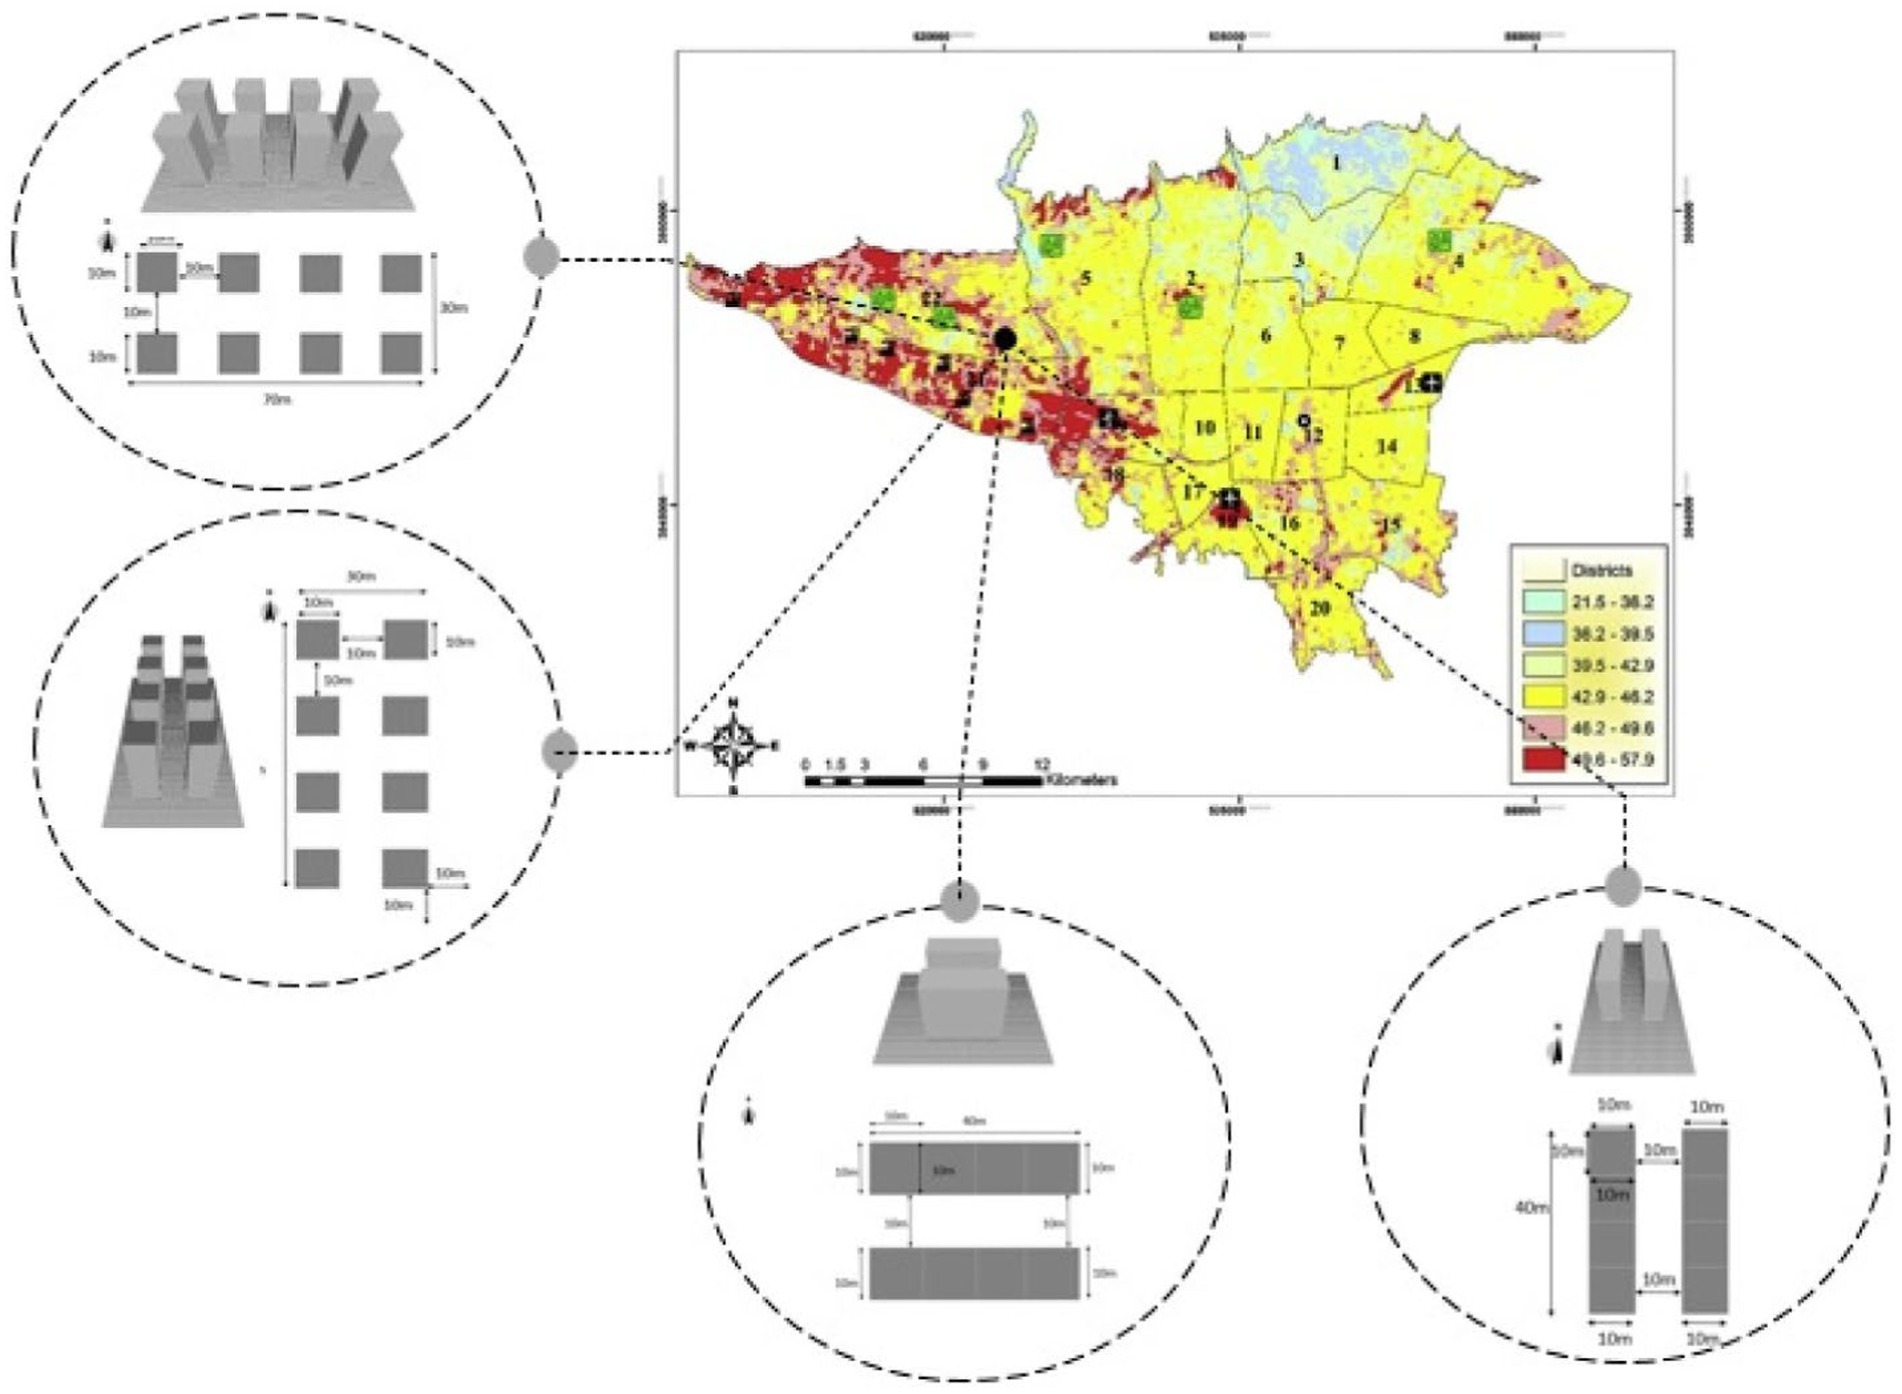
Figure 5. Typical morphologies of building blocks in Tehran based on research.
It should be noted that the pattern of the central courtyard is widely used and repeated due to its excellent compatibility with climatic conditions. Therefore, it is one of the most critical patterns for modeling the central courtyard with different complete and three-sided shapes and in different directions. It is worth mentioning that the diversity and multiplicity of morphologies and typologies in the urban block are high, and the basis for choosing typologies to limit the scope of modeling is to use patterns similar to previous research and common patterns in the urban context of Tehran.
Basic and standard models justified in previous studies have been used to justify dimensions (Figure 5). The researchers analyzed the common configuration in Tehran and selected four different configurations (singular blocks E–W [SC1], singular blocks N–S [SC2], Linear blocks E–W [SC3] and Linear blocks N–S [SC4]) and courtyard blocks based on previous studies (Taleghani et al., 2014). After determining the optimal dimensions of a building block, we studied 6 of them in a different configuration (Figures 4, 5).
The studied scenarios were classified into six prototypes as follows: (A) Modular separate cubes, (B) Parallel Strips, (C) Closed Courtyard, (D) U-shaped Courtyard, (E) Cross Corridor Courtyard, and (F) Indirect Corridor Courtyard (Figure 6).
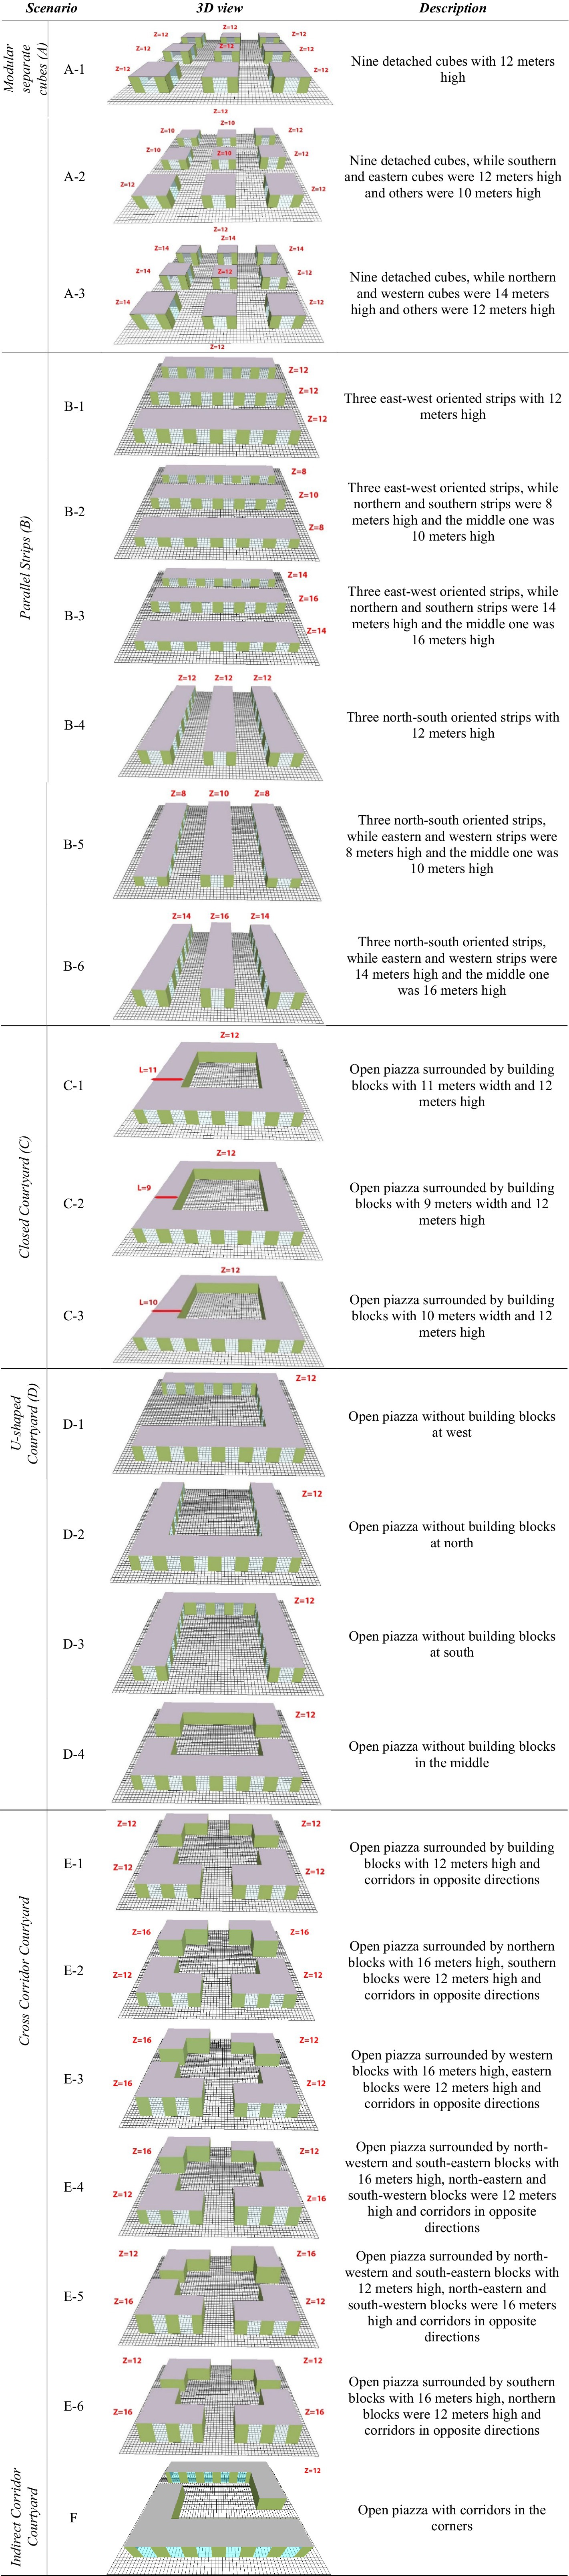
Figure 6. Specifications of the studied scenarios.
2.4.2 Materials
The specifications and features of the applied materials and other simulation settings are mentioned in Table 2.
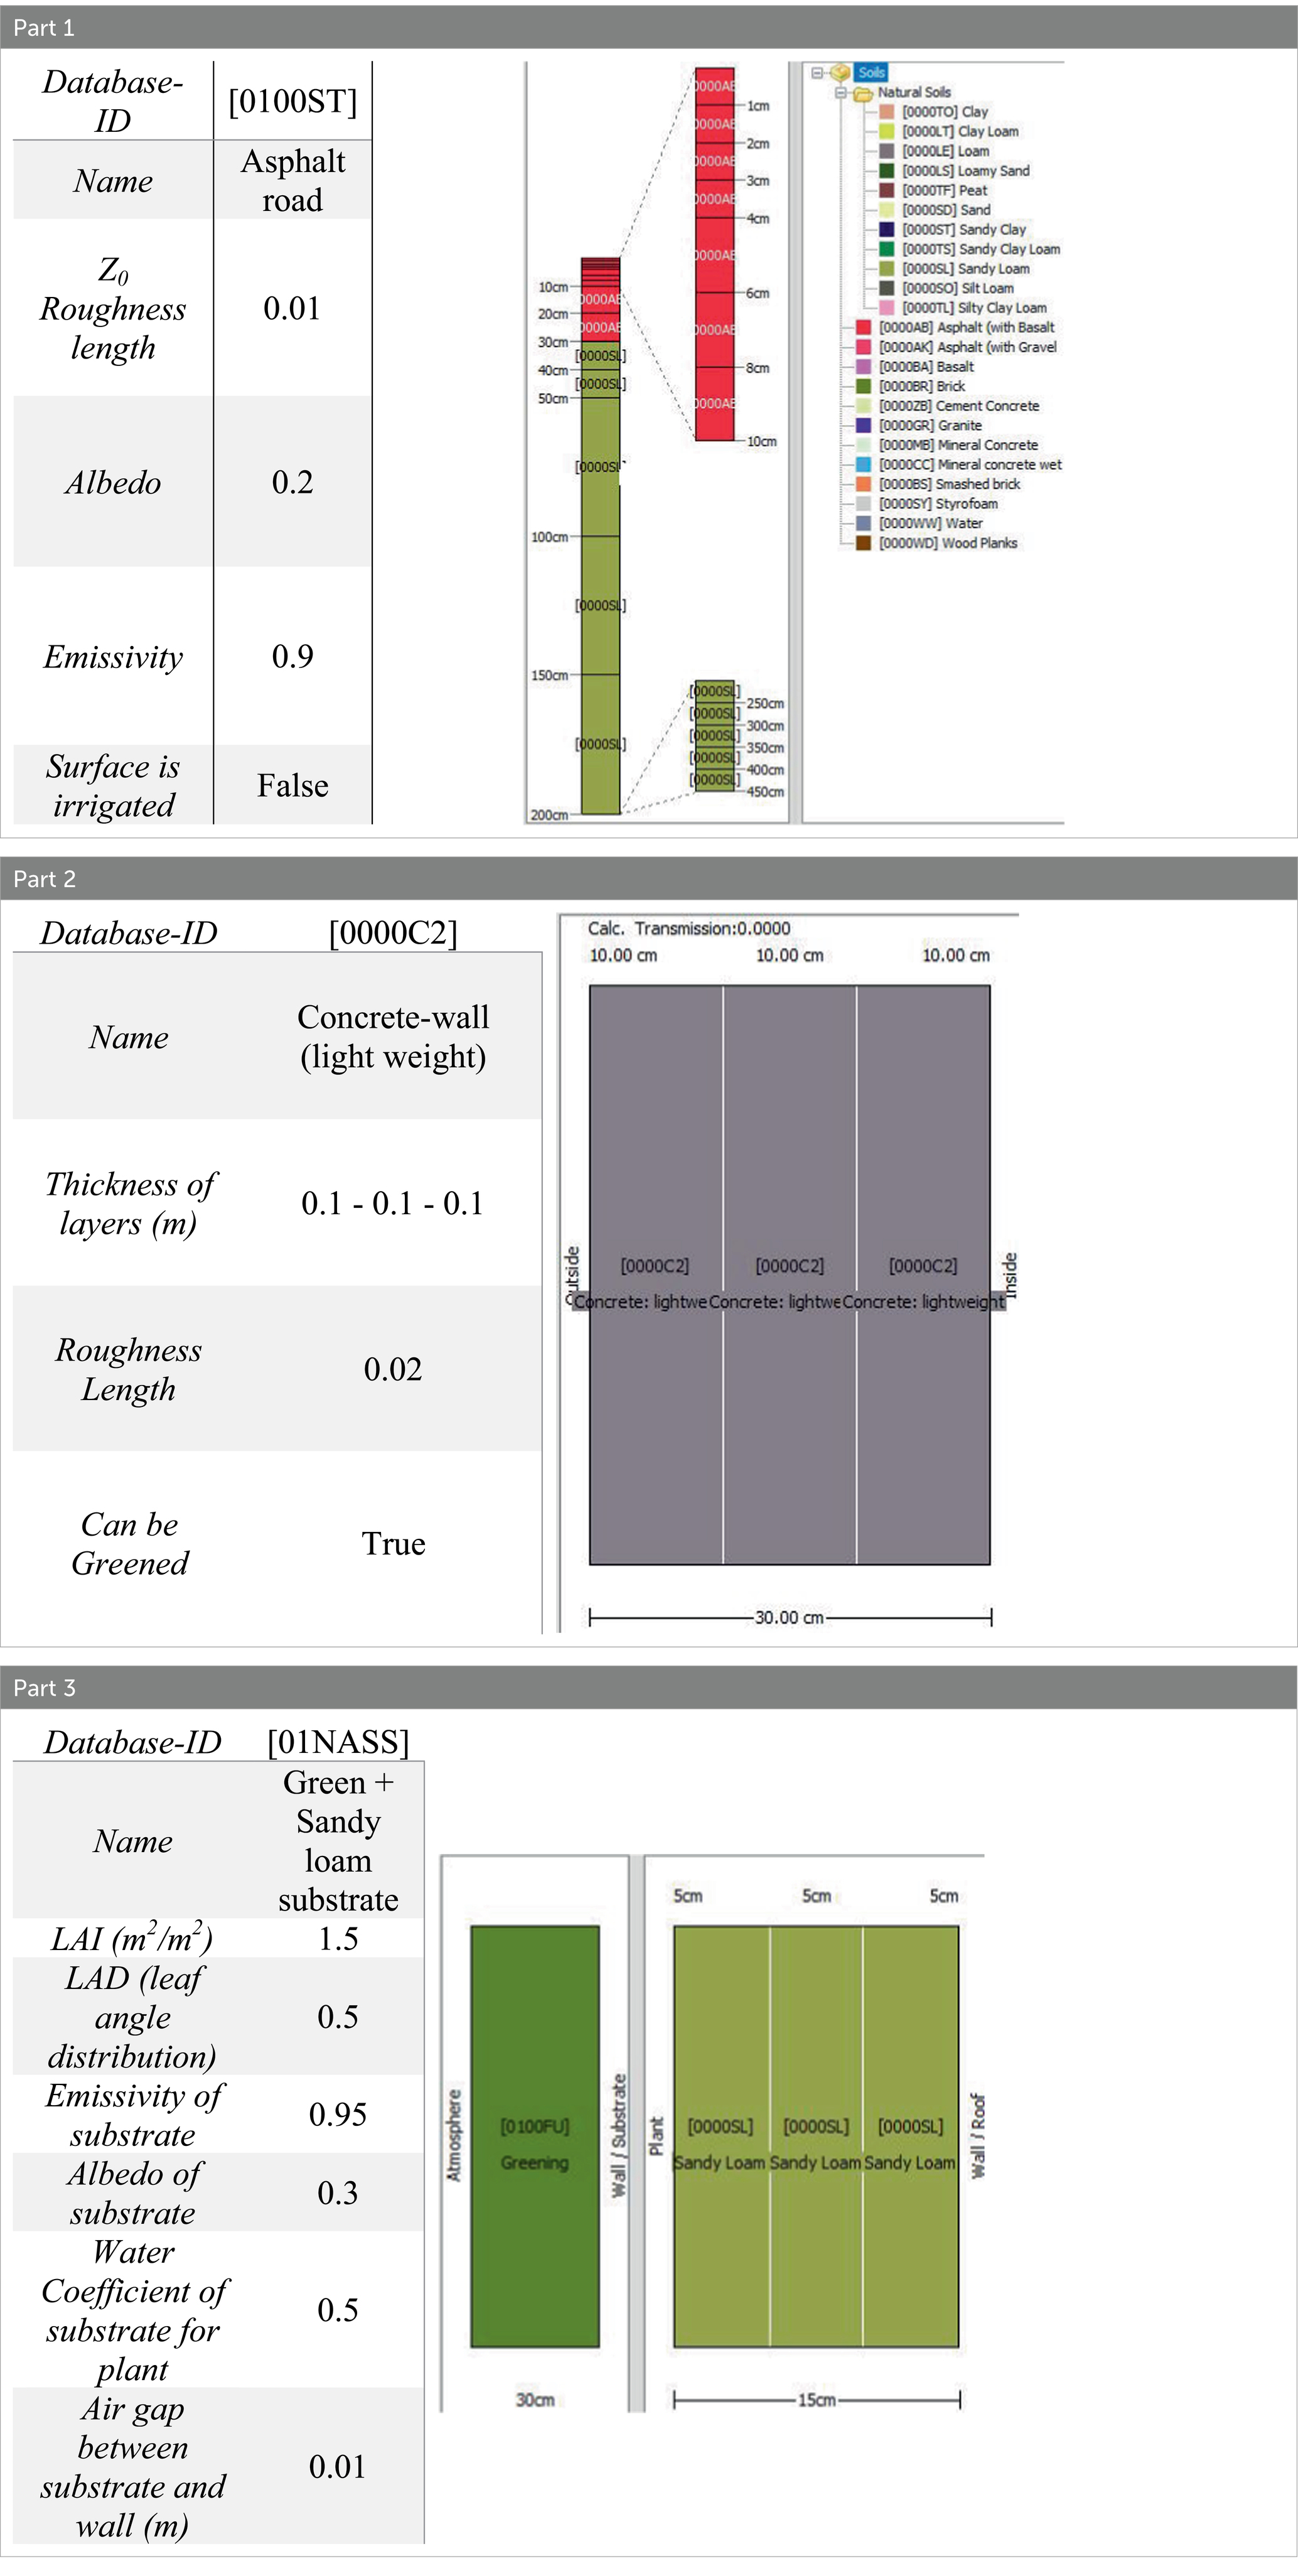
Table 2. Specifications and profile of the road surface material (Asphalt-0100st) (Part1), specifications and profile of the wall and ceiling materials (Part 2), specifications and profile of the green wall materials (Part 3).
The ground surfaces were covered with asphalt with 20% albedo and emissivity of 0.9, which was not irrigated (Table 2, Part 1). Default walls and ceilings were made of concrete with 30 cm thickness (Table 2, Part 2). The external walls were green (including a green layer plus sandy-loam substrate) with different characteristics, which are presented in Table 2. The glazing materials for external windows were selected from “Plexi-Glass,” with specifications given in Table 2, Part 3.
The X–Y–Z dimensions of the model were 60 × 60 × 60 grids, while the grid resolutions were 2 m × 2 m × 2 m (Table 3, Part 1). The total simulation time for each scenario spanned 6 h from 13:00 until 19:00 on June 21, 2020; when the air temperature ranged between 25.3°C and 37.3°C, and relative humidity ranged between 9 and 20%. The meteorological boundary conditions are presented in Table 3, Part 2.
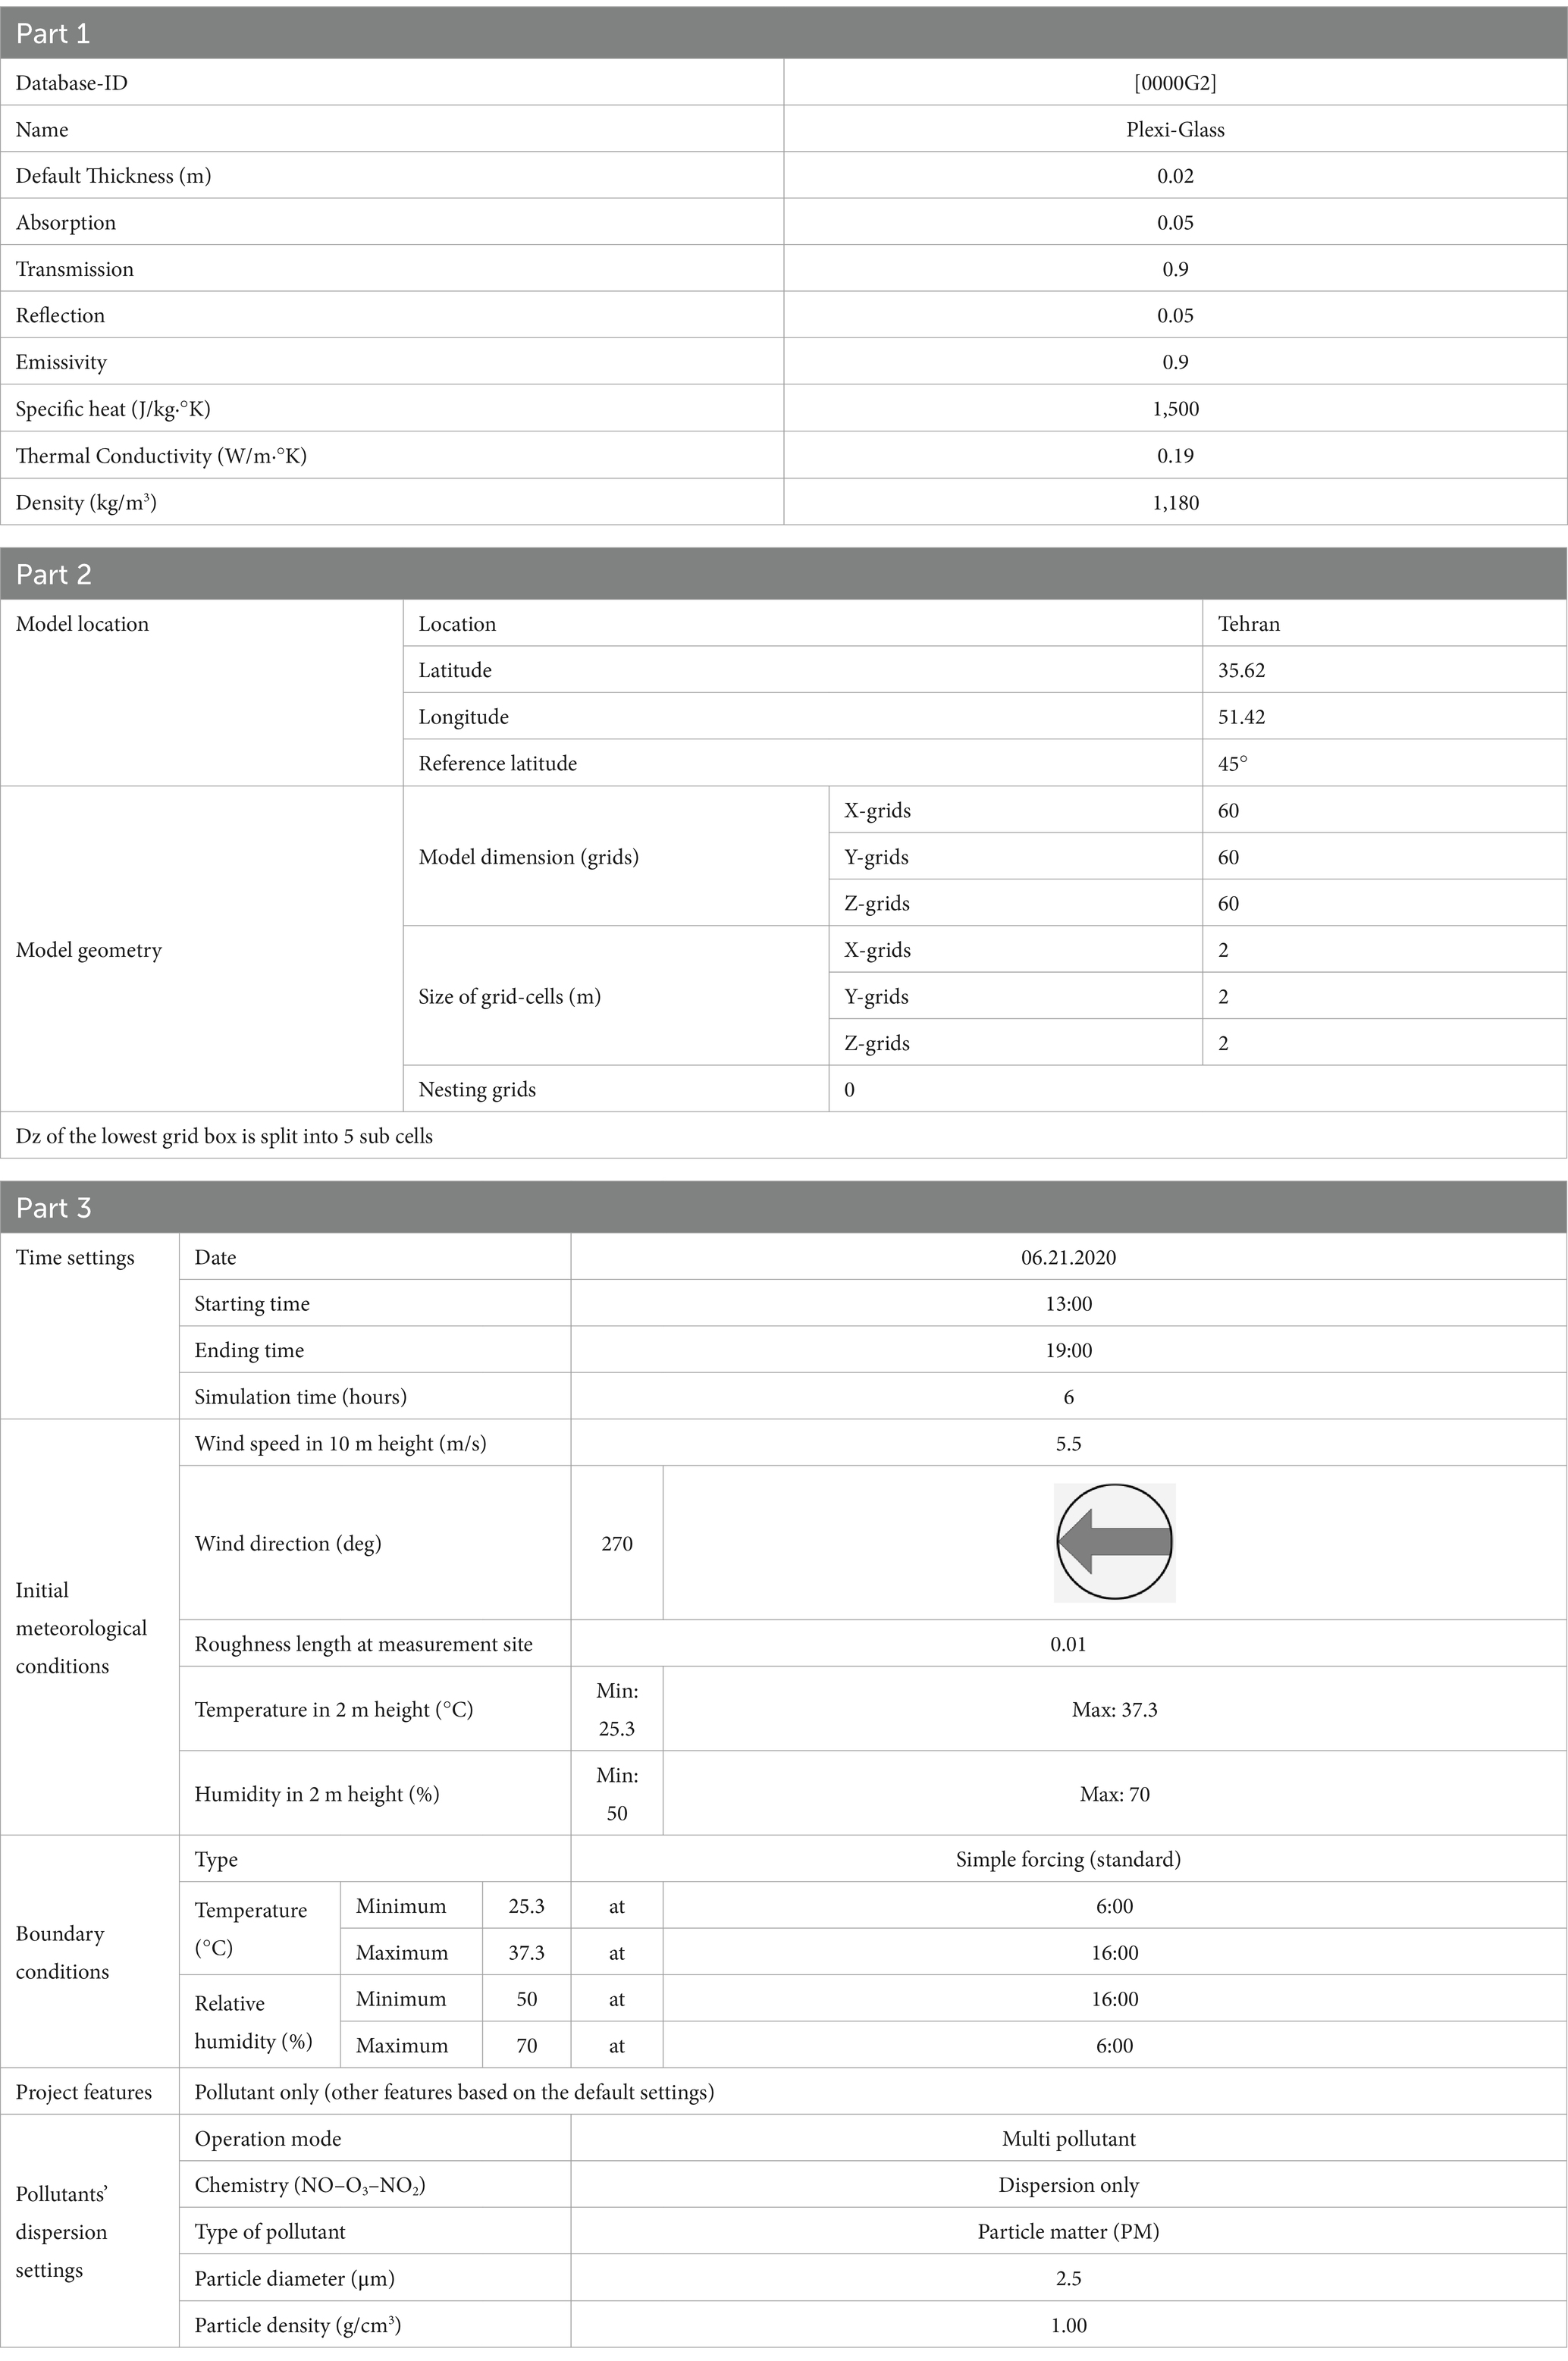
Table 3. Specifications of the Glazing material (Part 1), settings in the ‘spaces’ subprogram (Part 2), and simulation settings (Part 3).
2.5 Selecting thermal indices
Three thermal indices (including PET, PPD, and SET*) and Ta were outputted by ENVI-met software and further used for detailed analysis of the thermal environment. A brief description of the selected thermal indices is as follows.
2.5.1 Physiologically equivalent temperature (PET)
PET was proposed and developed by Höppe (1999) based on the Munich energy-balance human body model (MEMI). PET is considered the most widely used index for evaluating thermal comfort in outdoor spaces (Potchter et al., 2018). This index is also accepted by the VDI 3787 German guideline (VDI 3787, 2008). Accordingly, the physiologically equivalent temperature index was used in the present study to evaluate the thermal comfort conditions in the simulated models.
2.5.2 Predicted percentage of dissatisfied (PPD)
The PMV index, initiated is accepted by the ISO 7730 international standard (ISO 7730, 2005). PPD is another index proposed by the ISO 7730 standard for evaluating the level of thermal comfort. This index, which predicts the estimated percentage of people dissatisfied with thermal conditions, is not independent and is calculated using the PMV value based on the following formula (ISO 7730, 2005).
The lowest defined PPD value is 0.05, which means that even in the best comfort conditions, at least 5% of people still feel dissatisfied with the thermal environment. However, the maximum PPD rate in harsh environmental conditions can reach up to 100%, which means everyone is likely to feel dissatisfied with thermal conditions.
2.5.3 Standard effective temperature (SET*)
SET* was first proposed by Gagge et al. (1986) based on Gagge’s two-point model. This index is the third most widely used index for evaluating thermal comfort in outdoor spaces (Potchter et al., 2018) and has been used in many studies to evaluate thermal comfort in outdoor spaces (Johansson et al., 2018; Sen and Nag, 2019; Ulpiani et al., 2019). In Tehran, the thermal comfort ranges for the Physiological Equivalent Temperature SET are between 20.5°C and 25.5°C, a range that depends on the specific climatic conditions of the area. Due to its predominantly hot desert or semi-arid climate, Tehran displays a significant diversity in thermal indices and a need to ensure comfort in various spaces. These climatic conditions have a direct impact on the design and management of heating and cooling systems, architectural styles, and urban spaces in order to provide suitable thermal comfort based on optimal values of the physiological equivalent temperature.
However, a comparison of the nine most widely used indices for assessing thermal comfort conditions in Tehran has shown that SET*’s original scale is one of the weakest indices for evaluating thermal comfort in outdoor spaces in Tehran. However, since this index can be obtained as one of the outputs of ENVI-met software, and considering the availability of the modified scale of this index for Tehran, values of this index were also assessed in this study.
3 Results
3.1 Maximum air temperature
The mean maximum temperature of the site areas at different afternoon hours on June 21 is shown in Figure 7. The results make it clear that the mean maximum air temperature of the entire site reaches its lowest value in A-2 and A-3 scenarios (Nine detached cubes, while southern and eastern cubes were 12–14 m high and others were 10–12 m high). As a result, thermal dissatisfaction is minimized in these two scenarios.

Figure 7. Mean maximum air temperature of the site areas from 13:00 to 19:00 on June 21.
The simulation outputs indicating air temperature in the A-3 scenario, at 1 meter high above the ground, between 13:00 and 19:00 on June 21 are presented. It is worth mentioning that the legends of the temperature ranges could not be adjusted in these output files because the free version of ENVI-met software was used in simulations. That is why the colors indicating the Ta ranges are not similar at different output results shown in Figures section discussion.
3.2 Maximum PET
Considering Figure 8, which demonstrates the mean maximum PET of the site areas at different afternoon hours on June 21, it is clear that the mean maximum PET is minimized in the A-3 scenario (Nine detached cubes, while northern and western cubes were 14 m high and others were 12 m high), indicating that A-3 has the lowest thermal discomfort and highest thermal comfort within the studied scenarios. This is in consistent with the results of air temperature analysis and confirms the results obtained in the previous section.
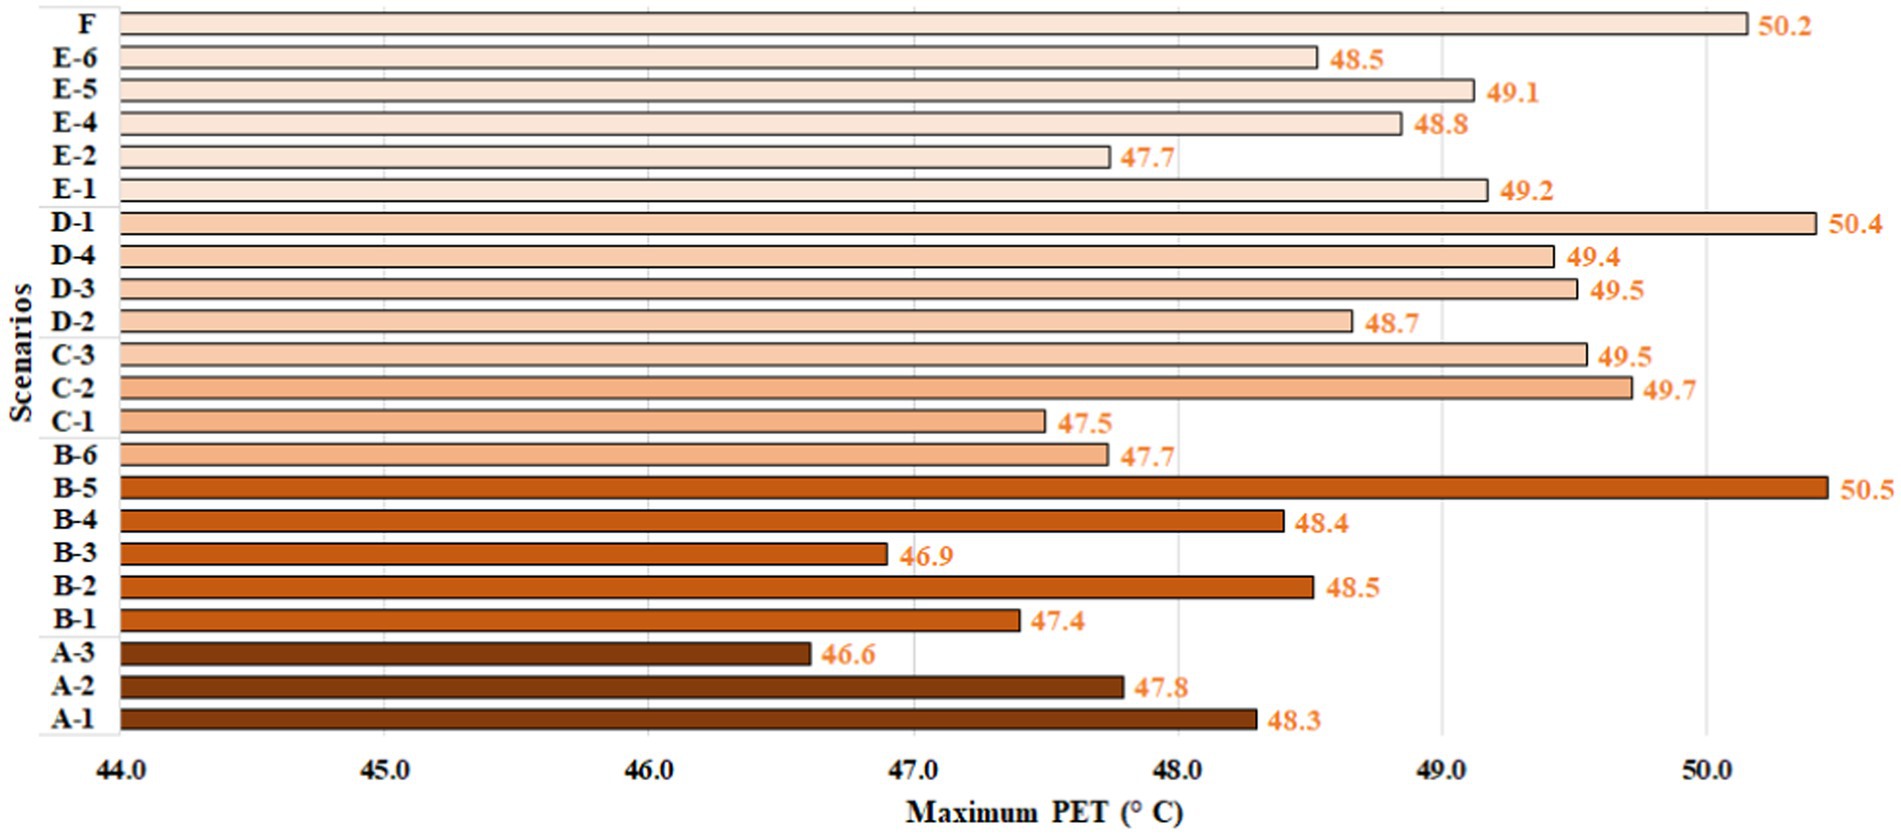
Figure 8. Mean maximum PET of the site areas from 13:00 to 19:00 on June 21.
ENVI-met simulation results presenting PET values of the A-3 scenario between 13:00 and 19:00 on June 21 are demonstrated in the figure section discussion.
At 13:00, the minimum and maximum PET values were 22.2°C and 42.6°C, respectively, while PET ranges between 28.3°C and 32.4°C dominated most of the site areas. At 14:00, the minimum and maximum PET values increased to 23.2°C and 51.6°C, respectively, while PET ranges between 34.6 and 37.4°C had the most frequency within the site areas. At 15:00, the thermal environment reached its warmest conditions and minimum and maximum PET values reached 24.4°C and 53.8°C respectively, while most of the site areas had PETs ranging from 36.2°C to 39.1°C. After 16:00, the weather starts to cool down until 19:00 when minimum and maximum PET values were 18.2°C and 20.5°C respectively; besides, at this hour, PET ranges between 18.4°C and 18.7°C had the most frequency within the site areas.
3.3 Maximum PPD
The mean maximum PPD of the site areas between 13:00 and 19:00 on June 21 is shown in Figure 9. The results show that the mean maximum PPD was minimal in the A-3 model, indicating better thermal comfort conditions in this scenario comparing to the other studied cases, and confirming the results obtained in the previous sections.
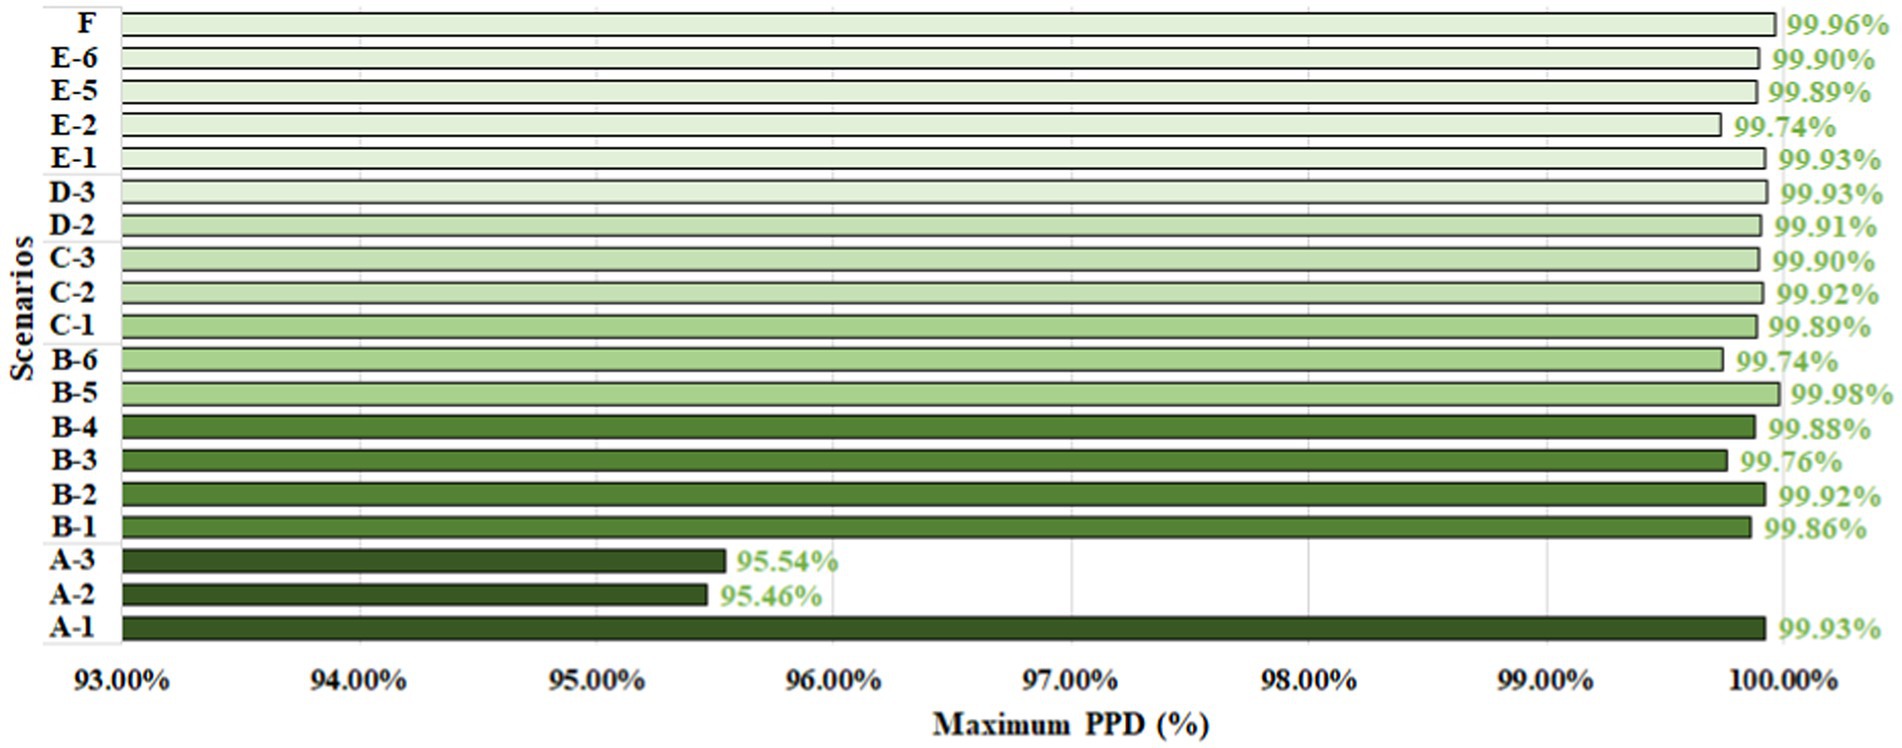
Figure 9. Mean maximum PPD of the site areas between 13:00 and 19:00 on June 21.
PPD outputs resulting from A-3 scenario simulations between 13:00 and 19:00 on June 21 are presented in the figure section discussion. As the free version of ENVI-met software was used in simulations, the legends could not be adjusted in this output file either and that is why the colors indicating the PPD ranges are not similar at different output results.
The minimum and maximum PPD values at 13:00 were 5.9 and 55.1%, respectively, while PPD ranges between 25.6 and 30.5% dominated most of the site areas. At 14:00, the minimum value did not change much from 5% while the maximum PPD values increased to 92.3%. Meanwhile, PPD ranges between 74.8 and 83.5% had the most frequency within the site areas. At 15:00 and 16:00, the thermal environment reached its hottest conditions and maximum PPD values increased to 99.6–99.9%, respectively, (the minimum PPD value remained 5%), while most of the site areas had PPDs above 90.1–90.5%. After 17:00, the weather started to cool down when minimum and maximum PPD values were 5.1 and 90.4% respectively; besides, the most frequent PPD ranges between 13.6 and 22.1% had the most frequency within the site areas at this hour.
3.4 Maximum SET*
The mean maximum SET* of the premises from 13:00 to 19:00 on June 21 is presented in Figure 10. The results show that the mean maximum SET* is minimized in A-2 and A-3 simulated models, indicating better comfort in these two scenarios. That is following the results obtained in the previous sections.
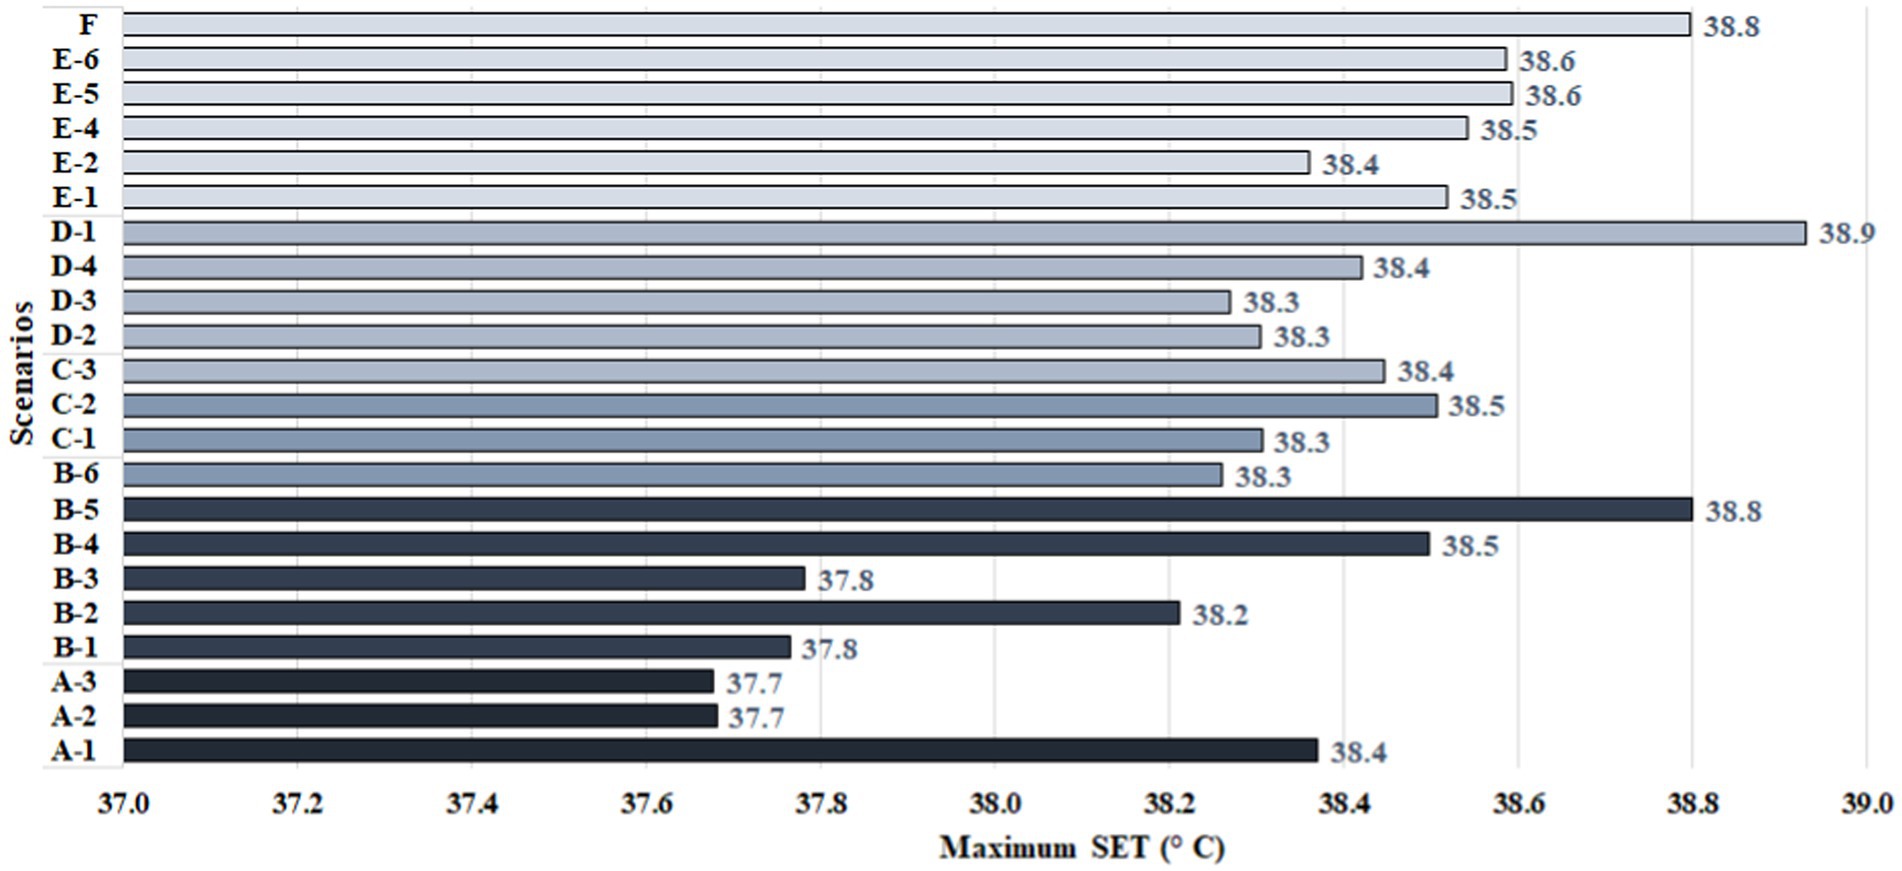
Figure 10. Mean maximum SET* of the site areas between 13:00 and 19:00 on June 21.
SET* values resulting from the A-3 scenario simulations between 13:00 and 19:00 on June 21 are specified in the figure section discussion. As the colors indicating SET* ranges cannot be edited in the free version of the ENVI-met software, the legends of the output files are not similar. It can be found that the minimum and maximum SET* values at 13:00 were 21.1°C and 37.7°C, respectively, while SET* ranges between 26.1°C and 27.7°C dominated most of the site areas. At 14:00, the minimum and maximum SET* values increased to 22.1°C and 39°C respectively, while SET* ranges between 28.9 and 30.5°C had the most frequency within the site areas. The warmest thermal conditions of the day occurred at 15:00 when minimum and maximum SET* values reached 23.1°C and 40.4°C respectively, while most of the site areas had SET*s ranging from 30°C to 31.8°C. 16:00 is still one of the warmest hours of the day when minimum and maximum SET* values were 22.6°C and 40.2°C, while most of the site areas had SET*s between 29.7°C and 31.4°C. After 17:00, the weather starts to cool down until 19:00 when minimum and maximum SET* values reached 16.1°C and 19.5°C respectively; besides, at this hour, SET* ranges between 16.4°C and 16.7°C had the most frequency within the site areas.
4 Discussion
The results showed that the A-3 scenario had better thermal comfort conditions than the other simulated models during the afternoon hours of June 21. That can be attributed to the better distribution of building blocks in this scenario, which prevented unshaded open spaces from forming within the site. Other simulated scenarios included an open piazza measuring approximately 60 m by 60 m which was not shaded in any of the simulated hours. As a result, the temperature of this unshaded space increases sharply in the summer afternoon and thermal dissatisfaction rises far beyond the acceptable limits. Whereas in the A-3 scenario, the width of the building blocks equals their adjacent empty spaces (~20 m), creating a better proportion between mass and empty space. Thus, the shading provided by the building blocks prevents excessive temperature increases in summer afternoon hours. The findings of this study align with the conclusions drawn by Deng and Wong (2020), who emphasized the significance of compact urban geometries in creating more comfortable environmental conditions. Their research demonstrated that such urban arrangements contribute to enhanced thermal comfort by generating substantial shading effects, which mitigate the impact of solar radiation and reduce heat accumulation.
The analysis revealed that the D-2 scenario, characterized by an open piazza without building blocks to the north, and the B-4 scenario, featuring three north–south oriented strips with a height of 12 m, exhibited the poorest outdoor thermal comfort conditions among the studied models. The thermal discomfort in the B-4 scenario is primarily attributed to the orientation of the linear building forms along the north–south axis, which fails to provide adequate solar shading during midday and afternoon hours. Meanwhile, the D-2 scenario, consisting of an approximately 90-m by 60-m unshaded open space, resulted in significant thermal dissatisfaction due to the absence of protective shading features in the area.
The findings of this study align closely with the research conducted by Al-Rabghi et al. (2017), which highlighted the thermal discomfort associated with open, unshaded piazzas in the hot and arid cities of Saudi Arabia. Their research underscores the critical need for implementing solar shading solutions in outdoor urban spaces, including piazzas, corridors, and similar environments, to enhance thermal comfort in such climates. Al-Rabghi and colleagues strongly recommended the integration of shading strategies as a key approach to mitigate excessive heat exposure and improve the usability and overall livability of outdoor public spaces in regions with extreme climatic conditions.
Also, in the north–south oriented streets (scenarios B-1, B-2, and B-3) one of the sidewalks is always in the shade while the other side is always in the sun; thus, the pedestrians have the opportunity to choose the most suitable sidewalk based on their thermal requirements. While thermal conditions are the same on both pavements of the north–south oriented streets (scenarios B-4, B-5, and B-6); so, they give the passengers little adaptive opportunities. What is more, the interior conditions of the building blocks would not be favorable in B4–6 scenarios either, since these buildings receive daylight just from the east and west façades.
Due to the better performance of the A-3 scenario in providing outdoor thermal comfort compared to the other simulated models, air temperature along with PET, PPD, and SET* indices are analyzed in this scenario as follows (Figure 11).
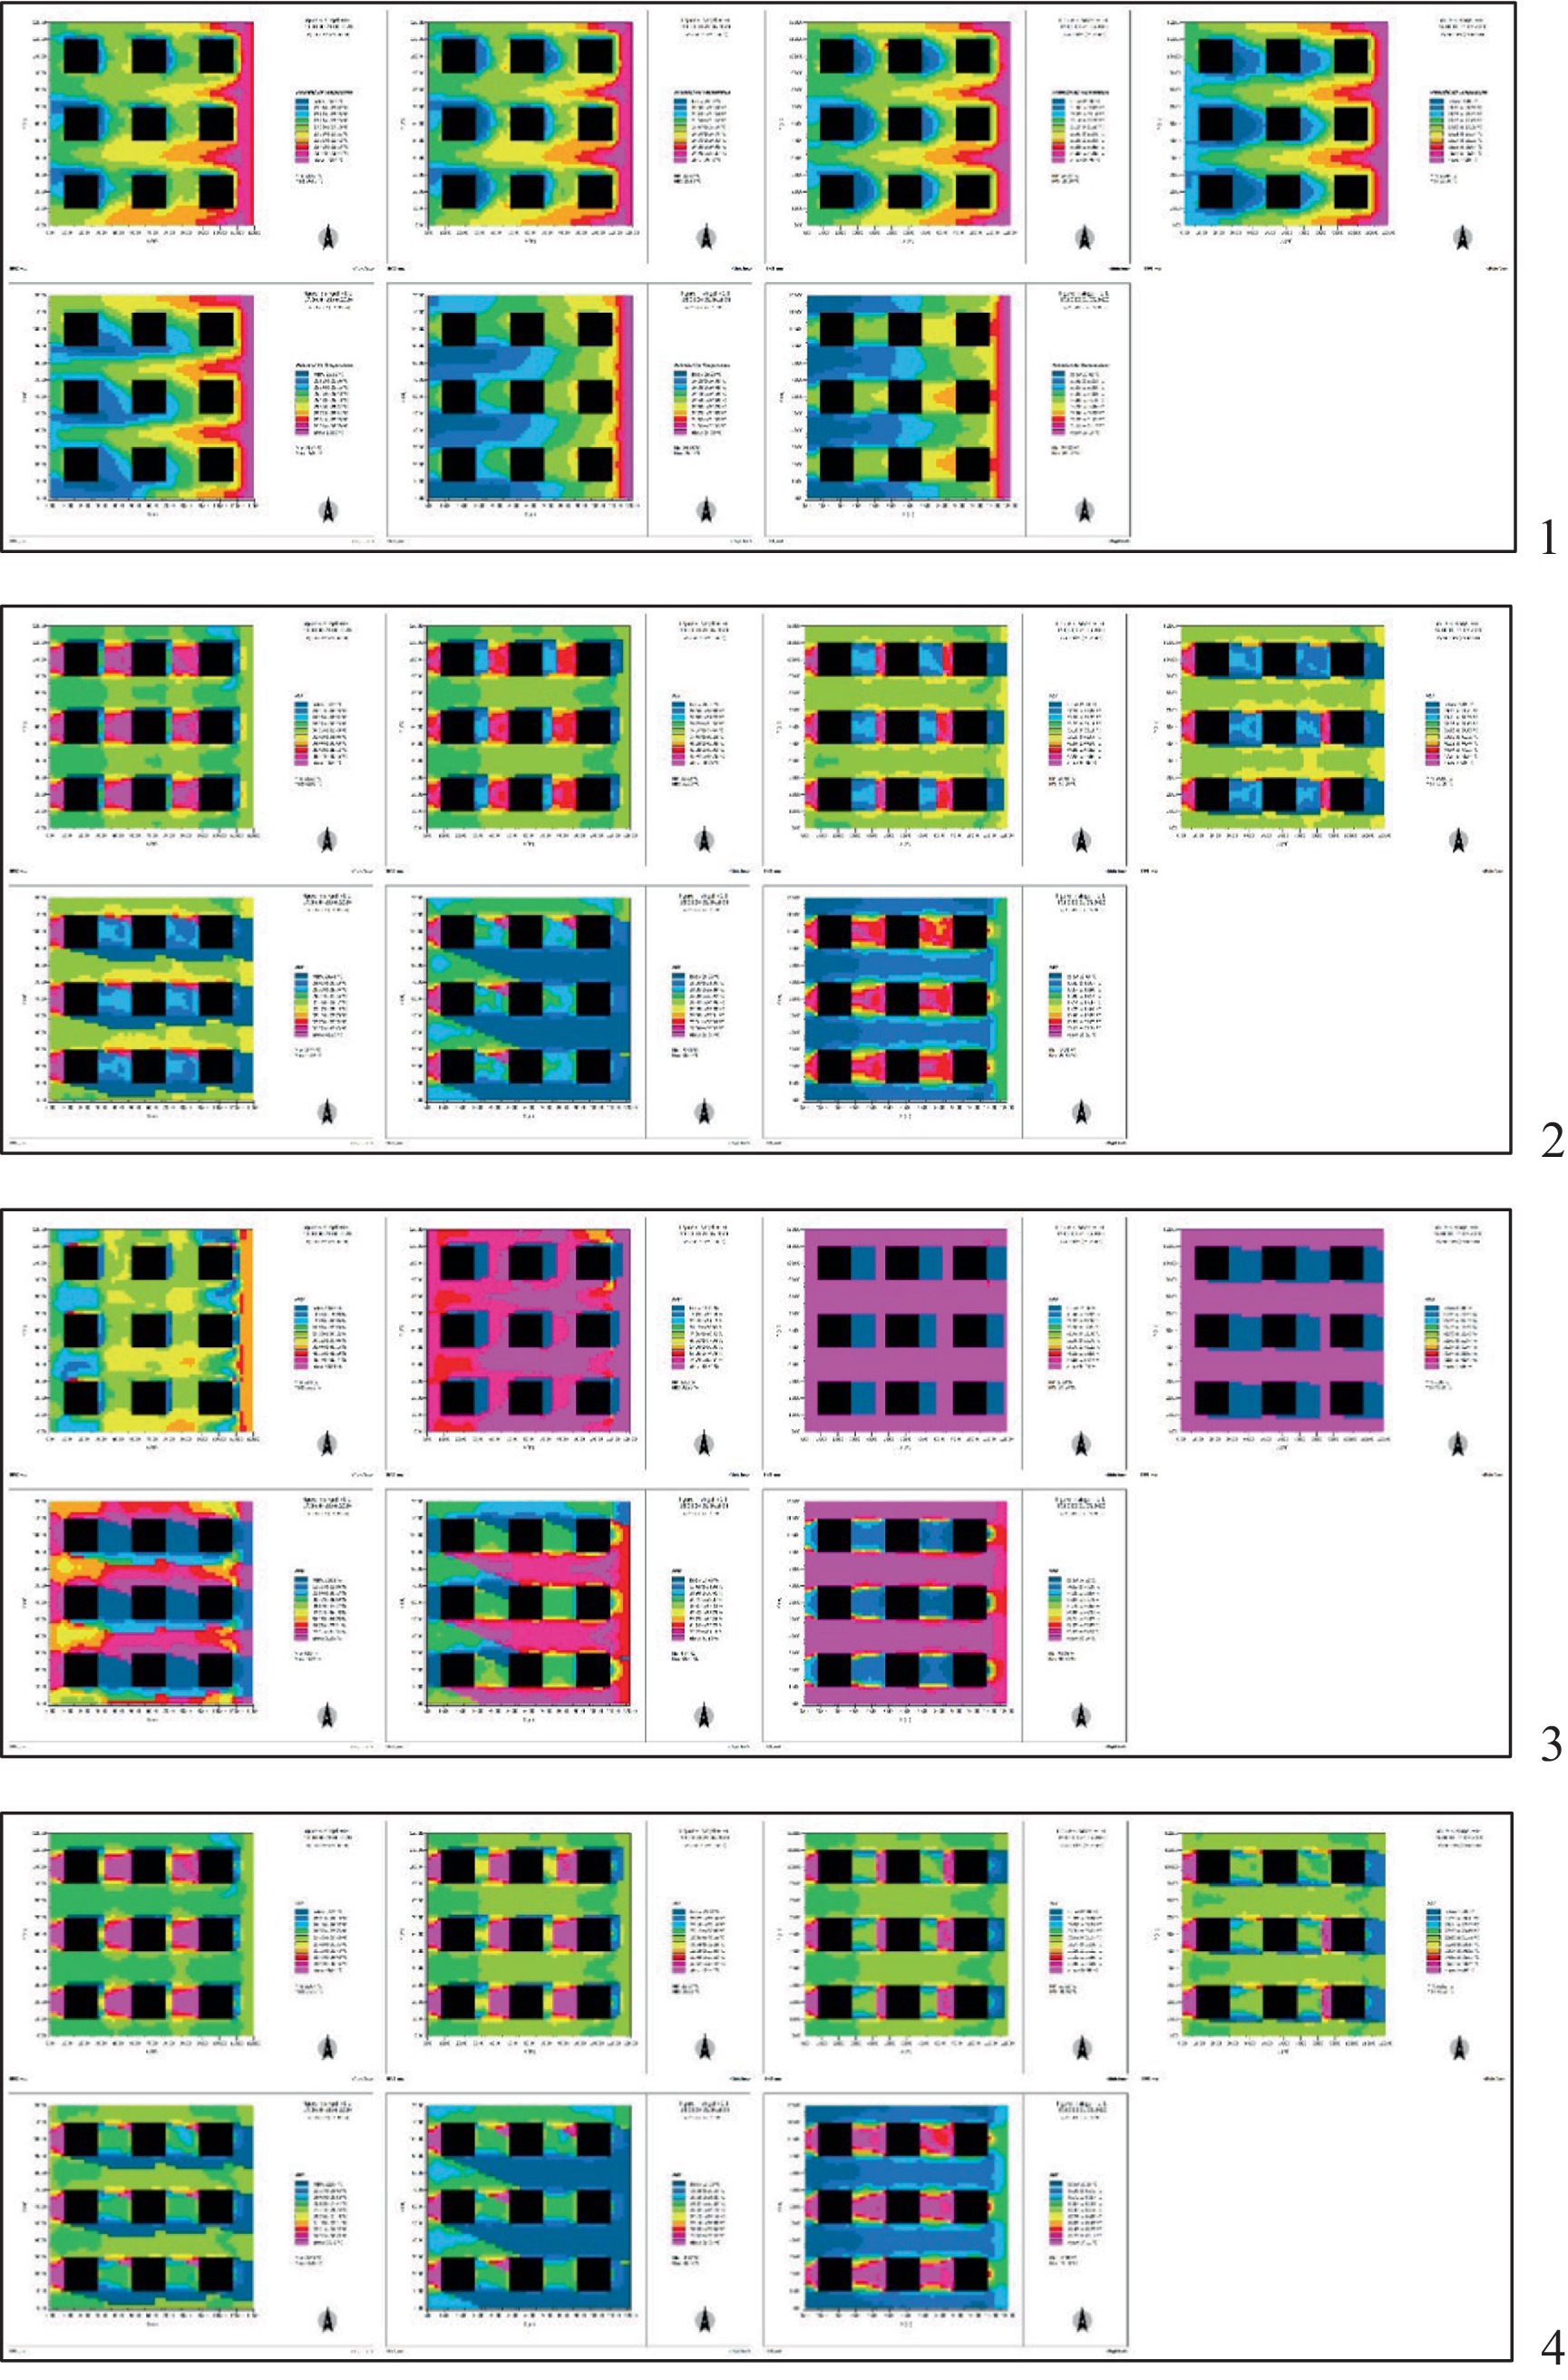
Figure 11. ENVI-met results of A-3 scenario presenting air temperature at 1 m high, between 13:00 and 19:00 on June 21 (Row 1), ENVI-met results of A-3 scenario presenting PET values between 13:00 and 19:00 on June 21 (Row 2), ENVI-met results of A-3 scenario presenting PPD values between 13:00 and 19:00 on June 21 (Row 3), ENVI-met results of A-3 scenario presenting SET* values between 13:00 and 19:00 on June 21 (Row 4).
4.1 Analyzing air temperature
Air temperature is undoubtedly the most important meteorological variable in thermal comfort studies. However, some studies suggest that analyzing air temperature alone is not sufficient for assessing thermal comfort, especially in outdoor environments, and other environmental variables, such as the mean radiant temperature, should also be considered while evaluating thermal comfort conditions. However, some ranges of air temperature were proposed in the previous studies as the thermal comfort zone; for example, based on the Olgyay bioclimatic chart, air temperatures between 21.5°C and 29°C can be considered as the summer comfort conditions in latitudes between 25° and 40°N (Olgyay and Olgyay, 1963). In a more recent study, Sharmin and colleagues reported the air temperatures between 30°C and 33°C (in the shade), as appropriate summer thermal conditions in Dhaka, Bangladesh (latitude 23.77°N) (Sharmin et al., 2019). For the Hong Kong city in China (latitude 22.3°N), air temperatures between 15.4°C and 29.9°C were suggested as thermal comfort range (Cheung and Jim, 2018), while air temperature range between 20.7°C and 29.1°C was reported as comfort air temperature range in Athens, Greece, (latitude 37.98°N) (Tseliou et al., 2015). Considering Tehran’s climatic similarities to Athens (both cities are located at the same latitude 35–37°N and categorized as Csa in Köppen’s climate classification), Athens’s thermal comfort range (20.7°C–29.1°C) can also be considered as a comfort zone in Tehran. This temperature range also corresponds to the comfort range specified in the Olgyay bioclimatic chart.
Simulation results of the A-3 scenario between 13:00 and 19:00 on June 21 (Figures 11, 12) show that apparently, both maximum and minimum air temperatures were within the comfort range (20.7°C–29.1°C) throughout this period. However, it should be noted that this temperature range is only comfortable in the “full shade” conditions. Therefore, since many parts of the site area were exposed to direct sunlight during this period, it is impossible to evaluate thermal comfort conditions during these hours by examining the air temperature alone. It is necessary to analyze thermal indices.

Figure 12. Maximum, minimum, and mean air temperatures of the A-3 scenario between 13:00 and 19:00 on June 21.
4.2 Analyzing PET
Although the ranges of PET in the A-3 scenario were presented in Figure 4, outdoor thermal comfort within the day cannot be analyzed without comparing the results with thermal comfort scales. Matzarakis and Mayer proposed the original scale of PET at the same time as the development of this index in 1996 (Matzarakis and Mayer, 1996) and has been used in many papers and international studies since then. However, concerning the need to use calibrated scales of thermal indices for different regions, the PET Modified scale for Tehran is presented, which may provide a more appropriate basis for analyzing thermal comfort in this city (Table 4). However, to fully ensure the accuracy of the results, the PET ranges were compared with the international (original) thermal stress scale and with the modified scale for Tehran.

Table 4. Comparing PET original scale (Matzarakis and Mayer, 1996) with PET modified scale for Tehran.
Comparing the minimum, maximum, and mean PET of the A-3 scenario with the original thermal stress categories (Figure 13-left) shows that except for 15:00 and 16:00, the minimum PET values were within the neutral range during the rest of the afternoon hours of June 21. In other words, except for 15:00–118:00, at least one place can be found within the site, which is in neutral thermal conditions during the rest of the day. However, most parts of the site area were in the “hot” (at 13:00 and 17:00) or “very hot” categories (at 14:00, 15:00, and 16:00) in the afternoon hours of June 21, which are considered as unpleasant thermal conditions. The maximum amounts of PET were in the “very hot” category between 14:00 and 16:00, which is undesirable.

Figure 13. Maximum, minimum, and mean PET of the A-3 scenario between 13:00 and 19:00 on June 21 comparing with the international thermal stress categories (left) and a modified scale for Tehran (right).
Figure 13 compares the mean, minimum, and maximum PET values of the A-3 scenario with thermal stress categories modified for Tehran. According to Figure 13-right, the minimum amounts of PET were within the neutral range at all afternoon hours of June 21. That means that a person who can move around and change his location can find at least one place on the site that provides thermal comfort during all afternoon hours of June 21. Exactly similar to the analysis performed using the international scale, the “hot” (13:00 and 17:00) and “very hot” (14,00, 15:00, and 16:00) categories had the highest frequency within the site. The maximum PET value was also in the “very hot” category from 14:00 to 16:00 However, after sunset, the maximum PET value entered the “slightly warm” category at 18:00 and entered the neutral zone at 19:00.
4.3 Analyzing PPD
Different assessment scales were suggested for classifying the percentages of thermal dissatisfaction. One of the most common classifications, which is also the basis of the thermal comfort definition, refers to thermal comfort as the condition in which at least 80% of people are satisfied with the thermal environment (PPD ≤ 20%).
The ISO 7730 standard considers three categories of “PPD ≤ 6%,” “PPD ≤ 10%,” and “PPD ≤ 15%” as acceptable PPD limits in different categories of building interiors (ISO 7730, 2005). However, PPD classifications are different outside the building. Based on two recent studies (Mi et al., 2020), the neutral temperature in outdoor spaces is defined as thermal conditions in which thermal satisfaction is greater than 90% (or thermal dissatisfaction is less than 10%). Similarly, the “slightly warm” category is defined by thermal satisfaction of 80–90% (thermal dissatisfaction of 10–20%), “warm” category occurs when thermal satisfaction is between 56.7 and 80% (thermal dissatisfaction is between 20 and 43.3%), in the “hot” category thermal satisfaction is 33.3–56.7% (thermal dissatisfaction is 43.3–66.7%). Finally, thermal satisfaction of less than 33.3% (thermal dissatisfaction of more than 66.7%) defines the “very hot” category. These values are summarized in Table 5.
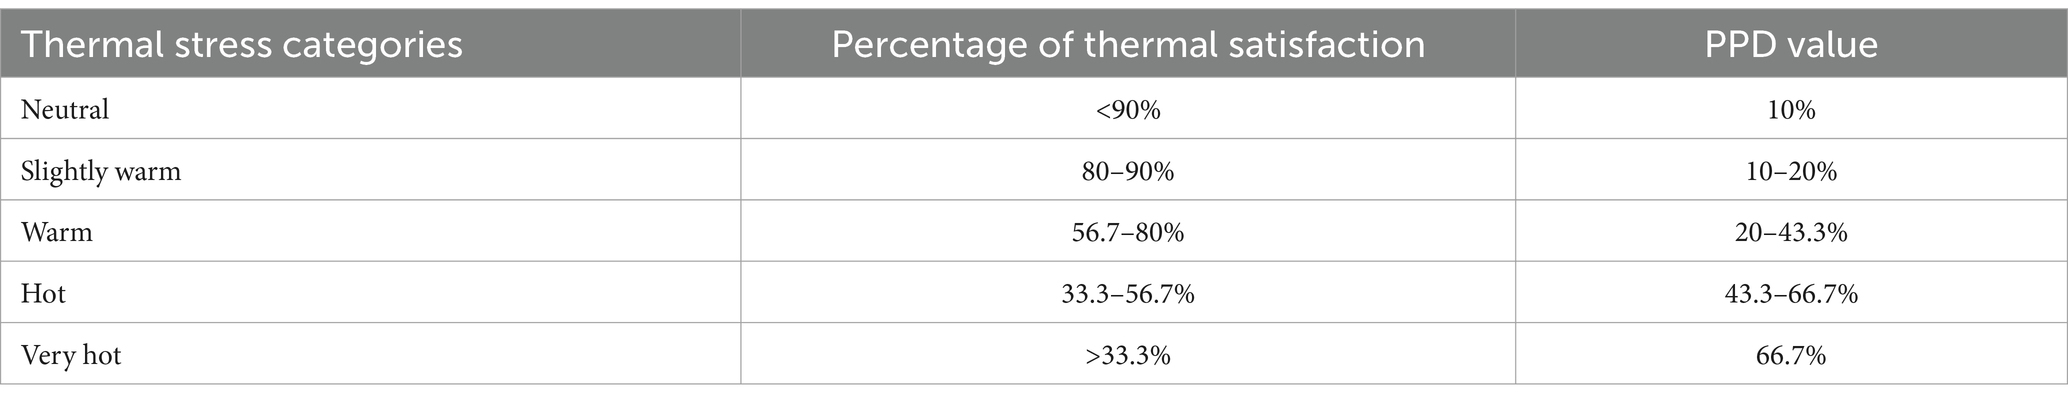
Table 5. Thermal stress categories based on percentages of thermal satisfaction their equivalent PPD (Mi et al., 2020).
According to Figure 8, it can be found that at 15:00 and 16:00 on June 21, thermal dissatisfaction in significant parts of the site area is higher than 90%. This excessive increase in thermal dissatisfaction can be attributed to the exaggerated nature of the PPD index. As mentioned earlier, the PPD index is calculated based on the PMV value; however, it was shown in the previous studies that using PMV for outdoor thermal comfort assessment would lead to exaggerated results; so PMV would overestimate actual sensation votes by the factors of 1.6–1.8.
The minimum, maximum, and mean values of PPD from the A-3 scenario between 13:00 and 19:00 on June 21 compared to outdoor thermal stress categories are specified in Figure 14. The results are in agreement with those obtained in the previous sections. Figure 14 shows that minimum PPD was in comfortable conditions during all afternoon hours of June 21, indicating that at least one point with neutral comfort conditions could be found within the site area in all these hours. Someone who can adapt to the environment by changing his location can find at least one point with neutral conditions during all afternoon hours of this day. At the same time, “hot” conditions had the most frequency in the site areas, while the maximum PPD values were in the “very hot” category during the simulated hours. The extreme values of PPD in these hours can be attributed to the exaggerative nature of the PPD index in assessing outdoor thermal comfort as mentioned, yet, the PPD results were inconsistent with the results obtained by analyzing air temperature and PET in sections 4.1 and 4.2, indicating uncomfortable thermal conditions in most parts of the site. These results indicate that paying attention to the form and location of the buildings cannot guarantee outdoor thermal comfort, and taking other parameters (such as providing shade, using green spaces, albedo, etc.) into account is also necessary to achieve thermal comfort.
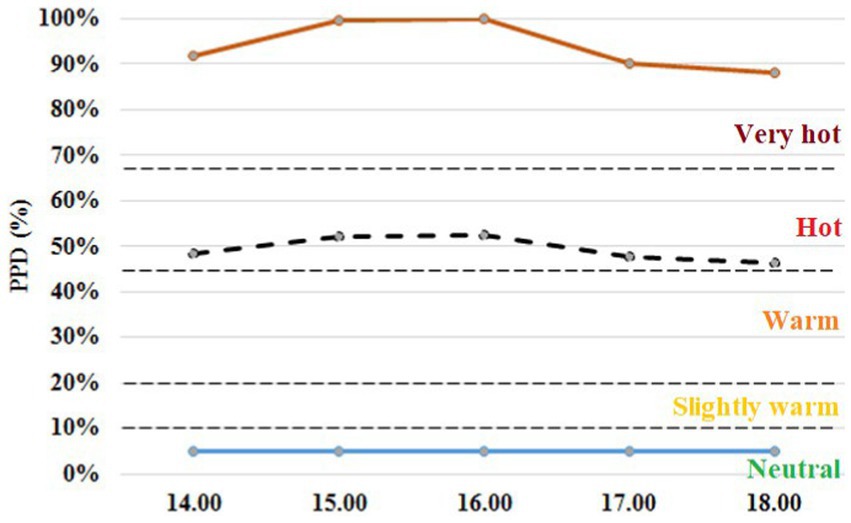
Figure 14. Maximum, minimum, and mean PPD values of the A-3 scenario between 13:00 and 19:00 on June 21 compared with thermal stress categories.
4.4 Analyzing SET*
The original assessment scale of SET* (Johansson et al., 2018) compared with its modified scale for Tehran are presented in Table 6. It should be noted that the basis of thermal stress categorization in these two classifications was the ASHRAE 7-point scale. These two scales were compared in Figure 15 with SET* values of the A-3 scenario.
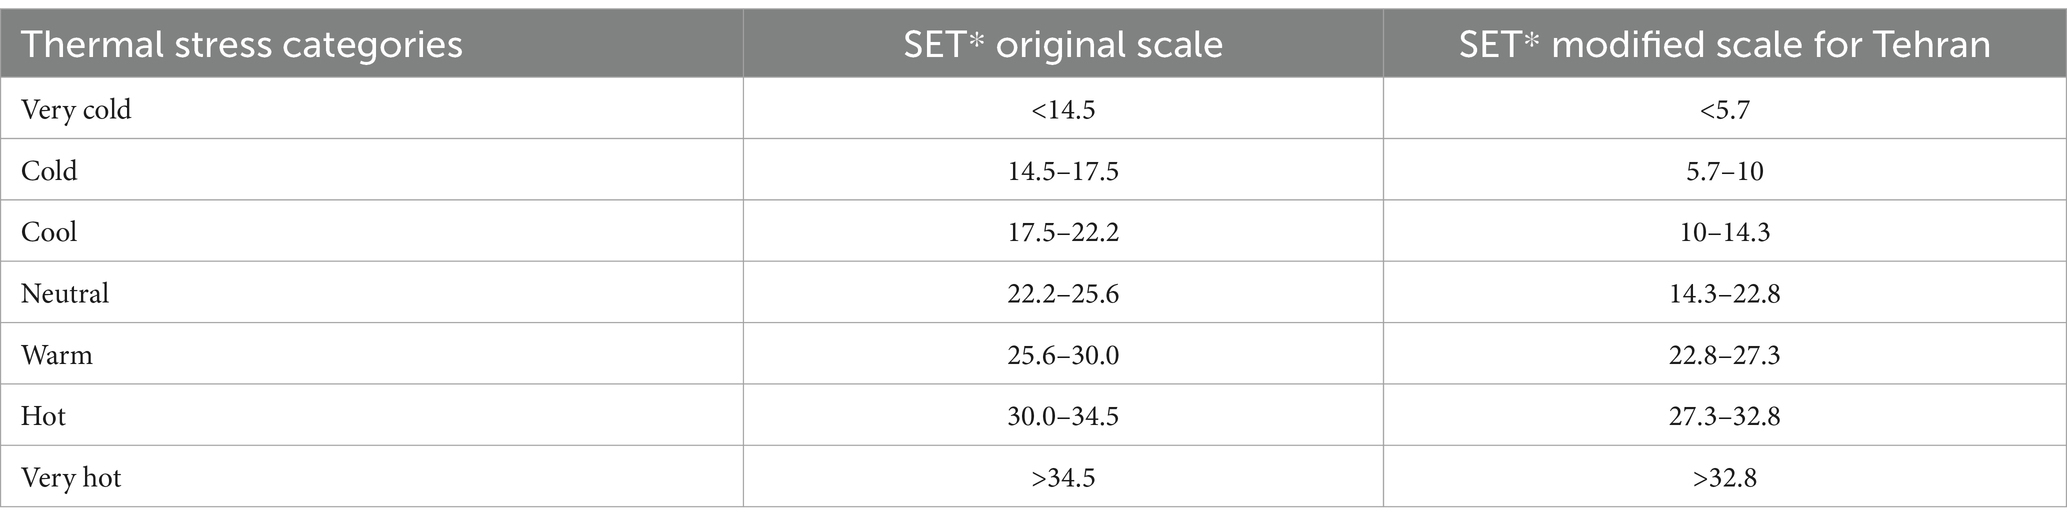
Table 6. Original assessment scale (Johansson et al., 2018) versus modified scale of SET* for Tehran.
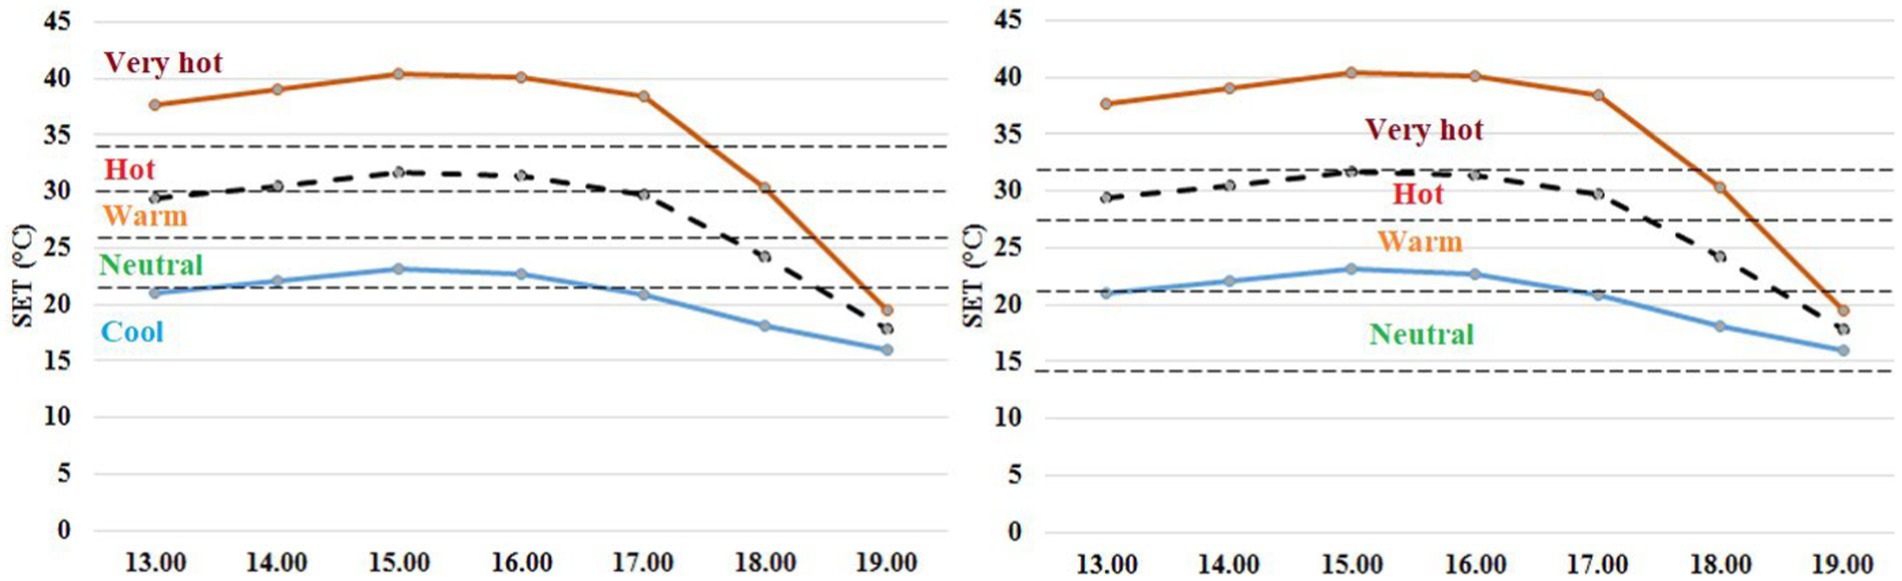
Figure 15. Maximum, minimum, and mean SET* of the A-3 scenario between 13:00 and 19:00 on June 21 compared with the international thermal stress categories (left) and a modified scale for Tehran (right).
Comparison of the minimum, maximum, and mean SET* values of the A-3 scenario from 13:00 to 19:00 on June 21, to the original thermal stress categories of SET* (Figure 15-left) show that minimum SET* values at 13:00, 17:00, 18:00, and 19:00 and even maximum SET* values at 19:00, are below the original neutral range of SET* (22.2°C) and were in the “cool” thermal stress category. However, this does not seem correct, considering that simulations were performed in the afternoon hours of one of the hottest days of the year in Tehran. Accordingly, this is in line with the results obtained. They found the SET* original scale inappropriate for assessing outdoor thermal conditions in Tehran and intensified the need to use the modified scale of SET* for outdoor comfort analysis in this city.
Figure 13 compares the mean, minimum, and maximum SET* values of the A-3 scenario from 13:00 to 19:00 on June 21 with Tehran’s SET* modified scale. According to Figure 15-right, the minimum SET* values were within the neutral range at 13:00, 17:00, 18:00, and 19:00, indicating that except for 14:00, 15:00, and 16:00, in the other afternoon hours of June 21, at least one point with neutral temperature can be found within the site area. If the site design allows the users to adapt to the environment, an assumed user can find at least one point with a neutral temperature by changing his location. This result follows the results of PET, PPD, and air temperature analysis in the previous parts.
Figure 15-right also shows that the maximum SET* values were within the “very hot” range from 13:00 to 17:00, while most of the site areas were in the “hot” range during these hours, only in the late afternoon hours (after sunset) that the maximum SET* was in the neutral zone. These results are by the results obtained by analyzing PET and PPD indices in the previous two sections and show the insufficiency of mere attention to the building morphologies in achieving outdoor thermal comfort, even while other strategies such as green walls were applied.
5 Conclusion
This study investigated the impacts of 22 different building morphologies (including modular separated cubes, parallel strips, and Courtyards) and applying green walls on achieving outdoor thermal comfort in Tehran’s summer conditions. These scenarios were simulated using ENVI-met software during the afternoon hours of June 21.
The findings of the study revealed that changes in building morphology, even with the use of green walls, are not sufficient on their own to ensure outdoor thermal comfort in the city of Tehran. Green walls, in addition to their aesthetic and ecological roles, can significantly enhance thermal comfort by providing shade, lowering ambient temperatures, and improving air quality. However, the complex climatic conditions and environmental factors in Tehran necessitate more comprehensive and multidimensional approaches to achieve optimal thermal comfort. This highlights the importance of integrating diverse urban design strategies, such as optimizing green spaces, controlling solar radiation reflection, utilizing innovative materials, and enhancing the role of green walls as part of urban ecological infrastructure, alongside architectural form considerations.
However, the “Modular separate cubes” (the “A” group scenarios) and especially the A-3 scenario (Nine detached cubes, while northern and western cubes were 14 m high and others were 12 m high) provided better outdoor thermal conditions during the afternoon hours of June 21. The better performance of the A-3 scenario can be attributed to the distribution of building blocks in this scenario, which prevented large unshaded open spaces from forming within the site, and the shading provided by the building blocks prevented excessive temperature increase in summer afternoon hours.
Thermal indices of the A-3 scenario were also compared with original and modified thermal comfort scales. The results showed that the minimum values of thermal indices were within the neutral range during almost all afternoon hours of June 21, indicating that in all these hours, at least one point with neutral comfort conditions could be found in the site area. If the site design provides enough adaptive opportunities for the users, then pedestrians who can change their location within the site can find at least one point within the neutral temperature range during the afternoon hours of June 21. However, the results also showed unsatisfactory thermal conditions on most site areas in the afternoon hours of June 21 even in this scenario. Since the A-3 scenario provided the best thermal conditions among the simulated case studies, it can be inferred that thermal conditions were not satisfactory in other scenarios as well. Therefore, it can be concluded that the morphology of buildings alone does not have a significant impact on outdoor thermal comfort in Tehran, and green walls, when used individually, are also unable to create substantial changes in the city’s climatic conditions. However, the combination of these two factors—appropriate morphological design along with the use of green walls—can effectively contribute to improving thermal conditions and yield satisfactory results. At the same time, implementing other complementary measures, such as planting trees and expanding vegetation cover, altering the albedo of external surfaces, and incorporating permeable materials in urban infrastructure and pathways, appears essential to optimize outdoor thermal comfort in urban spaces. Addressing such influential factors not only creates a more favorable environment but also plays a crucial role in enhancing the quality of life for citizens and improving the urban ecosystem.
6 Limitations and suggestions for further studies
It is important to emphasize that the scenario of separate cubes has been presented as an optimal option in architectural design; however, this should not prevent the exploration of other proposed scenarios in this study. Specifically, considering various ratios between width and height in different building forms, such as courtyard designs, can be beneficial for better adaptation to the climatic and environmental conditions of Tehran. Accordingly, it is recommended that future research conduct a more detailed examination of different architectural forms with diverse width-to-height ratios, taking into account factors such as the sky view factor in these studies. This approach could help identify more optimal and region-specific solutions.
Considering the results obtained from the green wall performance in this study, it is recommended that future research conduct a more comprehensive examination of the use of greenery on rooftops, as well as the combination of green walls and green roofs. Analyzing the impact of this type of design on Tehran and similar climates can provide valuable information that ultimately leads to the formulation of common and practical guidelines for builders and urban designers. Consequently, by implementing these strategies, it is possible to enhance the quality of the urban environment and promote sustainability in urban planning.
Data availability statement
The raw data supporting the conclusions of this article will be made available by the authors without undue reservation.
Author contributions
TH: Conceptualization, Data curation, Formal analysis, Investigation, Resources, Software, Visualization, Writing – original draft. MY: Conceptualization, Methodology, Project administration, Supervision, Writing – review & editing. EP: Formal analysis, Resources, Writing – review & editing.
Funding
The author(s) declare that no financial support was received for the research, authorship, and/or publication of this article.
Conflict of interest
The authors declare that the research was conducted in the absence of any commercial or financial relationships that could be construed as a potential conflict of interest.
Generative AI statement
The authors declare that no Gen AI was used in the creation of this manuscript.
Publisher’s note
All claims expressed in this article are solely those of the authors and do not necessarily represent those of their affiliated organizations, or those of the publisher, the editors and the reviewers. Any product that may be evaluated in this article, or claim that may be made by its manufacturer, is not guaranteed or endorsed by the publisher.
Abbreviations
H/W ratio, Height-to-Width ratio; PET, Physiologically Equivalent Temperature; PMV, Predicted Mean Vote; PPD, Predicted Percentage of Dissatisfied; SET*, Standard Effective Temperature; SVF, Sky View Factor.
References
Acero, J. A., and Herranz-Pascual, K. (2015). A comparison of thermal comfort conditions in four urban spaces by means of measurements and modelling techniques. Build. Environ. 93, 245–257. doi: 10.1016/j.buildenv.2015.06.028
Aflaki, A., Mirnezhad, M., Ghaffarianhoseini, A., Ghaffarianhoseini, A., Omrany, H., Wang, Z. H., et al. (2017). Urban heat island mitigation strategies: a state-of-the-art review on Kuala Lumpur, Singapore and Hong Kong. Cities 62, 131–145. doi: 10.1016/j.cities.2016.09.003
Ali-Toudert, F., and Mayer, H. (2006). Numerical study on the effects of aspect ratio and orientation of an urban street canyon on outdoor thermal comfort in hot and dry climate. Build. Environ. 41, 94–108. doi: 10.1016/j.buildenv.2005.01.013
Ali-Toudert, F., and Mayer, H. (2007). Effects of asymmetry, galleries, overhanging façades and vegetation on thermal comfort in urban street canyons. Sol. Energy 81, 742–754. doi: 10.1016/j.solener.2006.10.007
Al-Rabghi, O. M., Al-Ghamdi, A. S., and Kalantan, M. M. (2017). Thermal comfort around the holy mosques. Arab. J. Sci. Eng. 42, 2125–2139. doi: 10.1007/s13369-017-2464-8
Bourbia, F., and Awbi, H. B. (2004a). Building cluster and shading in urban canyon for hot dry climate part 1: air and surface temperature measurements. Renew. Energy 29, 249–262. doi: 10.1016/S0960-1481(03)00170-8
Bourbia, F., and Awbi, H. B. (2004b). Building cluster and shading in urban canyon for hot dry climate part 2: shading simulations. Renew. Energy 29, 291–301. doi: 10.1016/S0960-1481(03)00171-X
Bourbia, F., and Boucheriba, F. (2010). Impact of street design on urban microclimate for semi arid climate (Constantine). Renew. Energy 35, 343–347. doi: 10.1016/j.renene.2009.07.017
Bruse, M., and Fleer, H. (1998). Simulating surface-plant-air interactions inside urban environments with a three dimensional numerical model. Environ. Model. Softw. 13, 373–384. doi: 10.1016/S1364-8152(98)00042-5
Buccolieri, R., Maggiotto, G., and Di Sabatino, S. (2015). Evaluation of mitigation strategies to improve pedestrian comfort in a typical Mediterranean city, in: ICUC9-9th international conference on urban climate jointly with 12th symposium on the urban environment.
Chen, T., Yang, H., Chen, G., Lam, C. K. C., Hantg, J., Wang, X., et al. (2021). Integrated impacts of tree planting and aspect ratios on thermal environment in street canyons by scaled outdoor experiments. Sci. Total Environ. 764:142920. doi: 10.1016/j.scitotenv.2020.142920
Chen, G., Yang, X., Yang, H., Hang, J., Lin, Y., Wang, X., et al. (2020). The influence of aspect ratios and solar heating on flow and ventilation in 2D street canyons by scaled outdoor experiments. Build. Environ. 185:107159. doi: 10.1016/j.buildenv.2020.107159
Cheung, P. K., and Jim, C. Y. (2018). Subjective outdoor thermal comfort and urban green space usage in humid-subtropical Hong Kong. Energ. Buildings 173, 150–162. doi: 10.1016/j.enbuild.2018.05.029
Chow, W. T. L., and Brazel, A. J. (2012). Assessing xeriscaping as a sustainable heat island mitigation approach for a desert city. Build. Environ. 47, 170–181. doi: 10.1016/j.buildenv.2011.07.027
Cortes, A., Rejuso, A. J., Santos, J. A., and Blanco, A. (2022). Evaluating mitigation strategies for urban heat island in Mandaue City using ENVI-met. J. Urban Manag. 11, 97–106. doi: 10.1016/j.jum.2022.01.002
Crank, P. J., Sailor, D. J., Ban-Weiss, G., and Taleghani, M. (2018). Evaluating the ENVI-met microscale model for suitability in analysis of targeted urban heat mitigation strategies. Urban Clim. 26, 188–197. doi: 10.1016/j.uclim.2018.09.002
Dalman, M., Salleh, E., Sapian, A. R., Tahir, O. M., Dola, K., and Saadatian, O. (2011). Microclimate and thermal comfort of urban forms and canyons in traditional and modern residential fabrics in Bandar Abbas, Iran. Mod. Appl. Sci. 5, 43–56. doi: 10.5539/mas.v5n2p43
Deng, J. Y., and Wong, N. H. (2020). Impact of urban canyon geometries on outdoor thermal comfort in central business districts. Sustain. Cities Soc. 53:101966. doi: 10.1016/j.scs.2019.101966
Elnabawi, M. H., Hamza, N., and Dudek, S. (2015). Numerical modelling evaluation for the microclimate of an outdoor urban form in Cairo, Egypt. HBRC J. 11, 246–251. doi: 10.1016/j.hbrcj.2014.03.004
Emmanuel, R., and Fernando, H. J. S. (2007). Urban heat islands in humid and arid climates: role of urban form and thermal properties in Colombo, Sri Lanka and Phoenix, USA. Clim. Res. 34, 241–251. doi: 10.3354/cr00694
Faragallah, R. N., and Ragheb, R. A. (2022). Evaluation of thermal comfort and urban heat island through cool paving materials using ENVI-met. Ain Shams Eng. J. 13:101609. doi: 10.1016/j.asej.2021.10.004
Fischereit, J., and Schlünzen, K. H. (2018). Evaluation of thermal indices for their applicability in obstacle-resolving meteorology models. Int. J. Biometeorol. 62, 1887–1900. doi: 10.1007/s00484-018-1591-6
Gagge, A. P., Fobelets, A. P., and Berglund, L. G. (1986). Standard predictive index of human response to the thermal environment. ASHRAE Trans. 92, 709–731.
Ghaffarianhoseini, A., Berardi, U., and Ghaffarianhoseini, A. (2015). Thermal performance characteristics of unshaded courtyards in hot and humid climates. Build. Environ. 87, 154–168. doi: 10.1016/j.buildenv.2015.02.001
Goharian, A., Daneshjoo, K., Shaeri, J., Mahdavinejad, M., and Yeganeh, M. (2023). A designerly approach to daylight efficiency of central light-well; combining manual with NSGA-II algorithm optimization. Energy 2023:127402. doi: 10.1016/j.energy.2023.127402
Hedquist, B. C., and Brazel, A. J. (2014). Seasonal variability of temperatures and outdoor human comfort in Phoenix, Arizona, U.S.a. Build. Environ. 72, 377–388. doi: 10.1016/j.buildenv.2013.11.018
Herrmann, J., and Matzarakis, A. (2012). Mean radiant temperature in idealised urban canyons-examples from Freiburg, Germany. Int. J. Biometeorol. 56, 199–203. doi: 10.1007/s00484-010-0394-1
Höppe, P. (1999). The physiological equivalent temperature - a universal index for the biometeorological assessment of the thermal environment. Int. J. Biometeorol. 43, 71–75. doi: 10.1007/s004840050118
Hosseini Alamdari, A., Daneshjoo, K., and Yeganeh, M. (2022). New algorithms for generating isovist field and isovist measurements. Environ. Plan. B Urban Anal. City Sci. 49, 2331–2344. doi: 10.1177/23998083221083680
ISO 7730 (2005). Ergonomics of the thermal environment—analytical determination and interpretation of thermal comfort using calculation of the PMV and PPD indices and local thermal comfort criteria. 3rd Edn. Geneva: International Organization for Standardization.
Jänicke, B., Meier, F., Hoelscher, M. T., and Scherer, D. (2015). Evaluating the effects of façade greening on human bioclimate in a complex urban environment. Adv. Meteorol. 2015, 1–15. doi: 10.1155/2015/747259
Johansson, E. (2006). Influence of urban geometry on outdoor thermal comfort in a hot dry climate: a study in Fez, Morocco. Build. Environ. 41, 1326–1338. doi: 10.1016/j.buildenv.2005.05.022
Johansson, E., Yahia, M. W., Arroyo, I., and Bengs, C. (2018). Outdoor thermal comfort in public space in warm-humid Guayaquil, Ecuador. Int. J. Biometeorol. 62, 387–399. doi: 10.1007/s00484-017-1329-x
Ketterer, C., and Matzarakis, A. (2015). Comparison of different methods for the assessment of the urban heat island in Stuttgart, Germany. Int. J. Biometeorol. 59, 1299–1309. doi: 10.1007/s00484-014-0940-3
Lee, H., Mayer, H., and Chen, L. (2016). Contribution of trees and grasslands to the mitigation of human heat stress in a residential district of Freiburg, Southwest Germany. Landsc. Urban Plan. 148, 37–50. doi: 10.1016/j.landurbplan.2015.12.004
Maggiotto, G., Buccolieri, R., Santo, M. A., Leo, L. S., and Di Sabatino, S. (2014). Validation of temperature-perturbation and CFD-based modelling for the prediction of the thermal urban environment: the Lecce (IT) case study. Environ. Model. Softw. 60, 69–83. doi: 10.1016/j.envsoft.2014.06.001
Matzarakis, A., and Mayer, H. (1996). Another kind of environmental stress: thermal stress. WHO Newsl. 18, 7–10.
Mi, J., Hong, B., Zhang, T., Huang, B., and Niu, J. (2020). Outdoor thermal benchmarks and their application to climate–responsive designs of residential open spaces in a cold region of China. Build. Environ. 169:106592. doi: 10.1016/j.buildenv.2019.106592
Middel, A., Häb, K., Brazel, A. J., Martin, C. A., and Guhathakurta, S. (2014). Impact of urban form and design on mid-afternoon microclimate in Phoenix local climate zones. Landsc. Urban Plan. 122, 16–28. doi: 10.1016/j.landurbplan.2013.11.004
Okeil, A. (2010). A holistic approach to energy efficient building forms. Energ. Buildings 42, 1437–1444. doi: 10.1016/j.enbuild.2010.03.013
Olgyay, V., and Olgyay, A. (1963). Design with climate: bioclimatic approach to architectural regionalism. Princeton, New Jersy: Princeton University Press.
Potchter, O., Cohen, P., Lin, T. P., and Matzarakis, A. (2018). Outdoor human thermal perception in various climates: a comprehensive review of approaches, methods and quantification. Sci. Total Environ. 631-632, 390–406. doi: 10.1016/j.scitotenv.2018.02.276
Ratti, C., Raydan, D., and Steemers, K. (2003). Building form and environmental performance: archetypes, analysis and an arid climate. Energ. Buildings 35, 49–59. doi: 10.1016/S0378-7788(02)00079-8
Salata, F., Golasi, I., de Lieto Vollaro, R., and de Lieto Vollaro, A. (2016). Urban microclimate and outdoor thermal comfort. A proper procedure to fit ENVI-met simulation outputs to experimental data. Sustain. Cities Soc. 26, 318–343. doi: 10.1016/j.scs.2016.07.005
Sanagar Darbani, E., Monsefi Parapari, D., Boland, J., and Sharifi, E. (2021). Impacts of urban form and urban heat island on the outdoor thermal comfort: a pilot study on Mashhad. Int. J. Biometeorol. 65, 1101–1117. doi: 10.1007/s00484-021-02091-3
Sen, J., and Nag, P. K. (2019). Human susceptibility to outdoor hot environment. Sci. Total Environ. 649, 866–875. doi: 10.1016/j.scitotenv.2018.08.325
Sharbafian, M., Yeganeh, M., and Baradaran Motie, M. (2024). Evaluation of shading of green facades on visual comfort and thermal load of the buildings. Energ. Buildings 317:114303. doi: 10.1016/j.enbuild.2024.114303
Sharmin, T., Steemers, K., and Humphreys, M. (2019). Outdoor thermal comfort and summer PET range: a field study in tropical city Dhaka. Energ. Buildings 198, 149–159. doi: 10.1016/j.enbuild.2019.05.064
Simon, H., Lindén, J., Hoffmann, D., Braun, P., Bruse, M., and Esper, J. (2018). Modeling transpiration and leaf temperature of urban trees – a case study evaluating the microclimate model ENVI-met against measurement data. Landsc. Urban Plan. 174, 33–40. doi: 10.1016/j.landurbplan.2018.03.003
Taleghani, M., Kleerekoper, L., Tenpierik, M., and Van Den Dobbelsteen, A. (2015). Outdoor thermal comfort within five different urban forms in the Netherlands. Build. Environ. 83, 65–78. doi: 10.1016/j.buildenv.2014.03.014
Taleghani, M., Tenpierik, M., van den Dobbelsteen, A., and Sailor, D. J. (2014). Heat in courtyards: a validated and calibrated parametric study of heat mitigation strategies for urban courtyards in the Netherlands. Sol. Energy 103, 108–124. doi: 10.1016/j.solener.2014.01.033
Thorsson, S., Lindberg, F., Björklund, J., Holmer, B., and Rayner, D. (2011). Potential changes in outdoor thermal comfort conditions in Gothenburg, Sweden due to climate change: the influence of urban geometry. Int. J. Climatol. 31, 324–335. doi: 10.1002/joc.2231
Tseliou, A., Tsiros, I. X., Nikolopoulou, M., and Papadopoulos, G. (2015). Outdoor thermal sensation in a Mediterranean climate (Athens): the effect of selected microclimatic parameters. Archit. Sci. Rev. 59, 190–202. doi: 10.1080/00038628.2015.1028022
Tsoka, S., Tsikaloudaki, A., and Theodosiou, T. (2018). Analyzing the ENVI-met microclimate model's performance and assessing cool materials and urban vegetation applications-a review. Sustain. Cities Soc. 43, 55–76. doi: 10.1016/j.scs.2018.08.009
Ulpiani, G., Di Giuseppe, E., Di Perna, C., D’Orazio, M., and Zinzi, M. (2019). Thermal comfort improvement in urban spaces with water spray systems: field measurements and survey. Build. Environ. 156, 46–61. doi: 10.1016/j.buildenv.2019.04.007
VDI 3787 (2008). Part 2: Environmental meteorology–methods for the human biometeorological evaluation of climate and air quality for urban and regional planning at regional level; part I: climate. Berlin: Beuth Verlag.
Wang, Y., and Zacharias, J. (2015). Landscape modification for ambient environmental improvement in central business districts - a case from Beijing. Urban For. Urban Green. 14, 8–18. doi: 10.1016/j.ufug.2014.11.005
Yang, L., Niyogi, D., Tewari, M., Aliaga, D., Chen, F., Tian, F., et al. (2016). Contrasting impacts of urban forms on the future thermal environment: example of Beijing metropolitan area. Environ. Res. Lett. 11:034018. doi: 10.1088/1748-9326/11/3/034018
Yang, X., Zhao, L., Bruse, M., and Meng, Q. (2013). Evaluation of a microclimate model for predicting the thermal behavior of different ground surfaces. Build. Environ. 60, 93–104. doi: 10.1016/j.buildenv.2012.11.008
Keywords: building morphology, urban canyon, outdoor thermal comfort, ENVI-met, urban blocks, green wall
Citation: Heydari T, Yeganeh M and Pourmahabadian E (2025) Evaluation of the role of green walls in enhancing outdoor thermal comfort in different morphologies of building blocks. Front. Sustain. Cities. 7:1519375. doi: 10.3389/frsc.2025.1519375
Edited by:
Victor L. Barradas, National Autonomous University of Mexico, MexicoReviewed by:
Shi Xue, University of Illinois at Urbana-Champaign, United StatesCarlos Renato Ramos-Palacios, Autonomous University of San Luis Potosí, Mexico
Copyright © 2025 Heydari, Yeganeh and Pourmahabadian. This is an open-access article distributed under the terms of the Creative Commons Attribution License (CC BY). The use, distribution or reproduction in other forums is permitted, provided the original author(s) and the copyright owner(s) are credited and that the original publication in this journal is cited, in accordance with accepted academic practice. No use, distribution or reproduction is permitted which does not comply with these terms.
*Correspondence: Mansour Yeganeh, eWVnYW5laEBtb2RhcmVzLmFjLmly