
94% of researchers rate our articles as excellent or good
Learn more about the work of our research integrity team to safeguard the quality of each article we publish.
Find out more
ORIGINAL RESEARCH article
Front. Sustain. Cities, 02 April 2025
Sec. Smart Technologies and Cities
Volume 7 - 2025 | https://doi.org/10.3389/frsc.2025.1512847
 Kristina Wolf1*
 Jonathan Stiles2Harvey J. Miller2,3
 Richard J. Dawson1,4Jon P. Mills1Phil Blythe1Jeremy Morley5
Cities are complicated entities with multiple stakeholders operating data infrastructures complying to different regulations and standards in heterogeneous environments; this can be challenging when developing a smart city data platform to support cross-sector urban data management. Recent advances in Internet-of-Things technology can combine real-time data streams, such as weather sensors, traffic lights, cameras, and parking sensors, in a smart city data platform that supports city decision-making and enables new collaborations and knowledge production. This paper uses a case study methodology to analyze the Smart City Operating System (SCOS), part of a Smart City project awarded by the US Department of Transportation in 2016 in Columbus Ohio. SCOS was developed as a robust smart city data management platform. However, despite a well-designed organization, methodology, and processes, the platform did not sufficiently capture city users, and was no longer used soon after demonstration funding ended in 2021. We employ a literature review, project completion reports, key informant interviews, and a project evaluation to understand the value and limitations of SCOS and consider how it could have better captured city users. Our comparative analysis of the UK Observatories shows that their more restrained “living laboratory” vision, university support, and stable funding environment helped them endure, although they serve primarily as a research platform rather than a city management platform. To make recommendations for future city data platform projects, we discuss organizational and technical aspects of conducting smart city projects, including continuous stakeholder engagement, required data ownership and real-time data management support. The results aim to support city stakeholders in developing future data platforms and provide urban management support.
The global population is majority urban (WHO, 2010) and continues to urbanize, meaning that urban sustainability and resilience are crucial challenges facing humanity. Providing an urban data management platform that can integrate diverse user requirements and data across different sectors can help address urban challenges such as reliable infrastructure services, improved security and resilience to extreme weather conditions and climate change. These goals are recognized from local scales in city plans, e.g., climate action and net zero plans (The City of Columbus, 2021a; Newcastle City Council, 2020), through to global scale, where SDG 11 calls for cities to be inclusive, safe, and resilient (United Nations, 2015a), while many other SDGs call for action to address food and water security, climate change (United Nations, 2015b), inequalities and other issues which are key to sustainable urban development. To help achieve these goals, city managers require reliable, high-resolution urban datasets to gain an overview of the city, to measure the performance of sectors, identify the effectiveness of interventions, to ensure that urban services operate appropriately (Rusli et al., 2023) and local ambitions can be achieved.
Recent advances in technology and computing resources have led to the ubiquitous deployment of internet-enabled technology- Internet of Things (IoT) across cities worldwide (Kitchin, 2014). A “smart city” is often used to refer to a city hosting a dense network of sensors that collects and computes data and communicates between different spatially distributed devices (Sarwat et al., 2018). Some cities collate and analyze these data to provide web-based dashboards, an agglomeration of Key Performance Indicators (KPIs), maps, graphs, line graphs and pie charts visualizing the condition of different city assets (Stehle and Kitchin, 2020). City authorities can use this information and communication technology to stream data for various applications, such as smart grids, cars, parking, buildings, bins, and air quality that help monitor the city and provide a safe and more resilient environment to different groups, e.g., traffic authorities, public health officials and citizens (Bibri, 2019; Sánchez-Corcuera et al., 2019).
The availability of data from the various systems helps stakeholders identify potential incidents or failures before they occur and mitigate potential far-reaching cascading consequences. However, these datasets often reside with respective stakeholders within their system boundaries, creating challenges in cross-agency collaboration, such as (Clement et al., 2022; Perera et al., 2014):
• Lack of system integration interoperability between different systems;
• Missing standardization, access and availability of different software, systems and applications;
• Security and privacy concerns (personably identifiable data);
• Organization’s resistance to change;
• Lacking trust and social acceptance of new systems; and
• Difficult usability or digital illiteracy of future end users.
In this paper, we examine the technical implementation and deployment of the Smart Columbus Operating System (SCOS), which served as a backbone for all Smart Columbus projects during the demonstration period, aiming to act as a shared platform for smart city challenges from various city domains and provide a comparative analysis of the UK Observatories. Like other smart city dashboards, the SCOS aimed to enable an “integrated data exchange” and serve stakeholders’ data needs, including public agencies, researchers, and citizens, by providing performance metrics. While the Smart Columbus project seemed to have a well-established organization, implemented project methodology, and defined processes, the SCOS abruptly stopped being accessible to the public soon after project funding ended in the summer of 2021. The purpose of this paper is to identify challenges to the SCOS project, and answer the following normative questions to inform future smart city initiatives:
1. How were stakeholders determined and involved in the design of the SCOS?
2. How was data collected and included in the SCOS platform?
3. What challenges were encountered in the development of the SCOS?
To inform these questions, we draw on a literature review, project completion reports, a subsequent project evaluation, and key informant interviews.
The Columbus case examined in this paper achieved its primary goal of demonstrating an array of smart city technologies. However, its costly data platform failed to find a lasting utility in the city through use by agencies and citizens, despite a well-established organization and implemented project methodology. The SCOS provides an example of long-term challenges stemming from criteria and stakeholders not sufficiently accounted for and involved at the start of and during the project’s design and development. The UK Observatory comparative case examined in this paper did manage to create enduring data platforms with their methodologies yet were less ambitious in scope and are mostly limited in usage to “living laboratory” research functions.
By comparing these examples, the results of this paper inform the future development of robust smart city data platforms that are well-integrated with city stakeholders and that surpass research functions. The findings will be of interest to smart city researchers, practitioners, founders, and city decision-makers.
Smart cities are characterized by their interactions and information exchange through a communication infrastructure (Mora et al., 2017). In this paper, we consider a smart city to be a “system of systems” where the built environment has a pervasive network of spatially distributed, internet-enabled devices (e.g., traffic detectors, environmental sensors, surveillance cameras), supporting the ubiquitous data collection, processing, and communication (Kitchin, 2014). An extensive overview of smart city definitions can be found in Mora et al. (2017). Marrone and Hammerle (2018) identify two main concepts of smart cities: (1) A technology-oriented approach focusing on information and communication technology for various urban applications, and (2) a people-centric approach, which focuses on the role of people, community, and their needs.
Smart city applications support city management and improve citizens’ quality of life and wellbeing: Transportation enables the movement of goods, services and people and sustains economic activity; utility networks such as electricity, water, and gas support essential urban infrastructure; and communication services allow the timely interaction between authorities and emergency services during incidents (Sarwat et al., 2018). Whereas in the past, these networks have been treated independently of one another, with little or no interaction (Sarwat et al., 2018), this concept is evolving in cities that become increasingly interconnected through internet-enabled devices (IoT), allowing to collect data with high temporal and spatial resolution.
Implementing a smart city data platform and developing useful urban applications for stakeholders requires data from different urban domains. Figure 1 visualizes common data source, opportunities, and analytics techniques for smart cities.
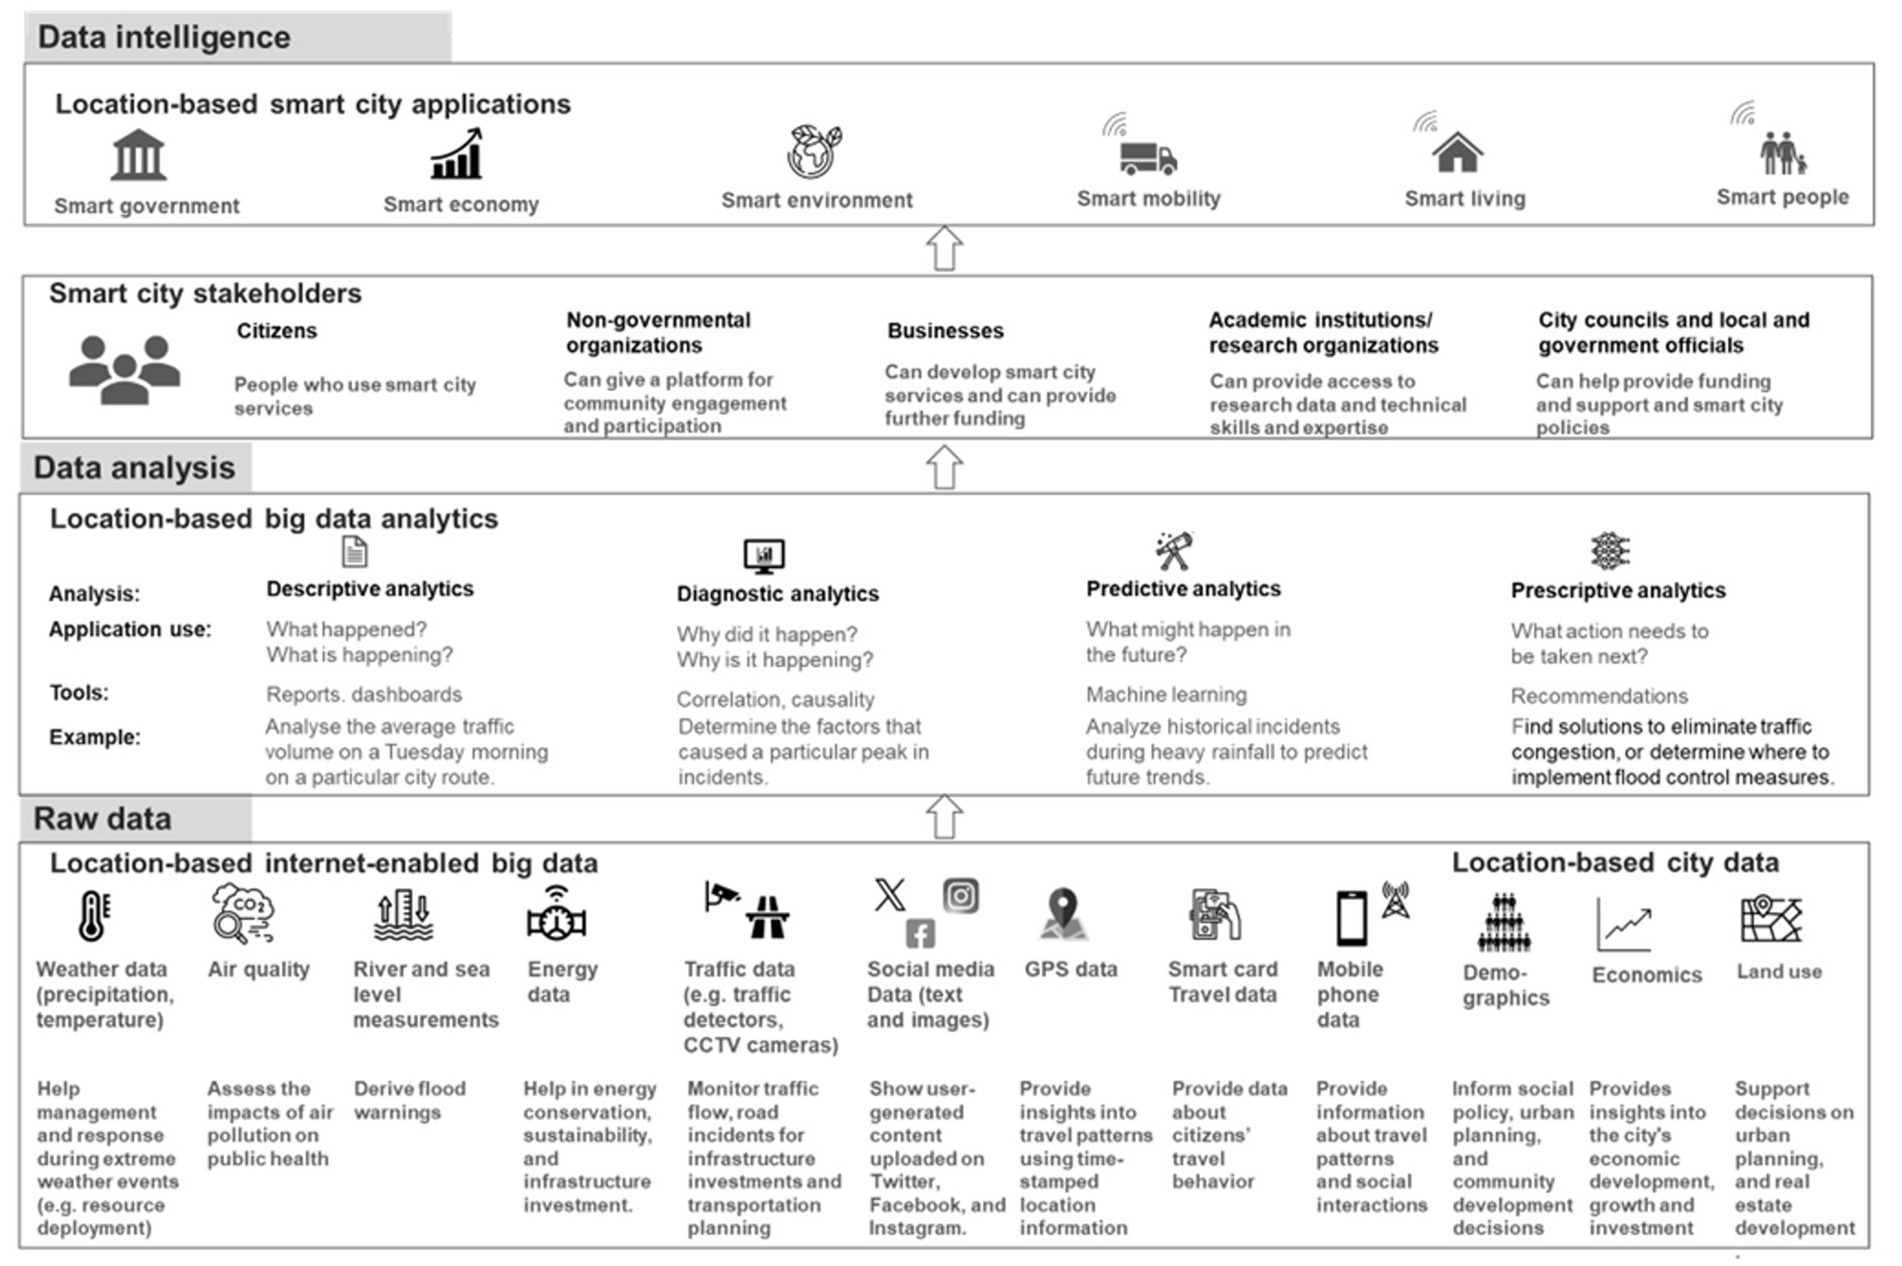
Figure 1. Smart city applications enabled through location-based data and big data analytics (own figure, adapted from Huang et al., 2021).
Although smart cities can vary in the data they collect, Figure 1 lists exemplary datasets commonly found in the literature (Raghavan et al., 2020; Li et al., 2013). Location-based data can enable smart cities with different types of data analysis, from descriptive to prescriptive (Deshpande, 2019; Huang et al., 2021). Smart city stakeholders, including citizens, academia, industry, and government (Marrone and Hammerle, 2018) can use the data to develop smart applications in various urban domains. To solve complex public problems and overcome technical hurdles in smart cities, a network of diverse stakeholders must work together (Clement et al., 2022).
Smart city project implementations can quickly get very complex, and integrating location-based data to derive insights for decision-makers can present multi-fold challenges (Raghavan et al., 2020; Cecílio et al., 2018; Nam and Pardo, 2011; Li et al., 2016; Huang et al., 2021):
• Data type and format: “data silos” might include datasets in various formats and structures, for instance, CSV, Excel, XML or JSON format.
• Data integration: data collected and stored in indifferent databases might adhere to specific standards and protocols, requiring metadata for successful integration.
• Data processing and storage: integrating large and complex datasets from different sources can be computationally intensive, requiring significant processing and storage resources.
• Data quality: heterogeneous data may vary in quality, completeness, and accuracy. Missing or incomplete data and faults in sensor parameters can lead to erroneous or biased conclusions.
• Data semantics: data from different sources may use different terminologies for the same concepts or entities, creating misunderstandings when integrating these datasets.
• Data compatibility: proprietary systems might not be compatible across the wider “system of systems.” Due to their structure and format heterogeneity, stakeholders might need help extracting data and specific connectors.
• Data privacy and security: different stakeholders may hold sensitive information requiring authorized use, such as health records.
• Data access and use: sharing heterogeneous data across different city domains can be challenging due to different access requirements or ownership policies.
Although not an exhaustive list, these challenges demonstrate the need for better solutions to bridge interoperability and facilitate better data integration and sharing across different stakeholder systems. In addition to the technical aspects, organizations must establish clear data governance policies and procedures that address data access, ownership, and privacy concerns.
We consider the steps of the systems engineering methodology (Parnell et al., 2011), a methodology for complex multi-agency environments with multiple stakeholders from different domains and different requirements to answer our three research questions:
1. How were stakeholders determined and involved in the design of the SCOS?
2. How was data collected and included in the SCOS platform?
3. What challenges were encountered in the development of the SCOS?
This paper adopts a comparative case study approach, which is defined as “the systematic comparison of two or more data points (‘cases’) […] using the case study method” (Kaarbo and Beasley, 1999). A case study is an appropriate social science research method when addressing questions related to processes about real-world phenomena embedded in a particular context over which the researcher has little control (Yin, 2009).
After presenting a short case study of the UK Urban Observatories to establish a precedent for comparison, we perform an in-depth case study of the Smart City Columbus OS. This comparative approach of the two countries helps better understand the implementation of complex technological systems for urban management in different contexts.
As part of the UK case study, this paper presents a categorical overview of the datasets available for different UK Urban Observatories: Cranfield, Manchester and Newcastle upon Tyne. Based on common characteristics of international Urban Observatories by Rusli et al. (2023), we evaluate the UK Urban Observatories from a design and technical perspective, including data collection, interoperability, analytics and data platform functionalities.
The Smart City Columbus OS case study data consists of public project documents, media coverage of project activities, and seven interviews with project participants. Among key documents collected by researchers were quarterly progress reports and the project final report. Interviews were conducted remotely, and interviewees included members of the city, a local partnership formed by local firms created to support Smart Columbus, and three of the consulting firms that were contracted by Smart Columbus. To address the three research questions, first, we provide an overview of the city stakeholders in Columbus that were involved in the Smart Columbus city project and the mechanisms of their development, including government departments, local authorities, regional agencies, transportation providers, academics, businesses, technical working groups, community members, and independent reviewers. Next, we consider the data that was included and methods through which it was collected.
Based on the evaluation of the SCOS from project feedback and the experience of the Urban Observatories, this study created cross-location insights for the systematic implementation of ambitious, smart city management data platforms like SCOS.
This study finishes with an overview of recommendations divided into organizational and technical aspects to better ensure their utility and longevity. We further assess the role of funding in such large-scale city infrastructure projects and the role of consulting firms regarding long-term stability and platform management.
Cities stakeholders have an increasing need for data analytics to tackle different urban challenges. Structured monitoring systems can help provide accurate data and support analytical functionalities. While we refer to such monitoring system as an Urban Observatory, depending on the location, other cities call it a “Living Lab” or “Living Observatory.”
Rusli et al. (2023) provide a comprehensive overview of existing urban monitoring systems. Although many of them have the common goal of sharing data to improve existing urban services, they vary in their level of development. Despite their different maturity levels, some common functionalities include:
1. Data collection: urban Observatories are data-driven repositories that deploy a network of connected sensors to collect and store data about the urban environment, including weather, air quality, and land use information.
2. Data analysis: stakeholders use the data to analyze historical and real-time events and identify trends and patterns.
3. Monitoring city assets: stakeholders can monitor and evaluate the performance of the urban environment and city assets, e.g., transportation networks, water and energy systems, and public services (UN-Habitat, 2020).
4. Modeling and simulation: Urban Observatories provide data for predicting and testing the impact of government-implemented policies and the potential outcomes of different scenarios on the urban environment.
5. Visualization and communication: Urban Observatories data can help visualize results and communicate the findings of complex urban matters to city stakeholders in an accessible and understandable way, such as through dashboards.
6. Decision-making: Urban Observatory platforms can inform decision-makers about the city’s current condition and highlight areas for improvement. They can further facilitate knowledge transfer across stakeholders and drive broader discussions about policy, urban planning, and investment to improve the quality of life in cities (Rusli et al., 2023).
The following introduces an example of implementing Urban Observatories in the UK. Using existing smart city data platforms, we can learn from these examples to increase project success and maximize progress when implementing a smart city data infrastructure. Smart cities that share their experiences can also help others avoid duplicating efforts and repeating the same mistakes. This way, cities can achieve their common goal of implementing sustainable smart city solutions faster.
The UK Collaboratorium for Research in Infrastructure & Cities (UKCRIC) established a network of interlinked urban infrastructure “observatories” in six localities across the UK: Newcastle, Bristol, Sheffield, Cranfield, Manchester, and Birmingham. The UKRCIC observatories received a £8 million grant across all the observatories (EPRSC, 2017). UKCRIC aims to use the observations to improve the understanding of the different interactions between the environment, people, and infrastructure within the “system of systems” and improve the resilience of the nation’s infrastructure to extreme events and the adaptability to changing conditions. The Urban Observatories are a collaboration between different UK Universities that are responsible for:
Data collection: although each Urban Observatory focuses on slightly different urban variables, we can identify common data categories in the environmental, economic, social and transport domains. Using three different UK Urban Observatories (Cranfield Living Lab, Manchester-I, and Newcastle Urban Observatory), Table 1 summarizes the data variables for which high-resolution and high-temporal-resolution time series data is available for analysis, download and visualization via the open-access platforms (Cranfield Urban Observatory, 2024; Manchester Urban Observatory, 2024; Newcastle Urban Observatory, 2024).
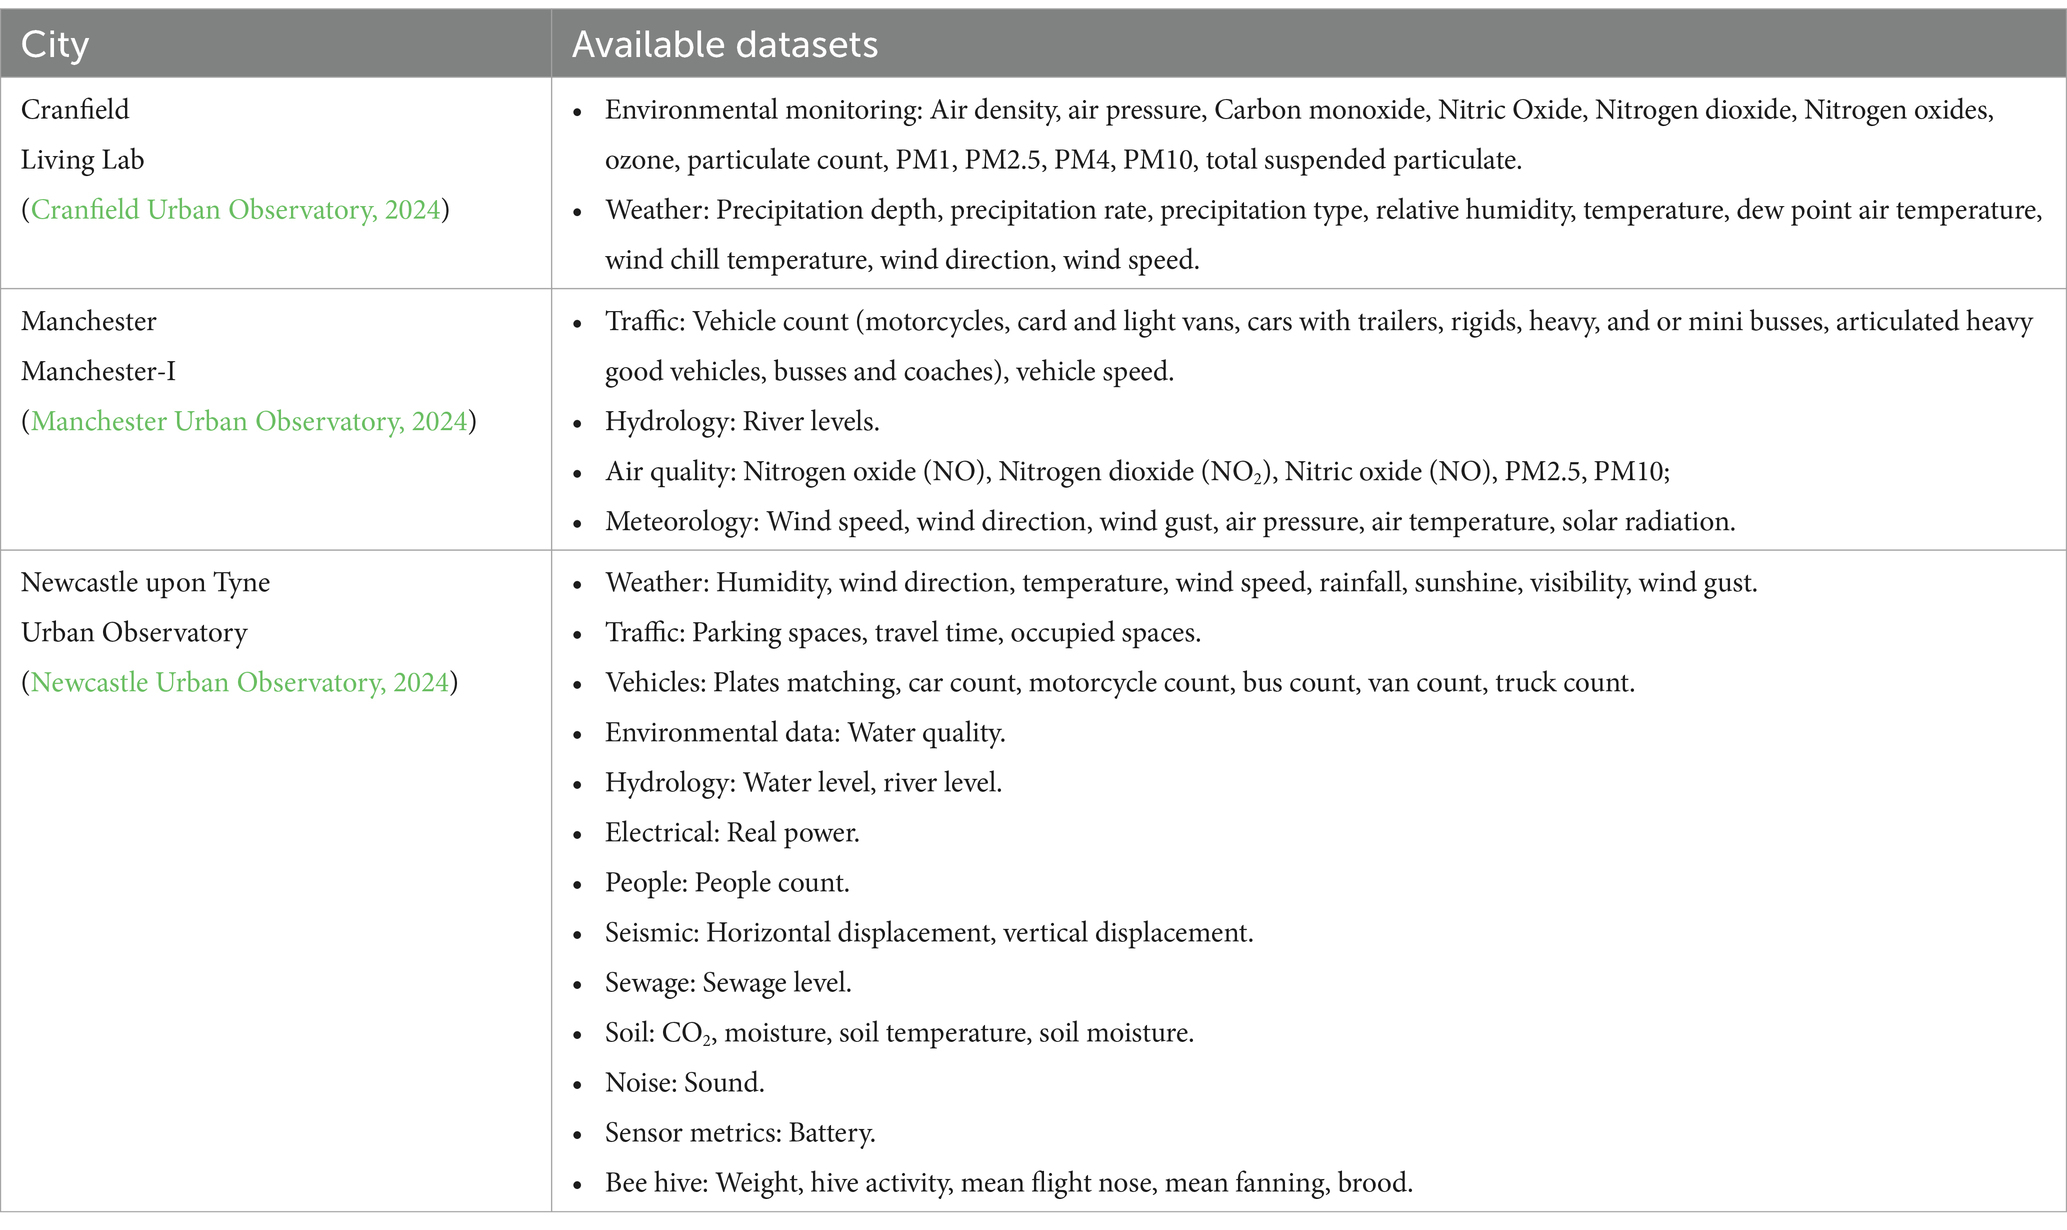
Table 1. UK Urban Observatories and datasets available.
Newcastle Urban Observatory supports different commercial-off-the-shelf sensors and integrates data from third-party sensors where that data is accessible openly or through agreement with the provider (James et al., 2022), such as transportation data and Closed-Circuit Television (CCTV) feeds from the Urban Traffic Management Control Centre (UTMC).
Design process: motivated by Jacobs’ observation that cities are a continuous set of experiments (Jacobs, 1969), the aim was to develop an observation platform to collate relevant available daily data to understand how different city sectors interacted, study emergent phenomena (e.g., urban heat islands), and assess the effect of city improvement initiatives (e.g., new road layouts, buildings, green spaces). The project team ran sandpits with businesses, industry, and researchers to stimulate interest, find synergies, and ensure the collation of data that would achieve a wider community purpose. Recognizing the importance of stakeholder engagement, the project team included community groups, often excluded from this sort of data access, as major users, since it provided real-world evidence that could be presented to decision-makers.
Data storage: Newcastle uses cloud computing technology and scalable open-source databases to store big time-series data. For long-term sustainable data storage, they create archives of the observation data and make them available for users to download in.csv format. The large amount of historical- and real-time data can provide a future basis for developing digital twins.
Usability of data platform: Figure 2 visualizes the Newcastle Urban Observatory platform. The individual elements are described below according to the numbering in the figure.
1. Menu containing individual tabs for the following items:
• Graphs for different variables, comparing observations between different sensors.
• Radar visualizing historical precipitation on a map using a time slider and time-series data chart.
• “Explore” option providing metadata on various sensors, deployment topics, variables, and measurements.
• Download area with sensor data and observations.
• Archive with direct download access to historical observation data.
• Tools include metadata,.svg graph generators for variables and sensors, air quality tools, script statuses, and sensor check-ins.
• API (application programming interfaces) providing REST API services to sensor information, raw sensor observations, variables, topics, and sensor types.
1. Map displaying Newcastle and its surrounding area. Using the web interface, users can select one or more data categories to visualize aggregated views of different sensors on the map. Users see the observations collected at this location when zooming in and clicking on a specific sensor.
2. Legend showing how the sensors are grouped into classes.
3. Legend of the different topics and the symbols used to represent them in (2).
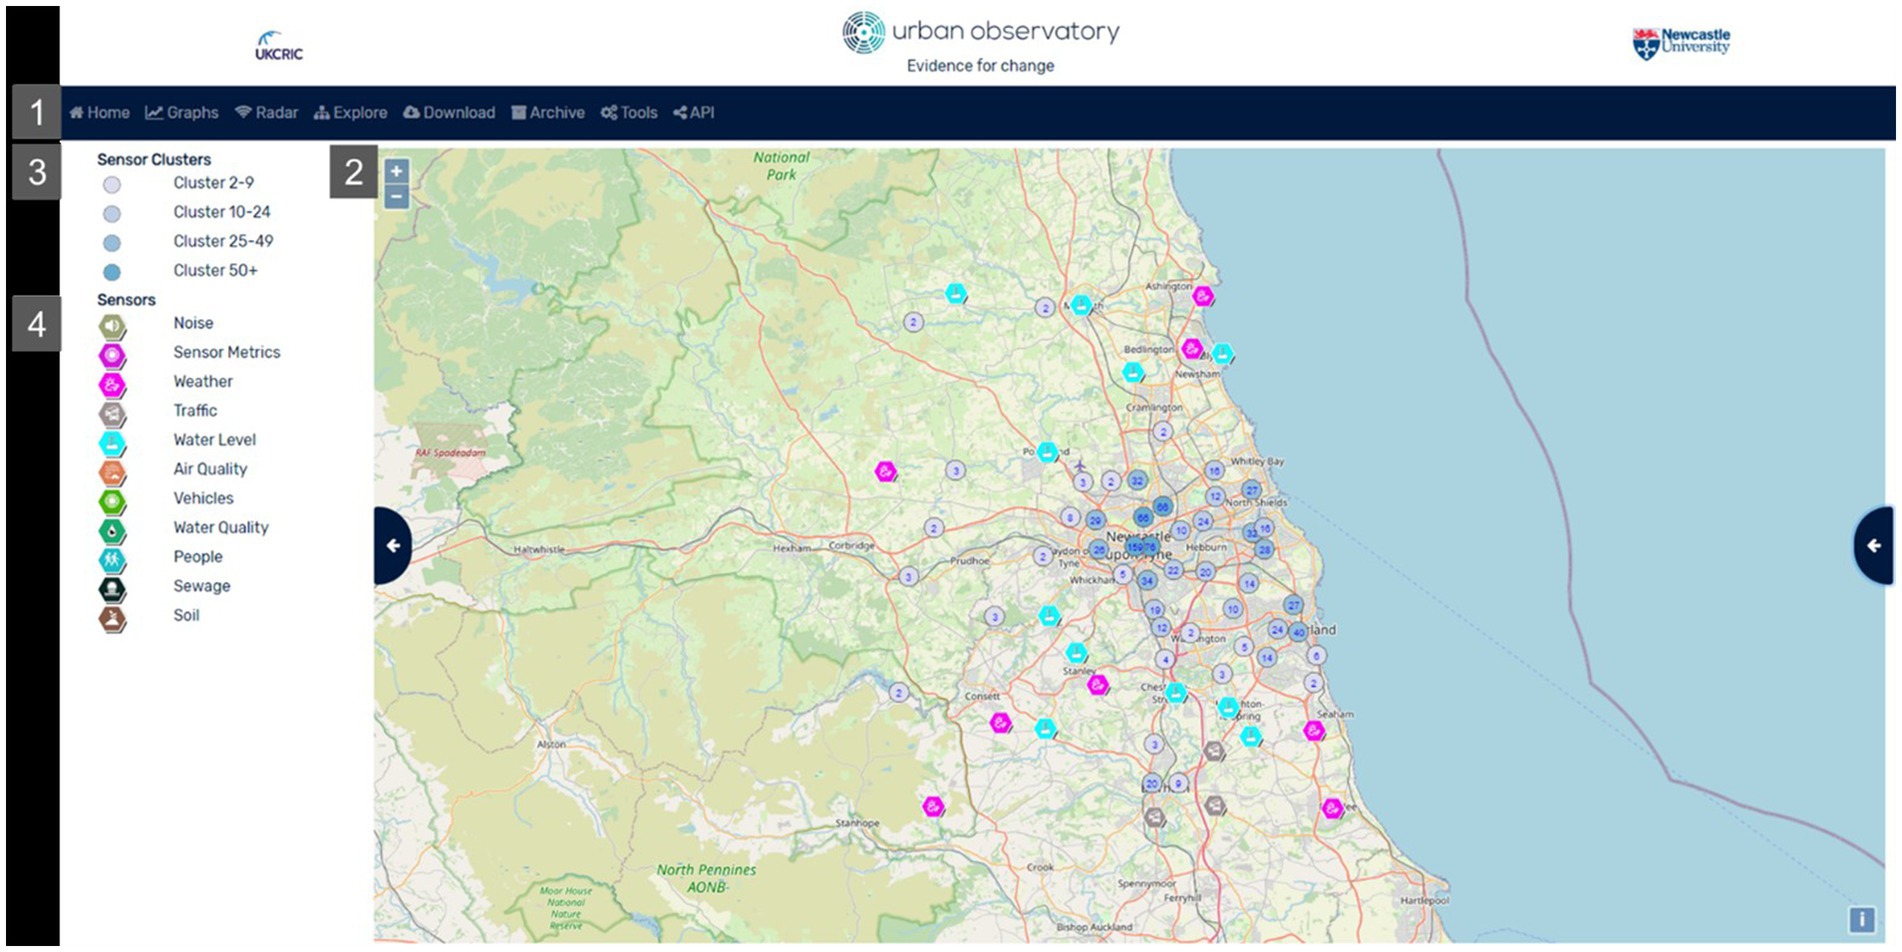
Figure 2. Newcastle Urban Observatory portal (Newcastle Urban Observatory, 2024).
• Compatibility: Urban Observatory platforms are openly accessible through a web browser using an internet connection.
• Data access: Urban Observatories make data accessible through direct download in.csv format or available REST API services.
Data analytics: users clicking on a sensor topic in Figure 2 will see a list of variables and a graph with a time-series of the most recent observations (last 24 h), 7 days or the last month. Figure 3 visualizes a graph for PM 2.5 time-series data.

Figure 3. Newcastle Urban Observatory sensor time-series observations (Newcastle Urban Observatory, 2024).
Added value through city use cases: researchers have used data to identify patterns, trends, and anomalies, predict traffic forecasts using Machine Learning algorithms and build customized applications to generate insight into the city’s condition, including:
• Understand the drivers and impact of congestion charges and the impact of COVID-19 lockdowns (James et al., 2020);
• Assessing the impact of extreme weather events on the transport network (Wolf et al., 2023);
• Assessing the impact of air quality on school children (Keast et al., 2022); and
• Estimating Vehicle and Pedestrian Activity from Town and City Traffic Cameras (Chen et al., 2021).
While UK Urban Observatories mainly function as research-enabling demonstration platforms, their actual use in day-to-day city management is currently limited. However, they do find practical applications, e.g., the city council using Urban Observatory data to assess how busy the city is, thereby providing a useful tool for people to decide about visiting the city center (UK Ministry of Housing, Communities and Local Government, 2021).
Columbus is the capital of Ohio, located in the Midwestern United States. With a 2020 population of 905,860, it is the 14th largest city in the US. In December 2015, the U.S. Department of Transport launched a Smart City Challenge, asking U.S. mid-sized cities to develop ideas for an integrated smart transportation system using use data and technology for applications to improve citizens’ transportation and quality of life. Funded by the U.S. Department of Transportation’s Smart City Challenge grant program in 2016 for 5 years, Columbus was announced as the winner of the Smart City Challenge.
Meeting the requirements of a typical “mid-sized American city” with a record of proven transport infrastructure to reconnect neighborhoods, including covering highways that divided neighborhoods, Columbus was considered an ideal test site. The existing CMAX bus route, an enhanced bus service, was developed to improve social and health conditions in northeast Columbus. As part of the Smart Columbus project, the city intended to introduce self-driving shuttles to close first- and last-mile gaps and solve CMAX’s first- and last-mile access problem, which could lower the barrier for low-income citizens to access the services they need. Thus, the Smart Columbus project presented a unique opportunity to position the Columbus metropolitan area as a pioneer by enabling integrated data exchange, deploying advanced sensors and cameras at smart intersections, and introducing autonomous and connected vehicles. Using Columbus as a working smart city model, the approach could be applied to other cities in the U.S. in the future.
Smart Columbus received a $40 million grant from the U.S. Department of Transport (USDOT), paired with $10 million from Microsoft cofounder Paul Allen’s Vulcan Inc. foundation, and $90 million in matching value from local organizations in Ohio. The resulting joint venture initiative was described by one interviewee as complicated yet imbued with a healthy tension (Interviews). The USDOT grant funded eight demonstration projects altogether, including the operating system, with several additional projects related to electrification and visioning funded by Vulcan Inc. Key projects included:
1. Multi-modal trip planning to improve mobility by expanding public transport options, reducing traffic to increase access to jobs and education, and a new Pivot smartphone app.
2. Connected electric autonomous shuttle routes to connect major tourist points and to improve access to services and jobs in the deprived community of Linden.
3. Electrical vehicle charging infrastructure to grow the region’s network of electric vehicle charging stations and support future-forward mobility.
4. Prenatal trip assistance to address high infant mortality rates by connecting pregnant individuals without reliable transportation to doctors’ appointments and pharmacies.
The Smart Columbus Operating System (SCOS) aimed to be a digital backbone for hosting and integrating all data from these and other Smart Columbus City projects in addition to other data. The Smart Columbus project aimed to make the SCOS sustainable and replicable across other cities. Figure 4 provides a visualization of the SCOS from initiative materials.
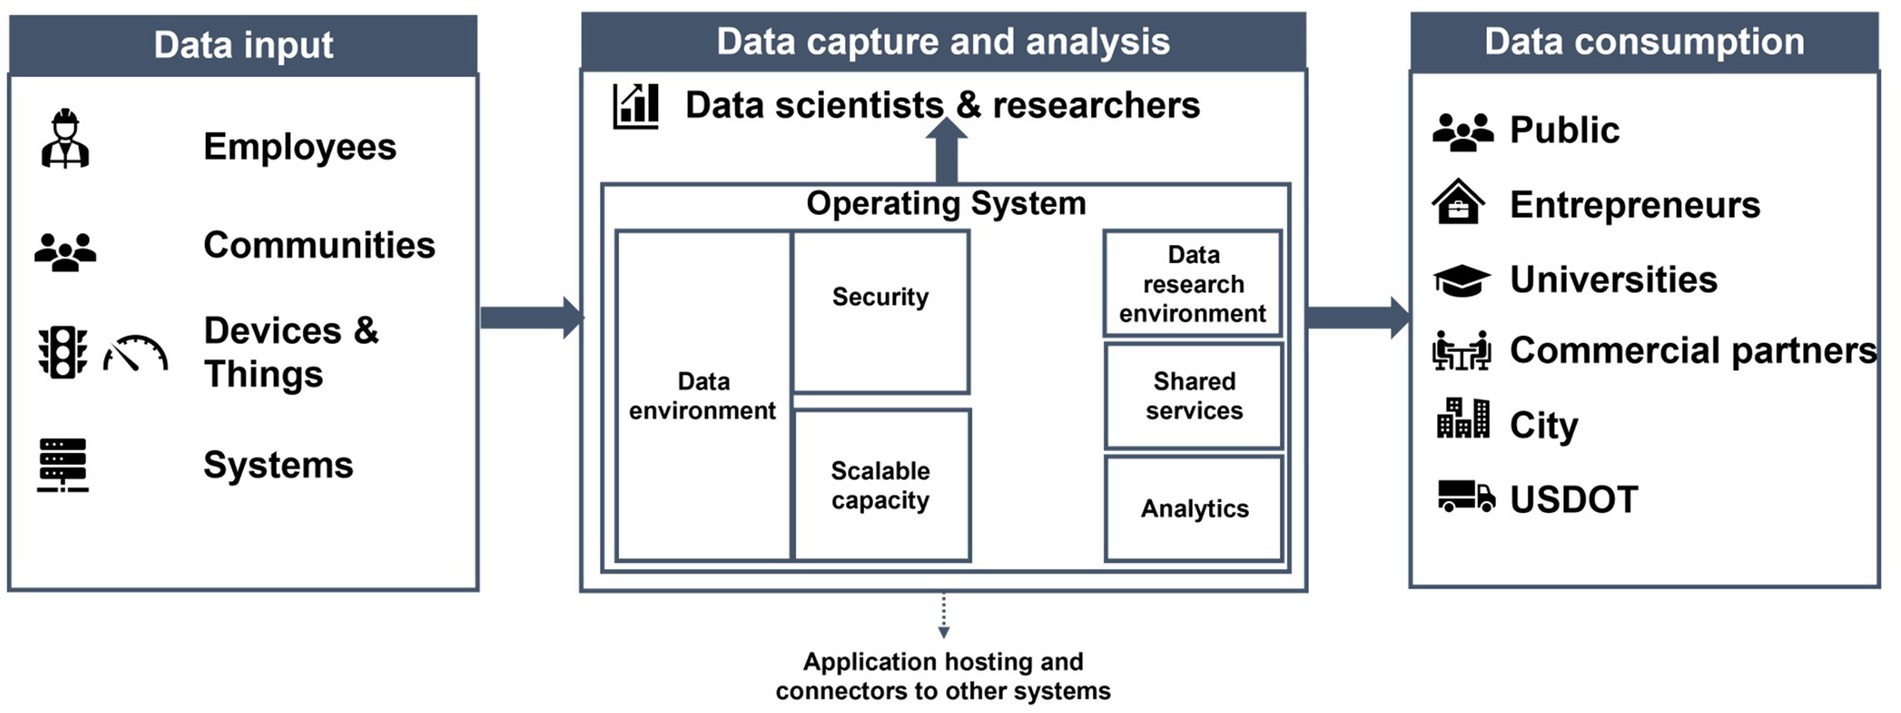
Figure 4. Smart Columbus OS (own figure, adapted from The City of Columbus, 2021a, 2021b).
After abandoning a plan to use the open-source platform CKAN in part because of lacking support for streaming data, Smart Columbus decided to custom-build a more advanced, flexible, and scalable platform. This decision to build rather than buy was reportedly a strong preference of the funder, the USDOT (Interviews). The custom SCOS would support features such as:
• Data hub to collect, ingest and manage data from a variety of sources, including sensors and social media;
• Analytics platform with application using cross-city data for stakeholders to analyze and visualize data and use for their decision-making;
• Development platform for smart city technologies, including data from connected streetlights and traffic management systems; and
• APIs to allow third-party developers to build new applications and services.
The SCOS platform aimed to serve and integrate stakeholders across the public and private sectors, including city agencies, researchers, nonprofit organizations, entrepreneurs, and citizens, by sharing open and secure data on the city and supporting various applications and services. It was a large undertaking requiring a large team from the selected vendor- a large global consulting firm with dozens of on-site staff, far more than any other Smart Columbus vendor.
We first consider the question “How were stakeholders determined and involved in the design of the SCOS?” As defined earlier, a smart city comprises many different entities both in its creation and use. Because of the complexity of its funding arrangement, the goals of its funders, the Smart Columbus project included numerous stakeholders from environmental, social, transport, and commercial domains as well as from multiple scales of government and the private sector. Table 2 provides an overview of major stakeholder groups involved in the Columbus project and associated with the SCOS.
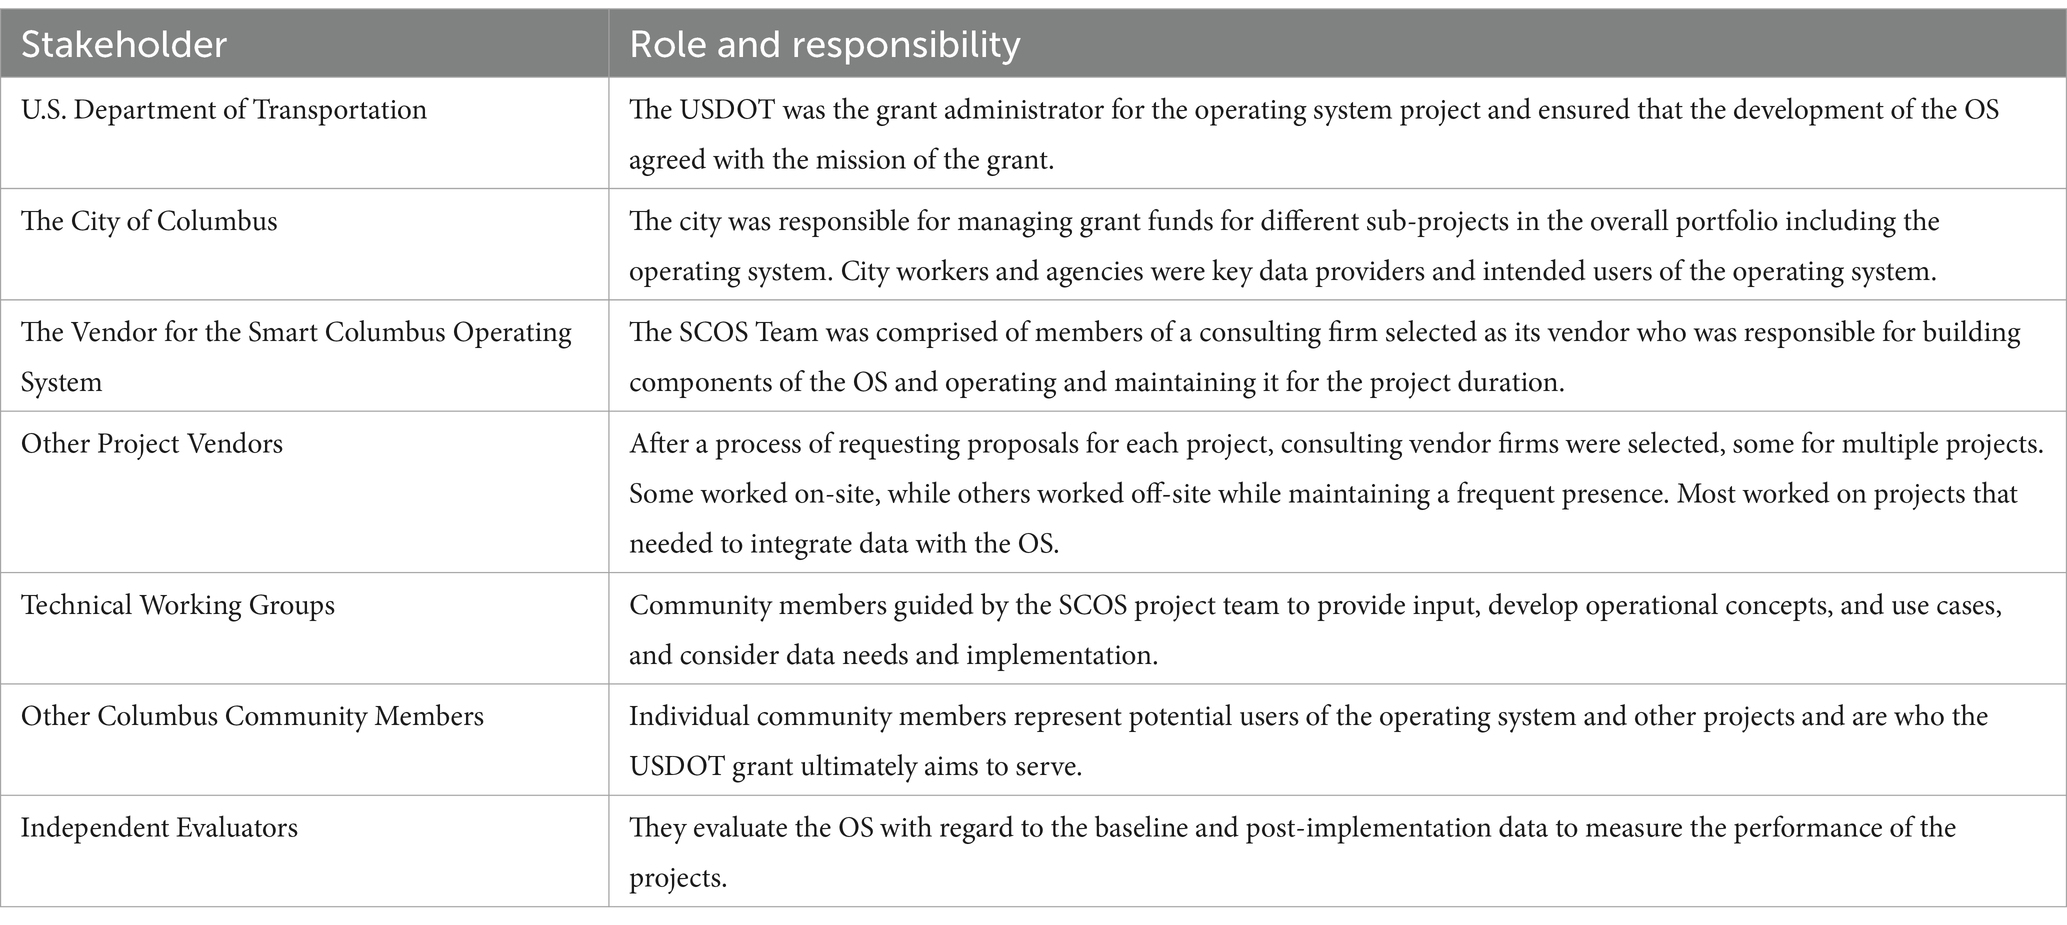
Table 2. Stakeholders involved in Smart Columbus SCOS implementation.
Further stakeholders included various state and regional agencies and organizations such as the Ohio Department of Transportation, the Mid-Ohio Regional Planning Commission, the Ohio Public Utilities Commission, the Central Ohio Transit Authority (COTA), as well as other local organizations such as The Ohio State University and the Columbus Partnership, a local business group.
With numerous vendors and funders, there were differences in favored approaches to managing Smart Columbus projects with implications for stakeholder engagement. More information technology-oriented firms, especially the ones selected to build the operating system, strongly favored an “agile” management approach, which progressed more rapidly through software product cycles. One of the principals of an agile methodology is to “fail fast” through smaller problems early in the product cycle, in order to learn, and avoid more catastrophic failures later on (James, 2007). Proponents thought this would offer better risk management for Smart Columbus by making problems visible early, as well as creating opportunities for demonstrating early progress- what one interviewee described as “getting busses on a map very quickly” (Interviews). The agile approach also was favored by the city in how it allowed looping back for feedback from stakeholder citizens. However, the primary funder, USDOT, was unfamiliar with agile methodology, which created extra work for the city explaining it to them. Additionally, some city members of SCOS questioned whether a “failing fast” approach was suitable for government in its role as a regulator with an eye on equity (Interviews).
Working groups were the main form of stakeholder engagement for the operating system project. This idea stemmed from the USDOT mandate and engaged 250 people from 50 organizations (The City of Columbus, 2021b). The SCOS team appreciated how working groups allowed everyone who wanted to play a role, to play a role, but an early diversity of volunteers that included participation from local non-profits fell off later in the program to become a smaller core group (Interviews). The final report highlighted the importance of having local “subject matter experts” and “businesses” in the working groups (The City of Columbus, 2021b). The SCOS team managed the working groups, including posing topics and problems and recording the outputs of discussions at later stages, guiding the translating of each “issue” into a “feature/capability” with defined “users” and “model organizations,” and then further developing “use cases” related to specifics OS capabilities (SMRT Cities Columbus: Segment 4, 2019a). Yet in these notes, even later in the project timeline, named user groups and roles tended to be generic and repeated across capabilities, with “city planners,” “entrepreneurs,” and “data scientists” mentioned several times each in one working matrix from 2020 (SMRT Cities Columbus: Segment 4, 2019b).
There were also two hackathons using Smart Columbus Operating System data, one attended by more than 100 people, and other efforts at building community apps. However, the SCOS team had been hoping to see more novel and sustainable apps built from SCOS data than were actually produced. Reflecting on the skill set of the user base, a consultant member of SCOS came to consider the challenge as one of “how can we make people smarter and data easier?” (Interviews).
Next, we consider the question “How was data collected and included in the SCOS platform?.” According to the Smart Columbus report, over 2000 datasets were hosted on the SCOS platform by March 2021 (Final Report). A review of an archived SCOS data inventory shows it ingested data from various state, regional, and local sources, and data from other Smart Columbus projects. Some of this data was already publicly available, but others were not or were new. The largest share of SCOS data was geospatial data from the state’s Ohio Geographically Referenced Information Program, which had recently begun hosting its own open data platform. Other state data from the Ohio Department of Transportation, such as crash locations, was previously only available through approved registration, but would be publicly accessible in the SCOS. Local nonprofit organizations and research institutes at The Ohio State University contributed fewer but important or unique datasets, such as data on food pantry providers and vulnerable senior populations (SMRT Columbus, 2024a). Finally, the platform successfully hosted data to support other smart Columbus projects during the demonstration period, including data on smart kiosks, connected vehicle segments, and parking meters (SMRT Columbus, 2024b).
The challenge of “ingesting” data was much discussed by the SCOS team and represented a large share of its effort. It was a particular challenge for government data because, according to one interviewee, each department was doing something different (Interviews), resulting in the team having to build connectors for each different format, including considering cases on non-tabular data (Smart City Challenge Demonstration, 2019). A requirement to prevent the upload of data containing personally identifiable information also presented a major feature (The City of Columbus, 2021b). Despite these challenges and even the failure of the SCOS data to continue to be hosted past the demonstration program termination, the city saw the benefit of combing through and confronting the diversity of its data management (Interviews).
We finally consider the question, “What challenges were encountered in the development of the SCOS?” Our case analysis above, alongside a review of Smart Columbus documentation, including its own extensive self-evaluation (The City of Columbus, 2021b) and news coverage of the initiative, reveals several areas that explain how the project experienced difficulties. For clarity, we divide the various issues into organizational and technical areas. Table 3 provides an overview of the challenges, while the following evaluation in Section 5 shows lessons learned and recommendations for future smart city data platforms.
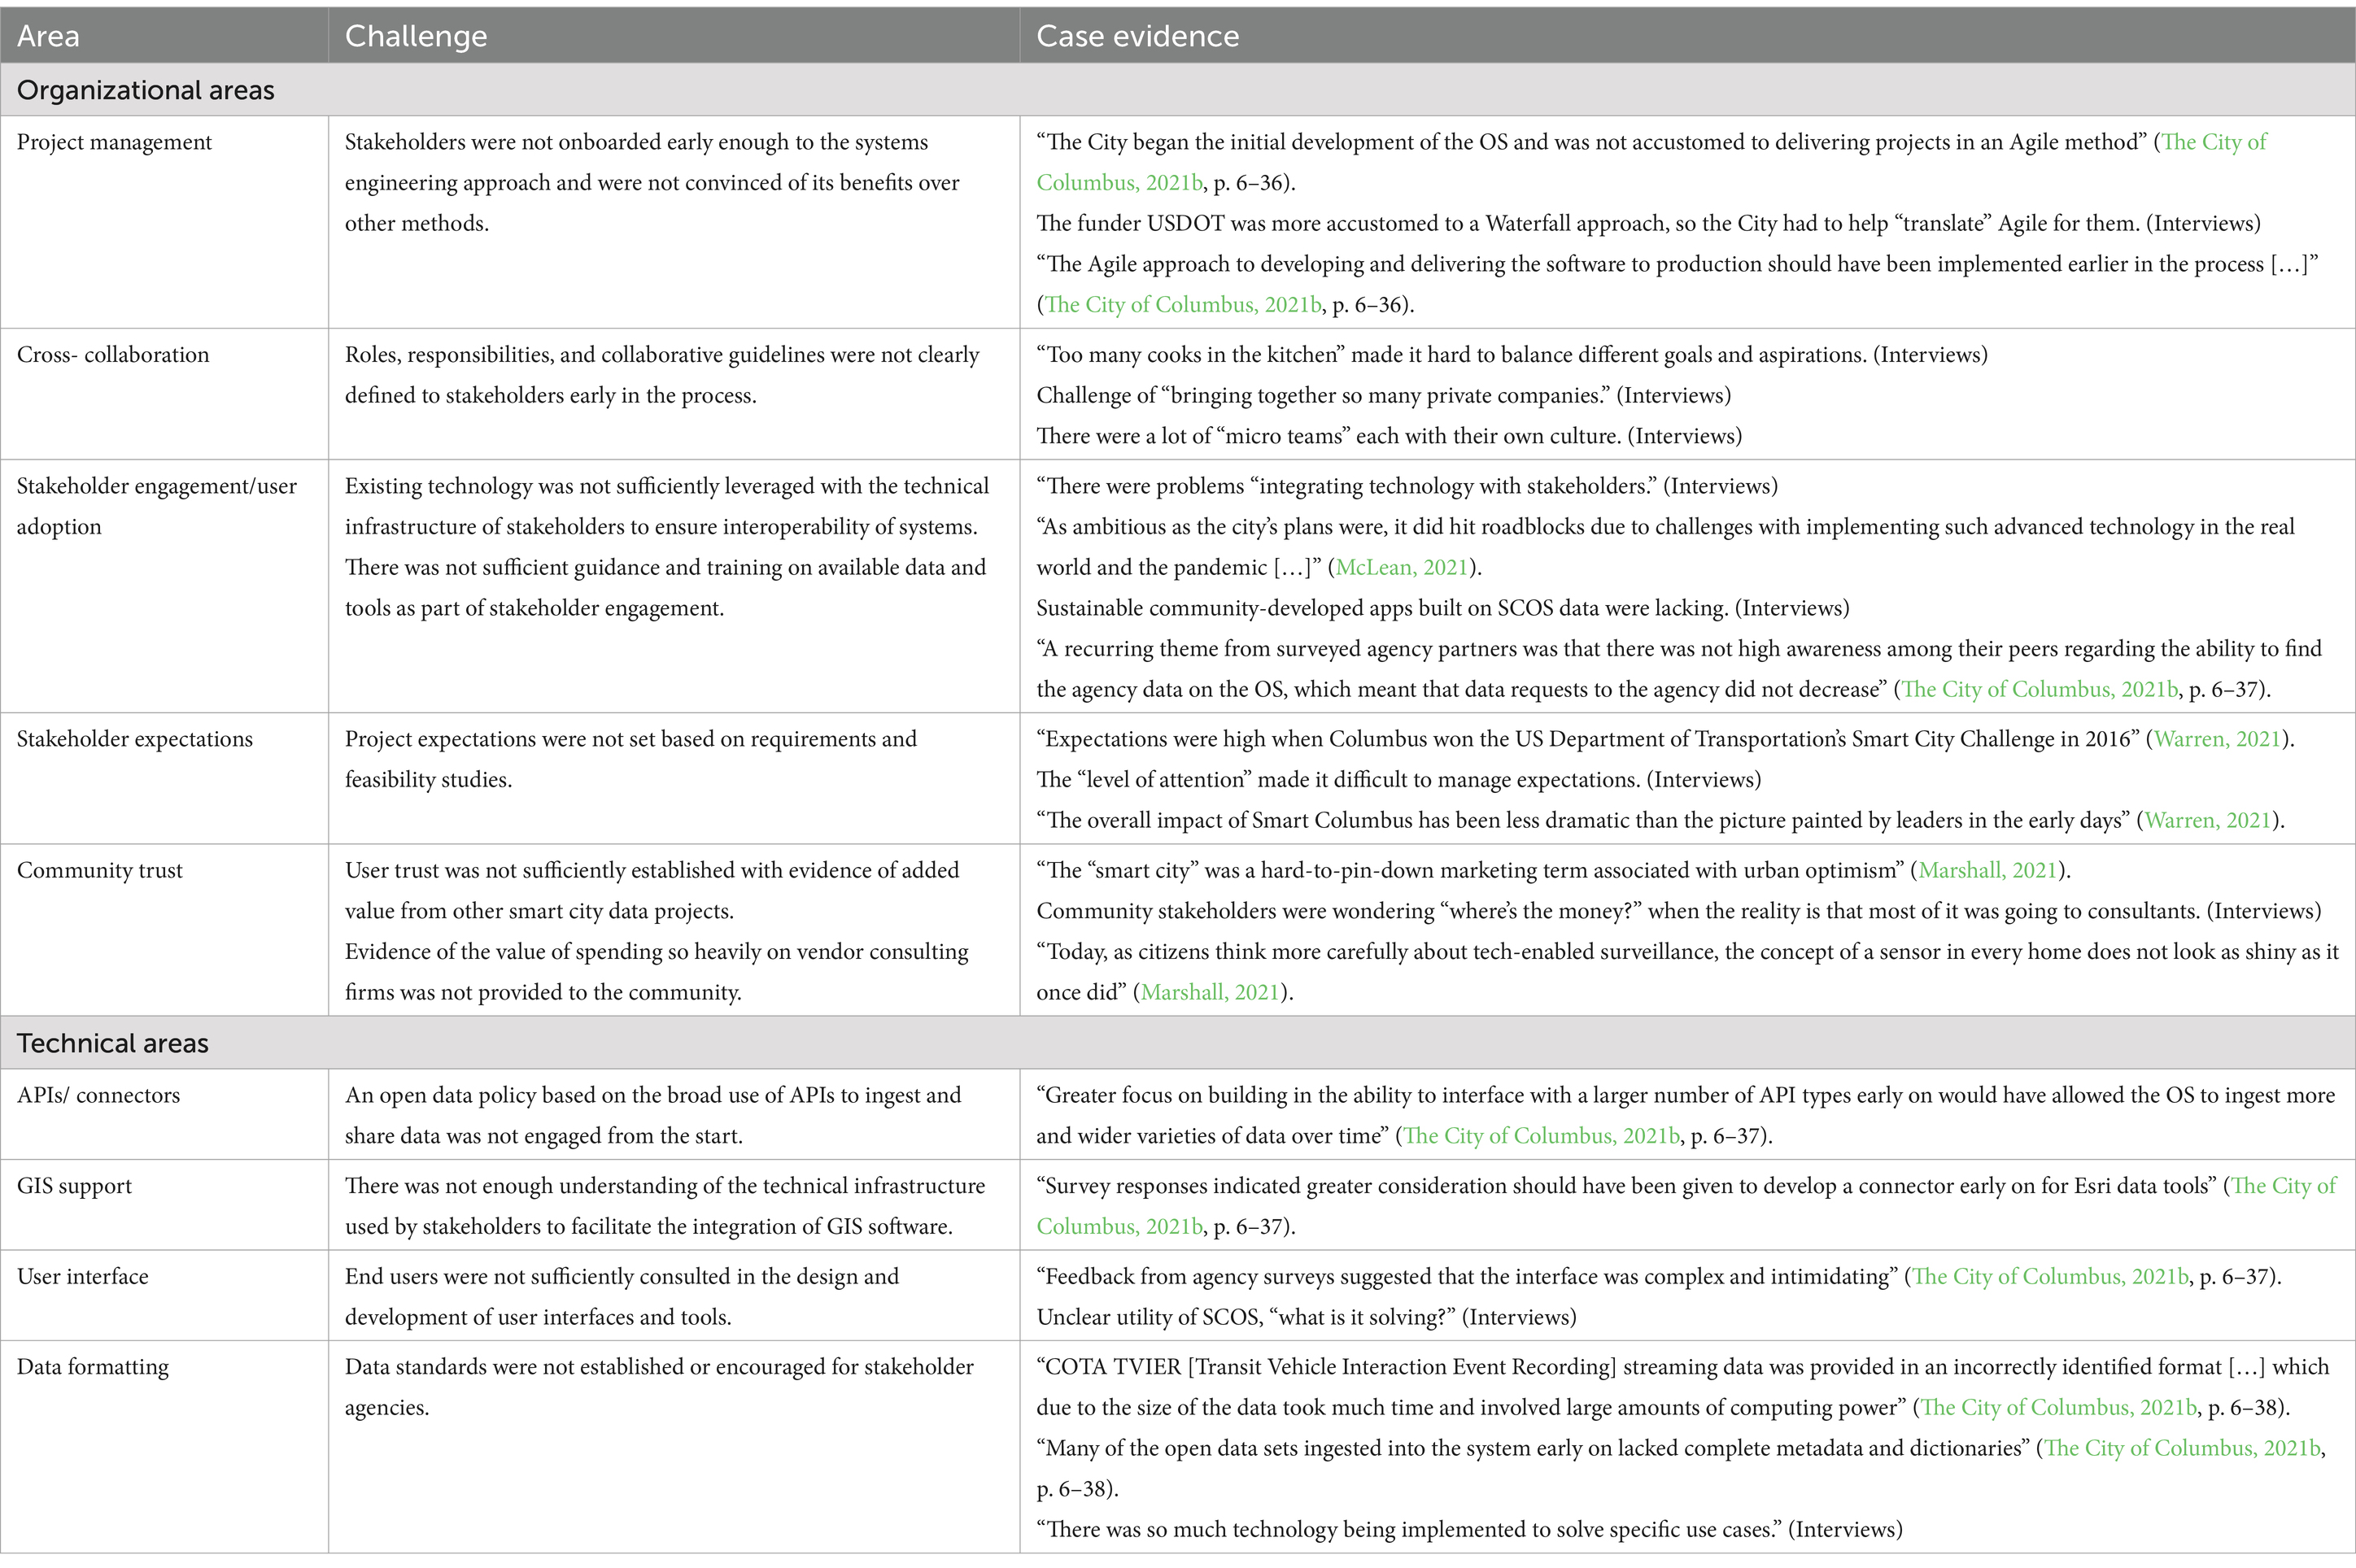
Table 3. Smart Columbus project challenges (divided into different categories).
In the words of one consulting firm team member after the project, when it comes to collaboration, “it is okay for things to not go as well as expected,” a sentiment that reflects the benefits of going through such a complex process together despite its challenges (Interviews). In responding to questions about lessons learned for their organizations, members of the city indicated the value of have had to think critically about its own varied data, while consultancies indicated the benefits of learning to better work with civic and university partners (Interviews). Thus despite its challenges, the overall project increased collaboration and knowledge among various city stakeholders and beyond. While novel projects carry the risk that some components may work and others may not, the city of Columbus and other future initiatives can now benefit from the experience, expertise and lessons learned from the SCOS experience, a fundamental goal of the grant that enabled it.
This section discusses and derives best practices and recommendations for future implementations from our case studies of the UK Urban Observatory platforms and the Smart Columbus Operating System. Given both examples’ different natures and directions, we summarize critical lessons from which future end users can benefit in similar projects to ensure long-term sustainability and utility of data platforms. Reflecting on the key concepts of smart cities described by Mora et al. (2017), this study has shown that successful implementation must be people- and technology-centered.
The Urban Observatories project, developed as part of the broader UKCRIC, serves as a driver for new forms of applied interdisciplinary urban research. The idea is to use the city as a living laboratory to collect and use a wide range of datasets related to various aspects of urban life. This facilitates a better understanding of the city’s performance, enabling increased sustainability through regular monitoring and intervention, and informing better decision making in the future. Yet its aims did not extend to transforming the day-to-day management of cities.
The Smart Columbus Operating System served the data needs of the Smart Columbus demonstration program and had widely agreed-upon benefits from its collaborative process. However, despite its ambitious aims to create a robust data platform for city management, the SCOS did not find enduring utilization for the city of Columbus and was halted in 2021, shortly after the demonstration funding period ended. As of 2023, it is no longer accessible to the city’s stakeholders and citizens. Despite the aim for the SCOS to be sustainable and replicable, other cities have not adopted the generic SCOS software. The experiences of SCOS integrating with city agencies from the start provide the basis of sound recommendations for the next generation of enduring smart city data platforms. Table 4 gives an overview of these recommendations.
• Engage project team members in a systems engineering approach at an early stage.
While the Smart City Columbus project adopted the systems engineering approach, post-project assessments and interviews revealed that the project team could have introduced the approach earlier, as some participants were less unfamiliar with agile project management. Future projects must introduce the project methodology at the beginning to ensure that different stakeholder groups are familiar with the approach, thereby preventing potential delays.
• Define clear roles and facilitate stakeholder collaboration.
The SCOS project team could have allocated more time to engaging stakeholders at the beginning of the project and could have more clearly defined their roles. Future projects must involve government agencies, private companies, and academia from an early stage to ensure that stakeholders understand the project’s aims and have the same data-sharing goals, prompting them to be more likely to collect relevant and valuable data. Projects must demonstrate the added value of sharing data, over storing it in independent silos, that can help create a common operating picture and understanding of the city among stakeholders.
• Appoint data owners for managing multi-agency data sources.
Although the SCOS aimed to integrate various multi-agency data, not all SCOS stakeholders shared data easily. Data availability could have been improved if stakeholders had shared more bespoke datasets. For future development, we suggest identifying a responsible person who acts as an intermediary and hosts and curates the data between stakeholder organizations and end users while organizations remain the owners of their data and only provide access.
• Manage privacy concerns around personally identifiable information (PII).
The SCOS project team could not collect personally identifiable information (PII) for the SCOS development (The City of Columbus, 2021b). While not hosting personally identifiable information minimized risk to the community and increased public trust, PII restrictions meant that the SCOS had to remove applications which were initially part of the project. Future implementations can include data aggregated at different levels to avoid PII and still help emergency services help vulnerable citizens. For example, as opposed to social care workers who deal with critical incidents, emergency services do not need detailed information about a person’s health status but how many people in the community need special assistance for evacuation.
• Provide ample user guidance and training on available datasets and tools.
Not all stakeholders used the SCOS to find data, and some agencies continued to approach the council directly. Additionally, community use of the data was lacking. Smart cities must ensure that users understand the data platform enough to interact, search for data and perform queries.
As a recommendation for future deployments, providing clear guidance and documentation to a central data integrator and workshops with tutorials can ensure that stakeholders know the scope and features of the data portal and can find the required data for their analysis.
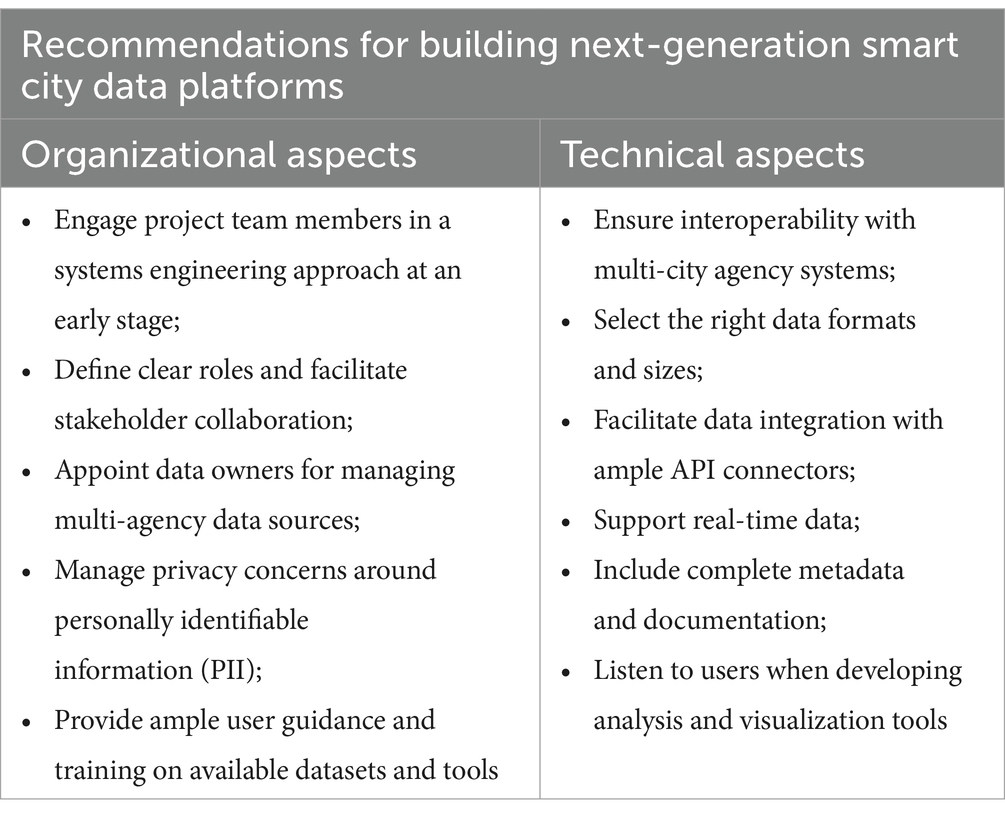
Table 4. Recommendations for future smart city data platform implementation.
Although smart city data platforms can help integrate data from different city domains and bridge existing silos, project teams must consider various technical challenges.
• Ensure interoperability with multi-city agency systems.
In Columbus, about 90% of municipal authorities use Esri-based GIS technology. The failure to ensure good compatibility between the SCOS and Esri software resulted in limited OS usage by several city authorities, thus contradicting the initial aim to provide a common operating picture. For future developments, we suggest federated data management to manage multi-agency access and sharing according to need and security and ensure available connections to systems currently used by future end users. This way, stakeholders can use the developed data platform from the beginning and do not need to change their licensed software for a new system.
• Select the right data formats and sizes.
At the beginning of the Smart Columbus project, the streaming data received from the transit operator, Central Ohio Transit Authority (COTA), providing real-time bus locations, was initially ingested into the SCOS in a misidentified format, requiring large amounts of computing power. Identifying the data format and estimated size is advisable to avoid bottlenecks in future development. While some data types are more accessible, as programming scripts, such as Python, can quickly convert JSON or CSV files, other data types, e.g., PDF files, require more advanced steps, resulting in a longer response time.
• Facilitate data integration with ample API connectors.
The Smart Columbus project team offered a data curator self-service interface. However, some agencies had to enter data programmatically due to lacking support for their formats and types (The City of Columbus, 2021b). Future implementations must ensure several data input options, such as by creating standardized REST API connectors to avoid city authorities having to integrate different datasets individually and programmatically. If local and regional transit providers agree to upload their data, e.g., on busses, subways, and trains, they must receive proper guidance and documentation, thus impacting the project’s success.
• Support real-time data.
The SCOS could have included more real-time datasets, which would have improved the stakeholders’ use of the data (The City of Columbus, 2021b), including weather, traffic, road status information, and images using REST API services from the Ohio Department of Transportation (ODOT). Different city domains can benefit from collected real-time data. Emergency services require dynamic data as incidents change frequently, and responders must have an up-to-date picture of the current city’s condition. City stakeholders require air quality measurements to assess potential intervention actions and monitor wellbeing. Traffic managers use traffic information to understand the current situation on the network.
• Include complete metadata and documentation.
Much of the data available in the SCOS has been integrated without associated metadata. According to post-project evaluations, stakeholders did not find the data useful due to a lack of understanding of the data. While data curators had to spend time curating the data, they first audited datasets of higher priority, i.e., stakeholders had to wait for metadata of specific datasets. We suggest data repositories with associated data management plans for future deployments that provide a comprehensive overview of which datasets are used and for what purpose. Thus, metadata describing different data attributes can help stakeholders understand individual variables, ensure sustainable project development, and increase the project’s success, even if the people responsible may have already left the organization.
• Listen to users when developing analysis and visualization tools.
Post-project evaluations show that stakeholders in the Smart Columbus project critiqued the SCOS’s difficulty level. Reports describe stakeholders’ opinions to simplify the chosen graphical interface (The City of Columbus, 2021b). We recommend asking future system users for feedback from an early project stage for future deployments to ensure that the datasets and visualizations meet the user requirements. Ultimately, the data platform must be designed so that many users can interact with it and retrieve the necessary information. A user guide documenting the individual map elements and examples of common case studies and queries can help users analyze data and create compelling visualizations.
The UK Observatories secured funding from various sources, including academic grants and local government support. The Department for Environment, Food, and Agriculture (DEFRA), Department for Transport (DfT), and local authorities directly funded air quality studies, data management, and other measures, such as COVID-19 social distance monitoring. The SCOS was funded through a federal grant from the Smart Cities Challenges, supplemented by private-sector partnerships. Still, its primary funder, USDOT, had a stringent five-year time limit for what it considered a demonstration program.
There is not likely to be a one-size fits all funding and financing model. In addition to significant initial investment, diverse funding structures are recommended to support consistent support and ensure longevity. If observatories rely only on project-based funding, they may be inflexible and thus limited in their long-term stability. The starting point should always be to have a clear value proposition with a purpose and vision for the platform that helps identify users, develop use cases and applications, and grow opportunities that add value. In doing so platform developers should seek to develop a resilient, multi-user model, including a mix of public and private funding sources for the initial set-up, deployment, and maintenance costs, covering renewal and upkeep for a successful long-term application at city scale. Different approaches might range from entirely free at the point of use with costs covered by local government and service providers (e.g., transport companies). An alternative could be a subscription-based model whereby different users pay for different levels of access and analysis, e.g., everybody might have basic access to data for a nominal fee, while data analysis might be provided for a higher subscription and bespoke services provided for specific users.
A further recommendation is to form a governance board with representatives from different stakeholder groups who will take ownership of the smart data platform and ensure regular stakeholder feedback for a long-term duration. A strong governance team can increase the chance of securing funding through continuous city stakeholder engagement by demonstrating how the smart city data platform benefits their specific areas. Such considerations of sustainable funding should begin at the earliest stages of platform planning so that they can be part of the systems engineering.
Another major difference between the two cases, is the role of large consulting firms as vendors in the case of Smart Columbus. Indeed, the vendor that developed the operating system is one of the largest consulting firms in the world, both in terms of revenue and the number of global employees. A different consulting vendor ran multiple other Smart Columbus projects and viewed itself as an overall owner’s representative for the city while also serving the needs of the primary funder (Interviews). A third consulting company- also one of the largest in the world- helped to reorient the initiative when it foundered in its visioning early on. By contrast, development of the UK Observatories has relied more on university expertise and local partnerships, without the involvement of such consulting firms.
Yet it is unlikely that a university, alone or in conjunction with only the government, could develop and sustain a truly transformative smart city management platform. Thus, we expect some role for a wide range of organizations, including NGO, academic, government and the private sector. Consultancy and technology firms bring expertise and innovation in sensor and community technologies, data analytics and software, and practical smart city experience, and importantly the capacity to scale and transfer wherever they operate.
However, as our SCOS case study showed, community members can be skeptical of the sheer size of contracts awarded to consulting firms compared to unclear benefits to the community. At Smart Columbus, the vendor awarded the contract for the operating system invested in a large office near the city center, which supported the economic development goals of the overall initiative. However, such investments may not do much for more deprived neighborhoods in aspiring smart cities. The best approach for future platforms is to ensure the product is both sustainable and beneficial to community members and to find ways to articulate those benefits to community stakeholders. Such clear benefits were lacking in the case of Smart Columbus, where the operating system vendor walked away with ample new expertise and control over a potentially valuable open-source repository, while the community ended up with no lasting functional platform after the program’s end.
While the UK Observatories have found enduring success in enabling research, their use in day-to-day management has been limited. In the case of SCOS, with no dedicated research owner, the platform was wholly dependent on use by Columbus city agencies. When such utilization did not sufficiently materialize, the platform was left without funding to continue. However, both case studies fall short of fully transforming city management through their platforms.
Future smart city data platforms should foster real use by and collaboration between local authorities, researchers, and communities and address various issues of interest, including climate change, decarbonization, and electric transport. City services spanning different city areas can bring together researchers from currently fragmented and isolated departments to work together on these urban problems and provide different analytical use cases to urban stakeholders:
• Traffic managers can analyze travel times and incident patterns and share this information with citizens through social media.
• Transport providers can use information on current transport parameters, such as traffic volume, to optimize their services, reducing people’s reliance on private vehicles.
• Emergency services can use real-time weather, transport, and incident data for their operational response, such as finding alternative routes to an incident.
• Infrastructure providers can identify city areas vulnerable to different types of incidents to make decisions about investing in future flood protection and infrastructure improvements.
• City councils can perform air quality and transport analysis to inform policy decisions and implement car-free zones in highly visited areas.
• Community groups are empowered to lobby local officials for change through access to data that enables them to monitor issues of local concern, often air quality and traffic related.
Linking data across these domains can also create a data ontology, capturing knowledge for different smart city services. When designing the data ontology for a future system, we suggest gathering data from different themes related to the Sustainable Development Goals.
This paper examines the technical implementation and deployment of the Smart Columbus Operating System (SCOS), which served as a shared platform from various city domains in Columbus to identify challenges and better inform future smart city initiatives. We draw on a literature review, project completion reports, a subsequent project evaluation, and key informant interviews to identify how stakeholders were determined and involved in the design of the SCOS, how data was collected and included in the platform, and what challenges were encountered in the SCOS development. We then provide a comparative analysis of the UK Observatories, using their openly accessible platforms, including that of Newcastle upon Tyne. Based on a review of project materials, including stakeholder interviews, we made recommendations for how smart city platforms can be improved and take into account lessons and innovations from SCOS and the UK Urban Observatories.
To help tackle urban challenges and support the United Nations SDGs 11 and 13, cities can use smart city data platforms to integrate data from traditional siloed domains. Examples include so-called “Urban Observatories” which use a large-scale sensor network to collect data about different city areas, such as weather, water, transportation, population, infrastructure, health, and business. By using these data to monitor the environment and the condition of various assets and infrastructure in near real-time, these smart city data platforms can contribute to sustainable city improvement and resilience management and bridge existing data silos across the wider city. Although stakeholders can access these datasets through direct downloads or REST API services, they must first transform the data before incorporating it into smart city applications and use it during decision-making. Building platforms beyond a “living laboratories” research model means involving multiple city stakeholders and datasets from different domains to create an integrated, common data platform.
Using Columbus, Ohio (US) as an example, we evaluated the technical implementation challenges of the Smart Columbus Operating Systems, part of the U.S.DOT-awarded Smart City Challenge. While the entire project aimed to roll out advanced smart technology, supporting apps, and focus on underrepresented communities, the SCOS, in particular, was the technical backbone for the individual projects under the Smart Columbus umbrella. SCOS fell short of finding a utility in city management that would allow it to access the funding to continue to operate. The UK studies have mainly been utilized in research projects, providing value to universities and only have a few initial practical applications. However, they all have had successful implementation models that have resulted in enduring smart city data platforms and can be made valuable to local authorities. The existence of a long-term funding plan and a commitment from a network of universities are also critical factors. The absence of a committed long-term funder at the start of the project was also a factor in its ultimate demise and formed a key difference between the Observatories and SCOS.
Although no existing platform is wholly satisfying, the different examples in this paper demonstrated several key lessons to improve the deployment of smart city platforms elsewhere in the UK, USA and worldwide, including organizational and technical key aspects. To ensure project success from an organizational perspective, we suggest a rigorous project methodology from the early start of the project. Project teams must have clearly defined roles and responsibilities within the team, as well as a well-established leadership and governance board with representatives from different stakeholder groups, ensuring ownership of the platform can help increase the success of smart city project implementations. While we suggest considering sustainable funding and financial planning resources, we highlight the importance of responsibly selecting consulting firms and vendors with the community benefit in mind. Smart city platforms must provide a clear value proposition to their users, highlighting tangible benefits from successful case studies on solving urban challenges. When selecting the technical components for a smart data platform, different aspects can impact the choice of software, such as open or proprietary software, cloud technology and GIS providers, available budget for potential licensing costs, access to software, and scalability. Smart city data platforms must support flexible and scalable technology stacks to handle increased data volumes and changing stakeholder needs in the future. With different stakeholders in mind acting as future end users, urban data platforms must ensure interoperability with other existing systems. Overall, we recommend continuous stakeholder engagement involving local authorities, city officials, businesses, and residents through regular outreach and workshops for increased user adoption of the future system and technical capacity building.
By reflecting on these challenges and successes in deploying different smart city platforms, we offer practical advice and experience to other cities on the funding, technical, engagement, and governance aspects when implementing projects of similar scale.
The original contributions presented in the study are included in the article/supplementary material, further inquiries can be directed to the corresponding author.
The studies involving humans were approved by The Ohio State University Office of Responsible Research Practices (Study number: 2021E0052). The studies were conducted in accordance with the local legislation and institutional requirements. The ethics committee/institutional review board waived the requirement of written informed consent for participation from the participants or the participants’ legal guardians/next of kin because of the study being of minimal risk to research subjects, and by not collecting personal identifiers of research subjects.
KW: Methodology, Visualization, Writing – original draft, Writing – review & editing, Conceptualization, Data curation, Formal analysis, Investigation, Project administration. JS: Conceptualization, Methodology, Writing – original draft, Writing – review & editing, Data curation, Formal analysis, Investigation, Project administration. HM: Methodology, Writing – review & editing, Conceptualization. RD: Supervision, Writing – review & editing, Conceptualization. JPM: Supervision, Writing – review & editing, Conceptualization. PB: Supervision, Writing – review & editing, Conceptualization. JM: Supervision, Writing – review & editing, Conceptualization.
The author(s) declare that financial support was received for the research and/or publication of this article. This work was supported by the United Kingdom’s Engineering and Physical Sciences Research Council (EPSRC) Centre for Doctoral Training in Geospatial Systems under grant number EP/S023577/1, the Ordnance Survey of Great Britain, the Research Hub for Decarbonised Adaptable and Resilient Transport Infrastructures (DARe) funded by the EPSRC and the UK Department for Transport (EP/Y024257/1), and the STEAM Factory at The Ohio State University Interdisciplinary Postdoctoral Research Program.
The authors declare that the research was conducted in the absence of any commercial or financial relationships that could be construed as a potential conflict of interest.
The authors declare that no Gen AI was used in the creation of this manuscript.
All claims expressed in this article are solely those of the authors and do not necessarily represent those of their affiliated organizations, or those of the publisher, the editors and the reviewers. Any product that may be evaluated in this article, or claim that may be made by its manufacturer, is not guaranteed or endorsed by the publisher.
Bibri, S. E. (2019). The anatomy of the data-driven smart sustainable city: instrumentation, datafication, computerization and related applications. J. Big Data 6, 1–43. doi: 10.1186/s40537-019-0221-4
Cecílio, J., Caldeira, F., and Wanzeller, C. (2018). CityMii-an integration and interoperable middleware to manage a Smart City. Proc. Comput. Sci. 130, 416–423. doi: 10.1016/j.procs.2018.04.062
Chen, L., Grimstead, I., Bell, D., Karanka, J., Dimond, L., James, P., et al. (2021). Estimating vehicle and pedestrian activity from town and city traffic cameras. Sensors 21:4564. doi: 10.3390/s21134564
Clement, J., Manjon, M., and Crutzen, N. (2022). Factors for collaboration amongst smart city stakeholders: a local government perspective. Gov. Inf. Q. 39:101746. doi: 10.1016/j.giq.2022.101746
Cranfield Urban Observatory (2024). Living Laboratory. Available online at: https://www.livinglab.ac.uk/sensor.html (accessed September 17, 2024).
Deshpande, P. (2019). “Predictive and prescriptive analytics in big-data era,” in Computing, Communication and Signal Processing: Proceedings of ICCASP 2018 (Singapore: Springer), 123–132.
EPRSC (2017). Details of Grant. Available online at: https://gow.epsrc.ukri.org/NGBOViewGrant.aspx?GrantRef=EP/P016782/1 (accessed May 17, 2024).
Huang, H., Yao, X. A., Krisp, J. M., and Jiang, B. (2021). Analytics of location-based big data for smart cities: opportunities, challenges, and future directions. Comput. Environ. Urban. Syst. 90:101712. doi: 10.1016/j.compenvurbsys.2021.101712
James, S. (2007). The art of agile development: Pragmatic guide to agile software development. O’Reilly Media.
James, P., Das, R., Jalosinska, A., and Smith, L. (2020). Smart cities and a data-driven response to COVID-19. Dialogues Hum. Geography 10, 255–259. doi: 10.1177/2043820620934211
James, P., Jonczyk, J., Smith, L., Harris, N., Komar, T., Bell, D., et al. (2022). Realizing Smart City infrastructure at scale, in the wild: a case study. Front. Sust. Cities 4:767942. doi: 10.3389/frsc.2022.767942
Kaarbo, J., and Beasley, R. K. (1999). A practical guide to the comparative case study method in political psychology. Polit. Psychol. 20, 369–391. doi: 10.1111/0162-895X.00149
Keast, L., Bramwell, L., Maji, K. J., Rankin, J., and Namdeo, A. (2022). Air quality outside schools in Newcastle upon Tyne, UK: an investigation into NO2 and PM concentrations and PM respiratory deposition. Atmosphere 13:172. doi: 10.3390/atmos13020172
Kitchin, R. (2014). The real-time city? Big data and smart urbanism. GeoJournal 79, 1–14. doi: 10.1007/s10708-013-9516-8
Li, S., Dragicevic, S., Castro, F. A., Sester, M., Winter, S., Coltekin, A., et al. (2016). Geospatial big data handling theory and methods: a review and research challenges. ISPRS J. Photogramm. Remote Sens. 115, 119–133. doi: 10.1016/j.isprsjprs.2015.10.012
Li, D., Shan, J., Shao, Z., Zhou, X., and Yao, Y. (2013). Geomatics for smart cities-concept, key techniques, and applications. Geo-spat. Inf. Sci. 16, 13–24. doi: 10.1080/10095020.2013.772803
Manchester Urban Observatory (2024). Manchester-i. Available online at: https://manchester-i.com/home (accessed September 17, 2024).
Marrone, M., and Hammerle, M. (2018). Smart cities: a review and analysis of stakeholders’ literature. Bus. Inf. Syst. Eng. 60, 197–213. doi: 10.1007/s12599-018-0535-3
Marshall, A. (2021). America’s ‘Smart City’ Didn’t get much smarter. Available online at: https://www.wired.com/story/us-smart-city-didnt-get-much-smarter/ (accessed August 18, 2023).
McLean, D. (2021). 6 questions with smart Columbus on lessons since program’s conclusion. Available online at: https://www.smartcitiesdive.com/news/smart-columbus-ohio-smart-city-challenge-winner-lessons-learned/607999/ (accessed August 18, 2023).
Mora, L., Bolici, R., and Deakin, M. (2017). The first two decades of smart-city research: a bibliometric analysis. J. Urban Technol. 24, 3–27. doi: 10.1080/10630732.2017.1285123
Nam, T., and Pardo, T. A. (2011). “Conceptualizing smart city with dimensions of technology, people, and institutions,” in Proceedings of the 12th Annual International Digital Government Research Conference: Digital Government Innovation in Challenging Times, 282–291.
Newcastle City Council (2020). Our Newcastle Our Future Net Zero Newcastle – 2030 Action Plan. Available online at: https://www.newcastle.gov.uk/sites/default/files/Climate%20Change/Net%20Zero/Net%20Zero%20Newcastle%20-%202030%20Action%20Plan_0.pdf (accessed September 17, 2023).
Newcastle Urban Observatory (2024). Urban Observatory. Available online at: https://newcastle.urbanobservatory.ac.uk/ (accessed September 17, 2023).
Parnell, G. S., Driscoll, P. J., and Henderson, D. L. (2011). Decision making in systems engineering and management. New York, NY: John Wiley & Sons.
Perera, C., Zaslavsky, A., Christen, P., and Georgakopoulos, D. (2014). Sensing as a service model for smart cities supported by internet of things. Trans. Emerg. Telecommun. Technol. 25, 81–93. doi: 10.1002/ett.2704
Raghavan, S., Simon, B. Y. L., Lee, Y. L., Tan, W. L., and Kee, K. K. (2020). “Data integration for smart cities: opportunities and challenges,” in Computational Science and Technology: 6th ICCST 2019, Kota Kinabalu, Malaysia, 29–30 August 2019, 393–403.
Rusli, N., Ling, G. H. T., Hussain, M. H. M., Salib, N. S. M., Bakar, S. Z. A., and Othman, M. H. (2023). A review on worldwide urban observatory systems' data analytics themes: lessons learned for Malaysia Urban Observatory (MUO). J. Urban Manage. 12, 231–254. doi: 10.1016/j.jum.2023.04.004
Sánchez-Corcuera, R., Nuñez-Marcos, A., Sesma-Solance, J., Bilbao-Jayo, A., Mulero, R., Zulaika, U., et al. (2019). Smart cities survey: technologies, application domains and challenges for the cities of the future. Int. J. Distrib. Sensor Netw. 15:155014771985398. doi: 10.1177/1550147719853984
Sarwat, A. I., Sundararajan, A., Parvez, I., Moghaddami, M., and Moghadasi, A. (2018). “Toward a smart city of interdependent critical infrastructure networks” in Sustainable interdependent networks: From theory to application. eds. A. M. Madni and F. Blaabjerg (Cham: Springer International Publishing), 21–45.
Smart City Challenge Demonstration (2019). Quarterly Report: 2019 2nd Quarter. Available at: https://d2rfd3nxvhnf29.cloudfront.net/2019-08/SCC-A-Quarterly_Progress_Report-19Q2-v2.pdf (Accessed August 1, 2024).
SMRT Cities Columbus: Segment 4 (2019a), Organized Discussion Notes. Available at: https://github.com/UrbanOS-Examples/TechnicalWorkingGroupSegment4/blob/master/SMRT%20Cities%20Columbus%20IDEA%20Matrix.pdf (Accessed August 1, 2024).
SMRT Cities Columbus: Segment 4 (2019b), Prioritization Discussion. Available at: https://github.com/UrbanOS-Examples/TechnicalWorkingGroupSegment4/blob/master/SMRT%20Cities%20Columbus%20Capabilities%20V2.xlsx (Accessed August 1, 2024).
SMRT Columbus (2024a). Smart Columbus project data. Available online at: https://web.archive.org/web/20211208201227/https://data.smartcolumbusos.com/api/v1/data_json (accessed August 1, 2024).
SMRT Columbus (2024b). Smart Columbus project data. Available online at: https://web.archive.org/web/20220124012049/https://www.smartcolumbusos.com/project-data (accessed August 1, 2024).
Stehle, S., and Kitchin, R. (2020). Real-time and archival data visualisation techniques in city dashboards. Int. J. Geogr. Inf. Sci. 34, 344–366. doi: 10.1080/13658816.2019.1594823
The City of Columbus (2021a). Columbus Climate Action Plan. Available online at: https://www.columbus.gov/files/sharedassets/city/v/1/utilities/sustainability/cap/columbus-climate-action-plan_final.pdf (accessed March 17, 2024).
The City of Columbus (2021b). Smart Columbus - Final Report for the Smart Columbus Demonstration Program. Available online at: https://d2rfd3nxvhnf29.cloudfront.net/2021-06/SCC-J-Program-FinalReport-Final-V2_0.pdf (accessed October 17, 2022).
UK Ministry of Housing, Communities and Local Government (2021). How Busy is Toon. Available online at: https://www.localdigital.gov.uk/funded-project/how-busy-is-toon/ (accessed April 17, 2023).
UN-Habitat (2020). Urban Observatories. Available online at: https://data.unhabitat.org/pages/urban-observatories (accessed July 18, 2024).
United Nations (2015a). Make cities and human settlements inclusive, safe, resilient and sustainable. Available online at: https://sdgs.un.org/goals/goal11 (accessed July 18, 2024).
United Nations (2015b). Take urgent action to combat climate change and its impacts. Available online at: https://sdgs.un.org/goals/goal13 (accessed July 18, 2024).
Warren, B. (2021). Final Report Released as Smart City 2021. Available online at: https://columbusunderground.com/final-report-released-as-smart-columbus-challenge-comes-to-an-end-bw1/ (accessed August 18, 2024).
WHO (2010). Hidden cities: Unmasking and overcoming health inequities in urban settings. Geneva: World Health Organization.
Wolf, K., Dawson, R. J., Mills, J. P., Blythe, P., Robson, C., and Morley, J. (2023). Assessing the impact of heavy rainfall on the Newcastle upon Tyne transport network using a geospatial data infrastructure. Resilient Cities Structures 2, 24–41. doi: 10.1016/j.rcns.2023.07.001
Keywords: Smart City, smart data platform, resilient city, urban data management, Urban Observatory
Citation: Wolf K, Stiles J, Miller HJ, Dawson RJ, Mills JP, Blythe P and Morley J (2025) Building enduring smart city data platforms to provide urban management support: lessons learnt from UK Urban Observatories and the US Smart Columbus Operating System. Front. Sustain. Cities. 7:1512847. doi: 10.3389/frsc.2025.1512847
Edited by:
Muhammad Tauhidur Rahman, The University of Texas at Dallas, United StatesReviewed by:
Ali Sarrafi Nik, Islamic Azad University, Central Tehran Branch, IranCopyright © 2025 Wolf, Stiles, Miller, Dawson, Mills, Blythe and Morley. This is an open-access article distributed under the terms of the Creative Commons Attribution License (CC BY). The use, distribution or reproduction in other forums is permitted, provided the original author(s) and the copyright owner(s) are credited and that the original publication in this journal is cited, in accordance with accepted academic practice. No use, distribution or reproduction is permitted which does not comply with these terms.
*Correspondence: Kristina Wolf, S3Jpc3RpbmEud29sZkBuZXdjYXN0bGUuYWMudWs=
Disclaimer: All claims expressed in this article are solely those of the authors and do not necessarily represent those of their affiliated organizations, or those of the publisher, the editors and the reviewers. Any product that may be evaluated in this article or claim that may be made by its manufacturer is not guaranteed or endorsed by the publisher.
Research integrity at Frontiers
Learn more about the work of our research integrity team to safeguard the quality of each article we publish.