 Fabio Bermejo
 Juan Cabello2
94% of researchers rate our articles as excellent or good
Learn more about the work of our research integrity team to safeguard the quality of each article we publish.
Find out more
ORIGINAL RESEARCH article
Front. Sustain. Cities, 26 March 2025
Sec. Urban Energy End-Use
Volume 7 - 2025 | https://doi.org/10.3389/frsc.2025.1505477
The article focuses on developing a methodology for energy diagnostics in intermediate Colombian municipalities as an initial stage for implementing a Municipal Energy Management System. The study is conducted in the municipality of Sabanalarga during the period from 2010 to 2022. The methodology consists of four key steps: the socioeconomic characterization, energetic supply-side analysis, energetic demand-side analysis, and assessment of energy performance indicators for effective energy planning. The results indicate that, although agriculture is the primary driver of the local economy, the transportation and residential sectors are the largest energy consumers. Lower-income residents, who have limited access to modern energy services, consume less electricity per capita compared to higher-income residents. In rural areas, lower-income households primarily rely on firewood for cooking. Additionally, due to the low level of industrialization, both energy and power intensity fall below the national average. To support municipal authorities in making informed decisions, the development of a municipal energy management system is essential.
Supporting the energy demand in cities is increasingly gaining significance because of the ongoing urban expansion and population growth (Cai et al., 2022). The importance of the energy demand is further stressed by the instability of energy costs in the global market, the risk to energy security, and the introduction of climate change mitigation strategies. Additionally, cities account for over 80% of energy-related greenhouse gas emissions (Suab et al., 2016). Currently, over half of the global population resides in urban areas, with projections to keep increasing until 2050 and to further contribute to higher GHG emissions (Yazdanie and Orehounig, 2021).
Notably, around 70% of the population in Colombia lives in urban areas, mainly in large cities (DANE, 2019). In total, urban areas in Colombia account for 87% of national electricity consumption (Superservicios, 2020) and 97% of the use of natural gas (Superintendencia de Servicios Publicos Domiciliarios, 2021). In total, large municipalities (Inh > 100,000) account for over 60% of the Colombian population (DANE, 2019), some 65% of the Gross Domestic Product (DANE, 2021), and 60% of the electricity consumption (UPME, 2020). Moreover, intermediate municipalities (20,000 < inh < 100,000), characterized by a low urbanization ratio, account for 24% of the population and 26% of the electricity consumption. However, regardless of the significance of municipalities for energy consumption, no energy management strategies to improve energy efficiency are considered (UPME, 2022). Without tools for energy management and planning in intermediate municipalities in Colombia, this research aims to fill this gap by implementing a methodology for energy diagnosis as an initial stage in developing a municipal energy management system (MEMS).
MEMS can improve performance by focusing on energy efficiency, conservation, and renewable energy sources (Denis and Parker, 2009). To this end, municipal authorities in different countries successfully used Energy Management Systems (EMS) (Jekabsone et al., 2020), which reduces energy consumption and its costs while mitigating GHG emissions (Pochtovyuk et al., 2021). Furthermore, while EMS primarily focuses on improving energy efficiency, ISO 50001 permits considering using renewable energy sources within the EMS (Kaselofsky et al., 2021). Implementing EMS at the municipal scale is an emerging area that needs further research and development (Dzene et al., 2015; Jekabsone et al., 2020). Municipalities need EMS considering local conditions and possible synergic energy systems (Dhakal, 2009). Generally, urban areas concentrate the energy consumption, while rural areas have a greater availability of renewable energy sources. Intermediate municipalities in Colombia can benefit from developing a coordinated local energy management framework between its urban and rural areas (Ren et al., 2014).
Although the government in Colombia implemented policies to promote energy efficiency (Cabello et al., 2020) and renewable energy (Cabello et al., 2019; Mendoza et al., 2021), there are no adequate strategies for intermediate municipalities in urban and rural areas (Duque et al., 2021; UPME, 2021a, 2022). Currently, the main initiative addressing municipal energy management has been the implementation of the “Energetic City” in three large municipalities (i.e., a Switzerland management tool to promote the implementation of energy efficiency, renewable energy sources, and green mobility projects in municipalities) (Swisscontact, 2021). Regardless of the importance of intermediate municipalities for energy consumption in Colombia, there is no discussion on energy management at this level.
One main challenge to municipal EMS is highlighting the need to improve municipal energy performance. Therefore, the first step to promoting municipal EMS is the awareness of local authorities (Fenton et al., 2016). For the awareness of authorities, the local energy diagnostic is a convenient tool (Kurahassi, 2006; Soto et al., 2018) to assess the supply and demand sides for the residential, industrial, and service sectors and identify the critical factors of the end-use energy (Brandoni and Polonara, 2012a,b). Therefore, this study focuses on developing an EMS methodology for municipal energy diagnostics in intermediate Colombian municipalities. The methodology developed is implemented in the Sabanalarga municipality.
Municipal infrastructure provides high-energy consumer services (i.e., electricity, natural gas, and mobility). Thus, municipal energy management (MEM) has a significant potential to contribute to improving energy performance at the local and national scales (Schellong, 2016). Different projects improved municipal energy performance, making them more efficient, less costly, and sustainable (Jekabsone et al., 2020; Zhou et al., 2014). MEM focuses on short, medium, and long-term strategic planning for local energy needs (Brandoni and Polonara, 2012a,b; Sperling et al., 2011) and decrease the energy poverty in urban areas (Kim et al., 2016). Additionally, MEM stresses the importance of exploiting the renewable energy sources available, with several developed countries funding bottom-up renewable energy strategies (RES) to complement the national and regional renewable energy policies with municipal contributions (Visintainer et al., 2021). The implementation of MEM is projected to play a significant role because of its particular focus on renewable sources (Denis and Parker, 2009).
Currently, ISO 50001 is the most used standard to guide the implementation of an EMS toward holistic management of energy efficiency rather than isolated energy-saving measures (Cabello et al., 2021). While ISO-certificated EMS in companies is widespread globally, showing relevant results (Lobo and Maldonado, 2022), the few EMS-certified municipalities are mainly found in developed countries (Jekabsone et al., 2020). A project implemented in 28 European municipalities resulted in energy savings of over 10% 1 year after the ISO 50001 certification of the MEM system, which stresses the importance of promoting this approach (Kaselofsky et al., 2021).
The ISO 50001 standard establishes a general methodology to implement and operate EMS. The energy consumption in municipalities is located in the public sector and the residential, production, and service sectors (Dzene et al., 2015). Numerous stakeholders influence energy services in municipalities, while some economic, cultural, and social factors must be considered (Kostevsek et al., 2016). Generally, municipalities lack a specialized energy management administrative structure or organized energy data collection; thus, missing or insufficient data is one significant barrier to MEM (Jekabsone et al., 2020). Moreover, municipalities are suitable micro-units for implementing renewable energy microgrid systems (Burton and Hubacek, 2007).
Based on the importance of adequate guidance for implementing MEM (Beihmanis and Rosa, 2016) and the required precertification work (Kaselofsky et al., 2021), a four steps methodology was established before certification (Jekabsone et al., 2020):
1. Motivate municipal authorities to develop a MEM system. This phase starts with the energy diagnostic to characterize the municipal energy system and energy efficiency level.
2. Set MEM boundaries and goals.
3. Develop the MEM process planning.
4. Assess the implementation process, including communication between departments and other stakeholders.
Frequently, the energy diagnosis shows that energy consumption data is neither monitored nor analyzed. In other cases, energy management is implemented without a holistic view, inadequate data collection, and low transparency (Jekabsone et al., 2020).
The ISO 50001 standard focuses on assessing past and present energy consumption and use within the limits of the EMS (ISO, 2014). Therefore, the areas with significant energy consumption and the influencing parameters in the energy planning stage are identified (Soto et al., 2018). Regional energy diagnosis, frequently based on government data and reports, focuses on assessing the local energy supply and consumption in the different sectors (Brandoni and Polonara, 2012a,b; Martínez et al., 2020). The energy supply assessment includes the operation and plans of public and private companies, analyzing the current state of energy infrastructure, and estimating the renewable potential. Moreover, the demand side individually assesses the economic sectors (e.g., industry, transport, agriculture, residential, and public) to address their characteristics and needs, defining consumption patterns (Kostevsek et al., 2016). Usually, transportation management policies are discussed more during the MEM (Brandoni and Polonara, 2012a,b).
Frequently, municipal energy diagnosis is developed without implementing an energy data collection system or a MEM system (Kurahassi, 2006). However, for municipal energy diagnosis, the data available and its collection is essential for both top-down and bottom-up approaches (Jekabsone et al., 2020). When there is limited data availability, the top-down approach is more suitable, calculating energy data from the regional consumption share (e.g., per capita consumption and population, number of households) or energy audits and interviews. Local energy companies can provide data on electricity and natural gas consumption (bottom-up approach). Moreover, the use of oil derivatives for transport could be estimated as a proportional share of the regional consumption and the population (top-down approach). The bottom-up approach is adequate when implementing municipal energy data collection systems (Kostevsek et al., 2016).
In addition, municipal energy diagnostic is a fundamental tool for urban planning that seeks to mitigate the effects of zoned heat in island countries (Jung, 2024), decentralized planning of urban renewable energy systems (Quan et al., 2022), and establish urban constraints in multi-scale energy transitions (Traill and Cumbers, 2024).
Studies interconnecting architecture, infrastructure, and hybrid renewable energy systems (Ibrahim, 2024) include this tool for initial energy analysis (Kobi, 2023).
The energy balance involves the comprehensive bookkeeping of all energy flows entering, being generated, and exiting the municipality. Meanwhile, the energy diagnosis is aimed at establishing the interplay between energy and variables of an economic, social, political, environmental, and technological nature, among others (Gómez-Ceballos and Morán-Perafán, 2015). In this manner, the methodology employed in this research is primarily centered around the energy balance, followed by conducting a municipal energy diagnosis utilizing the quantified municipal information.
Various methodologies for conducting energy balances have been implemented in cities at both national and international levels. In the case of Colombia, there is limited research on these methodologies at the municipal level, energy balances are predominantly scaled at the national level (UPME, 2021b). Table 1 provides a comprehensive overview of the energy balance methodologies applied across various cities, illuminating their respective disadvantage in the context of their application within intermediary municipalities in Colombia. These methodologies share the common aspect of accounting for primary energy, secondary energy, external energy sources or imports, indigenous energy sources, their transformation, and final consumption. Drawing from this comparative analysis, the methodology to be adopted in the municipality of Sabanalarga (Atlántico) is chosen.
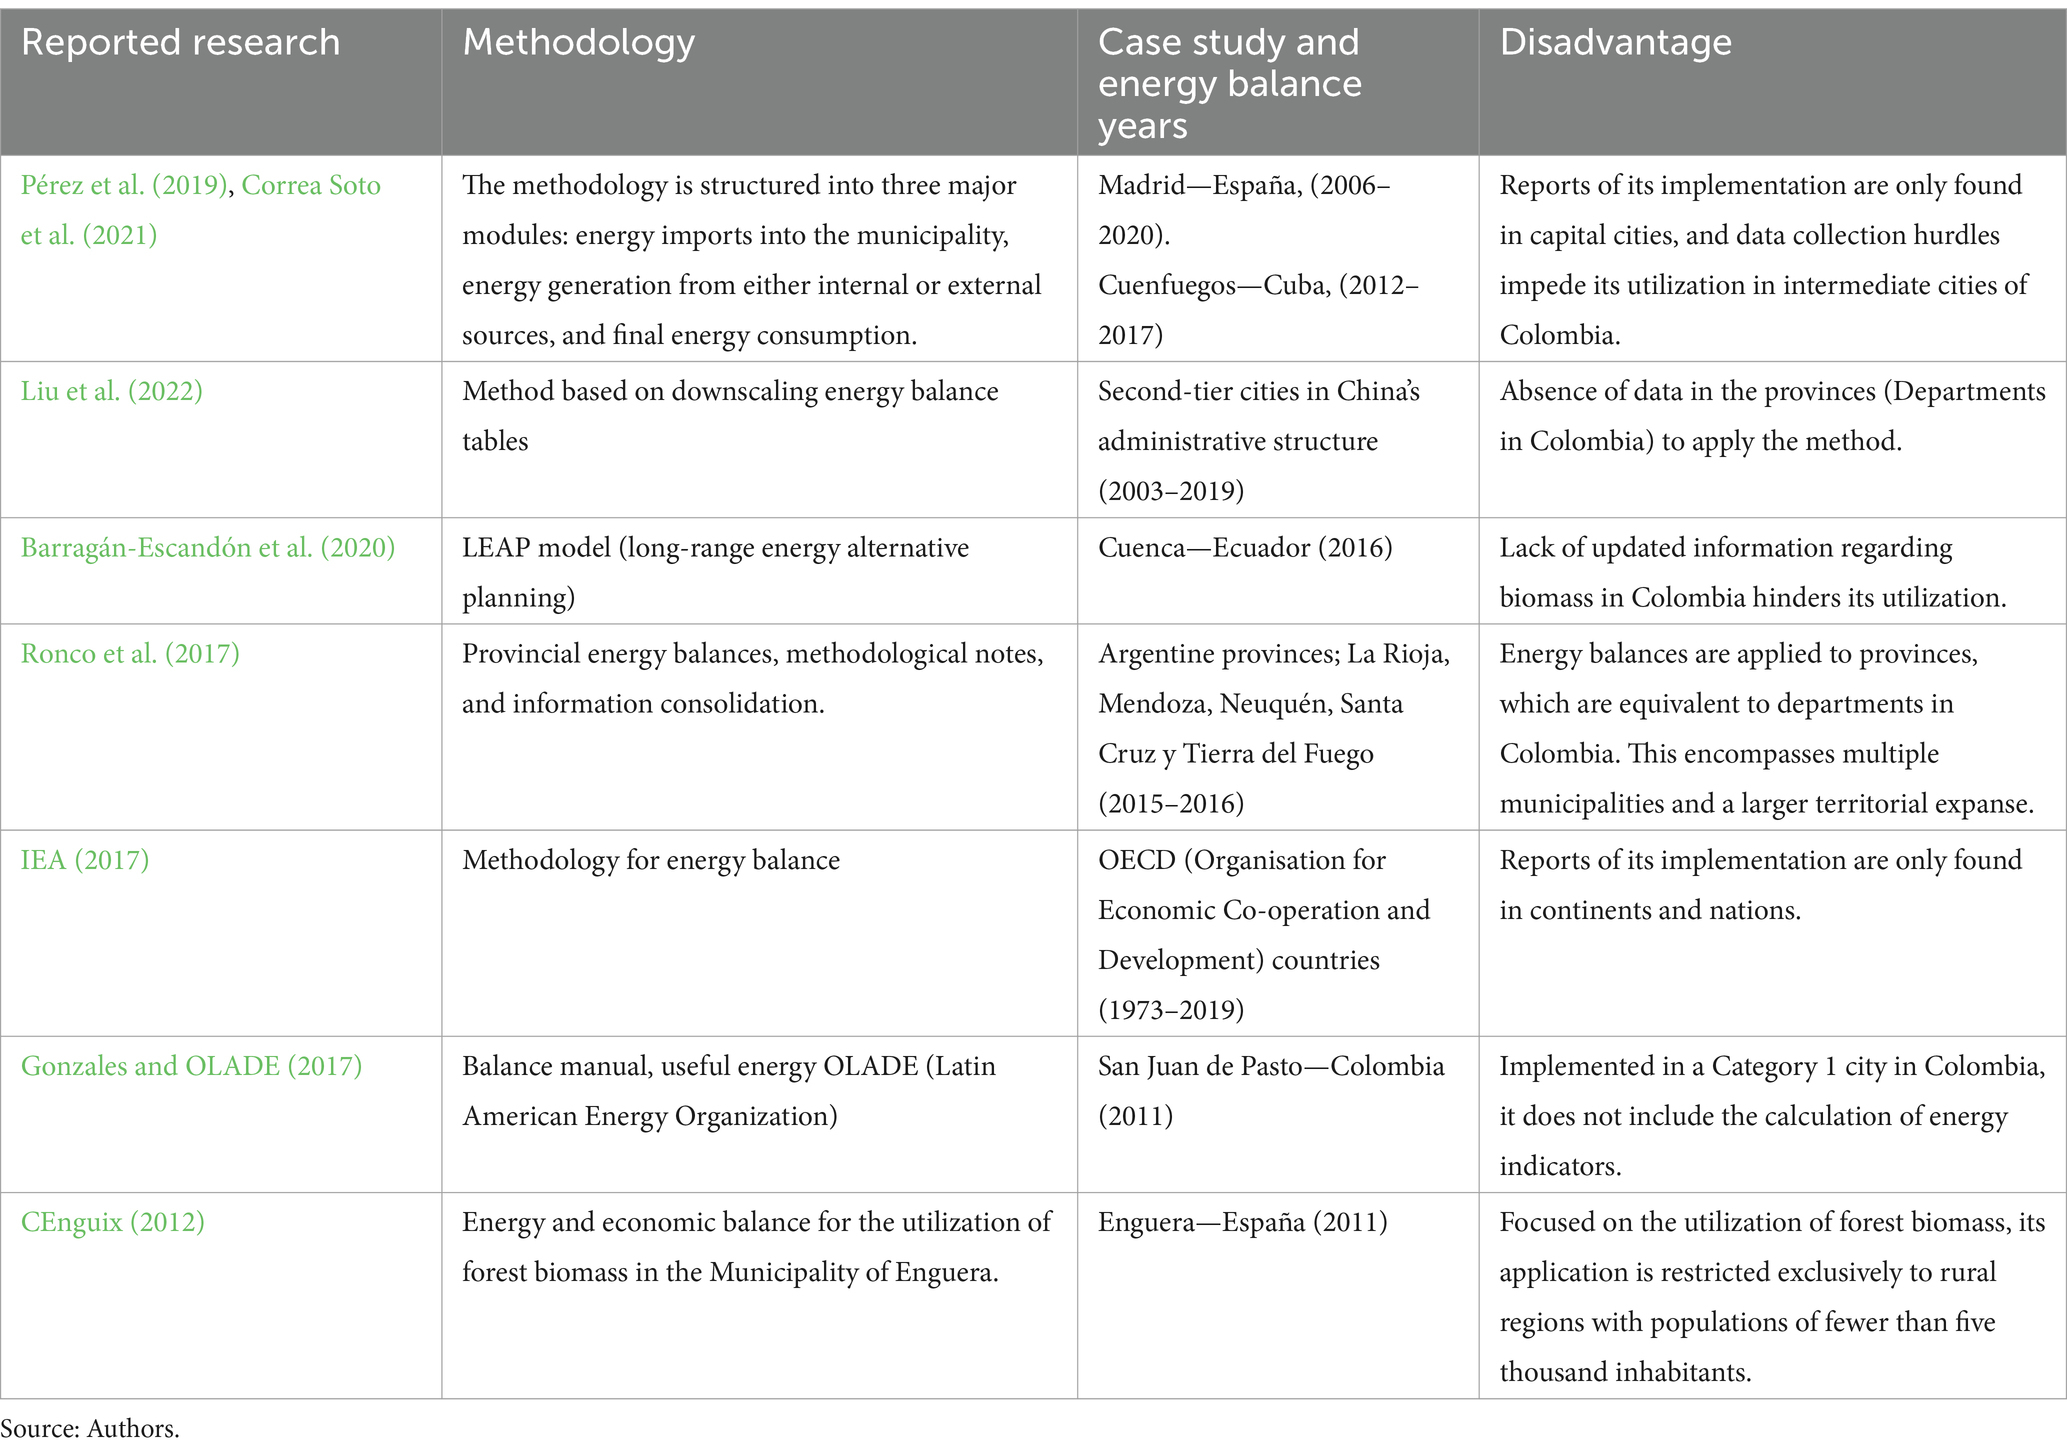
Table 1. Energy balance methodologies developed in cities.
After analyzing the energy balance methodologies presented in Table 1, the one proposed by OLADE (Latin American Energy Organization) was chosen, and it was implemented in the city of San Juan de Pasto—Colombia in 2011 (Gómez-Ceballos and Morán-Perafán, 2015), the criteria for this selection are as follows:
• Methodology applicable to Latin American cities, encompasses the generation of energy from primary sources, transformation, losses, and final consumption.
• It was implemented within a Colombian city, which, while not being an intermediary urban center, encapsulates the distinctive traits commonly found in municipalities of second and third tiers.
• The gathering of information is carried out through municipal databases, given that a significant portion of the data is not available within the state sector.
• Generate key data for the energy indicators of intermediate Colombian cities (see Figure 1).
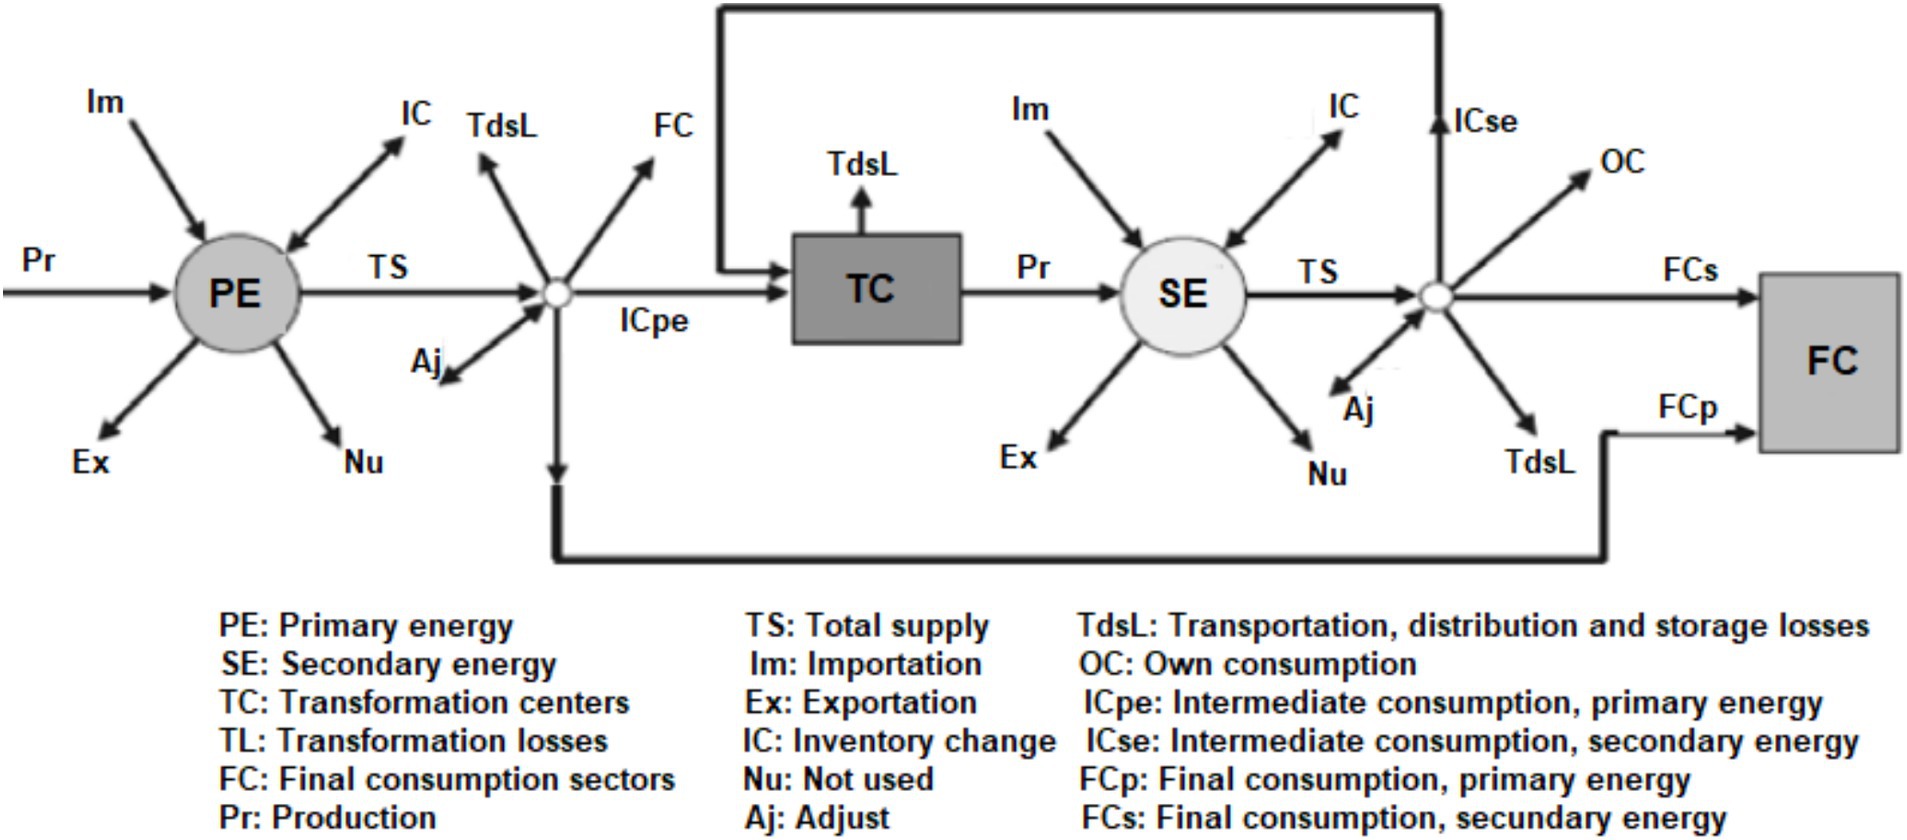
Figure 1. Energy flow for balancing (Source: Gonzales and OLADE, 2017).
The selected methodology uses the energy conservation principle to perform the energy balance. Applying this equation to primary energy, it can be derived that the overall supply is:
Where: TS: Total supply; Pr: Production; Im: Importation; IC: Inventory Change; Ex: Exportation; Nu: Not used.
The same equation is applied across secondary energy sources, transformation centers, and final consumption centers.
Leveraging data from municipal, departmental, state databases, as well as energy supplying enterprises, a comprehensive municipal energy balance was conducted for the timeframe spanning from 2010 to 2022. This endeavor was necessitated by the absence of energy-related records pertaining to the municipality for years predating 2010 (SUI, 2022; Manotas, 2020; SICOM, 2022; Gomez and UPME, 2019). This timeframe is adequate for conducting the diagnosis, as it not only falls within the ranges established by the methodologies implemented in Table 1, but also enables the identification of trends in energy consumption and indicators. These trends, in turn, will facilitate the execution of a comprehensive analysis.
The municipal energy diagnosis generates the input variables for the energy planning proposed by ISO50001 (2018). And it constitutes the initial stage of this phase for implementing a municipal energy management system as depicted in Figure 2.
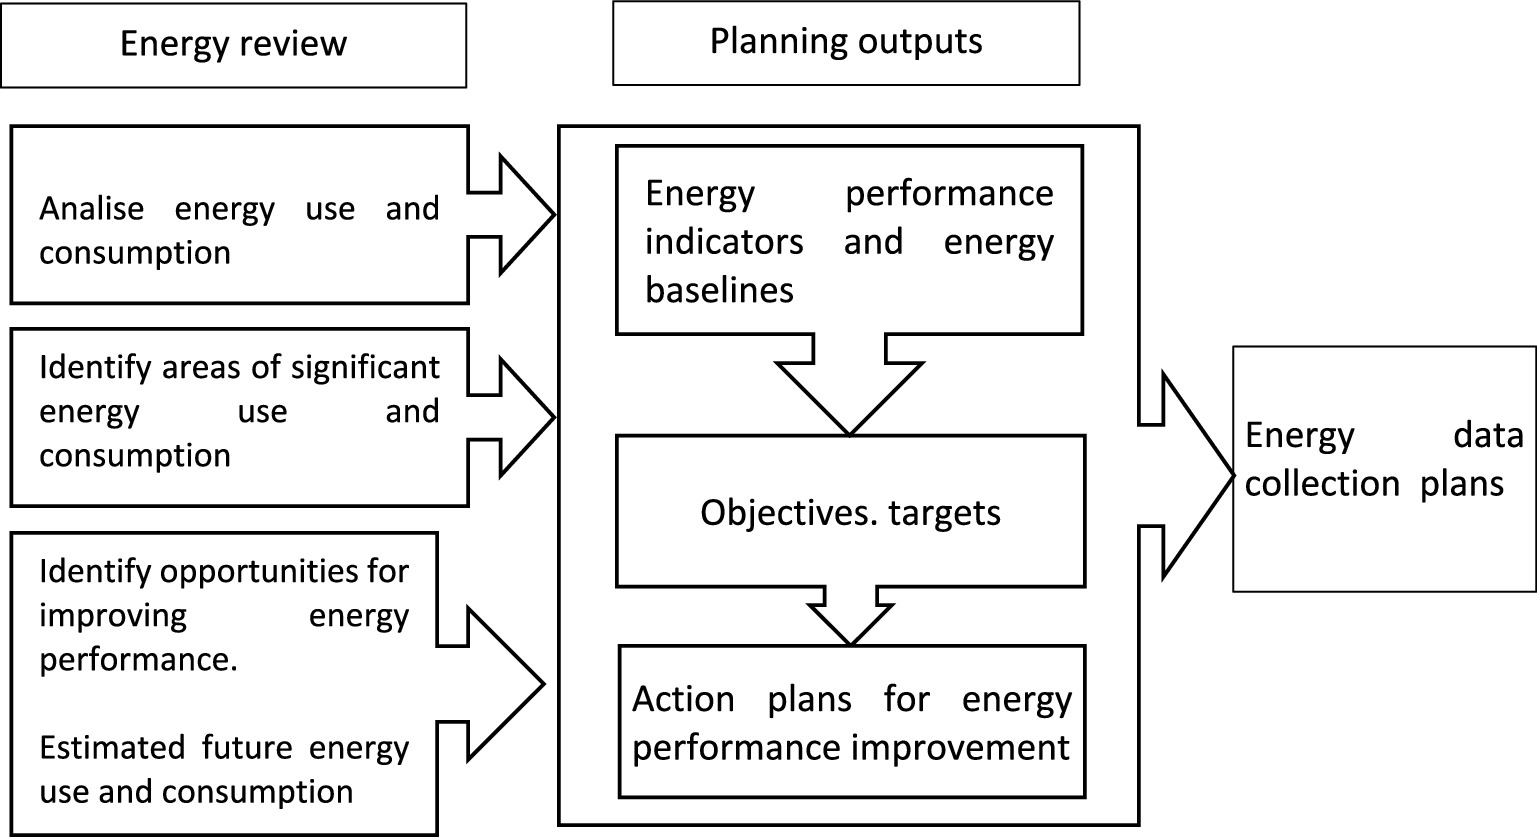
Figure 2. Energy planning (Source: adapted from ISO, 2011).
The diagnosis focuses on a preliminary view of the municipal energy system to highlight energy-saving opportunities and propose energy performance indicators. Two factors must be assessed in more detail: municipal energy sources and sectorial energy demand from each source. Energy sources can be identified by interviewing municipal authorities and energy stakeholders, assessing the municipal energy mix, companies, and the state of energy infrastructure, and estimating the renewable potential on the supply side (Kostevsek et al., 2016).
The dates and information used in this study is based on interviewing stakeholders and other actors, analyzing available data, and comparing to other studies (Kamenders et al., 2017; Beihmanis and Rosa, 2016; Brandoni and Polonara, 2012a,b; Correa et al., 2021; Dzene et al., 2015; Rad, 2010; Soto et al., 2018), and the current governmental energy policy in Colombia (UPME, 2022b):
1. Socioeconomic characterization:
a. Total population, urban population, and rural population in the municipality.
b. Share of the population by economic stratum.
c. Municipal and per capita GDP.
d. Share of the GDP by economic activity.
1. Supply-side analysis
a. Municipal energy mix (e.g., firewood, natural gas, electricity, and transport fuels).
b. Energy from non-conventional renewable energy sources.
1. Demand-side analysis
a. Annual energy consumption by economic sector and energy form (Natural gas, firewood, diesel, and gasoline).
b. Residential electricity consumption by economic strata in urban and rural areas.
c. Annual electricity consumption in urban and rural areas.
d. Annual residential natural gas consumption by economic strata in urban and rural areas.
2. Assessment of energy performance indicators and technologies.
a. Access to electricity.
b. Per capita electricity consumption.
c. Electricity consumption by sector.
d. Residential electricity consumption by strata in urban and rural areas.
e. Access to natural gas.
f. Per capita natural gas consumption by economic strata in urban and rural areas.
g. Firewood penetration.
h. Municipal energy intensity.
i. Sector energy intensity.
j. Energy technologies in the municipality.
Sabanalarga, with 414 km2 and 101,843 inhabitants, is a second-level municipality from the Atlántico department (i.e., the Colombian Caribe). The MGDP (municipal gross domestic product) in 2021 accounted for 842 MMCOP (i.e., around 224.5 MUSD) (DANE, 2023). The main economic activities are tertiary activities like commerce, public services, services (e.g., hotels, restaurants), banks, and transport. Historically, the municipality has been one leading supplier of agricultural products in the department; thus, agriculture, livestock breeding, and fishing are also important activities (Manotas, 2020). Moreover, although the industrial sector grew significantly during the last ten years, it remains a marginal contribution to the municipal economy.
Supplementary Table S1 presents the energy balance for the year 2022, conducted using the OLADE methodology (Gonzales and OLADE, 2017), which has previously been applied in the Colombian city of San Juan de Pasto (Gómez-Ceballos and Morán-Perafán, 2015). The energy balance covers the period from 2010 to 2022; however, for conciseness, only Supplementary Table S1 provides detailed data for 2022. Figure 3 illustrates the annual energy balance results over the entire study period.
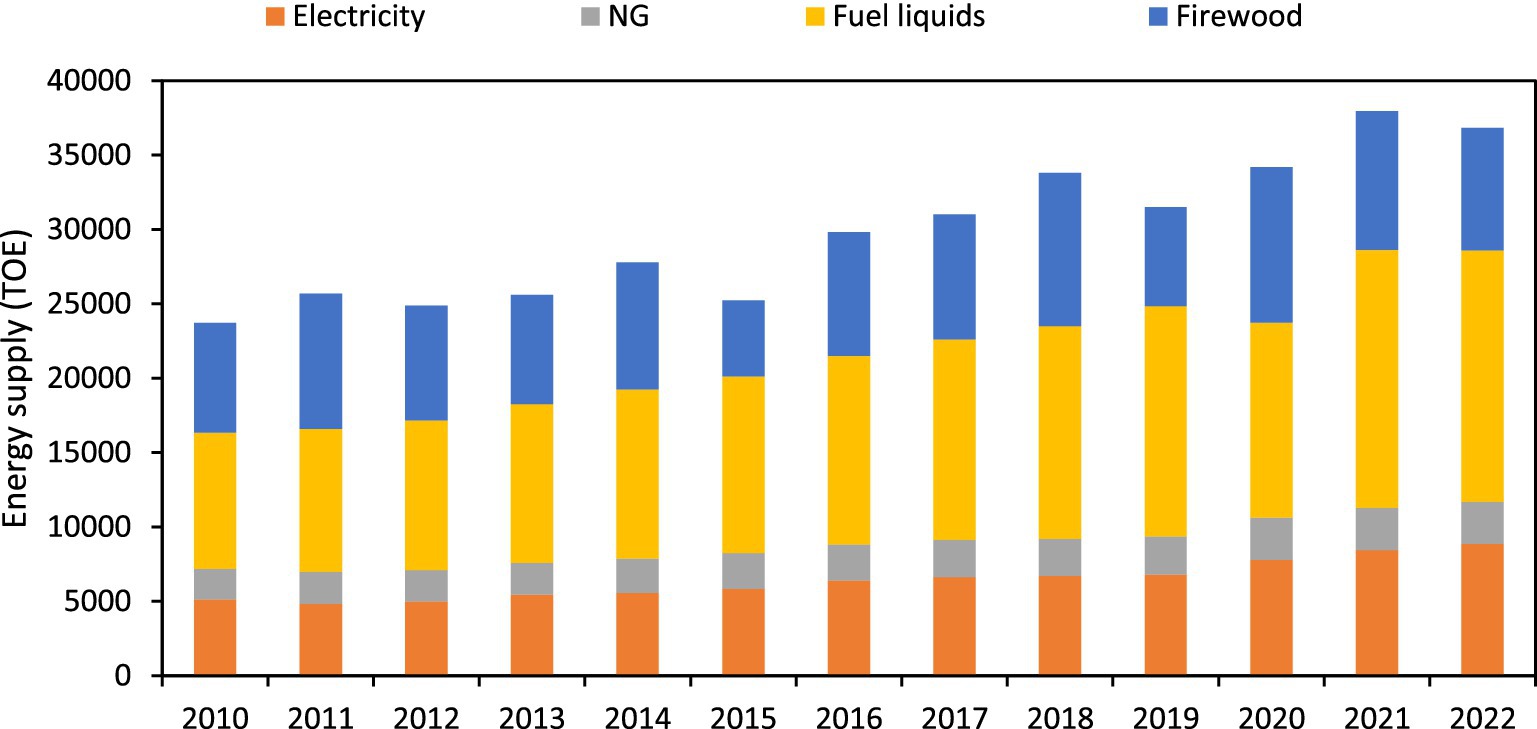
Figure 3. Supply energy mix in Sabanalarga (2010–2022) (Source: own elaboration with data from SUI, 2022; Unidad de Planeación Minero-Energética [UPME], 2021; SICOM, 2022; Minenergia, 2020; Manotas, 2020).
National and municipal databases were used in this study. Demographic data assess the total municipal population during the last years, classified into urban and rural inhabitants. In Colombia, the government stratifies households into six levels closely related to purchasing power (Gallego et al., 2014). Strata classification defines public service costs and the focus of government social policies (Bonilla et al., 2014). Therefore, stratification data was considered in the socioeconomic characterization.
Population growth is a significant diver of increasing energy consumption in urban and rural sectors. Figure 4 shows the evolution of the municipal population between 2010 and 2022.
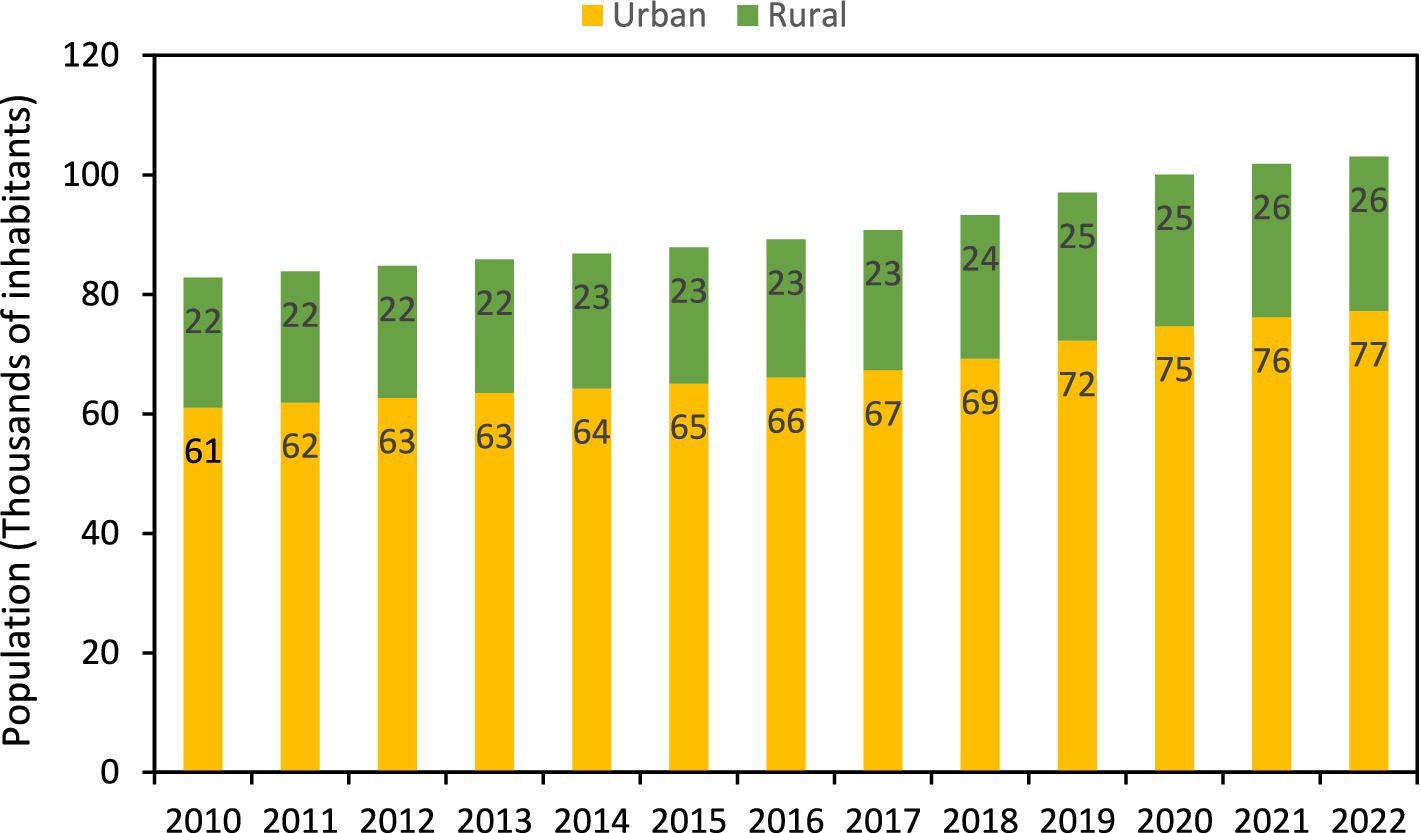
Figure 4. Evolution of the municipal population (Source: own elaboration with data from DANE, 2023).
In Sabanalarga, the urban population increased 24.8% between 2010 and 2022. The population growth rate has increased significantly since 2016 because immigrants from Venezuela settled in urban areas. Immigrants mainly select urban areas because there are more employment and economic opportunities. Contrasted, the rural population, with a lower impact from immigration, increased by 18% in the same period.
In Colombia, energy consumption varies significantly between strata, and reducing the electricity inequality between strata was highlighted as an important socioeconomic issue for human development (Cabello et al., 2022a,b). Therefore, the population distribution by strata in Colombia must be considered in the municipal energy diagnostic. In Sabanalarga 2022, 90% of the population resides in strata 1 and 2, higher than the national average of 66%. Furthermore, there are no strata 5 or 6 in the municipality (Manotas, 2020). This strata distribution highlights the need to increase the population’s well-being (Cabello et al., 2022b).
The municipal economic performance is characterized using the municipal gross product (MGP) (see Figure 5). Figure 5 shows the MGDP in Colombian pesos (COP) and USD.
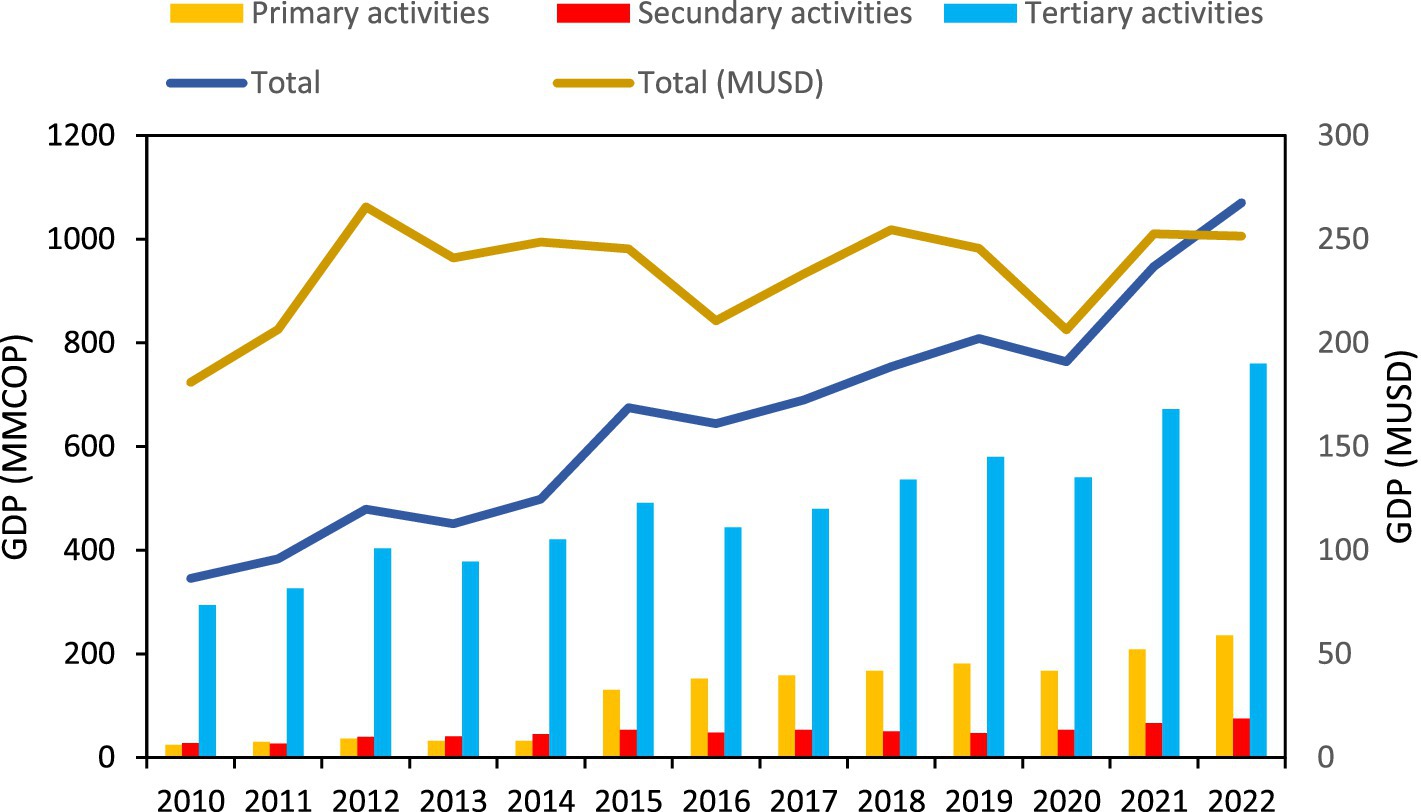
Figure 5. Evolution of the MGDP between 2010 and 2022 (Source: own elaboration with data from DANE, 2023).
Results show that while the MGDP in COP increased 144% from 345 to 842 million COP, measured in USD only increased 24% from 180.9 to 224.5 million USD. Sabanalarga accounts for 2% of the gross domestic product (GDP) of the department of Atlántico, which accounts for 4.5% of the national GDP. Tertiary activities (e.g., public services, commerce, hotels, restaurants, and transport) represent 70 to 85% of the MGDP. This MDPG distribution indicates a low development of industry (i.e., secondary activities). Moreover, primary activities (i.e., agricultural activities) have increased since 2015, primarily related to increased livestock production. The MGPpc in Sabanalarga is 42% of the Colombian GDP per capita of 5,800 USD in 2022 (Expansión, 2023) highlighting the low economic performance of the municipality.
The supply-side analysis must consider all energy sources with significant use in the municipality. At the intermediate municipal scale in Colombia, energy data collection is inefficient. Therefore, local data from national and regional reports were used (SUI, 2022; Unidad de Planeación Minero-Energética [UPME], 2021; SICOM, 2022; Minenergia, 2020; Manotas, 2020). This supply matrix was obtained from the energy balance for the period 2010 to 2022. Figure <italic>3</italic> shows the supply energy mix of Sabanalarga.
The energy mix shows that liquid fuels account for the highest energy supply in the municipality, mainly driven by public transport systems like motorcycles and inter-municipal diesel buses. Firewood for household cooking accounts for 20%–32% of the energy mix. Firewood use is explained by the limited access to natural gas in households. The electricity supply increased proportional to the population growth, while the natural gas supply increased at a lower rate during this period. These differences between electricity and natural gas consumption indicate that immigrants mainly depend on firewood for cooking.
The demand side assesses the yearly energy consumption from different sources by economic sector. Given the importance of electricity for welfare, the electricity consumption in households should be assessed in detail for urban and rural areas and the different strata (Cabello et al., 2022a).
Figure 6 shows the yearly electricity consumption by sector in Sabanalarga.
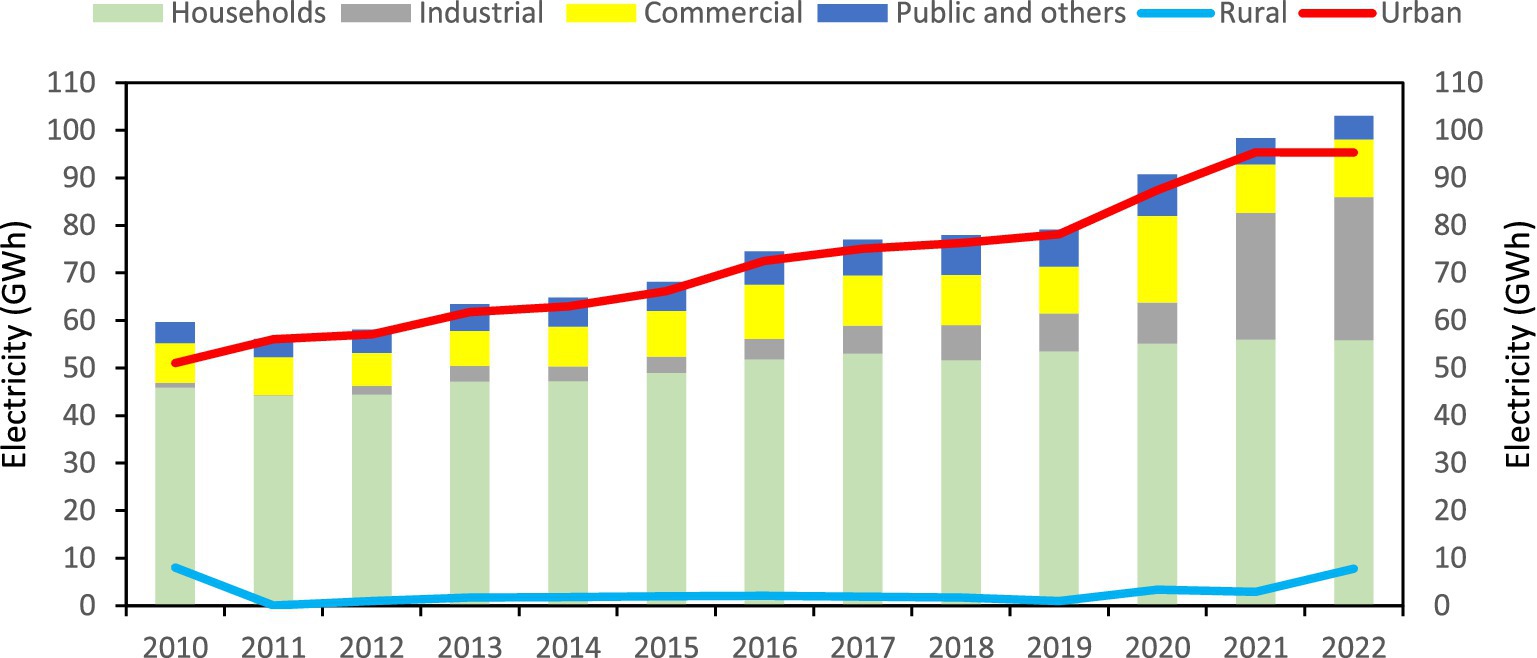
Figure 6. Electricity consumption by sector and area (2010–2022) (Source: own elaboration with data from SUI, 2022; Minenergia, 2020).
On average, household accounts for 66.4% of the electricity consumption, while the commercial sector uses 12.2%. Industry historically accounted for lower consumption and has increased the demand for electricity since 2016, evidencing rapid development. Rural areas, with 25% of the population, account for an average of 3% of the total electricity consumption. Poverty affecting access to electricity is the main reason for the low electricity consumption in rural areas. Similarly, in Colombia, rural areas accounting for 23.7% of the population represent 11% of electricity consumption (Cabello et al., 2022b).
Figure 7 shows the per capita electricity consumption in the residential sector.
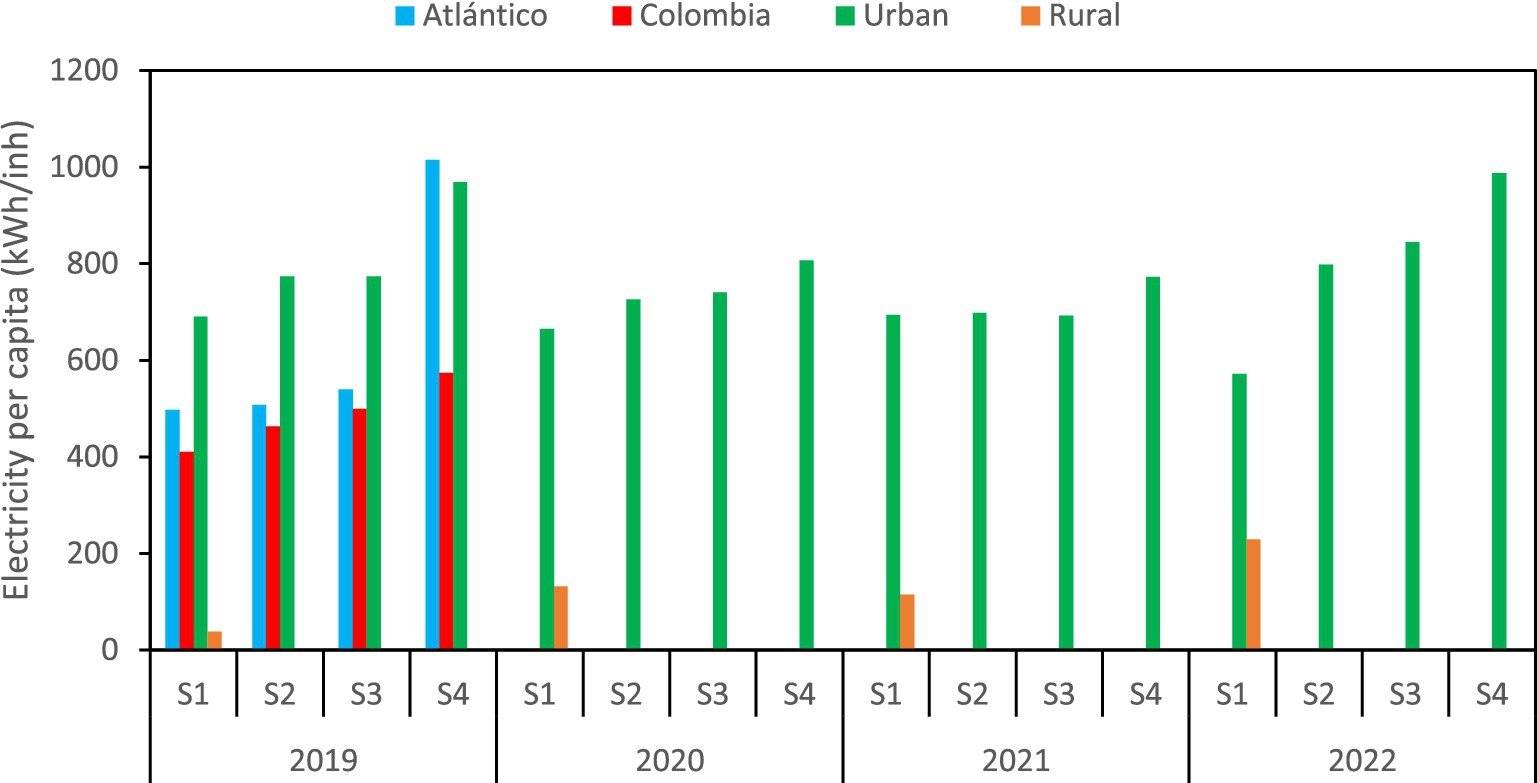
Figure 7. Residential electricity per capita by strata and area (2019–2022) (Source: own elaboration with data from SUI, 2022; Cabello et al., 2022b; Manotas, 2020).
The results show that strata 1 to 3 have a similar per capita, while on average, stratum 4 has a per capita 24.3% higher than stratum 1. Moreover, in rural areas, the electricity per capita averages 13.9% of the stratum 1 per capita in urban areas.
Except for strata 4, all strata exceed national and departmental per capita electricity consumption. It should be noted that the highest income households in the municipality and departmental are included in this stratum as there is no stratum 5 or 6. The typical climatic conditions of the tropic of the Colombian Caribbean coast influence this value to be above the national average, where air conditioning corresponds to the main consumption. Concerning the departmental value, the indicator is lower in strata 1, 2, and 3 because the departmental average includes its capital.
Figure 8 shows the municipal natural gas by sector and firewood households consumption.

Figure 8. Evolution of natural gas by sector and firewood households consumption (2010–2022) (Source: own elaboration with data from SUI, 2022; Minenergía, 2021; Gomez and UPME, 2019; DANE, 2023).
The residential sector accounts for an average of 90% of the consumption, mainly for cooking. Moreover, the commercial sector accounts for nearly 10%. Other sectors have a marginal demand.
Firewood consumption varied from 12 to 26 kt per year. Firewood is mainly used in rural areas, driven by the lack of access to natural gas or other cooking fuels. At the national level, firewood consumption accounted for 5,718 kt in 2019, whit a per capita of 114 kg (Gomez and UPME, 2019). Contrasted, the per capita consumption in Sabanalarga account for 169 kg, 30% higher than the national average. Countrywide, the use of firewood is reducing, yet the flow of illegal immigrants living in precarious conditions lacking access to electricity and clean cooking fuels is causing an increased use in the municipality. Firewood accounted for 20%–30% of the municipal energy mix. The traditional three-stone cooking fire causes estimated greenhouse gas emissions of 2,0347 tCO2/GJ. Additionally, pollutant emissions and deforestation driven by firewood affect human health and the environment. It is estimated that health consequences from firewood consumption account for 0.2% of the GDP in Colombia, mainly affecting women and children (Gomez and UPME, 2019).
Figure 9 shows the consumption of transport fuels between 2010 and 2020.
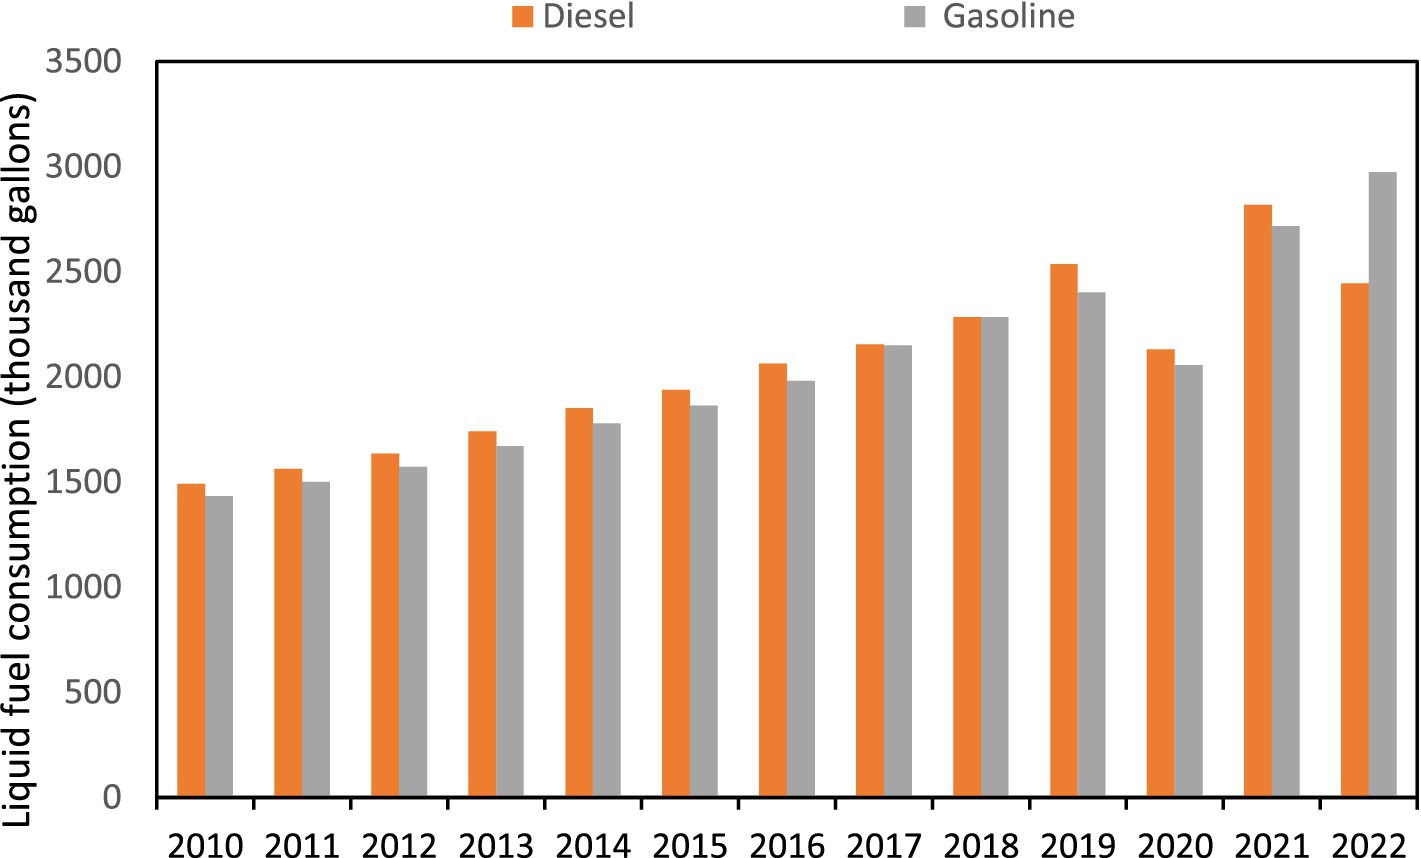
Figure 9. Evolution of transport fuel consumption (2010–2022) (Source: own elaboration with data from SICOM, 2022).
Fuel consumption increased by 89.1% between 2010 and 2021. In the municipality, transport is the only source demanding diesel and gasoline.
Public transportation stands as the highest consumer of liquid fuels in the municipality. In 2019, the intermunicipal diesel transport fleets included 26 buses, 9 minibuses, and 147 vans. Moreover, urban public transport was developed with 9,592 motorcycles, many of which are not legalized (Bermejo Altamar et al., 2022). In total, public transport accounts for 96% of the transport fuel consumption, while private vehicles account for 4% (Manotas, 2020; SICOM, 2022). There is no data available on the use of transport fuels in agriculture and industry, although based on the characteristics of these sectors, they have little influence on the use of transport fuels.
Two routes were considered evaluation of municipal energy performance:
1. Household energy consumption: the analysis is based on the electricity and natural gas coverage indexes and the per capita electricity and natural gas consumption in urban and rural areas and by strata.
2. Production and service sectors: the analysis is based on the yearly municipal and sectorial energy intensity.
Table 2 depicts the energy performance indicators considered during the energy diagnosis.
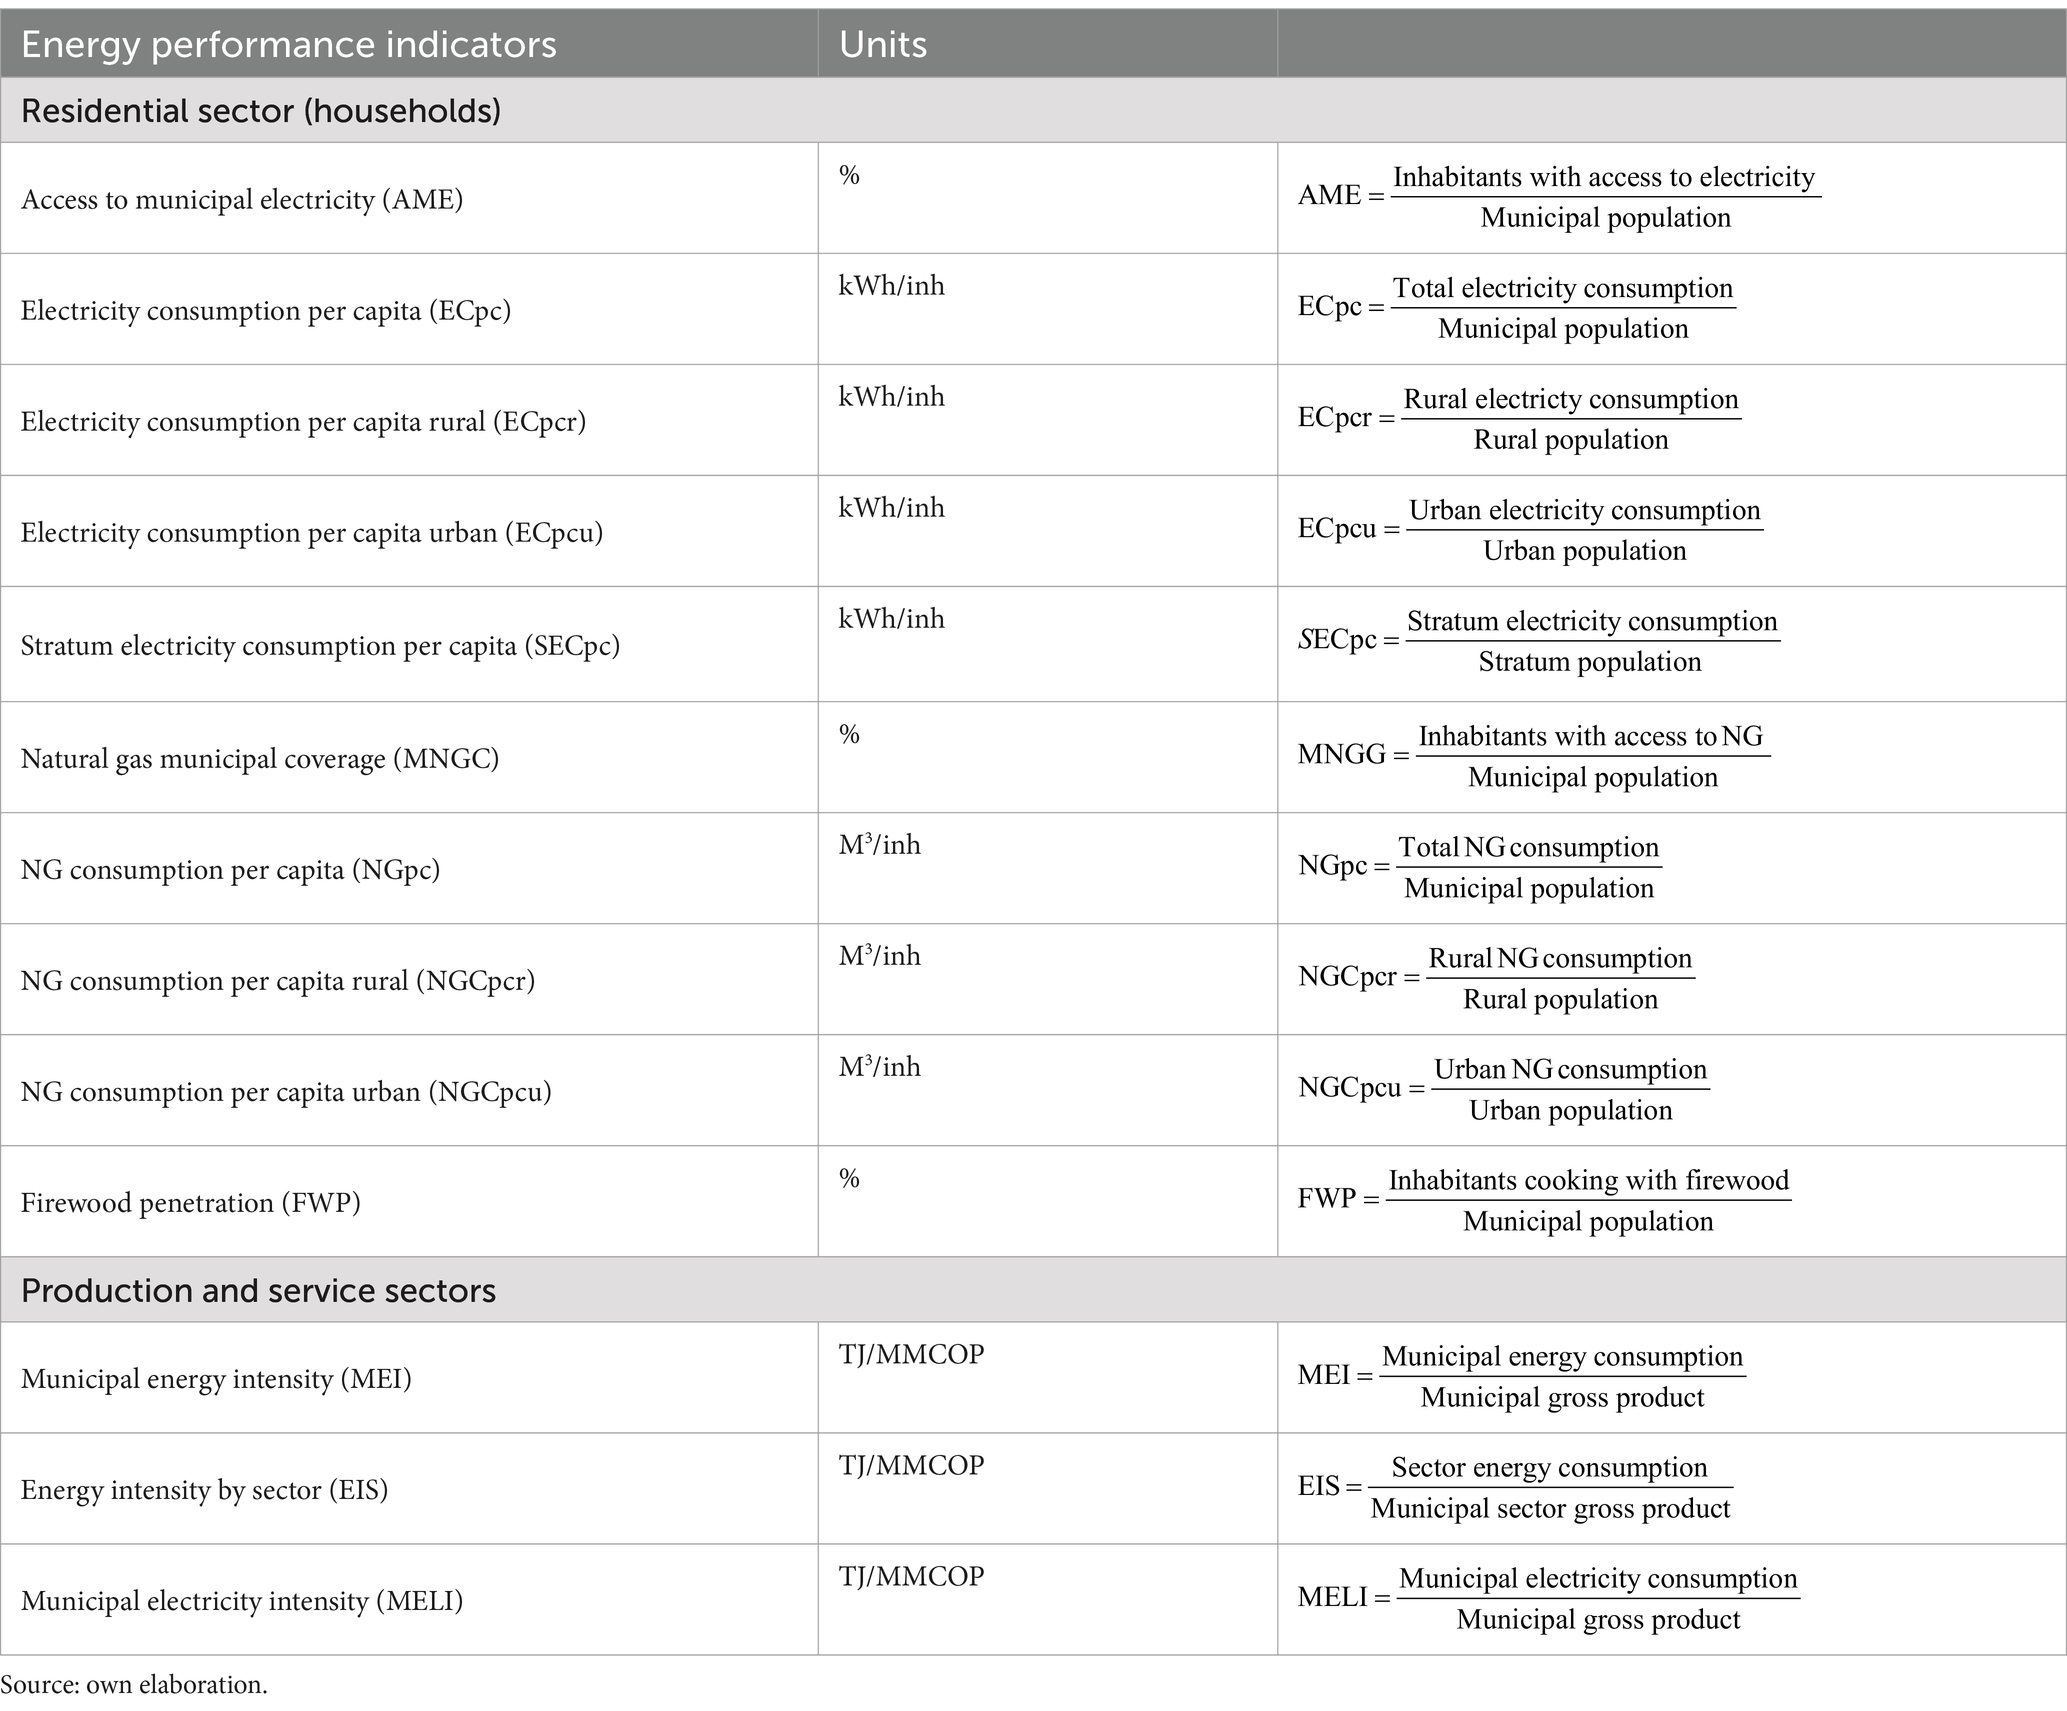
Table 2. Energy performance indicators.
Figure 10 shows the electricity and natural gas access in the municipality between 2010–2021 and the firewood penetration. Households using firewood are calculated as the difference between total municipal households and households using natural gas. In Sabanalarga, there is no distributor of LPG, and electricity and electric cooking appliances are too costly and are not used. Since there is no use of electric stoves (because of high electricity costs) or LPG (because of the lack of suppliers) (Manotas, 2020), firewood users in the municipality correspond to the difference between the total inhabitants and natural gas consumers.
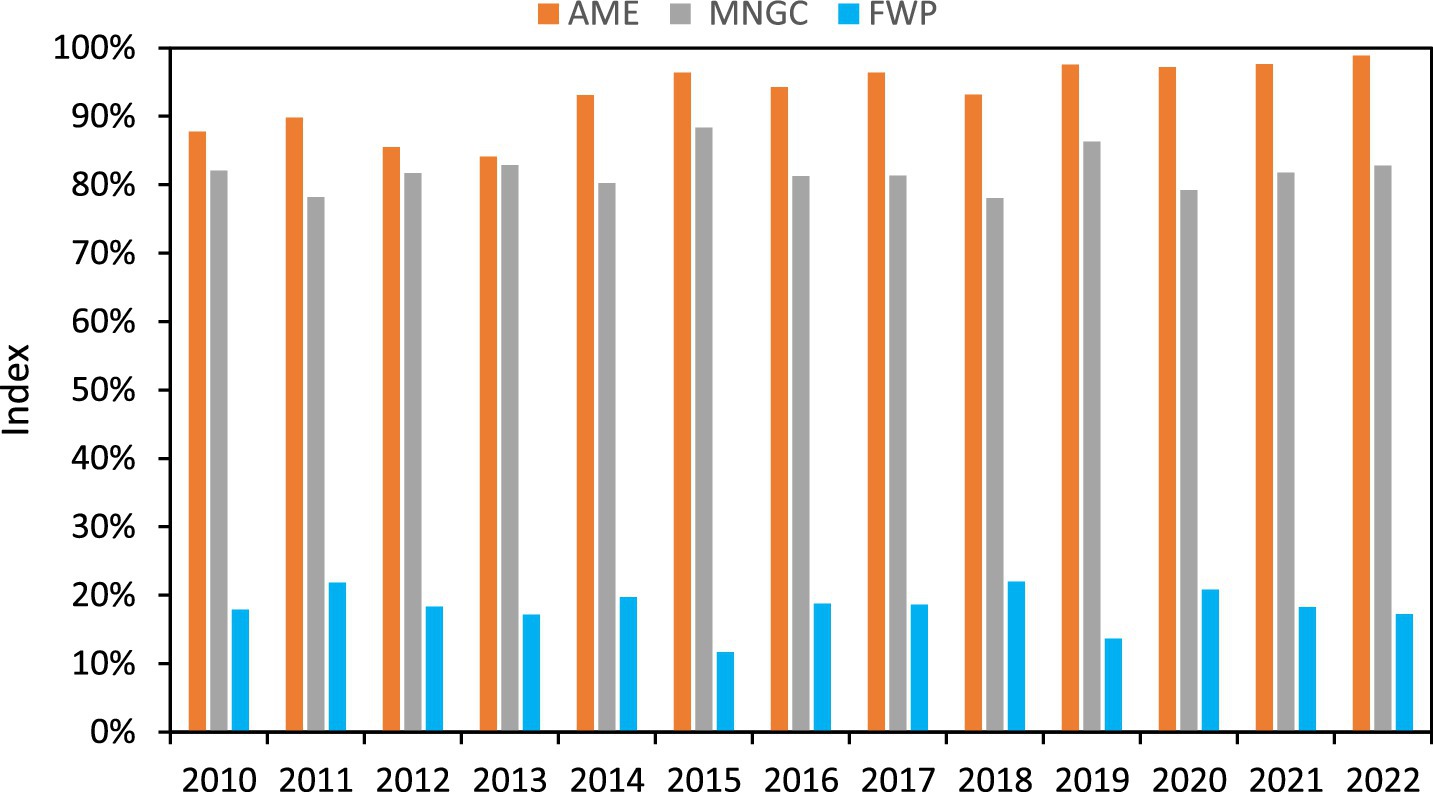
Figure 10. Evolution of access to municipal electricity (AME), natural gas municipal coverage (MGC), and firewood penetration (FWP) between 2010 and 2022 (Source: own elaboration with data from Minenergía, 2021; Gomez and UPME, 2019; DANE, 2023).
The figure shows that between 2010 and 2022, access to electricity increased from 87% to 98%. During the same period, access to natural gas remained relatively constant at around 82%. Firewood penetration reduced from 18% in 2010 to 12% in 2015 and increased to 17% in 2022. The increased firewood penetration is mainly explained by illegal immigration. Firewood consumption in the municipality sometimes has cultural and culinary foundations to cook some traditional plates, while in most cases is due to the lack of natural gas infrastructure in rural or immigrant illegally occupied areas.
Figure 11 shows per capita electricity consumption by area.
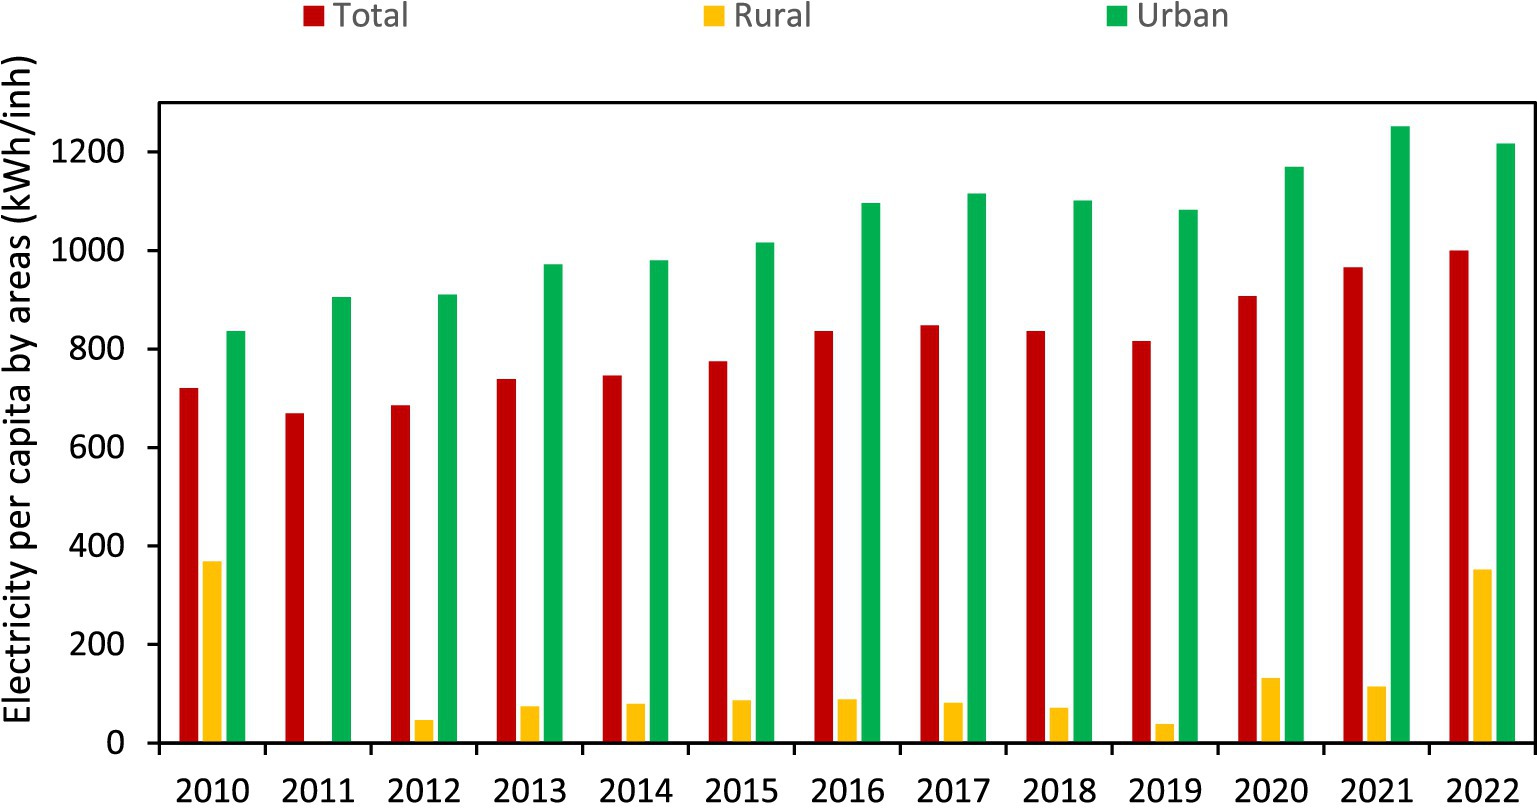
Figure 11. Yearly electricity per capita by areas (Source: own elaboration with data from SUI, 2022; Gomez and UPME, 2019; DANE, 2023).
Total electricity per capita increased from 721 in 2010 to 965 kWh in 2021. Particularly in urban areas, they were increased to 1,252 kWh in 2021. The higher per capita in 2021 is explained because, during COVID-19 confinement, the residential demand for electric appliances increased in stratum 4. In rural areas, the per capita is significantly lower, remaining under 115 kWh (the data from 2010 is an outlier with no correspondence with the situation in the municipality). In addition to poverty, rural areas are affected by poor-quality electricity and frequent blackouts that further impact electricity use.
Figure 12 shows the yearly per capita of natural gas by area.
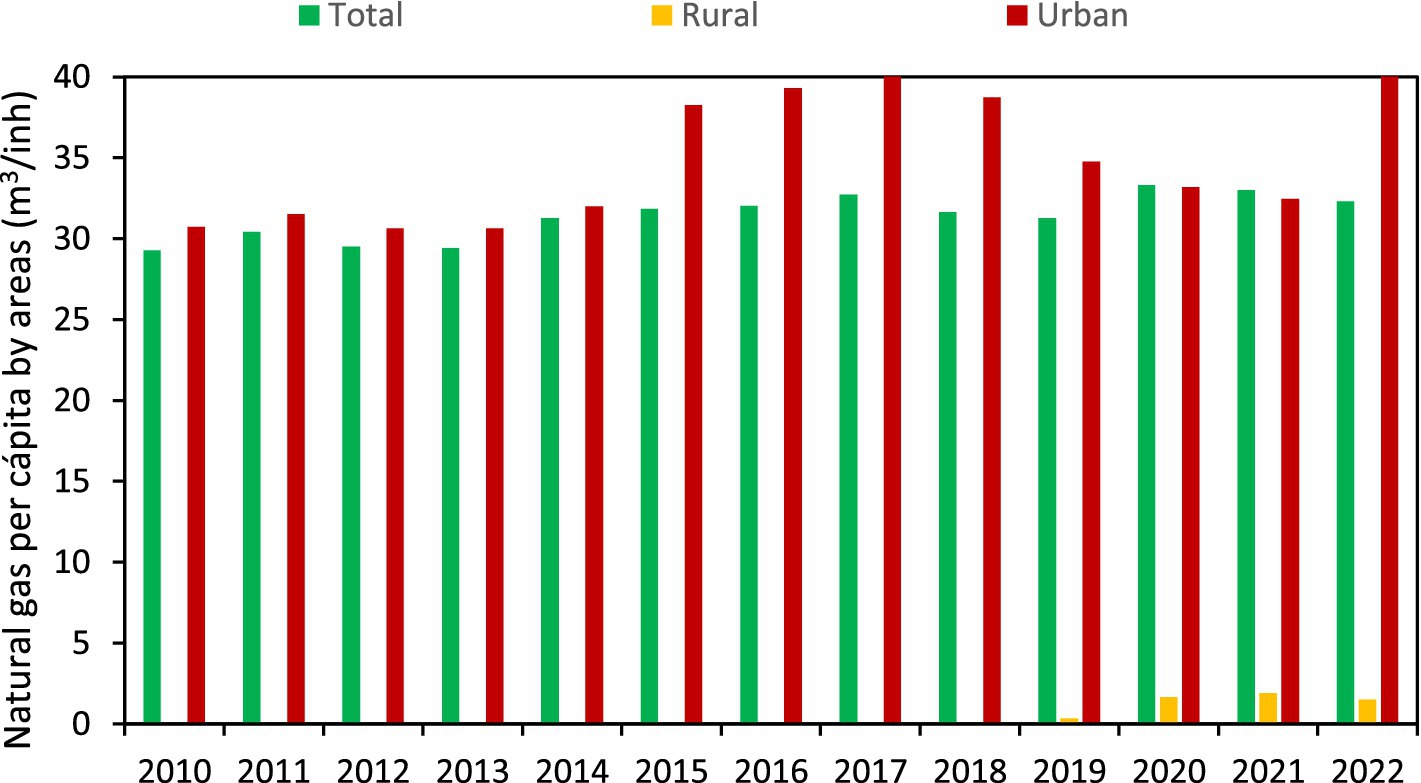
Figure 12. Evolution of the natural gas per capita in the municipality (Source: own elaboration with data from SUI, 2022; DANE, 2023).
The figure shows that natural gas consumption is concentrated in urban areas, highlighting that until 2019 there were no users in rural areas. Since 2010, the per capita in urban areas has varied between 35 and 41 m3. In contrast, rural areas have had from 1 to 5% of the per capita in urban areas since 2019.
Figure 13 shows the energy and electricity intensity in the municipality.
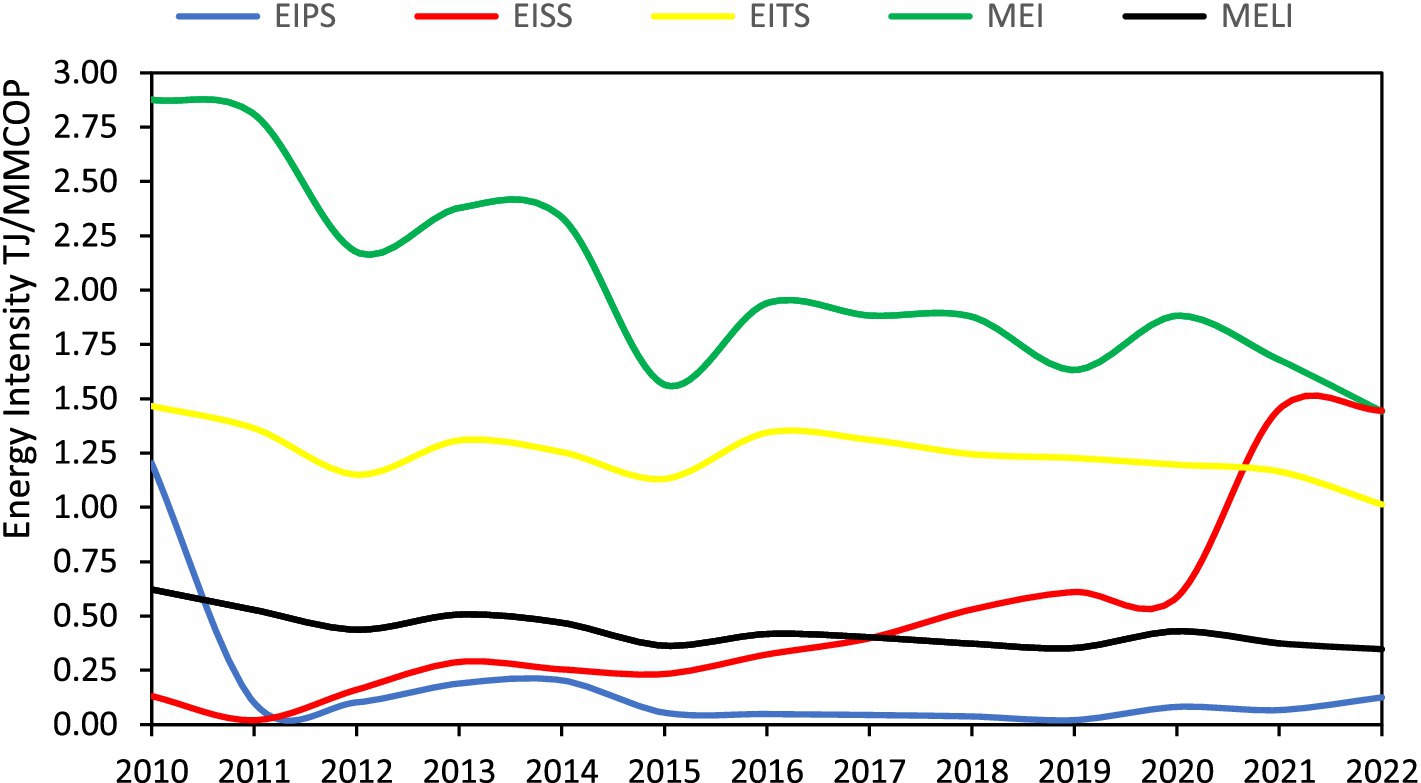
Figure 13. Evolution of electricity, total and economic sector energy intensity in Sabanalarga (Source: own elaboration with data from SUI, 2022; DANE, 2023).
Since 2010 the energy intensity has reduced to 65%, while in the same period, the electricity intensity reduced to 79%. Overall, the municipality improved energy efficiency, although the improvement is less significant for electricity use.
Primary sectors like agriculture, livestock, and fishing, characterized by low energy consumption, show the lowest energy intensity. Moreover, secondary sectors, like manufacturing and construction, show an increasing trend, explained by the expanding development of these activities in the municipality. Finally, tertiary sectors, like commerce, transportation, and communication, show slight variation in the same period.
Table 3 shows the energy technologies in the municipality by sector, this information was obtained through field trips in the different sectors of the municipality, in addition to the information collected by Manotas (2020) in the municipal development plan. The municipality in the different sectors in general does not have the latest generation technologies with high energy efficiency equipment.
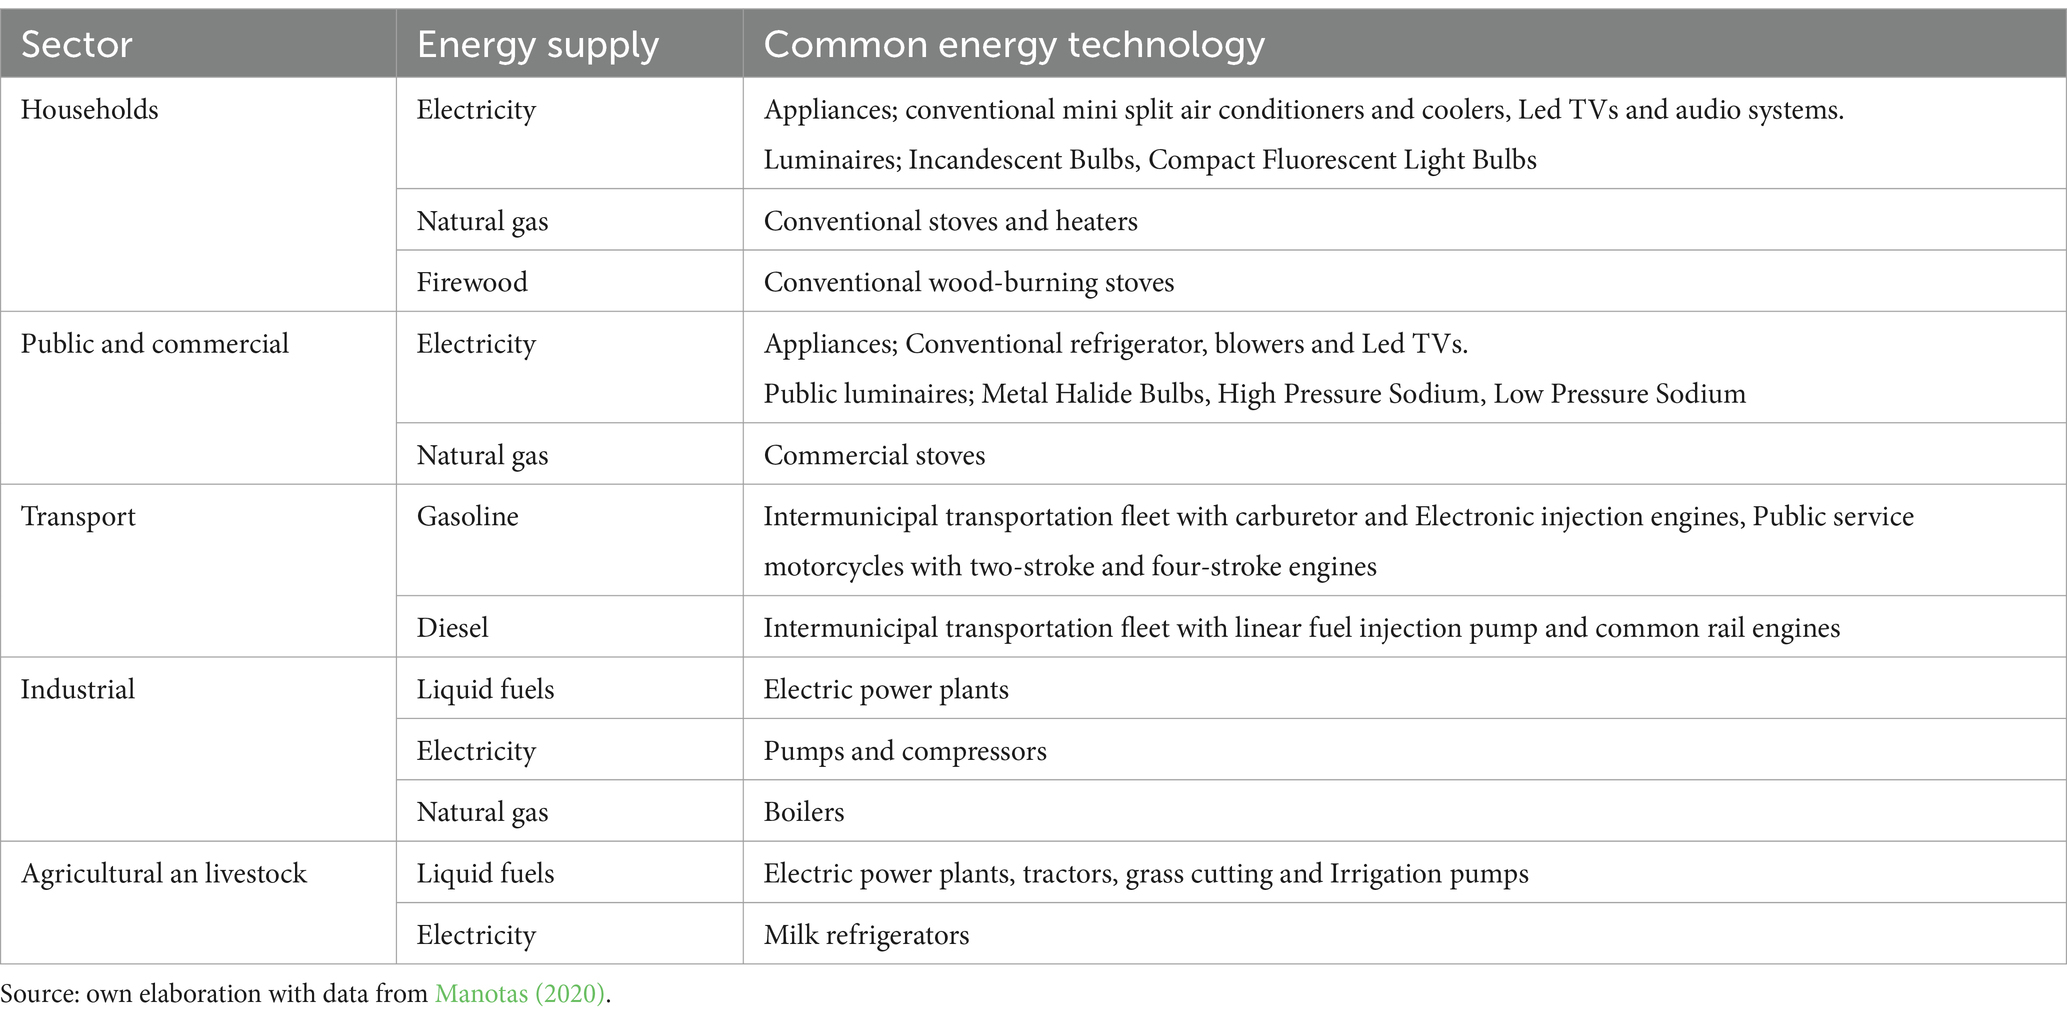
Table 3. Energy technologies most used in the municipality by sector.
The energy diagnosis of the municipality reveals that the transportation, residential, and commercial sectors are the primary energy consumers, relying on outdated and inefficient technologies that contribute to significant energy losses. Firewood, natural gas, and electricity serve as the main energy sources for residential and commercial activities, with the increasing demand for firewood raising serious environmental and health concerns. These findings align with previous studies (Gómez-Ceballos and Morán-Perafán, 2015), which highlight the inefficiencies of traditional energy consumption patterns in municipalities with similar socio-economic conditions. However, the implications of these trends extend beyond localized concerns, underscoring the urgent need for comprehensive policy interventions at municipal, regional, and national levels.
A key challenge identified is the excessive reliance on inefficient combustion-based energy sources, particularly in the transportation sector, which remains a major consumer of gasoline and diesel. Suggest that transitioning to cleaner fuels such as natural gas, adopting hybrid or electric vehicles, and modernizing public transportation systems can significantly mitigate emissions and improve energy efficiency. The municipality’s low level of industrialization translates into minimal electricity demand, which contrasts with higher energy-intensive urban centers. This lack of industrial development limits economic productivity and inhibits the adoption of advanced energy technologies, as evidenced by the discrepancy in energy intensity between Sabanalarga (0.4576 BOE/MCOP) and Pasto (0.1546 BOE/MCOP) in 2011 (Bermejo Altamar et al., 2022).
The residential sector accounts for 55% of total energy consumption, with electricity, natural gas, and firewood being the dominant energy sources. Comparatively, household electricity consumption in the municipality surpasses regional and national averages (Hernández, 2017; UPME, 2021b). This disparity highlights the municipality’s underdeveloped industrial and agricultural sectors and suggests an urgent need to implement demand-side energy management policies. Potential strategies include promoting renewable energy sources such as modern biomass and solar systems, expanding electricity and natural gas access in rural areas, enhancing energy efficiency in residential appliances, and reducing illegal electricity connections. Moreover, replacing traditional cooking stoves with more efficient alternatives can substantially lower firewood dependence and improve air quality.
Energy poverty remains a critical issue in Sabanalarga and Colombia, particularly in rural areas where energy access and affordability are significantly lower than in urban centers. National data indicate that the Basic Subsistence Consumption (BSC) of electricity varies from 130 kWh/month in cold regions to 187 kWh/month in warmer climates (Cabello et al., 2022a). However, rural households in the municipality fall below these thresholds, exacerbating socio-economic disparities. While multidimensional poverty has decreased from 50.8% in 2005 to 36.5% in 2018 (DANE, 2023), rural communities continue to experience inadequate access to modern energy services. Addressing energy poverty requires coordinated governmental policies and infrastructure investments aligned with Sustainable Development Goal 7 (SDG 7), which emphasizes universal access to affordable, reliable, and sustainable energy.
The transportation sector presents additional opportunities for energy optimization. Upgrading diesel injection technology in public transportation, promoting the conversion of gasoline vehicles to natural gas, and encouraging the adoption of hybrid and electric vehicles can enhance both energy efficiency and environmental sustainability. Moreover, restructuring public transport systems to optimize routes and vehicle usage can further reduce energy consumption and emissions.
The integration of modern technologies and renewable energy sources into agriculture and livestock is crucial for improving economic productivity and sustainability. Agricultural biomass presents an untapped potential as a renewable energy source that could support the municipality’s energy transition.
Across Colombia, 1,123 municipalities collectively account for 26% of national electricity consumption (SUI, 2022) while representing 24% of the country’s population (DANE, 2023). To align with SDG 7, municipalities must implement comprehensive energy management strategies that enhance efficiency, diversify energy sources, and foster sustainable energy consumption. A holistic approach to energy planning can drive economic growth, alleviate energy poverty, and ensure equitable access to clean energy for both urban and rural populations. Future research should explore region-specific barriers to energy transitions, assess the socio-economic feasibility of proposed interventions, and examine the long-term sustainability of energy policies to facilitate an equitable energy transformation.
The energy diagnosis of Sabanalarga, which is the initial stage of creating a municipal energy management system, is highlighted in this paper. In line with the first action plan of the Rational and Energy Efficiency Utilisation Program (PAI-PROURE) 2020–2030, the next step is to create energy planning to establish goals to enhance municipal energy performance that are in line with the federal government (UPME, 2022).
The choice of the OLADE-proposed energy balance methodology was made possible by the evaluation of several energy balance approaches used globally (Gonzales and OLADE, 2017). This choice facilitates the diagnostic process by enabling the thorough quantification of all energy flows inside the municipality. In the residential and transportation sectors, respectively, electricity and liquid fuels are the main energy carriers causing increased consumption.
Establishing a baseline to compare the municipal energy performance and the achievement of the management goals is made possible by the energy diagnosis. The municipal energy management system’s performance indicators are listed in Table 3. These results will help the municipality create energy policies that aren’t already included in the municipal development plan (Manotas, 2020). Monitoring the development of municipal energy performance and the application of energy saving measures are made possible by the energy performance indicators. According to the diagnosis, in order to enhance well-being and lessen the negative effects of firewood use on the environment and society, the development plan and energy regulations must take into account correcting the disparity in access to contemporary energy between urban and rural areas. Since the transportation, residential, and commercial sectors use the most energy, they require special attention in municipal energy management.
The raw data supporting the conclusions of this article will be made available by the authors, without undue reservation. Requests to access the datasets should be directed to ZmJlcm1lam8yQGN1Yy5lZHUuY28=.
FB: Writing – original draft, Writing – review & editing. JC: Conceptualization, Writing – review & editing. AS: Writing – review & editing. JM: Conceptualization, Writing – review & editing. JR-B: Supervision, Writing – review & editing.
The author(s) declare that financial support was received for the research and/or publication of this article. The authors thank the University of Cordoba for funding within the scope of the program for the support and improvement of indicators of the research groups and the internal call for the year 2023 is approved according to act No FI-02-23 of 2024.
The authors declare that the research was conducted in the absence of any commercial or financial relationships that could be construed as a potential conflict of interest.
The authors declare that no Gen AI was used in the creation of this manuscript.
All claims expressed in this article are solely those of the authors and do not necessarily represent those of their affiliated organizations, or those of the publisher, the editors and the reviewers. Any product that may be evaluated in this article, or claim that may be made by its manufacturer, is not guaranteed or endorsed by the publisher.
The Supplementary material for this article can be found online at: https://www.frontiersin.org/articles/10.3389/frsc.2025.1505477/full#supplementary-material
Barragán-Escandón, E. A., Zalamea-León, E. F., Terrados-Cepeda, J., and Vanegas-Peralta, P. F. (2020). Energy self-supply estimation in intermediate cities. Renew. Sust. Energ. Rev. 129:109913. doi: 10.1016/j.rser.2020.109913
Beihmanis, K., and Rosa, M. (2016). Energy management system implementation in Latvian municipalities: from theory to practice. Energy Procedia 95, 66–70. doi: 10.1016/j.egypro.2016.09.018
Bermejo Altamar, F. A., Cabello Eras, J. J., and Correa Soto, J. (2022). Energy diagnosis as an element of municipal energy management in Colombia: case study municipality of Sabanalrga. Universidad y Sociedad 14.
Bonilla, J., López, D., and Sepúlveda, C. E. (2014). “Estratificación socioeconómica en Colombia. Contexto general y diagnóstico” in Los Límites de La Estratificación:En Busca de Alternativas. eds. C. E. Sepúlveda, D. López, and J. M. Gallego (Colombia: Editorial Universidad del Rosario, Bogotá), 23–40.
Brandoni, C., and Polonara, F. (2012a). Technical and economic aspects of municipal. Int. J. Sustain. Dev. Plan. 7, 221–236. doi: 10.2495/SDP-V7-N2-221-236
Brandoni, C., and Polonara, F. (2012b). The role of municipal energy planning in the regional energy-planning process. Energy 48, 323–338. doi: 10.1016/j.energy.2012.06.061
Burton, J., and Hubacek, K. (2007). Is small beautiful? A multicriteria assessment of smallscale energy technology applications in local governments. Energy Policy 35, 6402–6412. doi: 10.1016/j.enpol.2007.08.002
Cabello, J. J., Balbis, M., Sagastume, A., Pardo, A., Cabello, M. J., Rey, F. J., et al. (2019). A look to the electricity generation from non-conventional renewable energy sources in Colombia. Int. J. Energy Econ. Policy 9, 1–2. doi: 10.32479/ijeep.7108
Cabello, J., Mendoza Fandiño, J. M., and Sagastume Gutiérrez, A. (2022a). Assessing the causality relationship and time series model for electricity consumption per capita and human development in Colombia. Energy Rep. 8, 10464–10477. doi: 10.1016/j.egyr.2022.08.183
Cabello, J., Mendoza Fandiño, J. M., Sagastume Gutiérrez, A., Rueda Bayona, J. G., and Sofan German, S. J. (2022b). The inequality of electricity consumption in Colombia. Projections and implications. Energy 249:123711. doi: 10.1016/j.energy.2022.123711
Cabello, J., Sagastume, A., Cabello, M., and Rueda, J. (2021). The temperature gradient of cereals as an optimization parameter of the milling process in hammermills. J. Clean. Prod. 297:126685. doi: 10.1016/j.jclepro.2021.126685
Cabello, J. J., Sagastume, A., Sousa, V., and Cabello, M. J. (2020). Energy management of compressed air systems. Assessing the production and use of compressed air in industry. Energy 213:118662. doi: 10.1016/j.energy.2020.118662
Cai, K., Sun, C., Wang, H., Song, Q., Wang, C., and Tang, P. W. (2022). The potential challenge for the effective GHG emissions mitigation of urban energy consumption_ a case study of Macau _ Elsevier enhanced reader.Pdf. Environ. Impact Assess. Rev. 93:106717. doi: 10.1016/j.eiar.2021.106717
Correa, J., Cabello, J., Nogueras, D., and Díaz, Y., (2021). Energy balance as an element of local government manage-. Universidad y Sociedad 13, 266–275.
Correa Soto, J., Sánchez Salmerón, D. M., Cabello Eras, J. J., Nogueira Rivera, D., and Díaz Viñales, Y. A. (2021). Energy balance as an element of local government management in Cuba: a case study in the municipality of Cienfuegos. Universidad y Sociedad 13.
DANE (2019). Resultados Censo Nacional de Población y Vivienda 2018 Red de ciudades cómo vamos. Bogotá.
Denis, G., and Parker, P. (2009). Community energy planning in Canada: the role of renewable energy. Renew. Sustain. Energy Rev. 13, 2088–2095. doi: 10.1016/j.rser.2008.09.030
Dhakal, S. (2009). Urban energy use and carbon emissions from cities in China and policy implications. Energy Policy 37, 4208–4219. doi: 10.1016/j.enpol.2009.05.020
Duque, I., Mesa, D., Lotero, M., and Sandoval, S. (2021). Transición energética: un legado para el presente y el futuro de Colombia. First. Edn. Bodota: La Imprenta Editores S.A.
Dzene, I., Polikarpova, I., Zogla, L., and Rosa, M. (2015). Application of ISO 50001 for implementation of sustainable energy action plans. Energy Procedia 72, 111–118. doi: 10.1016/j.egypro.2015.06.016
Fenton, P., Gustafsson, S., Ivner, J., Palm, J., Fenton, P., Gustafsson, S., et al. (2016). Stakeholder participation in municipal energy and climate planning – experiences from Sweden. Local Environ. 21, 273–274. doi: 10.1080/13549839.2014.946400
Gallego, J. M., López, D., and Sepúlveda, C. E. (2014). “Estratificación socioeconómica y la información catastral. Introducción al problema y perspectivas a futuro” in Los Límites de La Estratificación:En Busca de Alternativas. eds. C. E. S. Rico, D. L. C. Acevedo, and J. M. Gallego (Bogotá, Colombia: Editorial Universidad del Rosario), 1–22.
Gómez-Ceballos, D. J., and Morán-Perafán, R. G. (2015). Análisis energético urbano usando metodologías de gestión integral de energía: un caso de estudio en la ciudad de Pasto. Energética.
Hernández, L. F. (2017). ANÁLISIS DE FACTIBILIDAD DE AUTOGENERACIÓN DE ENERGÍA EN EL SECTOR RESIDENCIAL DEL DEPARTAMENTO DEL ATLÁNTICO.
Ibrahim, M. M. (2024). Energy management strategies of hybrid renewable energy systems: a review. Wind Eng. 48, 133–161. doi: 10.1177/0309524X231200010
ISO (2014). ISO 50006 – energy management systems — measuring energy performance using energy baselines (EnB) and energy performance indicators (EnPI) — general principles and guidance, Iso.
Jekabsone, A., Kamenders, A., and Rosa, M. (2020). Implementation of certified energy management system in municipality. Case study. Environ. Climate Technol. 24, 41–56. doi: 10.2478/rtuect-2020-0053
Jung, Y. (2024). Urban heat islands and the transformation of Singapore. Urban Stud. 61, 2908–2927. doi: 10.1177/00420980231217391
Kamenders, A., Rosa, M., and Kass, K. (2017). Low carbon municipalities. The impact of energy management on climate mitigation at local scale. Energy Procedia 128, 172–178. doi: 10.1016/j.egypro.2017.09.038
Kaselofsky, J., Roš, M., Jekabsone, A., Favre, S., Loustalot, G., and Toma, M. (2021). Getting municipal energy management systems ISO 50001 certified: a study with 28 European municipalities. Sustain. For. 13, 3638–3655. doi: 10.3390/su13073638
Kim, J. S., Lee, I. H., Ahn, Y. H., Lim, S. E., and Kim, S. D. (2016). An analysis of energy consumption to identify urban energy poverty in Seoul. Int. J. Urban Sci. 20, 129–140. doi: 10.1080/12265934.2015.1128350
Kobi, M. (2023). Urban energy landscape in practice: Architecture, infrastructure and the material culture of cooling in post-reform Chongqing, China. Urban Studies 61, 2979–2994. doi: 10.1177/00420980231153309
Kostevsek, A., Petek, J., Kleme, J., Varbanov, P., Kostevsek, A., Petek, J., et al. (2016). Municipal energy policy constitution and integration process to establish sustainable energy systems e a case of the Slovenian municipality. J. Clean. Prod. 120, 31–42. doi: 10.1016/j.jclepro.2016.01.046
Kurahassi, L. (2006). Electrical energy management – bases for a municipal public policy. Polytechnic School of the University of Sao Paulo.
Liu, Q., Cheng, K., and Zhuang, Y. (2022). Estimation of city energy consumption in China based on downscaling energy balance tables. Energy 256:124658. doi: 10.1016/j.energy.2022.124658
Lobo, C., and Maldonado, I. (2022). Do ISO certifications enhance internationalization? The case of Portuguese industrial SMEs. Sustain. For. 14, 1135–1149. doi: 10.3390/su14031335
Martínez, F., Paule, R., and Ferrando, F. (2020). Diagnóstico y propuestas para la elaboración de la hoja de ruta de Vitoria-Gasteiz, estrategia de transición energética municipal 2020-2030, in: XVII Congreso Ibérico y XII Congreso Iberoamericano de Energía Solar, Palma, pp. 1–9.
Mendoza, J., Rhenals, J., Ávila, A., Martínez, A., de la Vega, T., and Durango, E. (2021). Heat absorption cooling with renewable energies: a case study with photovoltaic solar energy and biogas in Cordoba, Colombia [Refrigeración por absorción de calor con energías renovables: un estudio de Caso con energía solar fotovoltaica y biogás en Córdoba, Colombia]. INGECUC 17, 21–30. doi: 10.17981/ingecuc.17.2.2021.03
Minenergia (2020). Hidrocarburos – Ministerio de Minas y Energía [WWW Document]. Cifras Sector Minero.
Minenergía (2021). Cobertura Gas Natural en Colombia [WWW Document]. Available online at: https://www.minenergia.gov.co/documents/2780/COBERTURA_GN_1-2021.xlsx (Accessed June 1, 2023).
Pérez, J., Lázaro, S., Lumbreras, J., and Rodríguez, E. (2019). A methodology for the development of urban energy balances: ten years of application to the city of Madrid. Cities 91, 126–136. doi: 10.1016/j.cities.2018.11.012
Pochtovyuk, A., Semenikhina, V., Onyshchenko, O., Shvets, H., Semenikhina, V., Onyshchenko, O., et al. (2021). “Introduction of energy efficient technologies of a malgamated territorial communities as a basis of energy independence” in 2021 IEEE international conference on modern electrical and energy systems (MEES). ed. IEEE (Poltava, Ukraine: IEEE), 1–6. doi: 10.1109/MEES52427.2021.9598667
Quan, S. J., Chang, S., Castro-Lacouture, D., Igou, T. K., Dutt, F., Ding, J., et al. (2022). Planning decentralized urban renewable energy systems using algal cultivation for closed-loop and resilient communities. Environ. Plan. B Urban Anal. City Sci. 49, 1464–1488. doi: 10.1177/23998083221101713
Rad, F. D. (2010). Application of local energy indicators in municipal energy planning: a new approach towards sustainability, in: American Council for an Energy Efficienct Economy (ACEEE) (Ed.), ACEEE summer study 2010 – energy efficiency in buildings – "the climate for efficiency is now. Pacific Grove, California, USA, pp. 48–59.
Ren, H., Wu, Q., Ren, J., and Gao, W. (2014). Cost-effectiveness analysis of local energy management based on urban e rural cooperation in China. Appl. Therm. Eng. 64, 224–232. doi: 10.1016/j.applthermaleng.2013.12.049
Ronco, P., Del Hoyo, S., and Retuerto, S. (2017). Balances Energéticos Provinciales Notas metodológicas y consolidación de la información.
Schellong, W. (2016). Energy management in municipal energy systems, in: IEEE (Ed.), International energy and sustainability conference (IESC). Cologne, Germany, pp. 1–6.
SICOM (2022). Available online at: https://www.sicom.gov.co/index.php/boletin-estadistico [WWW Document] (Accessed June 1, 2023).
Soto, J. C., Cabello Eras, J. J., Rivera, D. N., Haeseldonckx, D., Gutierrez, A. S., and de Oliveira, L. F. S. (2018). Municipal energy management model for Cuban first level municipalities. J. Eng. Sci. Technol. Rev. 11, 1–6. doi: 10.25103/jestr.116.01
Sperling, K., Hvelplund, F., and Vad, B. (2011). Centralisation and decentralisation in strategic municipal energy planning in Denmark. Energy Policy 39, 1338–1351. doi: 10.1016/j.enpol.2010.12.006
Suab, M., Chena, C., and Yang, Z. (2016). Urban energy structure optimization at the sector scale: considering environmental impact based on life cycle assessment. J. Clean. Prod. 112, 1464–1474. doi: 10.1016/j.jclepro.2015.01.059
SUI (2022). Available online at: https://sui.superservicios.gov.co/Reportes-del-Sector/Energia [WWW Document] (Accessed June 1, 2023).
Superintendencia de Servicios Publicos Domiciliarios (2021). SUI Comercial – gas natural vista inicial [WWW Document].
Superservicios (2020). Sistema Único de Información Superservicios [WWW Document]. Consolidado Energía por Empresa Departamento y Municipio. Available online at: http://www.sui.gov.co/web/ (accessed October 15, 2020).
Traill, H., and Cumbers, A. (2024). The limits to the urban within multi-scalar energy transitions: agency, infrastructure and ownership in the UK and Germany. Urban Stud. doi: 10.1177/00420980241228467
Unidad de Planeación Minero-Energética [UPME], (2021). Balance energético Colombiano. Balance energético Colombiano 2020.
UPME (2020). Sistema de Información Eléctrico Colombiano. Cobertura del Sistema Intercontecado Nacional, Minisyerio de Minas y energía. Bogotá.
UPME (2021b). Balance Energético Colombiano (BECO) Año 2020 [WWW Document]. Balance energético colombiano.
UPME (2022). Programa de uso racional y eficiente de la energía (PROURE). Plan de acción indicativo. Bogotá.
Visintainer, L., Gerstlberger, W., Ferreira, M., and Frank, A. G. (2021). Energy research & social science how governments, universities, and companies contribute to renewable energy development? A municipal innovation policy perspective of the triple helix. Energy Res. Soc. Sci. 71:101854. doi: 10.1016/j.erss.2020.101854
Yazdanie, M., and Orehounig, K. (2021). Advancing urban energy system planning and modeling approaches: gaps and solutions in perspective. Renew. Sust. Energ. Rev. 137:110607. doi: 10.1016/j.rser.2020.110607
Zhou, Y., Li, Y. P., and Huang, G. H. (2014). Integrated modeling approach for sustainable municipal energy system planning and management e a case study of Shenzhen, China. J. Clean. Prod. 75, 143–156. doi: 10.1016/j.jclepro.2014.04.001
AME – Access to Municipal Electricity
COP – Colombian Pesos
ECpc – Electricity consumption per capita
MES – Municipal Energy System
UPME – National Energy Planning Unit
MEM – municipal energy management
MGDP – Municipal Gross Domestic Product
MGPpc – Municipal Gross Product per capita
MMP – Miles of millions of Colombian pesos
MEC – Municipal Electricity Coverage
EISS – Energy intensity of the secondary sector
MGC – Municipal PLG Coverage
NGpc – NG consumption per capita
SECpc – Strata Electricity consumption per capita
FWP – Firewood penetration
MEI – Municipal energy intensity
MELI – Municipal electrical intensity
EIPS – energy intensity of the primary sector
EITS – Energy intensity of the tertiary sector
GHG – Green House Gas
Keywords: energy efficiency, energy planning, energy management, energy diagnosis, energy intensity, energy consumption
Citation: Bermejo F, Cabello J, Sagastume A, Mendoza J and Rueda-Bayona J (2025) Approach for energy diagnostic of intermediate municipalities in Colombia. Front. Sustain. Cities. 7:1505477. doi: 10.3389/frsc.2025.1505477
Edited by:
João Pedro Gouveia, New University of Lisbon, PortugalReviewed by:
Hasim Altan, Prince Mohammad bin Fahd University, Saudi ArabiaCopyright © 2025 Bermejo, Cabello, Sagastume, Mendoza and Rueda-Bayona. This is an open-access article distributed under the terms of the Creative Commons Attribution License (CC BY). The use, distribution or reproduction in other forums is permitted, provided the original author(s) and the copyright owner(s) are credited and that the original publication in this journal is cited, in accordance with accepted academic practice. No use, distribution or reproduction is permitted which does not comply with these terms.
*Correspondence: Fabio Bermejo, ZmJlcm1lam8yQGN1Yy5lZHUuY28=
Disclaimer: All claims expressed in this article are solely those of the authors and do not necessarily represent those of their affiliated organizations, or those of the publisher, the editors and the reviewers. Any product that may be evaluated in this article or claim that may be made by its manufacturer is not guaranteed or endorsed by the publisher.
Research integrity at Frontiers
Learn more about the work of our research integrity team to safeguard the quality of each article we publish.