 Utant Debebe1,2*
 Alazar Assefa1
- 1Ethiopian Institute of Architecture, Building Construction, and City Development, Addis Ababa University, Addis Ababa, Ethiopia
- 2Department of Urban Planning and Development, Civil Service University, Addis Ababa, Ethiopia
Understanding the dynamics of urban green coverage is crucial for informing urban planning and design decisions that foster sustainable cities. This study employed Google Earth imagery and Exploratory Spatial Data Analysis (ESDA) to investigate the changes in urban green coverage within institutional plots in Yeka Sub-City, Addis Ababa, over a twenty-year period from 2003 to 2023. Subsequent image processing and analyses were conducted using GIS and ERDAS Imagine software. The findings revealed a gradual decline in green space coverage by 10.86 hectare, primarily attributed to the expansion of built-up areas and an increase in bare land. These changes suggest that the trend is driven by institutions constructing new facilities and optimizing land use within their compounds. The moderate positive spatial autocorrelation (Moran’s I value of 0.60) indicated that changes in green space were not randomly distributed but tended to cluster in specific areas. This study emphasizes the importance of preserving and enhancing existing green spaces within institutional compounds to promote environmental, social, and economic sustainability. By integrating green space preservation into urban planning and institutional land management practices, policymakers can ensure balanced urban development that aligns with environmental sustainability goals.
1 Introduction
Urban green spaces are essential assets in cities, providing ecological, social, and health benefits that contribute significantly to urban resilience and quality of life (Lee et al., 2015). These areas, which include parks, forests, and green corridors, play a crucial role in mitigating urban heat, conserving biodiversity, and improving air and water quality (Haaland and van den Bosch, 2015; Kruize et al., 2019). In addition, green spaces offer recreational and mental health benefits to city dwellers, making them an indispensable part of sustainable urban environments (Dallimer et al., 2011). However, rapid urbanization, especially in the Global South, is placing these spaces under increasing pressure, with green areas frequently being converted into built-up land to accommodate growing populations and expanding infrastructure. This is particularly relevant in developing regions where urban planning resources may be limited, and green space preservation is often deprioritized (Mensah, 2014).
Institutional green spaces, those situated within public or private institutions such as government offices, educational facilities, hospitals, and embassies, represent a unique subset of urban green spaces. Unlike public parks, these spaces are usually restricted in access, often fenced and maintained primarily for the benefit of the institution (Zuniga-Teran et al., 2020). Despite these limitations, institutional green spaces contribute to the overall green infrastructure of cities, offering ecological benefits such as localized cooling, habitat provision, and carbon sequestration, as well as aesthetic and mental health benefits to users within the institutions (Zuniga-Teran et al., 2020). However, the dual demands on these plots to serve institutional expansion needs and maintain green coverage make them particularly vulnerable to reduction. Institutional land-use decisions may prioritize expansion and infrastructure over preserving green spaces, creating a critical tension in urban areas where green space is already limited (Kabisch and Haase, 2013).
1.1 Comparative theoretical aspects of institutional and private green spaces
While institutional green spaces are publicly or institutionally owned areas meant for communal use, private green spaces are individually owned and primarily for personal enjoyment. Both play significant roles in urban ecology by acting as patches within the landscape, contributing to biodiversity and ecological networks (Forman, 1995; Turner, 1989). Institutional green spaces enhance social capital by fostering community bonds, while private green spaces offer personal connections to nature (Kellert and Wilson, 1993). They both support sustainable urban development, with institutional plots providing large-scale ecological benefits and private spaces adding to urban resilience by offering microhabitats (Holling, 2001; Kaplan, 1995). Moreover, institutional green spaces serve as cultural landscapes that reflect collective expressions, while private green spaces embody personal and cultural expressions (Cosgrove, 1998). Together, these spaces provide ecological, social, psychological, and cultural benefits, enhancing the overall sustainability and resilience of urban environments.
Addis Ababa, the capital city of Ethiopia, exemplifies the rapid urbanization trends common to many cities in sub-Saharan Africa. The city has seen significant population growth and urban expansion over the past few decades, resulting in increasing pressure on land resources (Naqvi, 2021). Yeka Sub-City, located in the north-eastern part of Addis Ababa, represents a microcosm of these urban pressures. As a densely populated area with numerous institutional compounds, Yeka is particularly relevant for studying the impacts of urbanization on institutional green spaces. Selecting this area allows for a focused examination of urban green space dynamics within the context of a developing African city, filling a gap in the literature that has predominantly cantered on cities in the Global North. Studying Yeka’s green spaces offers insights that are not only locally applicable but also potentially informative for other rapidly urbanizing cities in the Global South(Zuniga-Teran et al., 2020).
This study aims to address a critical research gap by focusing on the evolution of green spaces within institutional plots in Yeka Sub-City over a twenty-year period (2003–2023). While previous studies have examined green space dynamics in urban settings, few have focused specifically on institutional green spaces, especially within African cities (Mensah, 2014; Zuniga-Teran et al., 2020). This research investigates the rate of green space reduction, the spatial clustering of these changes, and the underlying drivers contributing to these shifts. We hypothesize that urbanization pressures and institutional expansion are primary drivers of green space reduction in Yeka Sub-City, with observable patterns of clustering that may correlate with specific policy or management practices.
By examining the spatial and temporal trends of green space reduction in Yeka Sub-City, the study offers actionable insights for urban planners and decision-makers aimed at fostering sustainable land management practices that preserve urban greenery amidst urban growth pressures.
2 Materials and methods
2.1 Study area
Yeka Sub-City is one of the eleven sub-cities within Addis Ababa, Ethiopia, located in the northeastern part of the city. It spans an area of approximately 56.71 km2, with geographic coordinates ranging from 9°01′00″ to 9°06′00”N and 38°46′00″ to 38°53′00″E. Yeka has a population of around 363,100, comprising both residential and institutional areas (Central Statistical Agency., 2021). This area was selected for study due to its high concentration of institutional plots, including schools, embassies, and government offices, making it an ideal setting for investigating the dynamics of green space within institutional boundaries in a rapidly urbanizing context (Naqvi, 2021). The area’s humid subtropical climate, with an average annual temperature of 15.9°C and 1,184 mm of rainfall, further emphasizes the importance of green space for mitigating heat and maintaining environmental quality (Ethiopian Metrological AgencyAddis Ababa, Ethiopia., 2023).
2.2 Sampling method
A purposive sampling strategy was employed to select 19 institutional compounds within Yeka Sub-City. This sampling method was chosen to capture a diverse range of institutional types and locations, ensuring a representative analysis of green space dynamics across the sub-city. The selection criteria included:
• Location: Institutional compounds were chosen from key areas along the main roads and near prominent landmarks, such as the Diaspora Roundabout and the Kebena Bridge, where urban pressures are higher.
• Plot Size: Larger plots were prioritized as they are more likely to exhibit significant changes in green space, providing clearer insights into spatial trends.
• Institutional Function: A mix of educational, governmental, and diplomatic institutions was included to explore the variation in land management practices.
Acknowledging that purposive sampling may introduce representativeness limitations, efforts were made to mitigate bias by including a diverse range of institutional types. However, the inherent limitations of this method, including potential bias due to non-random selection, are addressed in the Limitations section.
2.3 Data collection
The study utilized a combination of primary field surveys, secondary data from satellite imagery, and Geographic Information System (GIS) analysis to quantify and understand changes in green space within institutional plots from 2003 to 2023.
• Field Surveys: Field surveys were conducted across all selected institutional sites to gather primary data on the current state of green spaces. These surveys included recording green space areas, assessing vegetation condition, and noting any recent changes. Survey timing was consistent across locations to reduce seasonal variability in vegetation.
• Satellite Imagery Analysis: Google Earth satellite images for five intervals (2003, 2008, 2013, 2018, and 2023) were acquired to analyse land cover changes. To ensure consistency across years, each image underwent pre-processing to correct for differences in resolution and atmospheric conditions. This step was crucial given the varying quality of older images (Wulder et al., 2012). High-resolution images were prioritized where available, though potential limitations due to resolution were noted in the Limitations section.
• Data Validation: Given the reliance on Google Earth imagery, a validation process was implemented. Field survey data were cross-referenced with the satellite image analysis to confirm the accuracy of green space measurements and identify any discrepancies (Wulder et al., 2012).
2.4 Image processing and resampling techniques
To ensure accurate spatial alignment and consistency across all time periods, we applied geometric correction, atmospheric correction, and resampling to satellite imagery downloaded from Google Earth for each year of the study period (2003–2023). The resolution of images downloaded through Google Earth varied, but typically allowed a maximum resolution of 4,800 × 4,800 pixels. This high-resolution imagery was suitable for detailed mapping and analysis of green space changes in Yeka Sub-City.
2.4.1 Geometric correction
Each image underwent geometric correction to align with a base reference map, addressing distortions due to sensor angles, terrain, or positioning issues (Purkis and Klemas, 2011). Geometric corrections were applied using ERDAS Imagine software, ensuring precise alignment across all years and enabling accurate comparisons of green space boundaries over time (ERDAS, 2014).
2.4.2 Atmospheric correction
Atmospheric correction was applied to standardize images by minimizing variations caused by weather, haze, and lighting that could affect reflectance values. This correction step is critical in longitudinal studies, as it reduces inconsistencies introduced by atmospheric conditions, allowing for clearer and more comparable data across the study period (Song et al., 2001).
2.4.3 Resolution and resampling method
Although the downloaded imagery varied in pixel dimensions, we resampled all images to a consistent spatial resolution of 5 meters per pixel for analysis. This resampling was performed using the cubic convolution algorithm, which calculates each new pixel value based on a weighted average of the 16 nearest pixels. Cubic convolution smooth transitions and enhances edge clarity, particularly for green space boundaries, making it suitable for detecting subtle changes over time (Keys, 1981). This method also helped to maintain visual accuracy and reduce pixilation, improving boundary delineation in the analysis (Campbell, 2011).
2.4.4 Localization map
A localization map of Yeka Sub-City was generated from the corrected and resampled imagery, ensuring that key boundaries and landmarks were visually distinct. Contrast enhancement was applied to improve map clarity, addressing the need for a more interpretable and visible representation of the study area.
This approach provided consistent and standardized data on green space coverage for each time interval, thereby improving methodological reliability and reproducibility across different datasets (Figure 1).

Figure 1. Study area location map.
2.5 Exploratory Spatial Data Analysis (ESDA)
2.5.1 Spatial weight matrix development
To identify spatial clustering and trends in green space change, Exploratory Spatial Data Analysis (ESDA) was conducted using ArcGIS. ESDA techniques included the calculation of Moran’s I, a measure of spatial autocorrelation, to assess whether green space changes were randomly distributed or spatially clustered (Getis and Ord, 1992).
• Spatial Weight Matrix: A spatial weight matrix was developed to represent the proximity and influence of each plot on others. The matrix allowed for an understanding of spatial dependencies, where closer plots influenced each other more significantly (Anselin, 1995).
• Moran’s I Calculation: Moran’s I was calculated to determine the degree of clustering in green space changes. Given the modifiable areal unit problem (MAUP) and potential edge effects that can influence spatial autocorrelation results, these issues were mitigated by adjusting the spatial matrix parameters, following recommended practices in spatial analysis literature (Dark and Bram, 2007).
• Justification for ESDA: Moran’s I and ESDA were chosen over other remote sensing methods for their capacity to capture spatial dependencies and clustering effects, providing a clearer interpretation of green space dynamics across institutional plots (Anselin, 1995).
2.6 Integration of qualitative and quantitative data
The integration of qualitative data from field surveys with quantitative data from image analysis provided a comprehensive understanding of green space dynamics within Yeka’s institutional plots. Quantitative variables, including green space area (in hectares) and built-up area, were analyzed using GIS tools, while qualitative observations, such as fencing and restricted access, provided context to the quantitative findings. This mixed-methods approach facilitated the identification of patterns in green space reduction and allowed for cross-validation, ensuring data reliability (Creswell et al., 2017).
2.7 Statistical analysis
In addition to ESDA, principal component analysis (PCA) was suggested to complement the analysis by highlighting correlations among variables, such as changes in green space and built-up area. PCA was conducted on the hectares of green space change to explore potential relationships and clustering among institutional plots, offering additional insights into the factors influencing green space dynamics (Jolliffe, 2002).
3 Results
3.1 Land cover classification results
Using satellite imagery analysis and supervised classification techniques, each institutional plot was categorized into land cover types, specifically green space, built-up area, and bare land. Figure 2 provides a visual representation of the land cover classification, with clearly defined color coded polygons for each category. However, limitations in image resolution for earlier years were noted and addressed through data validation methods.
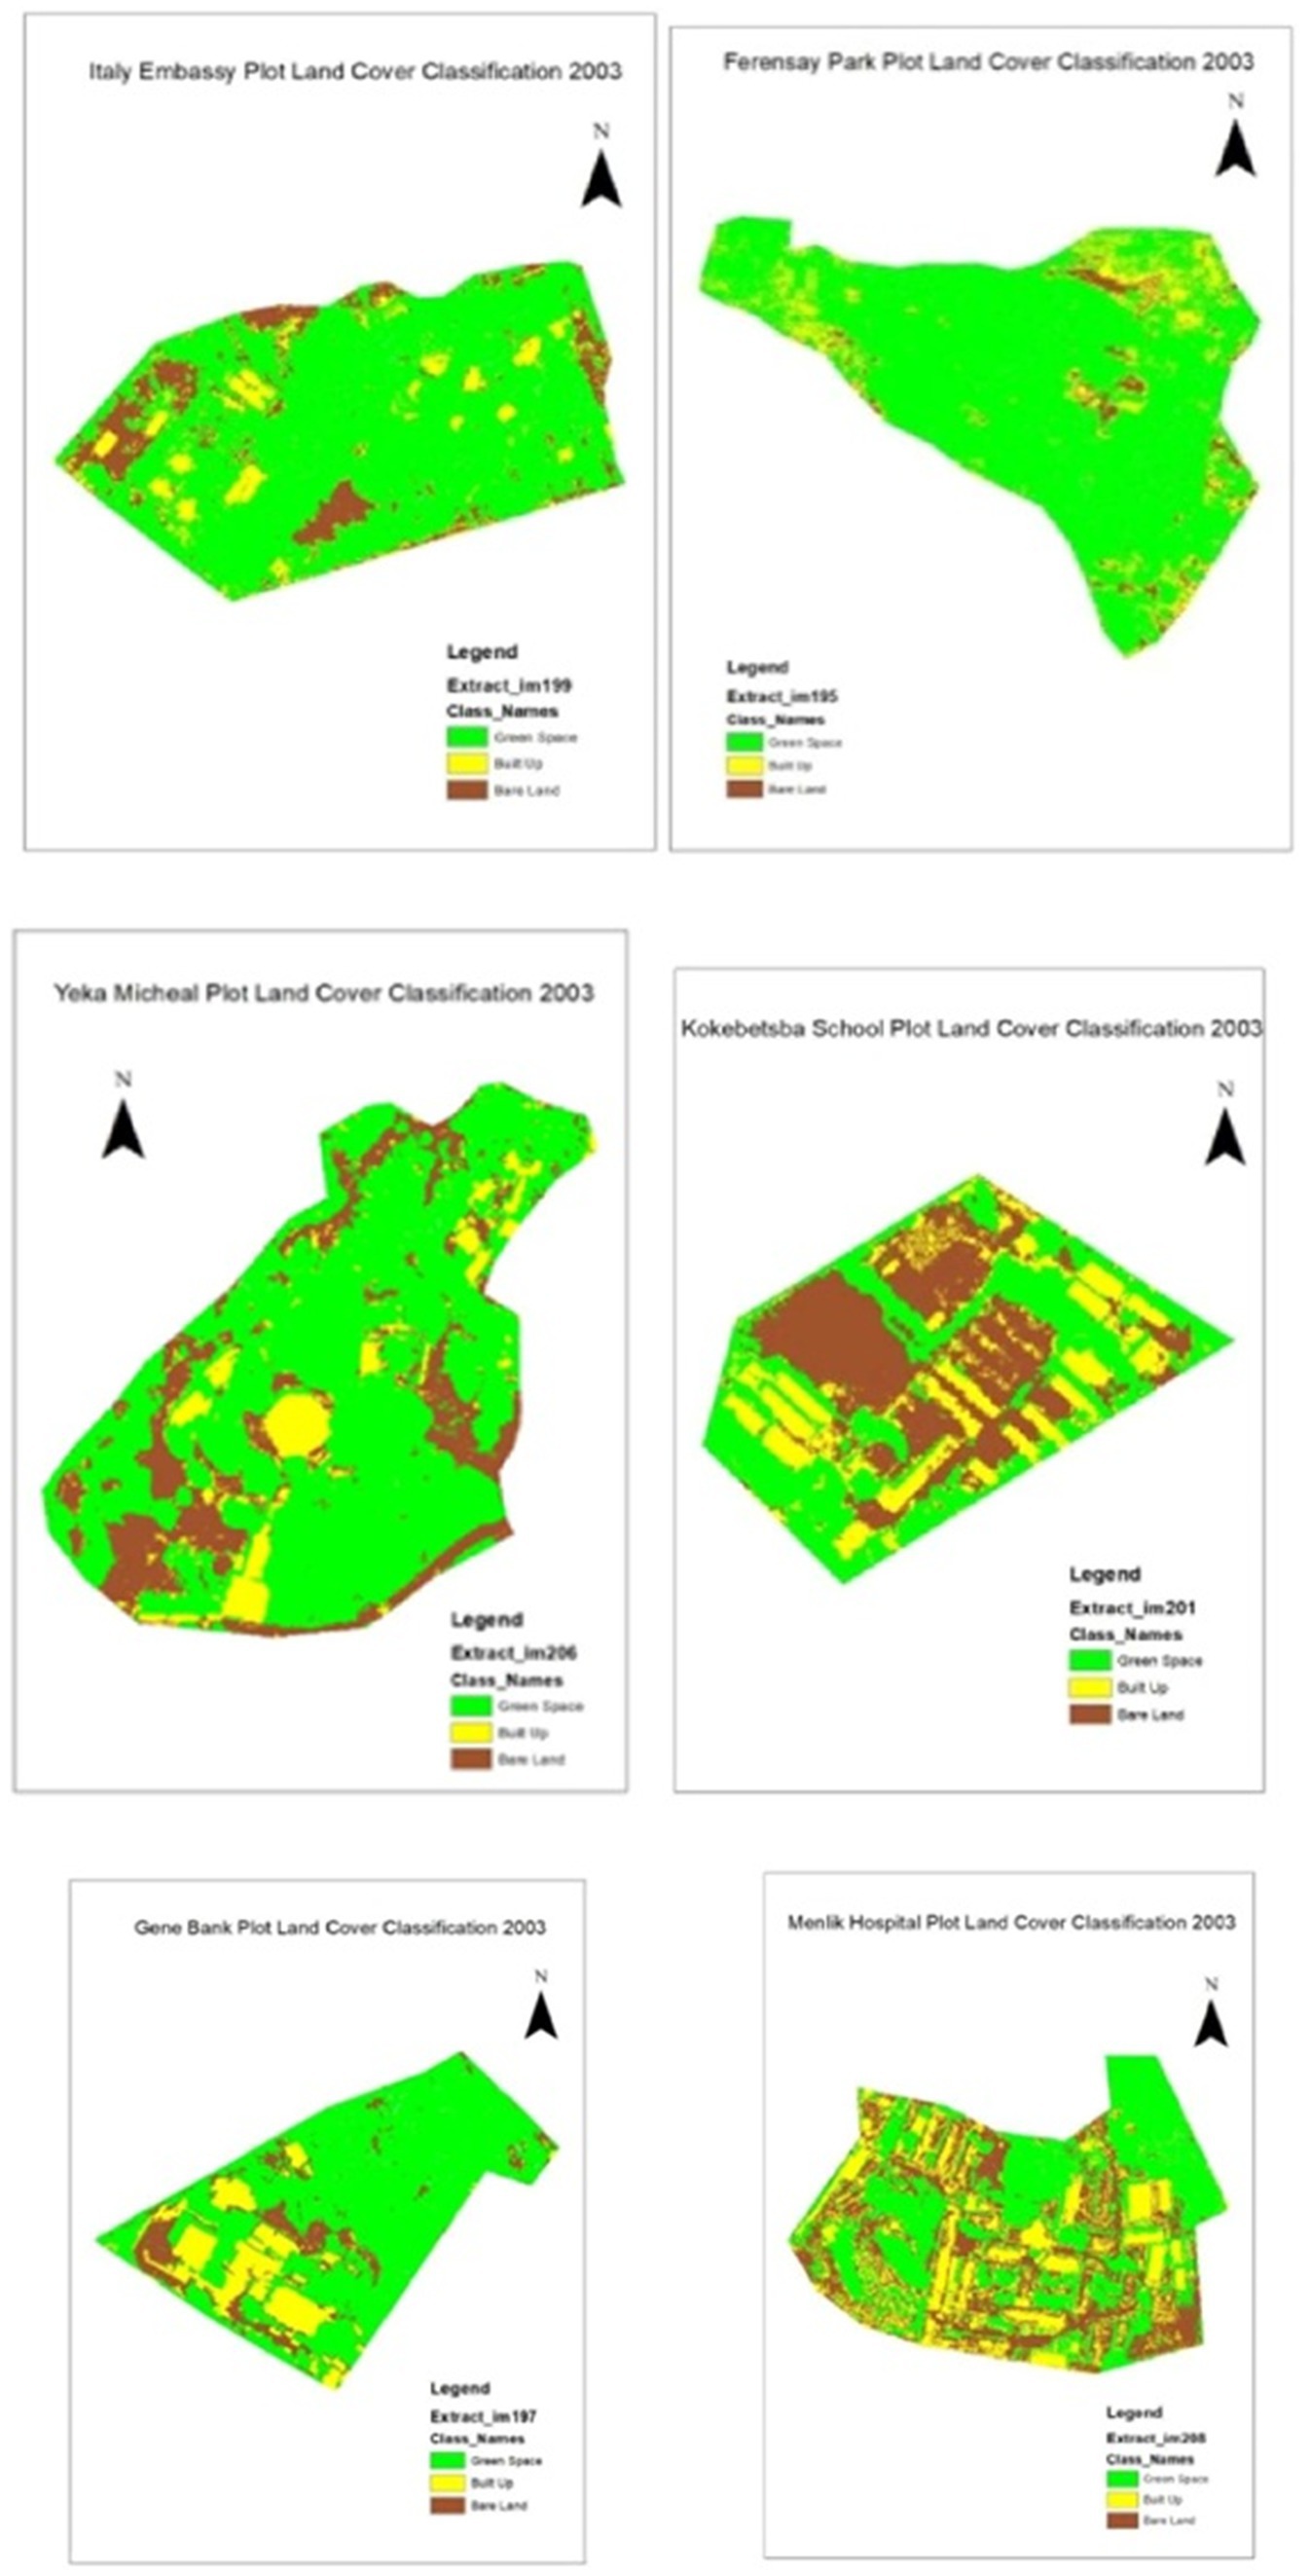
Figure 2. Classified land cover of institutional plots.
3.2 Validation of remote sensing results
To ensure accuracy in the satellite imagery analysis, results were validated by cross-referencing with field survey data collected during site visits. Discrepancies in green space measurements between satellite images and field observations were identified, particularly in cases where tree cover created ambiguity in land cover classification. Adjustments were made to align image-based measurements with on-the-ground data, thus enhancing the accuracy of the spatial analysis.
3.3 Green space coverage changes (2003–2023)
Over the 20-year period from 2003 to 2023, a consistent reduction in green space was observed across the institutional plots in Yeka Sub-City. Table 1 summarizes the changes in green space area for each institutional plot at five-year intervals. Overall, green space decreased by approximately 10.86 hectares, equivalent to an 8% reduction. The decrease was most notable in embassy compounds and government facilities, while some plots, such as certain educational institutions, managed to retain or minimally reduce their green areas.
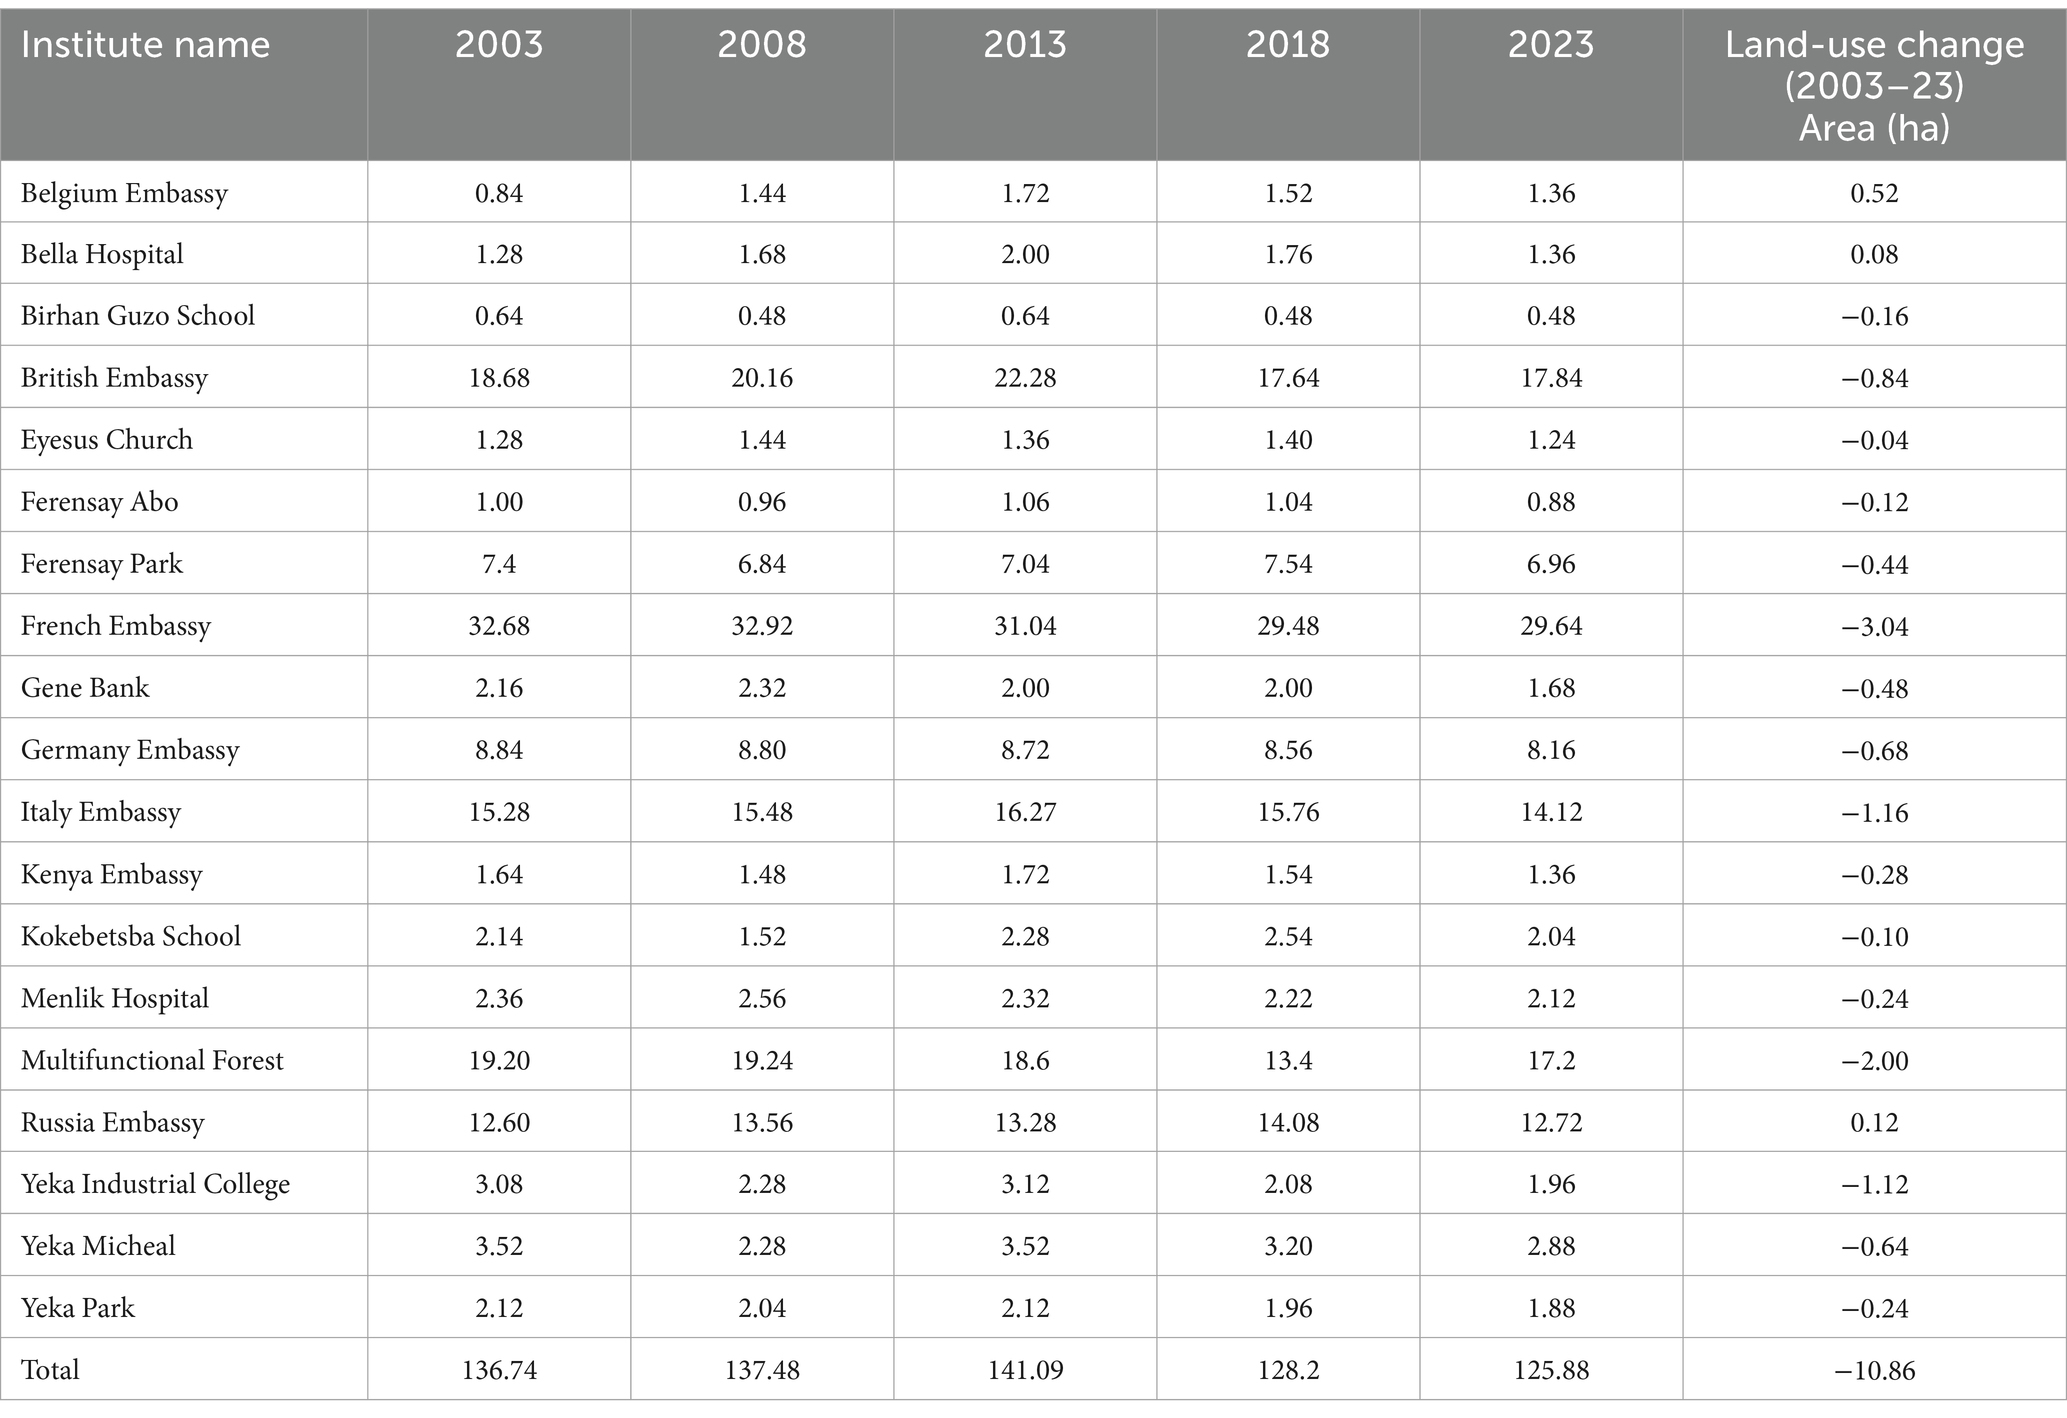
Table 1. Change in green area between 2003 and 2023.
To provide context, the data reveal a spatial trend where green spaces closer to main roads or densely built-up areas experienced greater reductions. This suggests that urban pressures, such as the need for additional infrastructure and built-up facilities, heavily influenced green space conversion in these locations.
3.4 Spatial clustering of green space reduction
The results of the Exploratory Spatial Data Analysis (ESDA) indicate a spatial clustering pattern in green space reduction. Moran’s I calculation returned a value of 0.60, indicating a moderate to strong positive spatial autocorrelation. This value suggests that green space loss was not randomly distributed but rather clustered in specific areas, particularly along institutional corridors with high development activity. Figure 3B illustrates this clustering, that highlight the most significant green space reductions.
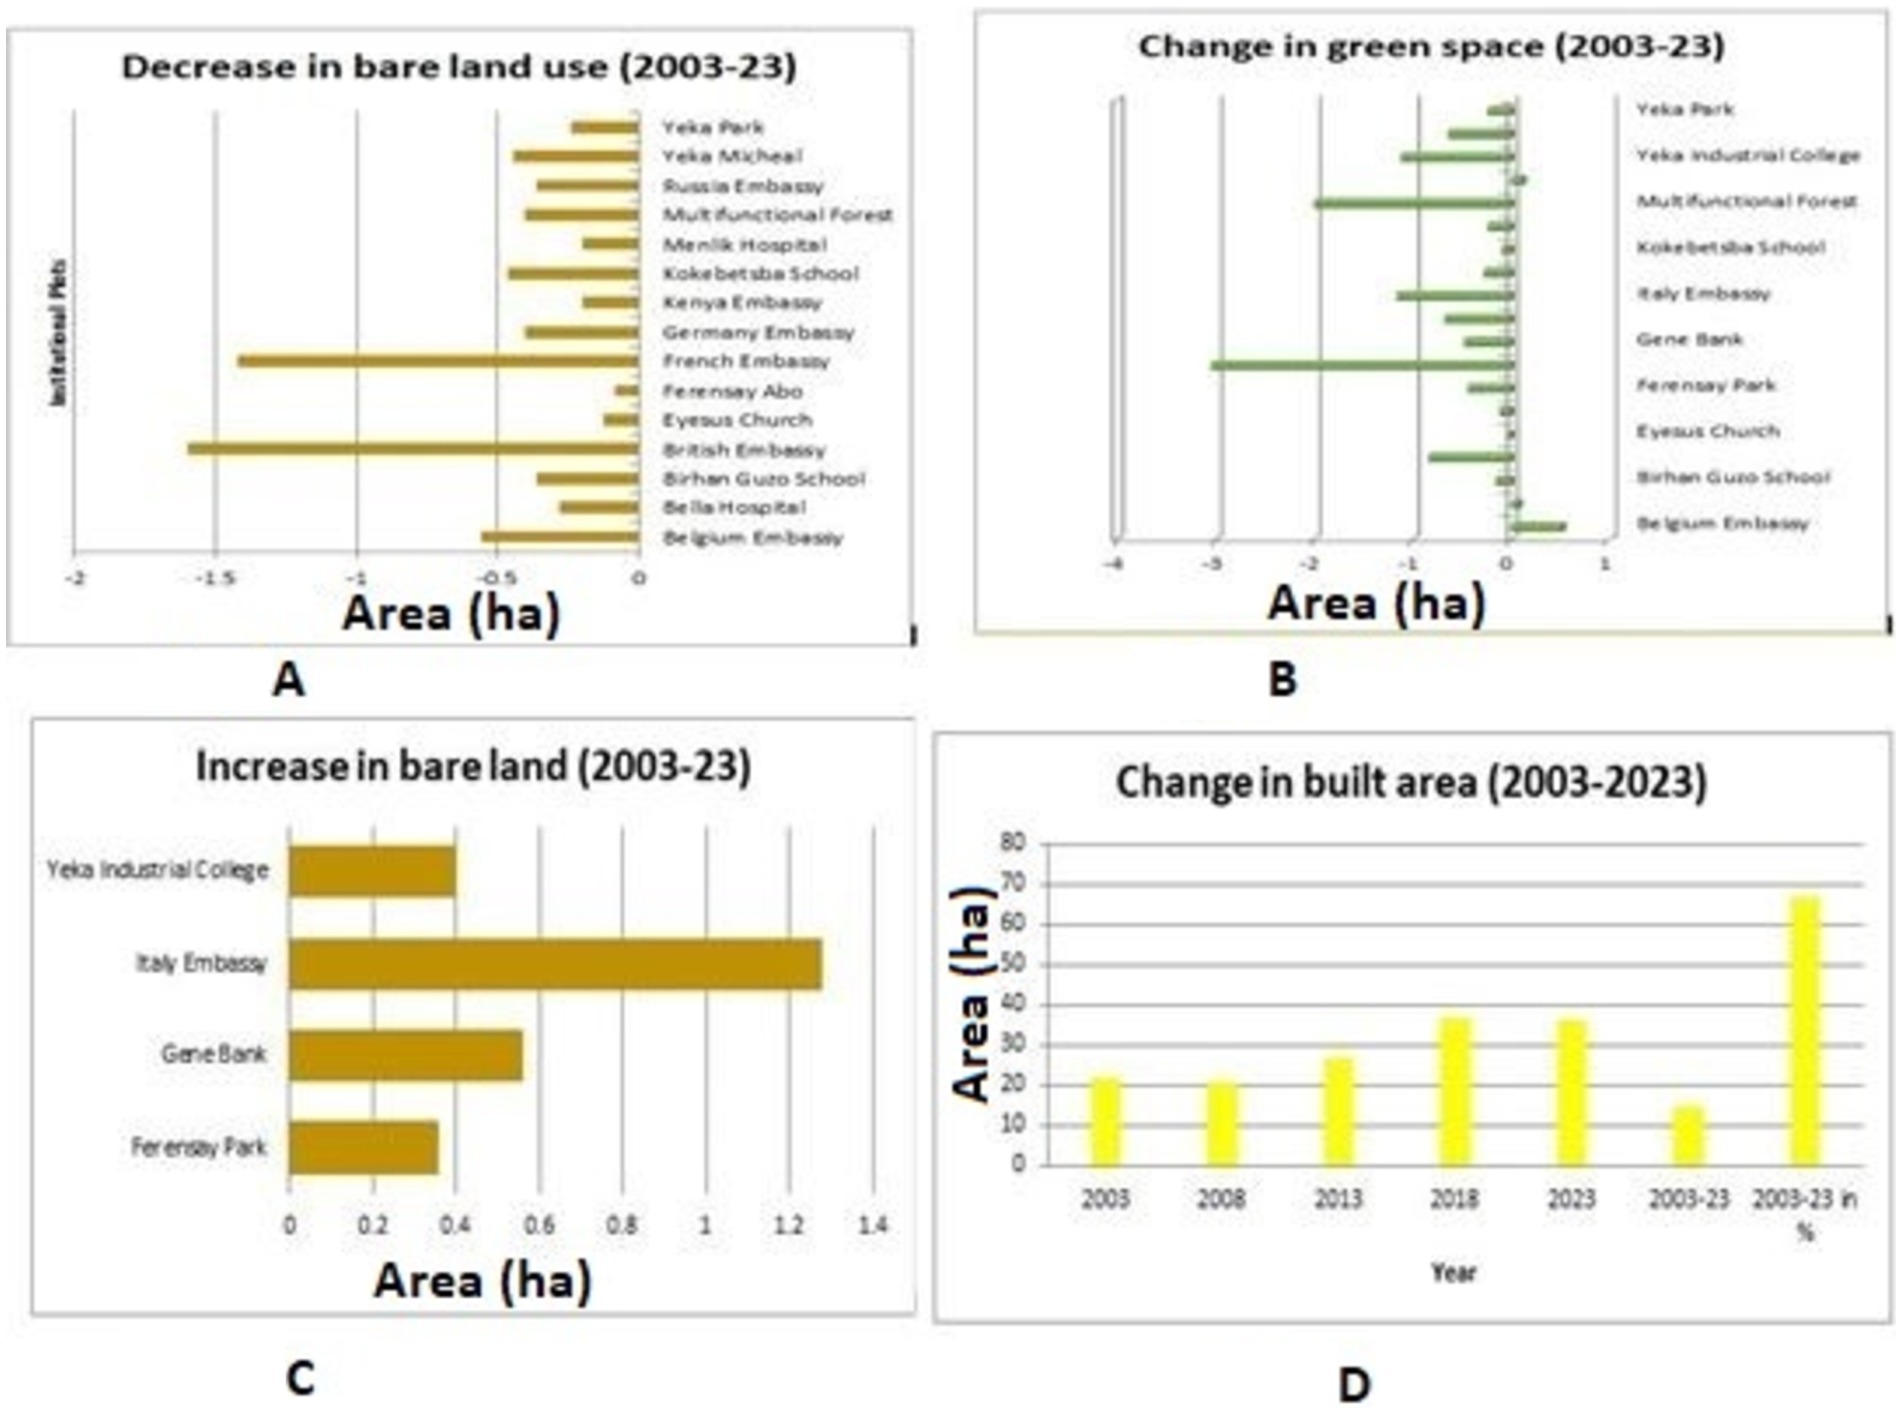
Figure 3. Change in bare land, green space and built up area (2003–2023) in the institutional plots. (A) Decrease in bare land (2003–2023). (B) Change in green space (2003–2023). (C) Increase in bare land (2003–2023). (D) Change in built area (2003–2023).
3.4.1 Spatial weight matrix and proximity influence
The spatial weight matrix showed that plots in close proximity tended to exhibit similar patterns of green space reduction. Embassy plots, for instance, demonstrated a uniform reduction rate, which may reflect coordinated land management policies. In contrast, green space reduction in public institutions showed greater variability, potentially due to differing management practices and urban development pressures.
3.5 Moran’s I calculation
Moran’s I is a measure of spatial autocorrelation, indicating whether similar values cluster together in space. The formula for Moran’s I (Zhou and Lin, 2008) is given by Equation 1:
Where:
• N is the number of plots.
• W is the sum of all spatial weights.
• xi and xj are the values of green space change for plots i and j.
• x is the mean of green space changes.
The overall Moran’s I value of 0.60 obtained from the analysis of green space changes is a measure of spatial autocorrelation, indicating the degree to which similar values are spatially clustered. A value greater than 0 denotes positive spatial autocorrelation, meaning similar values tend to cluster together in space. The value of 0.60 suggests a moderate to strong level of positive spatial autocorrelation, implying that institutional plots with similar changes in green space (both increases and decreases) are more likely to be located near each other rather than being randomly distributed.
Interpretation:
• Moderate Positive Contribution: Indicates that the plot’s green space change is part of a clustered pattern, contributing significantly to the overall Moran’s I value.
• Slight Positive Contribution: Indicates a slight clustering effect, where the plot’s green space change contributes to the overall positive spatial autocorrelation.
• Negligible Contribution: Indicates that the plot’s green space change has little to no effect on the spatial pattern, suggesting a near random distribution.
• High Positive Contribution: Indicates a strong clustering effect, where the plot’s green space change significantly enhances the overall Moran’s I value.
In this study, the Moran’s I value for green space changes was calculated as 0.60, indicating a moderate positive spatial autocorrelation. This means that changes in green space are not randomly distributed but tend to cluster.
3.6 Contributions to Moran’s I
The contributions of individual plots to Moran’s I highlight key areas where green space changes are most pronounced:
• French Embassy (Plot 8): Contributed the most significantly to Moran’s I, with a value of 0.3393, indicating a concentrated loss of green space.
• Belgium Embassy (Plot 1): Showed a considerable positive contribution (0.2045), reflecting a notable increase in green space.
• Multifunctional Forest (Plot 15): Also had a significant contribution (0.1117), due to its substantial reduction in green space.
3.7 Identification of critical green space corridors
The analysis identifies key plots that are crucial for enhancing green space connectivity within Yeka Sub-City. These include:
• French Embassy (Plot 8): Due to its central location and significant green space area, it is critical for forming green corridors.
• Belgium Embassy (Plot 1) and Birhan Guzo School (Plot 3): Both plots serve as central hubs that can connect various green spaces.
• Multifunctional Forest (Plot 15) and Russia Embassy (Plot 16): Strategically located to enhance the overall connectivity network.
3.8 Potential for green space connectivity Improvement
The findings suggest several opportunities for improving green space connectivity in Yeka Sub-City:
• Establishing Green Corridors: Connecting key plots such as Belgium Embassy, French Embassy, and Multifunctional Forest can create continuous green belts.
• Green Space Restoration: Focus on restoring green spaces in critical plots like French Embassy and Multifunctional Forest to mitigate the loss and enhance ecological benefits.
• Developing Pathways: Creating pathways that link central green spaces will improve accessibility and continuity.
The identification of critical green space corridors and the potential for connectivity improvement form the basis for the following discussion. This will explore specific strategies and interventions needed to preserve and enhance the green space network within Yeka Sub-City. The integration of spatial analysis and connectivity planning is essential for sustainable urban development and ecological resilience (Table 2).

Table 2. Spatial weight matrix.
3.9 Built-up area changes and correlation with green space reduction
Alongside the reduction in green space, an increase in built-up areas was noted across most institutional plots. Between 2003 and 2023, built-up areas expanded by approximately 14.5 hectares, translating to an average increase of 67%. This expansion was particularly pronounced in larger institutional plots, such as government offices and diplomatic compounds. Principal component analysis (PCA) indicated a positive correlation between built-up area increase and green space reduction, especially in plots with consistent spatial clustering patterns. This trend presents, shows the inverse relationship between green space and built-up area over time (Table 3).
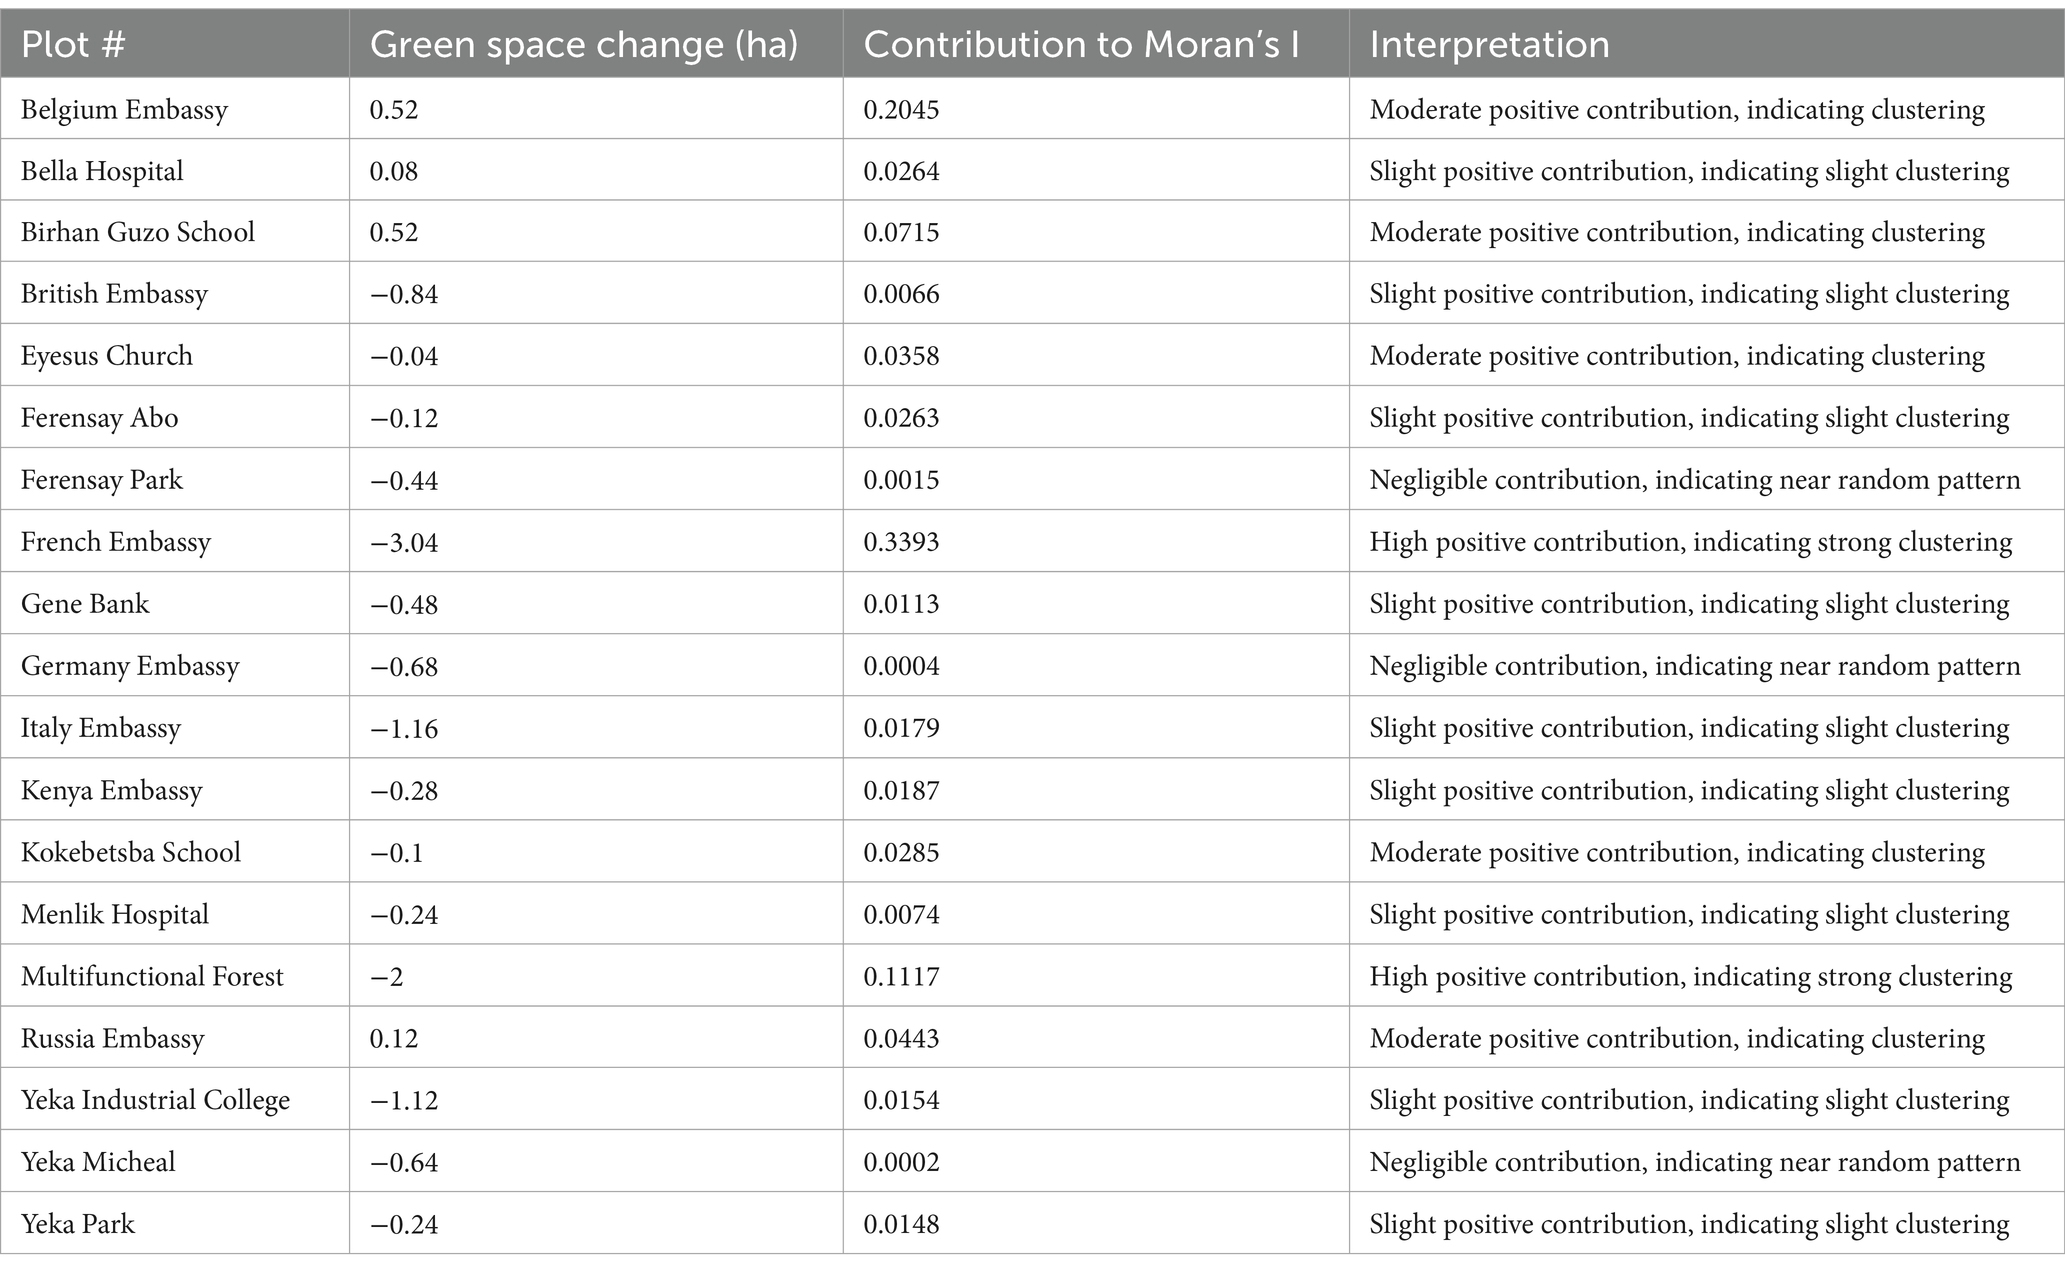
Table 3. The Moran’s value.
3.10 Variation in land use practices and impact on green space
Results reveal significant variability in green space management practices across institutional types. Embassy compounds tended to exhibit a structured, controlled reduction in green space, reflecting policies that likely prioritize specific land uses. This reduction pattern contrasts with that of public institutions, which showed more irregular green space changes. For example, certain schools retained green spaces for recreational purposes, while other institutions converted green areas into built structures to accommodate facility expansion. This variability in land use approaches suggests that institutional policies and management practices play a crucial role in green space dynamics.
3.11 Limitations in access and connectivity of institutional green spaces
Field survey data indicate that access to institutional green spaces is generally restricted by fences and controlled entry, limiting their functionality for the broader community. Additionally, the lack of connectivity between green spaces caused by physical barriers and the fragmented layout of institutional plots hampers their effectiveness in contributing to overall urban green infrastructure. The absence of ecological connectivity and physical pathways between green spaces limits their potential to serve as a cohesive network for urban wildlife and environmental benefits, such as heat mitigation and air quality improvement.
3.12 Land cover classification results
Using satellite imagery analysis and supervised classification techniques, each institutional plot was categorized into land cover types, specifically green space, built-up area, and bare land provides a visual representation of the land cover classification, with clearly defined polygons for each category. However, limitations in image resolution for earlier years were noted and addressed through data validation methods. Figures 3A–D illustrates the Change in bare land, green space and built up area (2003–2023).
3.13 Validation of remote sensing results
To ensure accuracy in the satellite imagery analysis, results were validated by cross-referencing with field survey data collected during site visits. Discrepancies in green space measurements between satellite images and field observations were identified, particularly in cases where tree cover created ambiguity in land cover classification. Adjustments were made to align image-based measurements with on-the-ground data, thus enhancing the accuracy of the spatial analysis.
4 Discussion
This study investigates the dynamics of green space within institutional plots in Yeka Sub-City, Addis Ababa, over a 20-year period, highlighting the significant reduction in green space and its spatial clustering. The findings reveal complex interactions between urban expansion, institutional land management practices, and green space preservation, contributing to the broader understanding of urban green space dynamics in rapidly developing contexts. This section synthesizes these findings in light of urban ecological and land use change theories, discussing implications for urban planning and policy.
4.1 Urban ecology and the role of institutional green spaces
The Theory of Urban Ecology provides a valuable framework for interpreting the ecological implications of green space changes within institutional plots. In Yeka Sub-City, green spaces within institutional compounds serve as small but critical components of the urban ecosystem, offering microclimatic benefits, biodiversity support, and aesthetic value (Haaland and van den Bosch, 2015; Kabisch and Haase, 2013). However, the results indicate that these green spaces are increasingly under pressure from institutional expansion, leading to fragmented and isolated green areas that are often inaccessible to the broader community. The reduction and restricted access of these spaces diminish their potential ecological benefits, such as air quality improvement and heat mitigation that are otherwise essential for densely populated urban areas (Mensah, 2014).
The observed clustering of green space reduction aligns with urban ecological concerns regarding habitat fragmentation and ecosystem degradation in urban environments (Wu, 2014). With a Moran’s I value of 0.60, green space reduction is concentrated in specific areas, particularly near institutional corridors where development pressures are higher. This clustering effect not only reduces overall green space but also limits connectivity, which is essential for supporting urban biodiversity and ensuring the resilience of the urban ecosystem (Forman, 1995).While ecological connectivity is commonly justified by the need to support wildlife movement in fragmented habitats, the findings suggest that the lack of connectivity between institutional green spaces also affects urban residents by reducing accessible recreational areas and contributing to uneven distribution of green infrastructure benefits across the sub-city (Kong et al., 2010).
4.2 Land use change theory and institutional land management practices
Land Use Change Theory helps to contextualize the drivers behind green space reduction within institutional plots. This theory highlights how socio-economic, political, and institutional factors shape land use decisions (Turner et al., 1994). In Yeka Sub-City, institutional policies and land management practices appear to play a significant role in the observed variability of green space reduction. For example, embassy compounds exhibited a more controlled reduction, likely influenced by specific land use regulations and management priorities that balance institutional needs with some degree of green space retention (Nuissl and Siedentop, 2021). Conversely, public institutions displayed greater variability in green space changes, often driven by immediate expansion needs and limited regulatory constraints, which may prioritize infrastructure over environmental preservation (Kabisch and Haase, 2013).
This variability suggests that institutional green spaces are shaped by unique pressures, distinct from public green spaces that are typically managed for broader public benefit (Zuniga-Teran et al., 2020). The clustering of green space reduction in certain areas may also indicate that land use policies in Addis Ababa insufficiently address the ecological and social roles of institutional green spaces, leading to uncoordinated green space management and potential over-expansion (Puplampu and Boafo, 2021). These findings underscore the need for urban planning approaches that consider the dual function of institutional green spaces as both private assets and contributors to urban green infrastructure, advocating for policies that encourage green space preservation within institutional land management frameworks (Kruize et al., 2019; Mensah, 2014).
4.3 Implications for urban planning and policy
The findings of this study have significant implications for urban planning and policy in Addis Ababa and similar urban contexts. The decline in institutional green space, particularly in clusters around high-development corridors, highlights the need for policies that balance institutional expansion with green space preservation (Forman, 1995). Policies aimed at green space preservation should encourage institutions to adopt sustainable land use practices that maintain a portion of their land as green space, contributing to the overall green infrastructure of the city(Haaland and van den Bosch, 2015; Kabisch and Haase, 2013). The establishment of guidelines for institutional green space management, particularly for embassies and public institutions, could ensure that these areas retain ecological and social functions.
While public green spaces are typically prioritized in urban policies, this study demonstrates the importance of institutional green spaces for sustaining urban environmental quality. Policies that incentivize green space retention within institutional compounds could mitigate the adverse effects of urban expansion on green infrastructure. For example, establishing minimum green space requirements or offering incentives for green infrastructure projects within institutional settings could help retain these critical ecological areas (Nuissl and Siedentop, 2021). Furthermore, policies that address connectivity between institutional green spaces could create a more cohesive green network, even within fenced and restricted areas, by promoting “green corridors” where feasible (Kong et al., 2010).
4.4 Limitations and caveats
Despite the insights provided, this study has several limitations. The use of Google Earth imagery, while cost-effective, presented challenges in resolution consistency across years, particularly for earlier images. Although image processing techniques and field survey validation helped to address these issues, potential inaccuracies remain. Additionally, the purposive sampling method may limit the generalizability of findings, as the selected plots may not represent all types of institutional land use across Yeka Sub-City. The absence of a systematic approach to sampling could introduce bias, which future studies may address through randomized sampling or a larger sample size (Turner et al., 1994).
Moreover, the study’s focus on Yeka Sub-City limits its applicability to other urban areas with different institutional structures or urbanization pressures. Future research could expand this analysis to multiple sub-cities within Addis Ababa or across other cities in the Global South, allowing for a comparative approach that examines how institutional land use practices impact green space dynamics in various contexts (Mensah, 2014).
4.5 Future directions for research
Further research could benefit from exploring additional variables, such as socio-economic factors, that influence institutional land use decisions. Additionally, longitudinal studies using higher-resolution satellite data could provide more precise measurements of green space changes over time. Implementing advanced spatial analysis techniques, such as principal component analysis (PCA), could reveal more nuanced relationships between green space reduction and urban factors. Integrating ecological and social perspectives could also deepen the understanding of how institutional green spaces contribute to urban sustainability and inform policies that encourage integrated urban planning approaches (Lambin and Geist, 2008).
5 Conclusion and recommendations
5.1 Conclusion
This study examined the changes in green space within institutional plots in Yeka Sub-City, Addis Ababa, from 2003 to 2023, identifying key trends, spatial clustering, and contributing factors. During the 20-year period green spaces in institutional plots decreased by approximately 8%, with reductions clustering in specific areas, especially around high-development corridors and embassy compounds. The findings suggest that urban expansion pressures, particularly in a rapidly growing city like Addis Ababa, coupled with varying institutional land management practices, contribute significantly to green space loss in these settings.
Applying Urban Ecology and Land Use Change theories, this study highlighted that institutional green spaces are not only crucial for ecological functions, such as local climate regulation and habitat provision, but also serve as important components of urban green infrastructure. However, the restricted access and lack of connectivity among these green spaces reduce their broader ecological and social benefits for the city’s residents. These findings underscore the need for policies that integrate institutional green spaces within the broader urban planning framework, balancing expansion needs with green space preservation to support sustainable urban development.
While the study provides insights into green space dynamics within institutional plots, it is limited by the use of Google Earth imagery, which varies in resolution across years, and by a non-random sampling method that may affect generalizability. Future studies can build on this work by incorporating higher-resolution satellite data and expanding the sample to other sub-cities or cities with similar urbanization pressures.
5.2 Recommendations
Based on the findings, the following recommendations are proposed to support sustainable green space management within institutional areas in rapidly urbanizing cities:
Establish Minimum Green Space Requirements: Urban planners and policymakers should establish minimum green space requirements for institutional plots, particularly for new developments. This could involve setting guidelines for green space proportions relative to plot size, ensuring that institutions maintain designated green areas within their compounds.
Encourage Connectivity through Green Corridors: To maximize ecological and social benefits, urban policies should encourage the development of green corridors that connect institutional green spaces where feasible. This could involve promoting landscape design practices that enhance visual and ecological continuity between green areas, even in fenced or restricted-access zones.
Incentivize Sustainable Land Management Practices: Municipalities could incentivize institutions to adopt sustainable land management practices that prioritize green space preservation. Examples include tax reductions or grants for institutions that incorporate ecological features, such as green roofs, rain gardens, or urban forestry projects, into their grounds.
Implement Regular Monitoring and Accountability Mechanisms: Establishing a monitoring system for institutional green spaces, supported by satellite data and regular field surveys, would provide valuable data on green space dynamics and help ensure compliance with preservation policies. Accountability mechanisms could further reinforce the commitment to maintaining these green spaces as part of the urban ecosystem.
Enhance Public Awareness of Institutional Green Space Benefits: Raising awareness about the ecological and social importance of institutional green spaces could encourage both public and private institutions to prioritize these areas. Public education campaigns could highlight the benefits of green spaces for urban sustainability and the role institutions play in enhancing overall environmental quality.
In conclusion, these recommendations offer a pathway toward a balanced approach that respects both the operational needs of institutions and the ecological necessity of urban green spaces. By adopting integrated planning policies that recognize the dual role of institutional green spaces, cities like Addis Ababa can create a more sustainable and livable urban environment, benefiting both institutions and the broader community.
Data availability statement
The original contributions presented in the study are included in the article/supplementary material, further inquiries can be directed to the corresponding author.
Author contributions
UD: Conceptualization, Data curation, Formal analysis, Funding acquisition, Investigation, Methodology, Project administration, Resources, Software, Validation, Visualization, Writing – original draft, Writing – review & editing. AA: Validation, Writing – review & editing, Supervision.
Funding
The author(s) declare that no financial support was received for the research, authorship, and/or publication of this article.
Conflict of interest
The authors declare that the research was conducted in the absence of any commercial or financial relationships that could be construed as a potential conflict of interest.
Generative AI statement
The author(s) declare that Generative AI was used in the creation of this manuscript. Authors used GhatGPT 4.0 (version January 2024, OpenAI) to assist in proof reading and language refinement.
Publisher’s note
All claims expressed in this article are solely those of the authors and do not necessarily represent those of their affiliated organizations, or those of the publisher, the editors and the reviewers. Any product that may be evaluated in this article, or claim that may be made by its manufacturer, is not guaranteed or endorsed by the publisher.
References
Anselin, L. (1995). Local indicators of spatial association—LISA. Geogr. Anal. 27, 93–115. doi: 10.1111/j.1538-4632.1995.tb00338.x
Campbell, J. B. (2011) in Introduction to remote sensing. ed. R. H. Wynne. 5th ed. (New York, NY 10001, USA: The Guilford Press).
Central Statistical Agency. (2021). Populatio projection of Ethiopia for all regions at woreda level from 2014–2017. Ethiopia: Central Statistics Agency (CSA).
Cosgrove, D. E. (1998). Social formation and symbolic landscape. eds. E. C. Denis Madison, USA: University of Wisconsin Press.
Creswell, J. W., and Plano Clark, V. L. (2017). Designing and conducting mixed methods research. 3rd Edn. London, United Kingdom: SAGE Publications.
Dallimer, M., Tang, Z., Bibby, P. R., Brindley, P., Gaston, K. J., and Davies, Z. G. (2011). Temporal changes in greenspace in a highly urbanized region. Biol. Lett. 7, 763–766. doi: 10.1098/rsbl.2011.0025
Dark, S. J., and Bram, D. (2007). The modifiable areal unit problem (MAUP) in physical geography. Progress Physical Geography 31, 471–479. doi: 10.1177/0309133307083294
ERDAS. (2014). ERDAS Imagine 2014, 2014th ed. Hexagon Geospatial, Peachtree Corners Circle Norcross. Norcross, USA: Hexagon Geospatial.
Ethiopian Metrological AgencyAddis Ababa, Ethiopia. (2023). Annual Climate Report. Ethiopian Meteorological Agency (EMA).
Forman. (1995). Some general principles of landscape and regional ecology. Cambridge, UK: Cambridge University Press Address.
Getis, A., and Ord, J. K. (1992). The analysis of spatial association by use of distance statistics. Geogr. Anal. 24, 189–206. doi: 10.1111/j.1538-4632.1992.tb00261.x
Haaland, C., and van den Bosch, C. K. (2015). Challenges and strategies for urban green-space planning in cities undergoing densification: a review. Urban For. Urban Green. 14, 760–771. doi: 10.1016/j.ufug.2015.07.009
Holling (2001). Understanding the complexity of economic. Ecol Social Syst. 4, 390–405. doi: 10.1007/s10021-001-0101-5
Kabisch, N., and Haase, D. (2013). Green spaces of European cities revisited for 1990–2006. Landsc. Urban Plan. 110, 113–122. doi: 10.1016/j.landurbplan.2012.10.017
Kaplan, S. (1995). The restorative benefits of nature: toward an integrative framework. J. Environ. Psychol. 15, 169–182. doi: 10.1016/0272-4944(95)90001-2
Kellert, S. R., and Wilson, E. O. (1993). The biophilia hypothesis. Washington, USA: Island Press/Shearwater Books.
Keys, R. (1981). Cubic convolution interpolation for digital image processing. IEEE Trans. Acoust. Speech Signal Process. 29, 1153–1160. doi: 10.1109/TASSP.1981.1163711
Kong, Haiwei Yin, Nakagoshi, Nobukazu, and Zong, Yueguang. (2010). Urban green space network development for biodiversity conservation: Identification based on graph theory and gravity modeling. Amsterdam, Netherlands: Elsevier Address.
Kruize, H., van der Vliet, N., Staatsen, B., Bell, R., Chiabai, A., Muiños, G., et al. (2019). Urban green space: creating a triple win for environmental sustainability, health, and health equity through behavior change. Int. J. Environ. Res. Public Health 16:4403. doi: 10.3390/ijerph16224403
Lambin and Geist. (2008). Land-use and land-cover change: Local processes and global impacts. Springer Science & Business.
Lee, A., Jordan, H., and Horsley, J. (2015). Value of urban green spaces in promoting healthy living and wellbeing: prospects for planning. Risk Manag. Healthcare Policy 8, 131–137. doi: 10.2147/RMHP.S61654
Mensah, C. A. (2014). Urban green spaces in Africa: Nature and challenges. American Journal of Environmental Protection. USA: Science Publishing Group.
Naqvi, A. (2021). COVID-19 European regional tracker. Scientific Data 8:181. doi: 10.1038/s41597-021-00950-7
Nuissl, H., and Siedentop, S. (2021). “Urbanisation and land use change” in Sustainable land Management in a European Context. eds. T. Weith, T. Barkmann, N. Gaasch, S. Rogga, C. Strauß, and J. Zscheischler, vol. 8. (New York, USA: Springer Nature, Springer International Publishing), 75–99.
Puplampu, D. A., and Boafo, Y. A. (2021). Exploring the impacts of urban expansion on green spaces availability and delivery of ecosystem services in the Accra metropolis. Environ. Challenges 5:100283. doi: 10.1016/j.envc.2021.100283
Purkis, S. J., and Klemas, V. (2011). Remote sensing and global environmental change. Hoboken, USA: Wiley-Blackwell.
Song, C., Woodcock, C. E., Seto, K. C., Lenney, M. P., and Macomber, S. A. (2001). Classification and change detection using Landsat TM data. Remote Sens. Environ. 75, 230–244. doi: 10.1016/S0034-4257(00)00169-3
Turner, MG. (1989). Landscape ecology: The effect of pattern on processes, Ecol. Indicators 20, 171–197, doi: 10.1146/annurev.ecolsys.20.1.171
Turner, B., Meyer, W. B., and Skole, D. L. (1994). Global land-use/land-cover change: Towards an integrated study. Palo Alto, CA, USA: Annual Review of Ecology and Systematics.
Wu. (2014). Urban ecology and sustainability: The state-of-the-science and future directions. International Journal of Quality and Service Sciences. Bingley, UK: Emerald Group Publishing Limited.
Wulder, M. A., Masek, J. G., Cohen, W. B., Loveland, T. R., and Woodcock, C. E. (2012). Opening the archive: how free data has enabled the science and monitoring promise of Landsat. Remote Sens. Environ. 122, 2–10. doi: 10.1016/j.rse.2012.01.010
Zhou, X., and Lin, H. (2008). Moran’s I. In: Encyclopedia of GIS. eds. S. Shekhar and H. Xiong (Boston, MA: Springer), 725–726.
Keywords: green space dynamics, institutional plots, urban planning, spatial analysis, urban development
Citation: Debebe U and Assefa A (2025) The evolution of green spaces within institutional plots in Yeka Sub-City, Addis Ababa, Ethiopia. Front. Sustain. Cities. 7:1491781. doi: 10.3389/frsc.2025.1491781
Edited by:
Victor L. Barradas, National Autonomous University of Mexico, MexicoReviewed by:
Manuel Esperon-Rodriguez, Western Sydney University, AustraliaCarlos Renato Ramos-Palacios, Autonomous University of San Luis Potosí, Mexico
Shi Xue, University of Illinois at Urbana-Champaign, United States
Copyright © 2025 Debebe and Assefa. This is an open-access article distributed under the terms of the Creative Commons Attribution License (CC BY). The use, distribution or reproduction in other forums is permitted, provided the original author(s) and the copyright owner(s) are credited and that the original publication in this journal is cited, in accordance with accepted academic practice. No use, distribution or reproduction is permitted which does not comply with these terms.
*Correspondence: Utant Debebe, dXRhbnRkZWJlYmUyMDAzQGdtYWlsLmNvbQ==