 Qiaohui Liu
 Tingting Yao
 Haozhi Tong
 Jiachao Peng
- School of Law and Business, Wuhan Institute of Technology, Wuhan, China
The increasing frequency of extreme temperatures poses significant threats to human habitats. Utilizing data from the China Family Panel Studies (CFPS) and the Chinese Residential Energy Consumption Survey (CRECS), this study examines the effects of extreme temperatures on household energy consumption in China from an adaptive behavior perspective. The results show that each additional day of extreme high temperatures increases household energy consumption by 3.437 yuan, while each additional day of extreme low temperatures raises it by 8.071 yuan. Moreover, extreme temperatures have notably stronger impact on the energy consumption of rural, low-income, and southern households, especially with regard to extreme cold. Extreme temperatures increase energy consumption primarily by altering residents’ adaptive behaviors: they compel households to reduce spending on food and medical care, shorten work hours, and increase the use of home thermostats devices. Specifically, for each day of extreme cold, household expenditures on food and medical care decrease by 23.217 and 21.212 yuan, respectively, residents’ work hours are reduced by 0.156 h, and households add 0.079 heating devices. This conclusion not only helps to scientifically evaluate the economic cost of extreme climate, but also provides important decision-making basis for households to enhances their resilience to energy-related risks and governments to optimize energy policies.
1 Introduction
Driven by the “dual-carbon” goal, energy consumption, particularly in the household sector, is garnering unprecedented focus in China. In fact, as a populous nation, China’s residential sector has become a major source of energy demand and carbon emissions, exerting a significant impact on the economy, society, and the environment (Liu et al., 2011; Fang et al., 2022). Amid rapid economic growth and increasing urbanization, there has been a clear upward trend in residential energy consumption. From 2010 to 2021, its share of total energy consumption rose from 10.63 to 12.83%, while industrial energy consumption decreased from 71.12 to 66.28%. Some developed countries even report higher residential than industrial energy consumption (Biesiot and Noorman, 1999). The critical role of household energy usage in national energy conservation, emission reduction, and the strategic direction of sustainable energy development highlights the need for a focus beyond mere statistical forecasts. Research should analyze factors influencing consumption behaviors and devise strategies to optimize the energy mix. Existing literature primarily explores economic (Galvin and Sunikka-Blank, 2018), demographic (Glasenapp et al., 2019), technological (You et al., 2024), lifestyle (Simcock and Mullen, 2016), and policy (Sun and Zeng, 2023) impacts on household energy use. However, the influence of climate change, particularly extreme temperatures, on energy consumption through adaptive behaviors remains underexplored and merits further investigation.
Recent years have witnessed a surge in extreme climate events such as extreme temperatures, heavy precipitation, and droughts, posing severe threats to human habitats (Dell et al., 2014). The Global Risks Report (2021) ranks climate extremes as the foremost among the top five risks expected in the next decade. The Blue Book on Climate Change in China (2023) describes China as a sensitive and significantly affected area in the context of global climate change, with a warming rate that notably exceeds the global average during the same period and an intensifying frequency of extreme high-temperature events. In 2022, China experienced 3,501 station-days of extreme high temperatures, the highest number since 1961. Among these, the highest temperatures were recorded in Beibei in Chongqing (45.0°C), Jiangjin (44.7°C) in Chongqing, and Zhushan (44.6°C) in Hubei, with a total of 366 station days where the maximum temperatures exceeded historical records. Extreme climate conditions have negative impacts on ecology (Sakka et al., 2012), economic output (Akhmat et al., 2014; Wei et al., 2023), life safety (Doremus et al., 2022), and social stability (Easterling et al., 2000), with governments and academics increasingly focusing on the sustainability issues posed by extreme temperatures. This prompts crucial questions: How do extreme temperatures alter household energy consumption through adaptive behavioral changes? To what extent? And is there heterogeneity in these effects among different groups? Answering these questions is essential for accurately assessing the economic costs of climate extremes and for providing crucial decision-making data for households and governments to improve their strategies for managing energy risks and optimizing energy policies.
The Third Assessment Report by the United Nations Intergovernmental Panel on Climate Change (IPCC, 2001) defines extreme climate events as rare climatic phenomena such as extreme temperatures, extreme precipitation, extreme droughts, and cyclones, occurring within a specific temporal and spatial context (IPCC, 2001). Compared to more general climate changes, these events pose more severe challenges to human development and social stability (Easterling et al., 2000; Chen and Li, 2023). Initial studies on climate extremes primarily analyzed their frequency and intensity (Alexander et al., 2006) along with their impacts on ecosystems (Easterling et al., 2000; Rosenzweig et al., 2001). In recent years, as the frequency of extreme climate events has increased, there has been a significant expansion in socio-economic impact assessments and the development of response strategies. The most immediate consequences of climate extremes include disruptions to ecosystems (Sakka et al., 2012), reductions in agricultural yields leading to food crises (Lee et al., 2024), and impairments to human health (Bhattacharya et al., 2003). Research on the nexus between extreme climate events and the economic and financial sectors remains nascent, predominantly qualitative. Some scholars have explored the impacts of extreme climate on the financial sector (Cevik and Jalles, 2022), poverty (Joos et al., 2001), labor productivity (Wei et al., 2023), and economic output (Hsiang et al., 2017; Kahn et al., 2021) from various perspectives. There is growing recognition in the literature of the substantial economic costs associated with climate extremes.
As the frequency, duration, and intensity of extreme temperatures rise, the issue of energy burden and structural transformation in energy usage becomes increasingly pronounced. Extreme temperatures pose significant challenges to human lifestyles, necessitating active or passive adaptations in clothing, food, housing, and transportation, which in turn influence household energy consumption levels and structures. However, most existing research on the determinants of household energy consumption primarily focuses on macro indicators such as economic development levels (Galvin and Sunikka-Blank, 2018), urbanization (Moustris et al., 2015), credit constraints (Xiang and Yue, 2023), and policy impacts (Sun and Zeng, 2023). At the micro level, the focus is largely on factors like household income or asset structures (Lan et al., 2023), and demographic size and composition (O'Neill et al., 2012). Although some literature has found a linear relationship between extreme temperatures and energy consumption (Glasenapp et al., 2019; Dell et al., 2014; Sakka et al., 2012; Doremus et al., 2022), the transmission mechanism of extreme temperatures affecting residential energy and its heterogeneity have not been fully explored. Based on this, this study investigates the influence of extreme temperatures on household energy consumption from the perspective of adaptive behaviors. Utilizing data from the China Family Tracking Survey (CFPS) and the China Household Energy Consumption Survey (CRECS), it empirically examines how annual extreme high and low temperatures impact household energy usage and explores the variability of these effects across different geographic and socio-economic contexts. Additionally, the study considers how extreme temperatures influence household energy consumption by altering adaptive behaviors such as food and healthcare spending, working hours, and thermostat usage frequency. Findings indicate that each additional day of extreme high temperature increases household energy consumption by 3.437 yuan; conversely, extreme low temperatures increase consumption by 8.071 yuan. The impact of extreme low temperatures is notably more significant than that of high temperatures. Heterogeneity analysis shows that southern, rural, low-income, and vulnerable households are more susceptible to temperature shocks. Adaptations to extreme weather include reduced food and healthcare spending, fewer working hours, and more frequent use of thermostats, ultimately elevating household energy consumption.
This paper presents several innovations: First, in the context of frequent extreme temperatures in China, it assesses the impacts of both extreme high and low temperatures on household energy consumption, thereby broadening the scope of research on the economic costs of extreme climate and providing empirical evidence from Chinese micro households on the relationship between extreme temperatures and energy usage. Second, from the perspective of adaptive behavior, it examines how extreme temperatures lead vulnerable households to increase energy expenditures, which not only crowds out essential spending on food and healthcare, adversely affecting health, but also reduces work time. This contributes to the broader discourse on how climate extremes may affect the health and social wellbeing of susceptible groups. Moreover, the use of thermostatic devices such as air conditioners emerges as a vital protective measure against extreme temperatures, highlighting the importance of reducing costs associated with modern energy technologies and accelerating the energy consumption structural transformation in rural and low-income households. These insights significantly support China’s “dual-carbon” objectives. Third, the study empirically examines the heterogeneous impacts of climate extremes on the energy consumption of rural and urban households and those across different income levels, offering critical data for both household decision-making to enhance risk management and governmental policy optimization.
2 Theoretical analysis and research hypothesis
2.1 Climate extremes influence household energy consumption via adaptive behaviors
Extreme heat and cold significantly affect household energy consumption, primarily because these temperatures trigger adaptive behaviors among residents. Firstly, when faced with extreme temperatures, the most immediate response from residents is to use cooling and heating equipment to enhance indoor comfort. With rising household incomes and the popularity of household appliances, households can combat the adverse effects of extreme climate on comfort by using thermostatic tools (Davis and Gertler, 2015), such as air conditioning to create a comfortable environment (Yu et al., 2019), thereby increasing household energy consumption. In hotter climates, the need for cooling is higher, leading households not only to use installed air conditioners more frequently but also to purchase and install additional air conditioning equipment to adapt to prolonged climate shocks (Auffhammer and Mansur, 2014). Several studies have confirmed the role of thermostatic tools in mitigating the negative impacts of climate change (Pavanello et al., 2021; Li et al., 2024). In cold climates, home heating equipment is used more frequently, resulting in increased electricity and natural gas consumption. In extreme low temperatures, most households in northern China and some in the southern China use natural gas to ward off the cold.
Extreme temperatures not only directly increase residents’ use of cooling and heating facilities, but also extend residents’ indoor activity time, increase their energy demand for indoor lighting, entertainment and living facilities, and indirectly lead to an increase in household energy consumption. In response to extreme temperatures, people reallocate their time between outdoor work and indoor leisure (Zivin and Neidell, 2010), opting to stay indoors to cope with harsh climatic conditions (Zander et al., 2015). Using data from a survey in China, some scholars reached a similar conclusion: to mitigate the adverse effects of temperature shocks, laborers reduce their exposure to heat, with farmers and women being more sensitive (Huang et al., 2020; Li and Pan, 2021; Garg et al., 2020). There is no doubt that when people spend more time indoors, they will use indoor lighting, heating or cooling equipment more frequently (Han et al., 2010). Turning on lights, heating or air conditioning will definitely increase the energy consumption of the household (Wu et al., 2023).
Lastly, according to the mobility budget constraint theory, due to the unpredictability of extreme climate, households may prioritize ensuring energy expenditure in the face of sudden temperature shocks, because energy consumption (such as heating and cooling) is a necessary means to directly cope with extreme temperature (Simcock and Mullen, 2016). Extreme climate conditions force residents to weigh energy consumption against other essential expenditures like food and healthcare, especially in low-income households (Bhattacharya et al., 2003). Therefore, with a certain income, households tend to reduce food and medical consumption to maintain the total expenditure within the budget. At the same time, from the perspective of consumption structure, the main living expenses of Chinese residents are food and medical expenses. Extreme temperatures force households to adjust their consumption structure and reduce the expenditure on food and medical care to cover the energy consumption (Roson et al., 2006). Especially for rural households and low-income households, their income is generally low, and the additional energy demand brought by extreme temperatures causes greater economic pressure, forcing these vulnerable groups to adjust their consumption structure and reduce living expenses such as food and medical care (Beatty et al., 2014). In their study on how UK households respond to cold weather, Beatty et al. (2014) found that households cut back on food spending to afford extra heating costs, with poorer households reducing their food expenditure more significantly (Beatty et al., 2014). It has been found that extreme temperatures increase the consumption gap between the rich and the poor because low-income households are more likely to cut down on daily necessities to pay for energy bills (Doremus et al., 2022). Simultaneously, extensive existing literature suggests that climate extremes are closely linked to the physical and mental health of the population (Doremus et al., 2022; White, 2017). The return on healthcare spending is a longer life or more time in good health. Under extreme temperatures, consumers must invest more health capital to achieve the same level of utility, thus extreme temperatures significantly reduce the utility level of health capital investments, affecting residents’ willingness to invest in health capital. With personal income levels constant, residents will subsequently adjust their daily expenditures, such as healthcare and food, i.e., extreme temperatures have a crowding-out effect on residents’ healthcare expenditures. Chirakijja et al. (2019) found that higher home heating costs reduce health-promoting expenditures, thus increasing mortality, especially in low-income areas (Chirakijja et al., 2019). In summary, the additional energy costs associated with extreme climates crowd out household spending on food and healthcare. Based on this, this paper presents the research hypothesis.
Hypothesis 1: Households escalate their energy expenditure in response to extreme temperature shocks.
Hypothesis 2: Extreme weather influences household energy consumption predominantly through adaptive behaviors, which include increasing thermostat usage frequency, reducing work hours, and adjusting expenditures on food and healthcare.
2.2 Heterogeneous impacts of climate extremes on household energy consumption
The severity of impacts from extreme events is determined not only by the events themselves but also by exposure and vulnerability (IPCC, 2012, 2021). Therefore, the extent to which extreme temperatures affect household energy consumption may vary based on household income levels, urban or rural status, and geographic location. The Energy Ladder Hypothesis suggests that income primarily influences energy consumption structure, with higher incomes facilitating a shift from traditional to cleaner, more efficient, low-carbon energy sources (Hosier and Dowd, 1987). Due to budget and wealth constraints, most low-income households cannot quickly transition to a low-carbon consumption pattern, making them more susceptible to extreme temperatures. The cost of managing extreme temperatures can be unaffordable for low-income households (Hernandez, 2016). For instance, in Greece, the heating and cooling burden for low-income households is nearly double that of wealthier ones (Santamouris et al., 2014). Adapting to extreme temperatures requires households to reallocate resources to cooling or heating expenses, leading to energy poverty. Households lacking emergency savings and reliant on credit may be particularly sensitive to unusually high energy bills (Doremus et al., 2022). Studies have shown that low-income populations struggle to meet their specific energy needs in extreme temperatures (Bhattacharya et al., 2003), resulting in indoor environments that fail to meet comfortable and healthy standards (Santamouris and Kolokotsa, 2015). Extreme temperatures not only exacerbate the energy poverty gap among households with varying incomes (Beatty et al., 2014) but also create disparities in expenditures on essentials like food (Doremus et al., 2022) and mortality rates (Chirakijja et al., 2019).
Differences in production and living styles, types of employment, and choices and uses of fuels contribute to significant disparities in energy consumption between urban and rural residents (Bonatz et al., 2019). Energy consumption patterns also differ due to distinct characteristics of residential buildings in urban and rural settings (Niu et al., 2016; Chen et al., 2011) observed that energy consumption in urban and rural households is differently affected by variations in public energy infrastructure, such as heating facilities (Chen et al., 2011). Additionally, there is a notable difference in energy efficiency between urban and rural areas, with biomass remaining the primary energy source in rural areas, where overall energy efficiency is approximately 33% (Wu et al., 2019). Importantly, rural poor households are more involved in land-intensive agriculture, which is highly sensitive to climate risks and comparatively disadvantaged. Furthermore, the timeliness and robustness of energy supply are crucial for enhancing resilience to climate extremes (Longden et al., 2021), especially in vulnerable regions (Nguyen et al., 2019). In China, rural power infrastructure is relatively underdeveloped, and extreme weather conditions increase the frequency of power outages, potentially exacerbating energy security issues in remote rural areas.
Geographic differences significantly affect household energy consumption in response to climate extremes between northern and southern China. Firstly, climate extremes inherently exhibit greater geographic variability than general climate conditions, leading to uneven impacts across different regions (Ajzen, 1991). China’s vast expanse shows notable differences in extreme temperatures between the north and south (Ding et al., 2011). Secondly, heating practices vary between these regions. The Qinling-Huaihe line demarcates centralized heating in China, defining the boundary between the northern and southern areas, with regions north of this line using centralized heating. However, the southern climate is humid, making the same temperature feel very different in the north and south. In the context of warm winters, the intensification of cold waves poses severe threats to the lives and health of southern residents, forcing them to adopt self-heating methods that consume more energy to cope with extreme low temperatures. Consequently, under the current fixed heating strategy, the actual heating energy consumption in China shows a pattern of “more in the south and less in the north, lower in the west and higher in the east” (Li et al., 2019). It is foreseeable that extreme temperatures will differentially impact household energy consumption across China’s northern and southern regions.
In summary, increased extreme temperatures have led to higher household energy consumption, but the impact varies; households in low-income, rural, and Southern regions have a weaker capacity to afford or are faced with higher energy costs due to climate extremes. Based on this, we propose the following hypothesis.
Hypothesis 3: Households in low-income, rural, and southern regions are more sensitive to energy consumption under extreme temperature shocks.
3 Model construction, variable definition, and data description
3.1 Model specification
To evaluate the research hypotheses, the following baseline regression model is constructed to assess the impact of extreme temperatures on average annual household energy consumption:
In the Equation (1), represents a household, represents the prefecture-level city or above where the household is located, and represents a specific year. The dependent variable is the energy expenditure of household in region for the year . Extreme high temperatures are measured by the number of days the average temperature in city exceeds the 90th percentile threshold in year ; extreme low temperatures are measured by the number of days the average temperature in city falls below the 10th percentile threshold. includes control variables at the household and regional levels. Additionally, , , and serve as fixed effects for households, areas, and years, respectively.
3.2 Definition and description of variables
3.2.1 Dependent variable
This paper’s analysis of household energy consumption includes electricity, fuel (gas, liquefied petroleum gas, coal, firewood, charcoal, etc.), and central heating expenses. Since the fuel and electricity expenses reported in the China Family Panel Studies (CFPS) database are monthly, this study calculates annual household energy expenditure as follows:
In the Equation (2), and represent monthly electricity and other fuel expenses respectively, while refers to the annual centralized heating cost. This calculation is based on two core reasons: First, empirical data are derived from the China Family Panel Studies (CFPS) and the China Resident Energy Consumption Survey (CRECS). Both of these micro databases collect samples on an annual basis. The consumption data for electricity and other fuels are reported as monthly averages, without providing detailed variations from month to month. Second, In the energy consumption of Chinese households, the cost of concentrated heating accounts for a significant proportion. But the CFPS and CRECS databases provide the total annual heating costs for households, rather than monthly data or monthly averages. If we only use monthly data, we would fail to fully capture the impact of heating costs on total household energy consumption expenditure, as there is no monthly heating cost data available. In order to ensure the accuracy of the results, further robustness tests using the China Household Energy Consumption Survey (CRECS) database are conducted later.
3.2.2 Main explanatory variable
This paper measures extreme temperatures using extreme high and low temperatures. Given the distinct climatic characteristics across different regions in China, it is more appropriate to determine the thresholds for extreme temperatures using the relative threshold method, which is a widely applied percentile method internationally (Schär et al., 2016; Pan et al., 2022). The period 1971–2000 is set as the climatic reference period. Using daily observational data from meteorological stations during this period, and the percentile relative threshold method, we define the thresholds for extreme temperatures in various regions, thereby calculating the number of days with extreme temperature events annually for the sample period 2014–2020. Specifically, temperatures for the same date (from January 1st) in each year of the reference period are sorted in ascending order, setting the 10th and 90th percentile values as the thresholds for extreme low and high temperatures, respectively. A day when the maximum temperature exceeds the 90th percentile threshold in the reference period is considered an extreme high temperatures event; the same method applies to extreme low temperature events. Finally, daily data are aggregated to summarize the annual climate profile of extreme temperature occurrences.
Figure 1 illustrates the spatial distribution and temporal dynamics of extreme temperatures in China for the years 2014, 2016, 2018, and 2020. As depicted, remote areas in China exhibit a higher frequency of extreme temperatures, corroborating the findings of Huang et al. (2014).

Figure 1. Distribution of extreme temperatures in China. (A–D) Depict the national occurrences of extreme high temperatures in 2014, 2016, 2018, and 2020, respectively, while (E–H) illustrate the occurrences of extreme low temperatures in those same years. These charts were created using RStudio software.
Figure 2 clearly illustrates the correlation between extreme temperatures and the energy burden of households across different income levels and between urban and rural areas. The bubbles in different colors represent different family groups, with the size of the bubbles reflecting the number of families in each group. The six gray bubbles in the lower left corner show the average energy burden of families under different frequencies of extreme temperature events. The results indicate: (1) in 2012, in areas where extreme temperatures are frequent, the median energy burden of households was about 5.2%, this proportion increased to approximately 7.0% by 2018. This change suggests that the increasing frequency of extreme weather events has indeed exacerbating residents’ energy burdens. (2) In 2012, households in areas with a low frequency of extreme temperatures had median energy burdens ranging from 1.5 to 8.3%, with no significant poverty-related differences. However, by 2018, households in high-frequency areas continued to bear the highest energy burden, with poorer households experiencing an increase in median energy burden to about 18.5%, while the change for wealthier households was not significant. This indicates differing impacts of extreme weather on households with varying income levels. (3) In 2012, the energy burden levels of rural and urban families were similar. By 2018, the gap between these groups had noticeably widened. While the energy burden for urban households remained stable, that of rural households increased significantly, indicating that extreme temperatures impact urban and rural households differently.
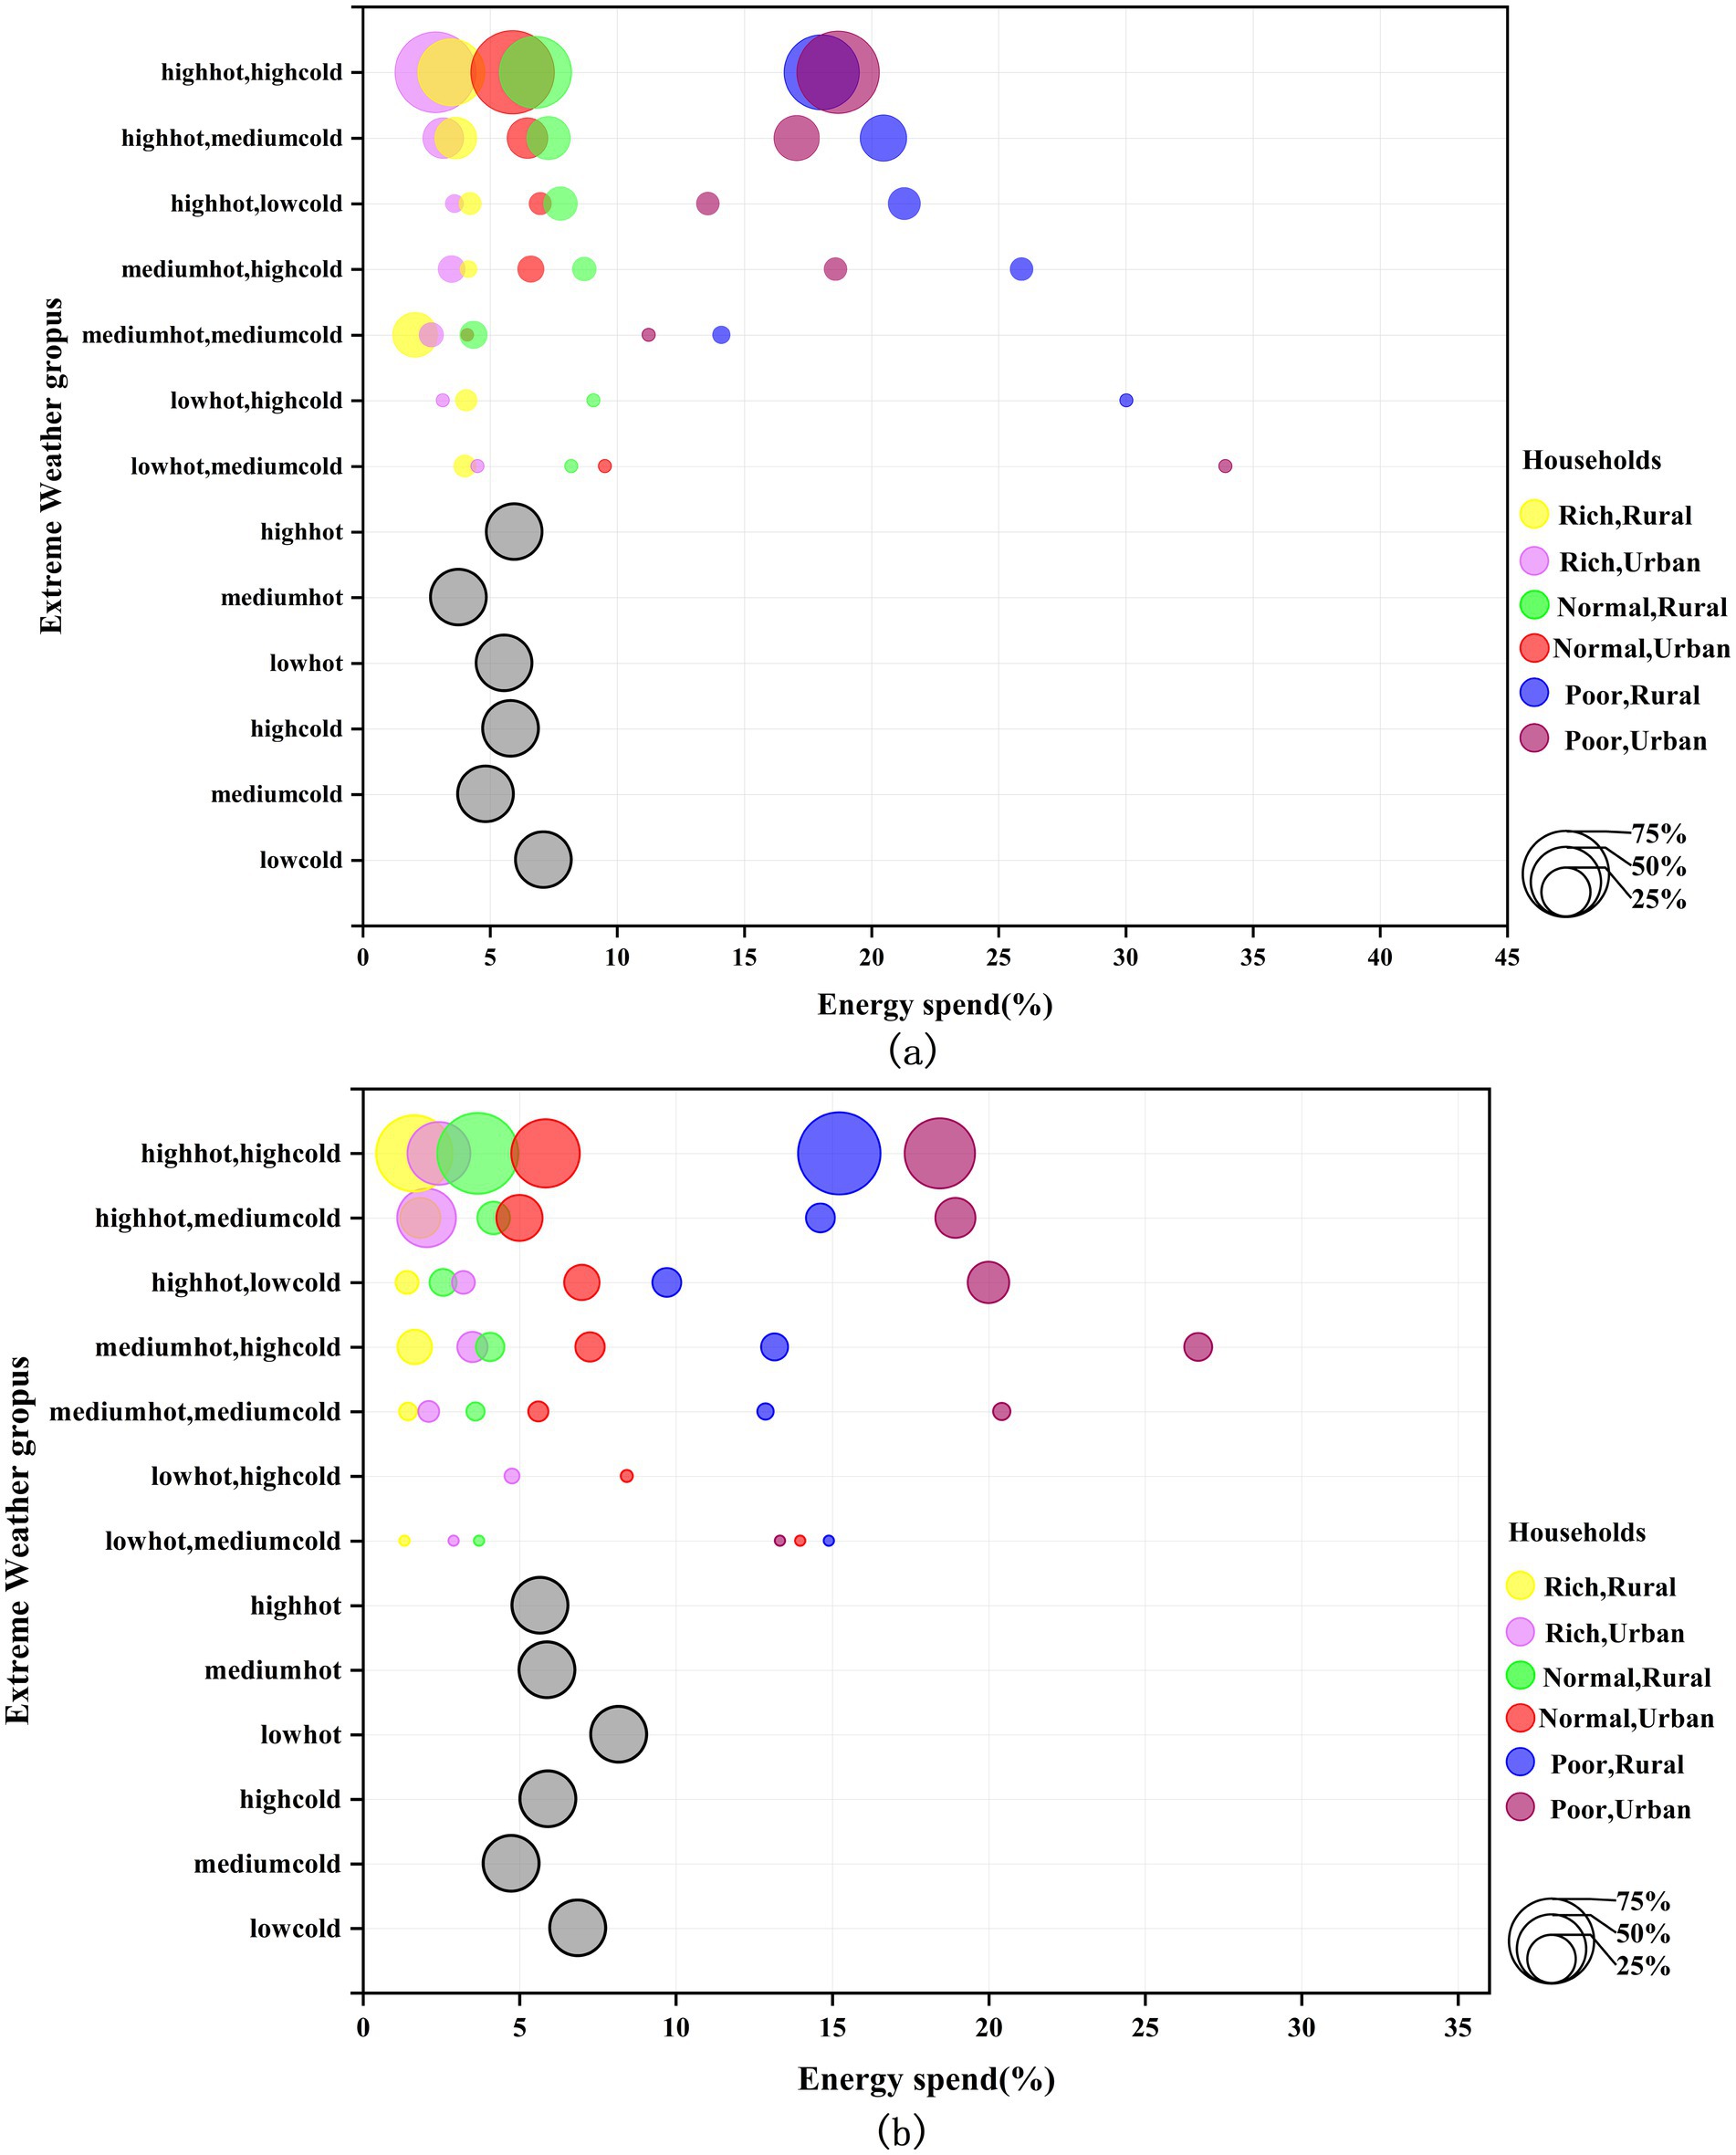
Figure 2. Distribution of Median Household Energy Burden by Urban and Rural Households, Income Groups, and Regions. (A) Displays household energy use in 2012, and (B) shows energy use in 2018. “highhot,” “mediumho,” and “lowhot” represent areas with high, medium and low incidence of extreme heat events, respectively. “highcold,” “mediumcold,” and “lowcold” represent areas with high, medium and low incidence of extreme cold events, respectively. “Rich” refers to high-income households comprising 25% of the total, “Normal” represents the average households making up 50%, and “Poor” denotes low-income households comprising 25%. “Urban” and “Rural” distinguish between urban and rural households, respectively. This figure was created using MATLAB and Origin software.
3.2.3 Control variables
To effectively identify the impact of extreme temperatures on household energy consumption behavior, this study controls for various factors that may influence energy use. Regionally, we adjust for GDP, education level (edu), urban population density (people), and local fiscal expenditure (fiscal), applying logarithmic transformations to these variables. At the household level, we control for residential housing type (type), use of clean energy (clean, assigned a value of 1 if cooking fuel is electricity, natural gas, gas/LPG, solar energy, or biogas, and 0 otherwise), acceptance of government subsidies (subsidy, assigned a value of 1 if subsidized), presence of financial assets (finance, assigned a value of 1), household net income (faminc_net), total household expenditure (expense), family size (familysize), use of clean energy (clean, assigned a value of 1 if cooking fuel is electricity, natural gas, gas/LPG, solar energy, or biogas, and 0 otherwise), age of the head of household (age), the size of house (zone) and whether it changed during the year (change, assigned a value of 1 if changed). Additionally, considering that household consumption might be affected by other regional socio-economic factors, year fixed effects are incorporated into the control variables. Table 1 presents the descriptive statistics for these variables.
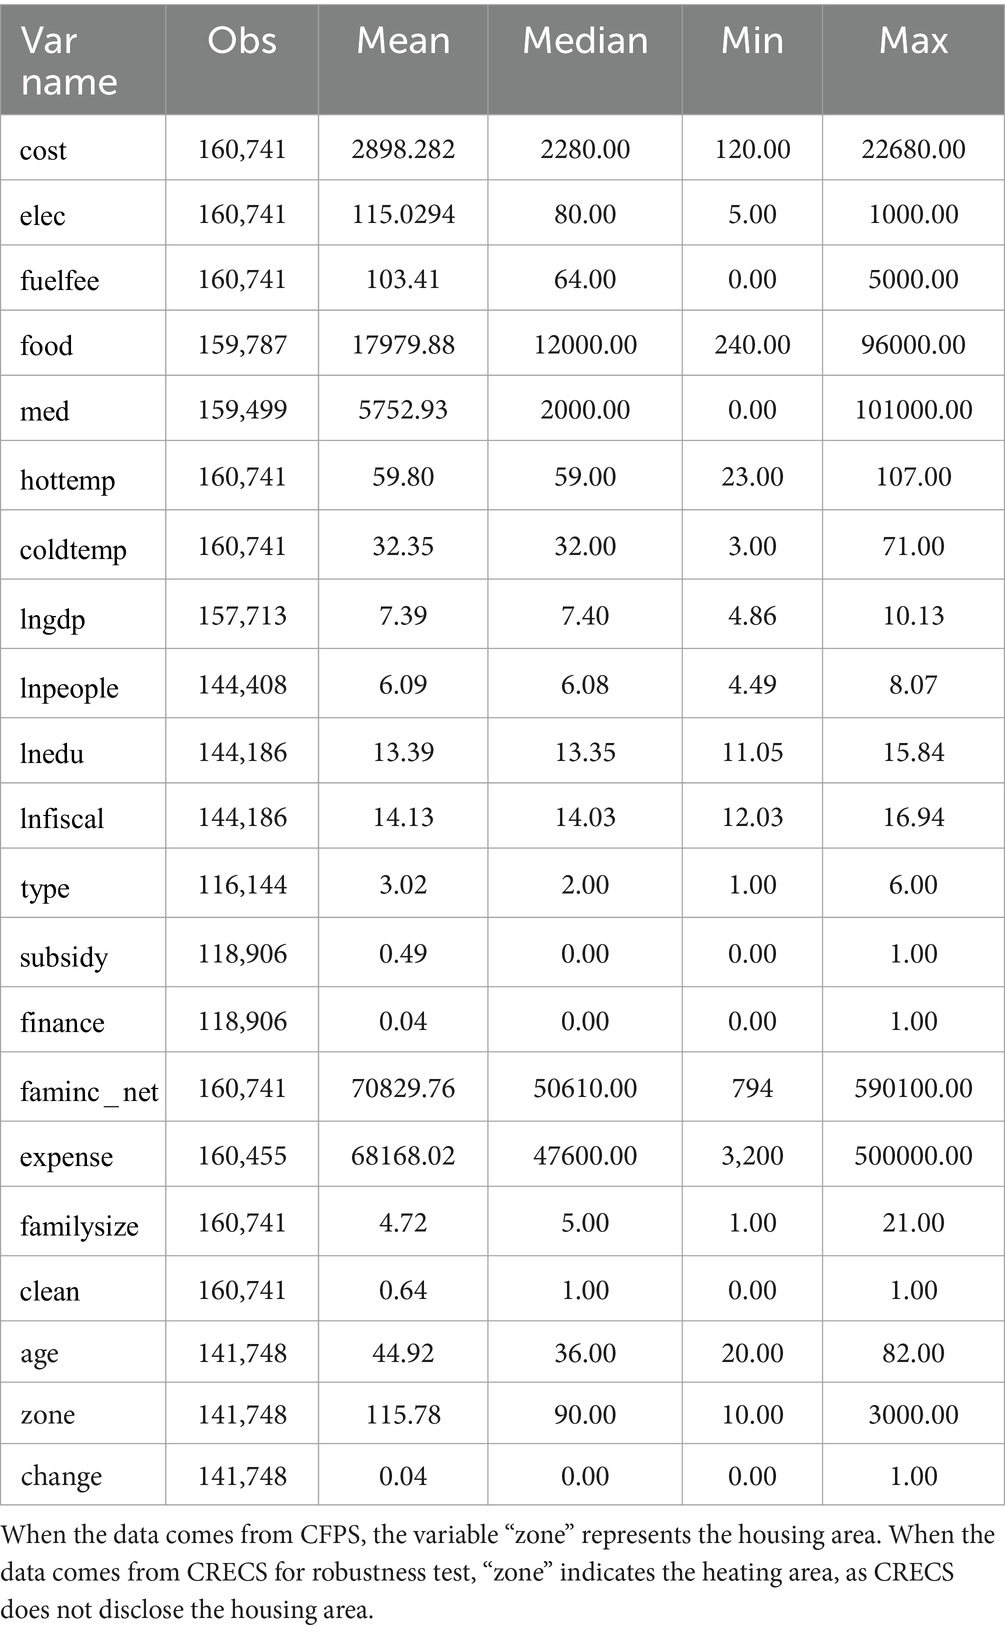
Table 1. Descriptive statistics of variables.
3.2.4 Data sources and sample selection
The data for this study primarily come from the China Family Panel Studies (CFPS) database. The city code data in this paper comes from Gao et al. (2024). Due to the unavailability of direct disclosures of electricity expenditure and household net income for 2010 and 2012, this analysis utilizes data from four survey rounds: 2014, 2016, 2018, and 2020. For robustness, household energy consumption data are sourced from the Chinese Residential Energy Consumption Survey (CRECS). Extreme temperature data are obtained from the National Meteorological Science Data Center (NMSDC). Control variables are derived from the China Urban Statistical Yearbook (CUSY) and the National Bureau of Statistics (NBS) website. Since the CFPS database does not reveal the prefecture-level cities of individuals, this study matches data based on provincial GB codes and household identifiers. The analyzed sample ultimately encompasses 104 prefecture-level cities with a total of 160,741 individuals across 4,994 households, forming an unbalanced panel dataset.
4 Empirical results and analysis
4.1 Baseline estimation
Table 2 reports the regression results on the impact of extreme temperatures on household energy consumption. Column (1) shows the effects of extreme temperatures on total household energy use, with both extreme high and low temperature days having significantly positive regression coefficients, indicating that extreme temperatures increase household energy consumption. Column (2) builds on Column (1) by including household, regional, and time fixed effects, with the coefficients for extreme temperatures remaining significantly positive. Specifically, each additional day of extreme high temperatures increases household energy expenditures by 3.437 yuan; each additional day of extreme low temperatures increases energy consumption by 8.071 yuan. Extreme low temperatures have a more pronounced impact on energy consumption compared to extreme high temperatures, and the possible reasons mainly include the following: First, under extreme low-temperature conditions, to maintain a suitable indoor temperature, residents need to consume more energy for heating, especially in areas without centralized heating systems. Secondly, energy conversion efficiency is also an important factor. The energy conversion efficiency of heating systems, especially resistive heaters, is usually lower than that of cooling systems. This means that to obtain the same amount of heat, heating systems need to consume more electrical energy. Lastly the insulation performance of buildings also has a significant impact on energy consumption. Many buildings are designed with more consideration for cooling needs in the summer, which may result in more heat loss in the winter. Therefore, to maintain indoor temperature, more energy is needed to compensate for the heat loss. The regression coefficients of the control variables are basically consistent with the theoretical expectations. At the regional level, economic growth level, government financial expenditure, population density and education level are positively correlated with household energy consumption. At the household level, the increase in government subsidies, net household income and household size will lead to an increase in household energy consumption, while households’ financial investment behavior will crowd out energy consumption expenditure. In terms of personal characteristics, the older the age, the less energy consumption.
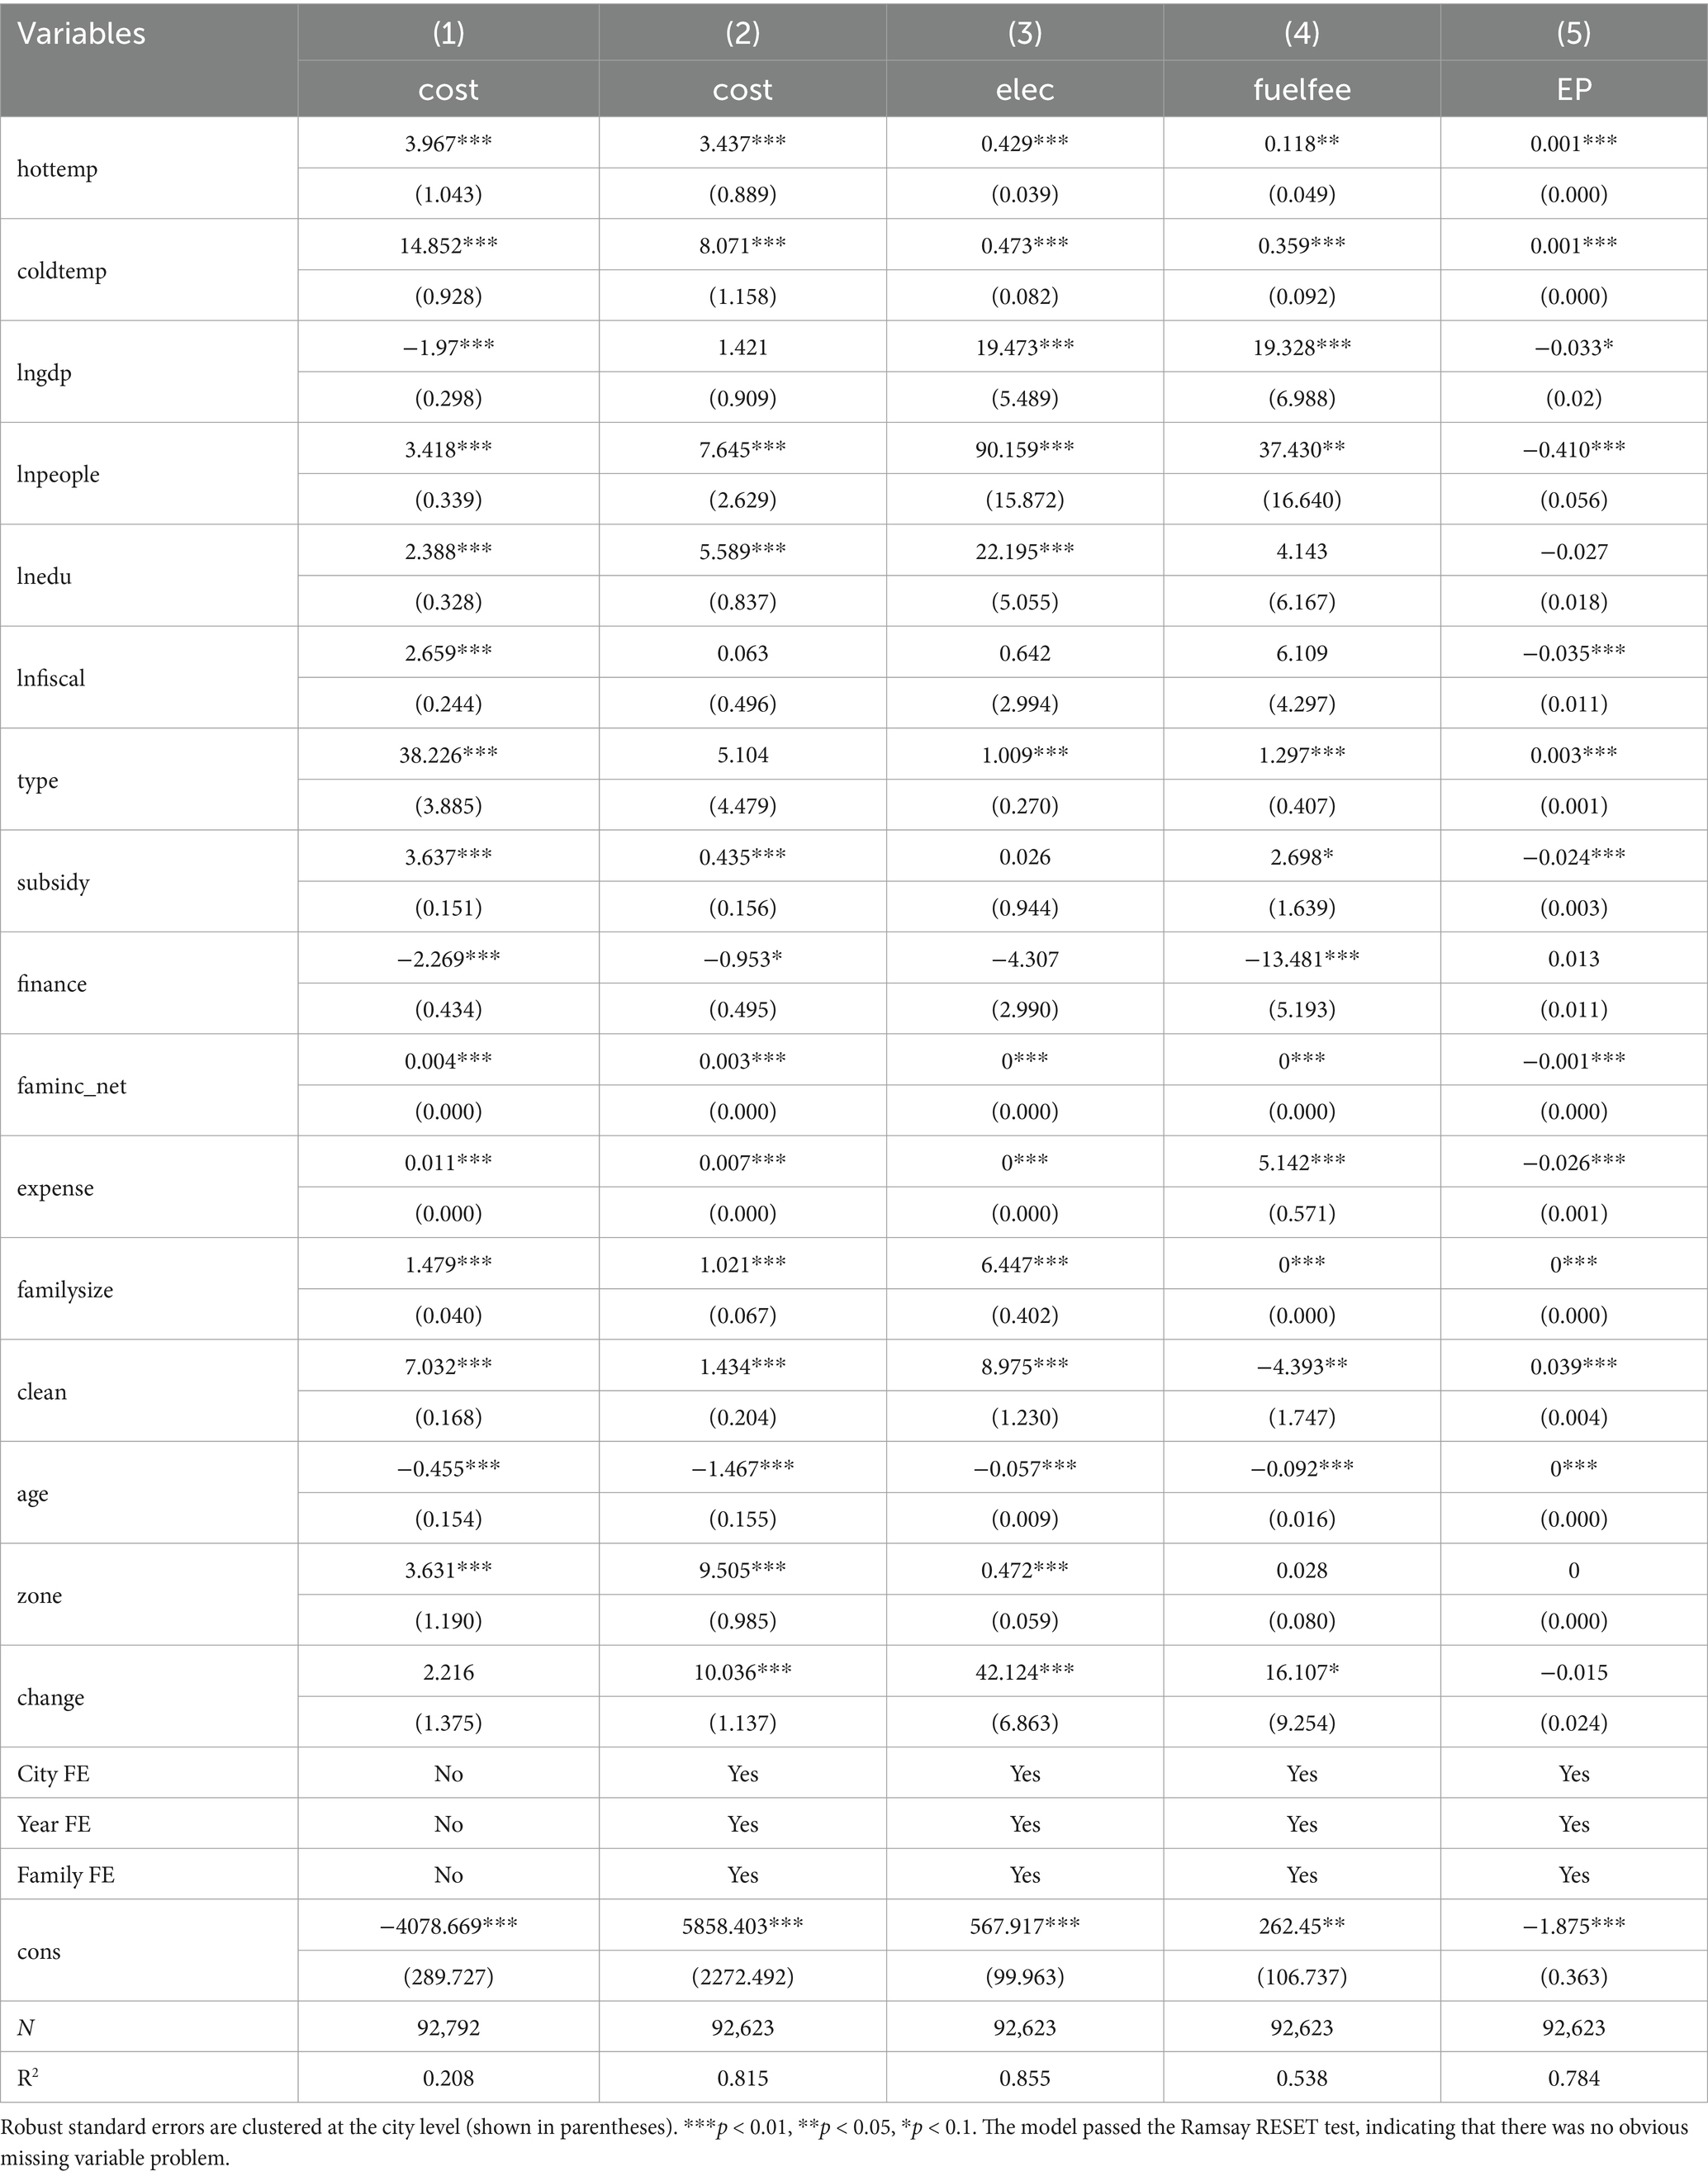
Table 2. Baseline estimation.
Columns (3, 4) assess the effects of extreme temperatures on electricity and fuel consumption, respectively. The results indicate that fuel consumption significantly increases under both extreme conditions, with a greater impact from extreme low temperatures. Extreme temperatures significantly increase the consumption of electricity and fuel, with the impact on electricity consumption being particularly pronounced. The reasons are as follows: In the case of extreme high temperatures, in order to reduce indoor temperatures, residents will greatly increase the use of air conditioning and other cooling devices, leading to a sharp rise in electricity consumption (Yu et al., 2019). In the case of extreme low temperatures, to maintain indoor warmth, the frequency and intensity of heating equipment use will significantly increase. Especially in areas without centralized heating systems that mainly rely on electricity as a heating source, the increase in electricity consumption is particularly noticeable (Guo et al., 2015).
Furthermore, the paper analyzes the impact of extreme temperatures on energy poverty, as shown in column (5). It is noted that a ratio of energy cost to net household income over 10% is considered energy poverty (Charlier and Kahouli, 2019). Results in column (5) show that both extreme high and low temperatures bring varying increases to household energy burdens.
4.2 Robustness test
4.2.1 Replace the measurement of extreme temperature
Due to China’s wide geographical distribution and large regional climate differences, the impact of extreme temperature events defined by relative threshold method on the household energy consumption in different regions may vary. Therefore, this paper replaces the measurement method of extreme temperature and adopts the method of Han (Charlier and Kahouli, 2019). When the daily average temperature exceeds 38°C, it is judged as an extreme high temperature day. An extremely low temperature day is defined when the daily average temperature reaches −10°C (Han et al., 2018). The regression results are shown in columns (1–3) of Table 3, which indicates that the replacement of the measurement method does not change the conclusion of the benchmark regression.
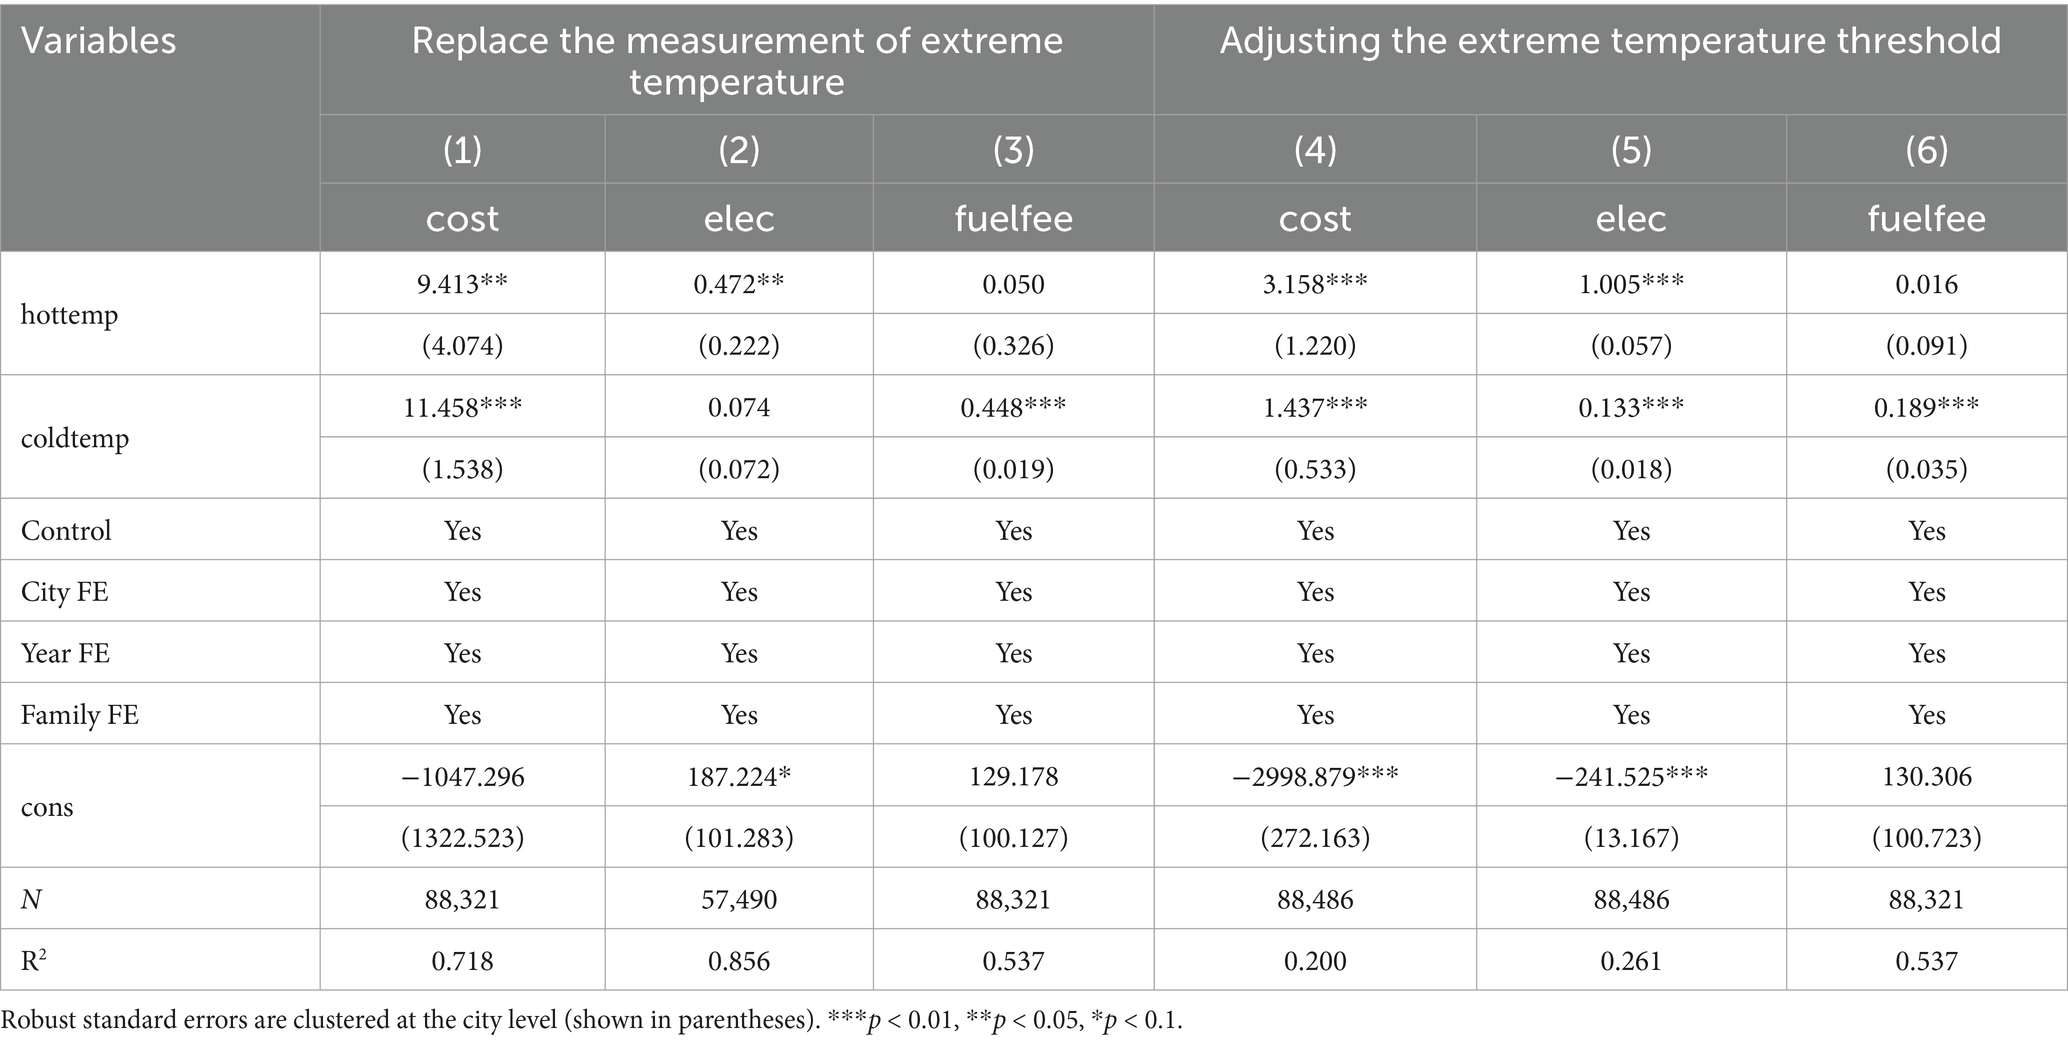
Table 3. Replace the measurement of extreme temperature and adjusting the extreme temperature threshold.
4.2.2 Adjusting the extreme temperature threshold
To further examine the impact of extreme temperatures on household energy consumption, we adjusted the threshold ranges for extreme high and low temperatures, respectively. Specifically, the extreme high temperature threshold is increased from 90 to 95%, and the extreme low temperature threshold is decreased from 10 to 5%. The regression results after adjusting the threshold are shown in columns (4–5) of Table 3 which are consistent with the conclusions of the benchmark regression.
4.2.3 Database substitution
To ensure the reliability of the results, this paper utilizes data from the Chinese Residential Energy Consumption Survey (CRECS) for robustness checks. Specifically, it calculates annual total household energy consumption by summing expenditures on electricity and eight other types of energy (central heating, piped natural gas/coal gas, bottled liquefied gas, honeycomb coal/briquettes, diesel, other fuel oils, firewood/straw, and biogas) from the CRECS. Due to limitations in the continuity and availability of key indicators, only the CRECS data from 2015, which surveys the year 2014, was used, and extreme temperature data were matched to produce a one-year cross-sectional dataset. Regression results using the CRECS are presented in columns (1–2) of Table 4. Columns (1, 2) respectively estimate the impact of extreme temperatures on electricity and fuel expenditures. The results indicate that both extreme high and low temperatures cause varying increases in electricity and fuel consumption. This demonstrates that the core finding—that extreme temperature fluctuations lead to increases in household energy expenditures—remains consistent across different databases. Hypothesis 1 is thus reaffirmed.
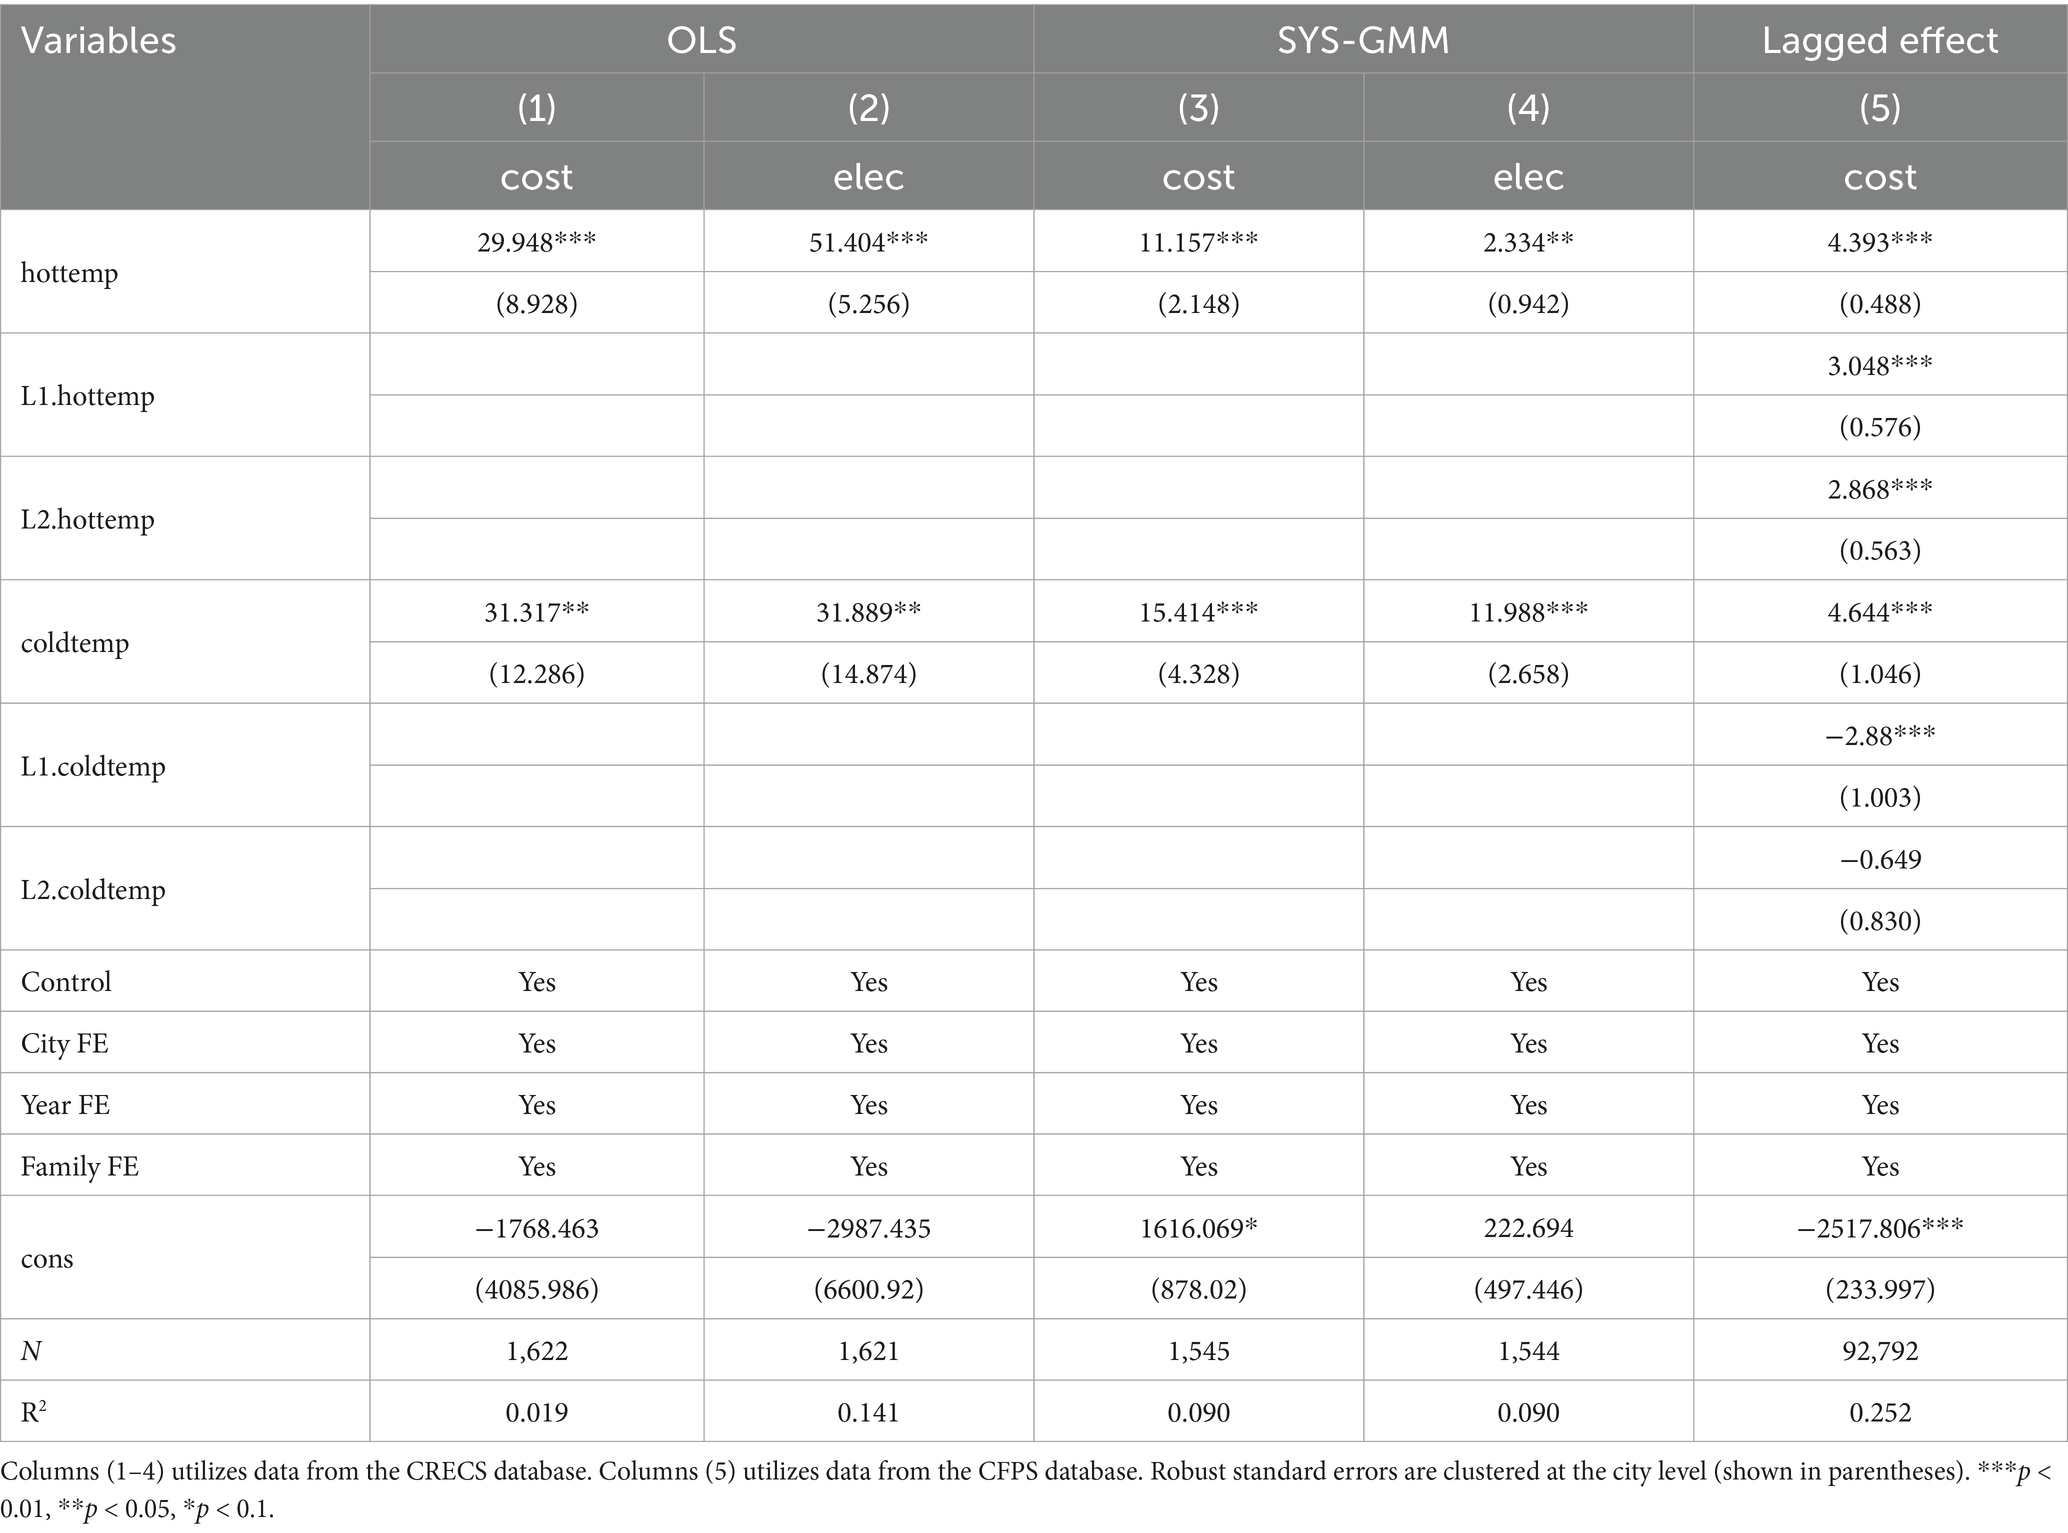
Table 4. Robustness test.
4.2.4 Changing the analytical method
To address potential biases in OLS estimates, this study also employs the System Generalized Method of Moments (SYS-GMM) for estimation (Peng et al., 2023). The regression results from changing the econometric method are displayed in columns (3, 4) of Table 4. The results indicate that each additional day of extreme high temperatures increases total energy and electricity expenditures by 11.157 and 2.334 yuan, respectively; similarly, each day of extreme low temperatures increases total energy and electricity expenditures by 15.414 and 11.988 yuan, respectively. These findings are consistent with the baseline regression results.
4.2.5 Sensitivity test
Considering the significant advancements in weather forecasting technology, residents are now able to predict extreme temperature events with greater accuracy. This ability prompts them to anticipate future weather conditions based on the frequency of previous extreme temperature events, and adjust their current household energy consumption accordingly. For instance, in areas that frequently experience extreme heat, residents may anticipate the coming extreme high temperatures purchase air conditioners or increase power supply in advance to cope with the expected heatwaves. To reflect this expected behavior and accurately assess the impact of extreme temperatures on energy consumption, we incorporated the lagged first and second periods of extreme high and low temperatures into the original benchmark model for regression (Doremus et al., 2022).
The regression results are presented in columns (5) of Table 4. Even after controlling the first-order and second-order lag terms, the coefficients of extreme high temperature and extreme low temperatures remain significantly positive at the significance level of 1%. Specifically, for each additional day of extreme heat, the household energy consumption increases by 4.393 yuan, suggesting that the current hot weather significantly increased energy consumption and that this effect would persist over the next two periods, although its effect would diminish over time. With regard to the effect of extreme low temperatures, we observed an interesting phenomenon: although the immediate effect of low temperatures also leads to an increase in energy consumption, this effect decreases over time. This may reflect households adapting to prolonged cold temperatures, such as using less air conditioning and switching to more energy-efficient central heating systems. Thus, hypothesis 1 is further confirmed.
4.3 Endogeneity test
To address the potential endogeneity issues in the relationship between extreme temperatures and household energy consumption due to reverse causality and omitted variables, this study employs atmospheric ozone concentration data at the municipal level as an instrumental variable for extreme temperatures. Increases (decreases) in atmospheric ozone concentration reduce (enhance) UV radiation, thereby lowering (raising) surface temperatures. There is an undeniable correlation between atmospheric ozone levels and temperature. However, ozone concentrations in the atmosphere do not directly impact household energy expenditures, thus meeting the criteria for an instrumental variable. Table 5, columns (1, 3), display the first-stage regression results of the two-stage least squares (2SLS) approach, showing a significant correlation between atmospheric ozone concentration and both extreme high and low temperatures. Moreover, the first-stage F > 10, indicating a valid choice of instrumental variables. Columns (2–4) present the second-stage estimation results. It is found that even after addressing endogeneity concerns, extreme temperatures continue to have a significant positive impact on household energy consumption expenditures.
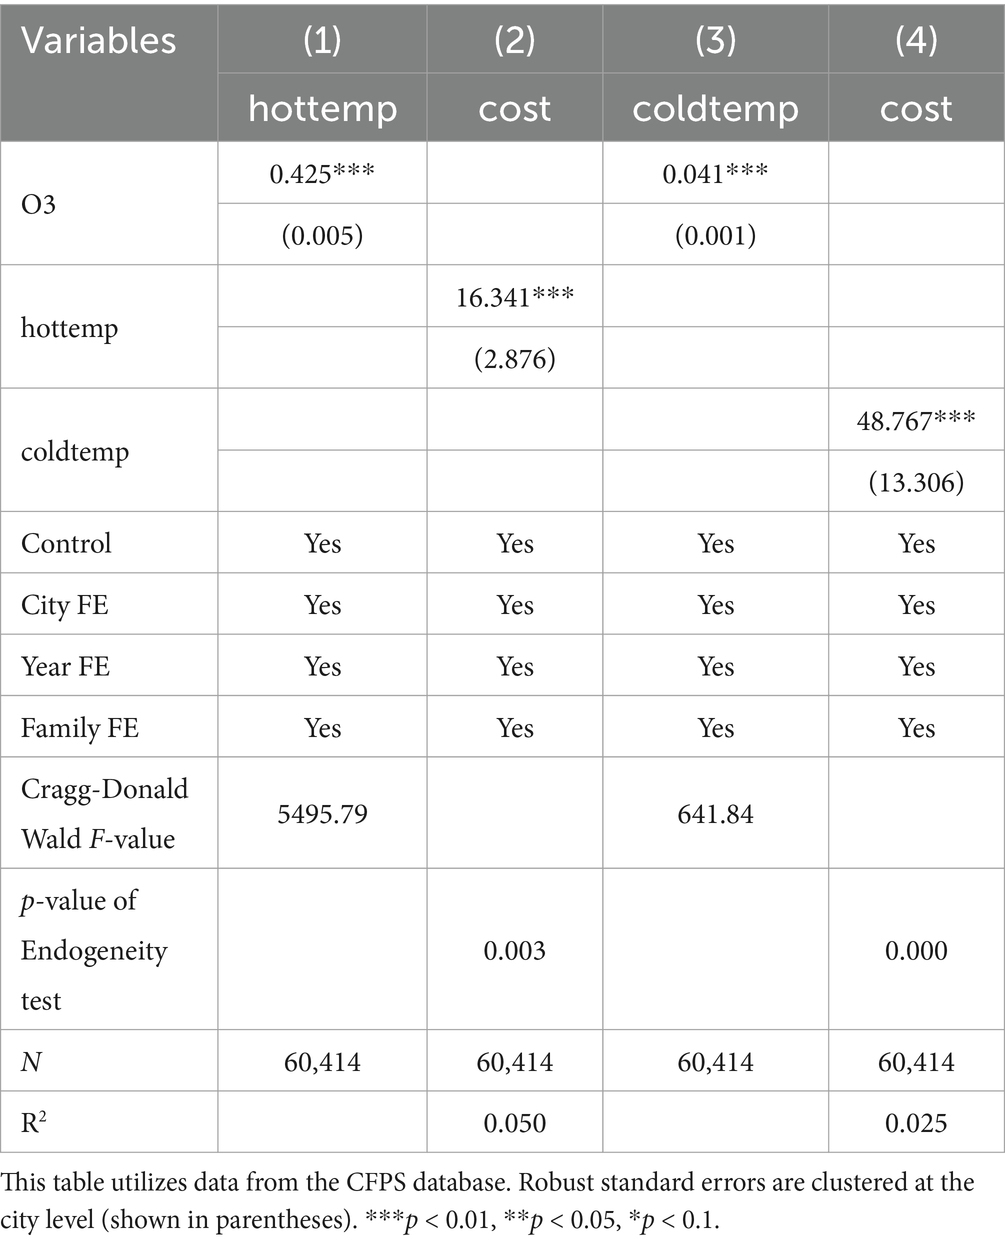
Table 5. Endogeneity test: using ozone concentration as an instrumental variable.
4.4 Heterogeneity analysis
Analyzing which groups are more sensitive to extreme temperatures is crucial for implementing targeted energy policies and achieving precision poverty alleviation in China. Theoretical analysis indicates that the impact of extreme temperatures on household energy consumption may vary across urban and rural areas, different regions, and income levels. This paper utilizes the Seemingly Unrelated Regression (SUR) test for analysis, which has the advantage of relaxing the strict assumptions of consistent control variable coefficients and the same distribution of error terms across groups, providing more reliable results than traditional separate sample regressions. Table 6, columns (1–2), (3–4), and (5–6), sequentially report the heterogeneity results across different income levels, urban–rural divides, and North–South regions. The SUEST test all passed the significance test, indicating that the regression coefficients can be directly compared. Obviously, extreme weather has a greater impact on the energy consumption of low-income families compared to high-income families, especially extreme cold weather, which significantly increases the energy expenditure of low-income families. This finding is consistent with the research results of (Zhang et al., 2022). This occurs because most low-income households, constrained by budget and wealth, cannot quickly transition to a low-carbon consumption pattern and are thus more vulnerable to extreme temperatures. Adapting to extreme temperatures forces low-income households to reallocate some resources to cooling or heating, leading to energy poverty and making them more sensitive to unusually high energy bills. Especially under extreme cold conditions, they must increase their use of traditional energy sources for heating, substantially raising their energy costs. While for high-income households, they also tend to be high energy consumers, higher incomes enable them to afford more energy-efficient refrigeration equipment, so extreme high temperatures do not materially affect their energy consumption.
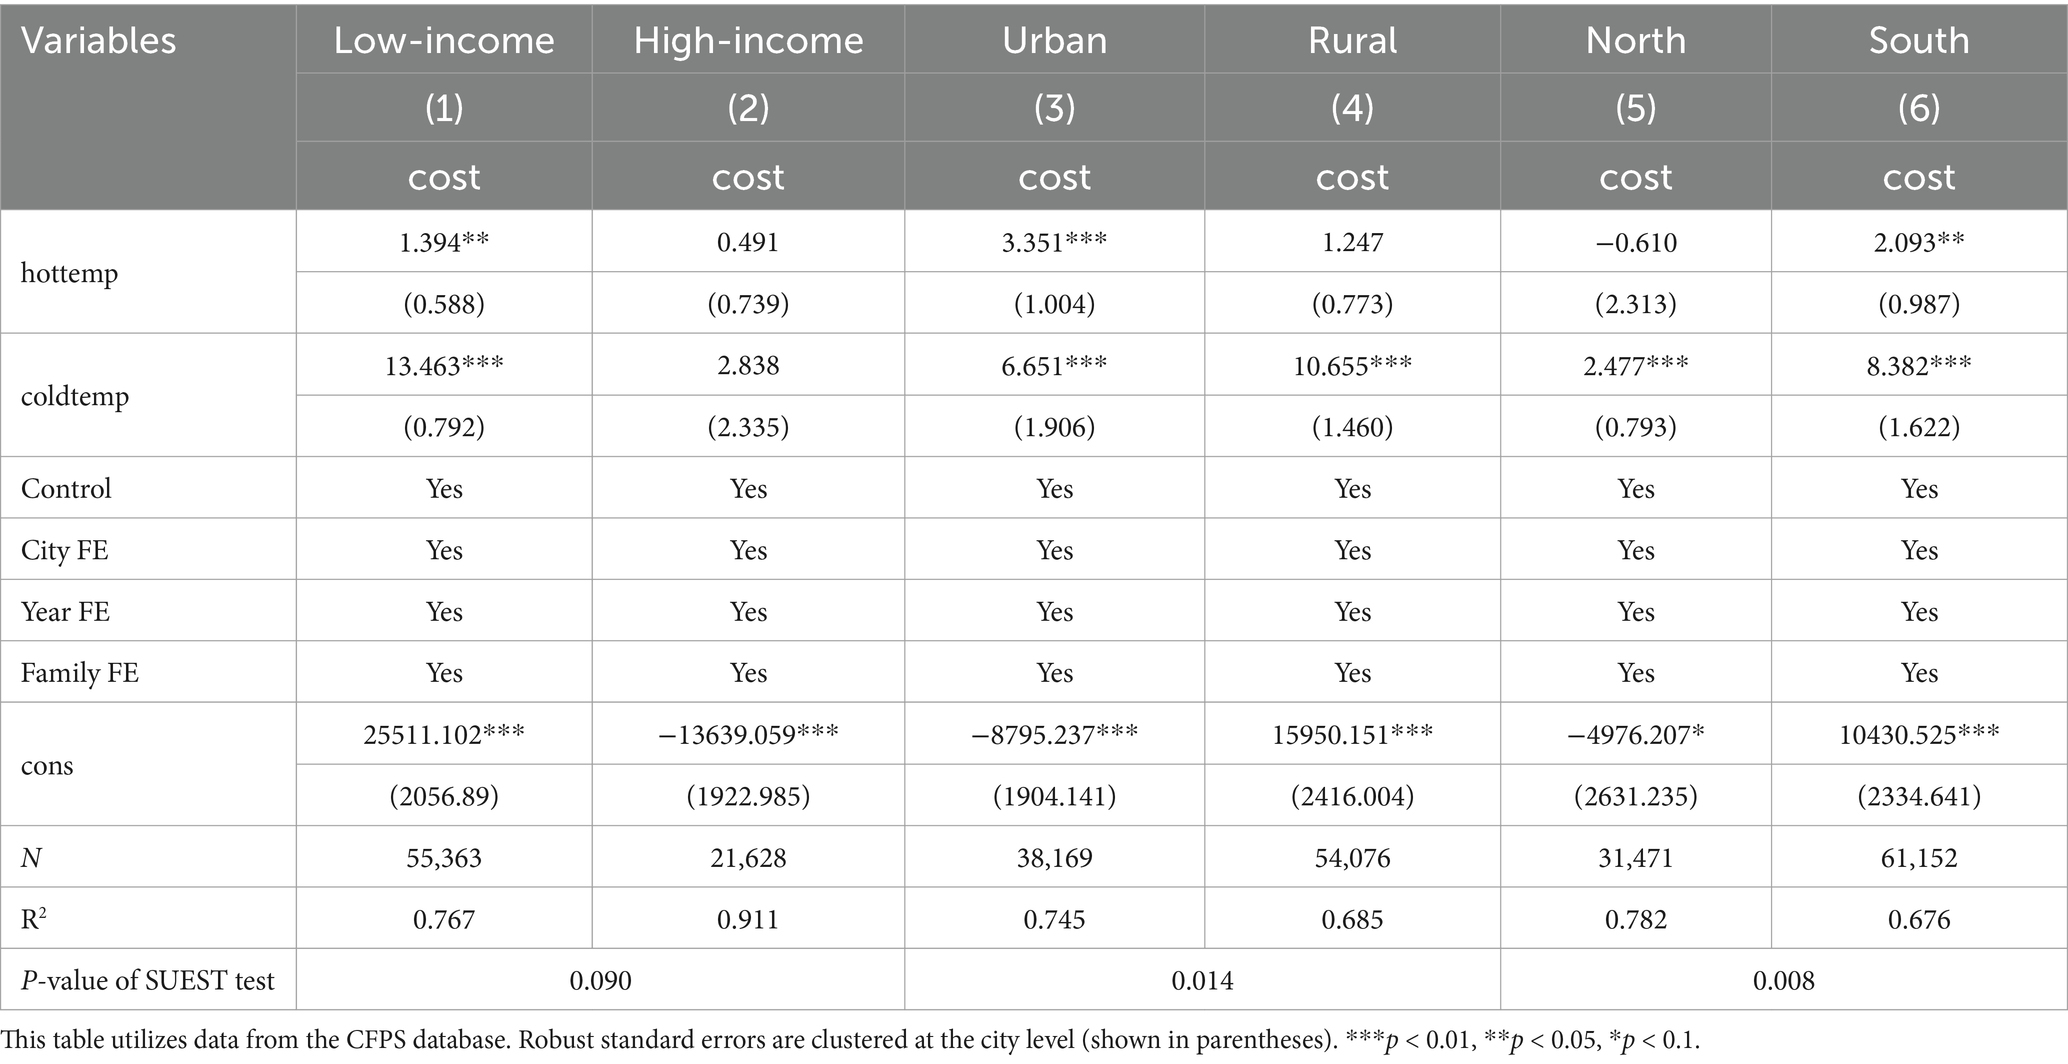
Table 6. Heterogeneity analysis.
In terms of urban–rural heterogeneity, extreme low temperatures more prominently increase the energy consumption of rural households than that of urban households. The main reasons for the different impacts may be threefold: Firstly, there are differences in the types of fuel and energy consumption pattern between urban and rural residents (Bonatz et al., 2019). For example, when experiencing extreme cold, rural areas may rely more on free traditional biomass energy, such as firewood, for heating, while urban households can only get heat from paid sources such as electricity and natural gas. Secondly, there may be significant differences in the insulation performance of housing between urban and rural residents. Buildings in urban areas may have better insulation materials and designs, while houses in rural areas may have poorer insulation performance. This results in different energy demands and consumption patterns for urban and rural families under extreme weather conditions (Niu et al., 2016). Lastly, there are differences in energy public infrastructure such as heating facilities between urban and rural areas (Chen et al., 2011). At extreme low temperatures, urban households have more efficient and less costly central heating systems compared to rural households, resulting in urban–rural household energy burden differences.
Regarding regional heterogeneity, both extreme high and low temperatures significantly increase household energy expenditure in the southern region. However, for the northern households, energy consumption in the north only rises during extreme low temperatures, and not as much as in the south. This difference may stem from two main reasons: Firstly, there is a significant geographical difference in extreme temperatures (Ding et al., 2011) and climatic conditions (Nguyen et al., 2019) between the southern and northern regions of China. Research by the National Oceanic and Atmospheric Administration (NOAA) in 1979 pointed out that an increase in relative humidity enhances the human perception of “cold.” Although the winter temperature in the north is lower than that in the south, the lower humidity makes the perceived temperature more comfortable (Nguyen et al., 2019). On the contrary, the humid climate in the south poses a greater threat to the health and lives of southern residents during extreme low temperatures. Taking Shanghai as an example, the average winter temperature is 3–5°C, with about 4–5 days when temperatures fall below −5°C. The humidity in Shanghai during winter is relatively high, typically around 60%, while the average humidity in the north is about 20%. According to the impact of humidity on temperature, it can be calculated that the “temperature” in Shanghai is actually around 1°C to −1°C. At this temperature, the north has implemented centralized heating. In the absence of centralized heating, southern households typically rely on electric heaters (Guo et al., 2015) and air conditioning to combat the cold (Cao et al., 2019), which have much higher energy costs than centralized heating. Secondly, the heating modes in the north and south of China are different. Compared with centralized heating in the north, southern households mostly use individual heating devices, such as electric heating or air conditioning, which have much higher energy costs. Dell et al. (2014) found that with the increasing frequency of extreme temperature events, more and more families have begun to install and use air conditioning, resulting in an increase in the power expenditure of southern families. According to the “China Household Energy Consumption Research Report 2016,” 87.5% of urban residents in the south use electricity for heating, and 12.5% use natural gas. E-commerce data in 2019 show that the sales of household radiator increased by 430% year-on-year, with buyers mainly from southern cities such as Shanghai, Nanjing, and Wuhan. At the same time, the sales of household fireplace are also shifting southward, with the southern market share reaching about 30%. Data from CFPS and CRECS show that annual energy consumption in the south accounts for 64.1% of the national total, of which electricity expenditure accounts for 68%. In winter, the average monthly electricity consumption for households in the south is 134 kWh/month, which is 70% higher than that in northern China. In summer, the average monthly electricity consumption in the south is 113 kWh/month, down 15.60 percent from the winter, while the average monthly electricity consumption for northern households decreases by 23.05%. These data further confirm the regional differences in heating energy consumption in China, that is, “more in the south, less in the north” (Li et al., 2019).
5 Mechanism analysis
The prior theoretical analysis indicates that extreme temperatures may influence household energy consumption through several adaptive behaviors: First, residents may adjust their expenditure structure, reducing non-energy expenditures such as food and medical costs to cover increased energy expenses; second, residents may increase the use of thermostats (such as air conditioning and heating) to adapt to temperature changes; and finally, extreme temperatures may lead residents to reconfigure their work and leisure time, spending more time indoors, thereby indirectly increasing energy consumption. Therefore, this section aims to verify whether extreme temperatures indeed affect household energy consumption through these specific mechanisms.
5.1 The crowding out effect of extreme temperatures on food and medical expenditures
Table 7 details the impact of extreme temperatures on food and medical expenditures. Columns (1, 2) report regression results with food expenditures (Food) and medical expenditures (Med) as the dependent variables, respectively. The results show that each additional day of extreme heat reduces household expenditure on food by 6.604 yuan, which is about the same magnitude as the increase in energy expenditure. When faced with extreme cold, the household’s food expenditure will decrease by 23.217 yuan, which is about three times the increase in energy expenditure. Similarly, medical expenditure is more adversely affected by extreme low temperature, with each additional day of extreme low temperature reducing medical expenditure by 21.212 yuan, and the impact is economically significant. This demonstrates that households do adjust their spending on essentials such as food and medical care in response to the additional energy costs incurred by extreme temperature shocks, holding income and other conditions constant. Considering the possibility of zero values in average annual medical expenditures, the data undergo an inverse hyperbolic sine transformation to minimize sample loss. Columns (3, 4) show the results of this transformation for food and medical expenditures, respectively. The crowding-out effect of extreme temperatures on food and medical expenditures is significant, as residents facing extreme temperatures inevitably reduce their spending on food and healthcare to prioritize energy expenditures.
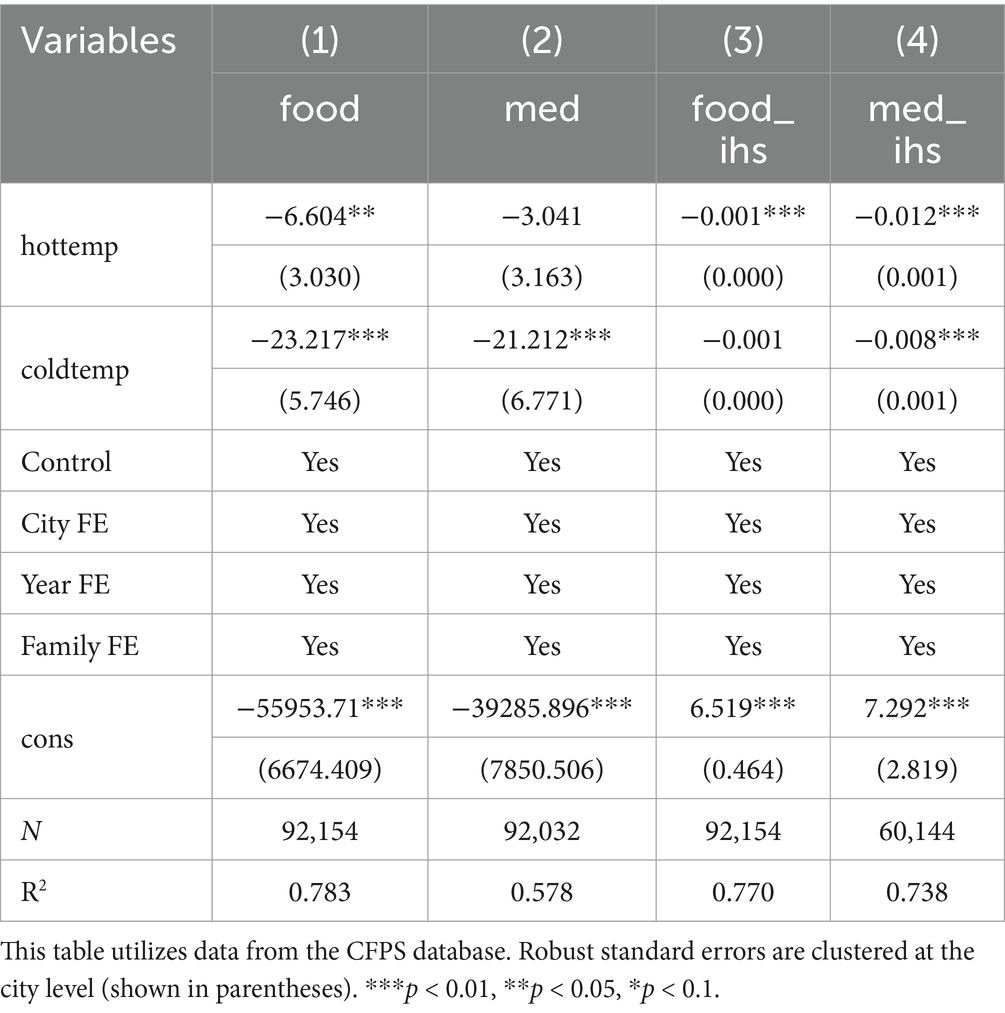
Table 7. The impact of extreme temperatures on food and medical expenditures.
How do extreme temperatures differently impact food and medical expenditures across rural and urban areas and among various income levels? This paper incorporates interaction terms between extreme temperatures and both rural and low-income dummy variables, as detailed in Table 8. Columns (1, 2) demonstrate that both extreme high and low temperatures have a greater crowding-out effect on food expenditures for rural and low-income households compared to urban and affluent families. One possible explanation is that due to the income levels and liquidity constraints, the adaptability of rural and low-income households to extreme temperatures shocks is much weaker than that of urban and high-income households (Chen et al., 2022; Han et al., 2019). Columns (3, 4) reveal that low-income groups are more vulnerable to the impact of extreme temperatures on medical expenditures. For each additional day of extreme heat, low-income individuals spend 12.266 yuan less on healthcare than their high-income counterparts, while each additional day of extreme cold increases their healthcare spending by 15.212 yuan. This may be due to the higher likelihood of underlying health issues among poorer individuals, increasing their vulnerability to health risks under extreme temperatures. However, the heterogeneity in healthcare expenditures between urban and rural households under extreme temperatures is not statistically significant. This lack of significance may be attributed to the widespread health insurance coverage in China today, which has narrowed the healthcare gap between urban and rural families. Overall, when extreme temperatures potentially compromise living quality, individuals tend to increase their energy expenditures to cope with harsh temperatures, subsequently needing to reduce necessary living expenses such as food. This adaptive behavior is more pronounced among disadvantaged groups such as low-income and rural households because the cooling and heating demands required by low-income groups to face temperature changes are twice those of high-income groups (Santamouris et al., 2014). According to data from the China Statistical Yearbook of 2023, the ratio of per capita disposable income between low-income and high-income groups is 10.47, and the ratio of per capita disposable income between urban and rural residents is 2.45, indicating a significant income disparity between urban and rural areas. At the same time, the impact of extreme temperatures on food and medical expenditures for low-income families and rural households is more pronounced, meaning that these vulnerable groups face greater economic pressure during extreme weather conditions, and they are forced to make further cuts in their spending on food and medical care. Consequently, when faced with unaffordable and unpredictable energy bills, vulnerable households are more inclined to squeeze out the largest share of total household expenditures, and these households tend to have the highest Engel coefficients.
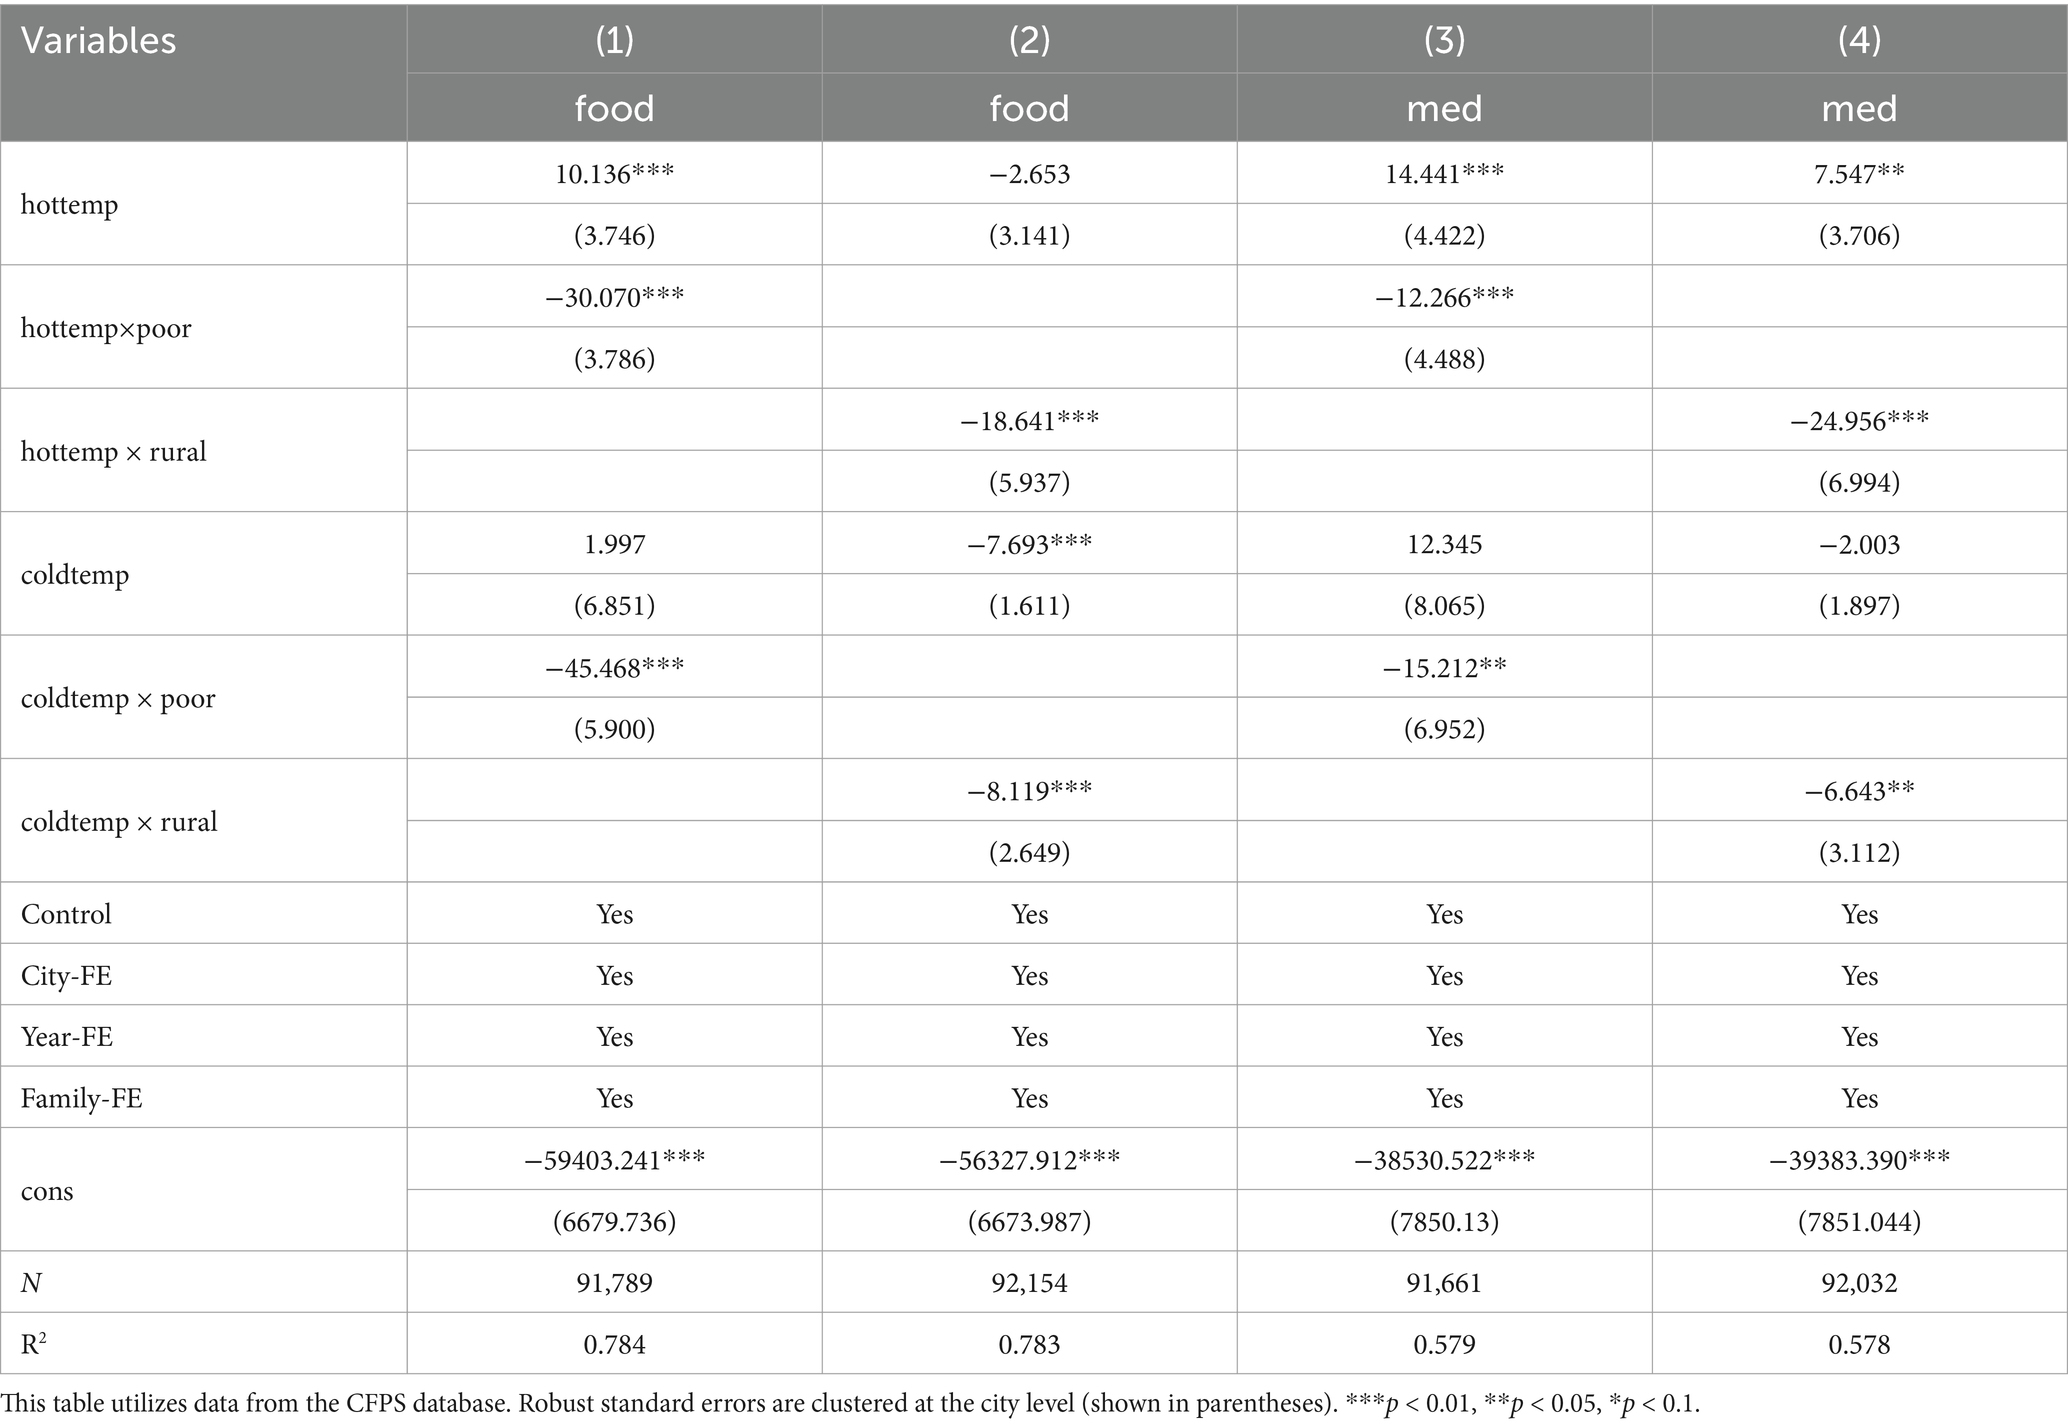
Table 8. Further analysis: incorporating urban–rural and income heterogeneity.
5.2 The impact of extreme temperatures on household thermostatic devices
Long-term exposure to extreme temperatures can significantly enhances households’ sensitivity to temperature changes (Dell et al., 2014), which may alter their purchasing and usage behaviors regarding thermostatic devices such as air conditioning and heaters. Utilizing detailed data from the CRECS database on household thermostatic infrastructure, this section investigates whether extreme temperatures affect household energy consumption through the use of thermostatic devices. The regression results are shown in Table 9. Columns (1–4) discuss the effects of extreme temperature on the possibility of installing air conditioners, the number of air conditioners, the energy efficiency and the use frequency of air conditioners. Columns (5–8), in turn, then examine the influence of extreme temperatures on the installation of heating devices, the number of heating devices, the use of cleaner fuels in heating devices, and centralized heating systems. The results found that extreme heat events not only significantly increased the frequency with which residents installed and used air conditioners, but also prompted them to choose more energy-efficient air conditioner models. Extreme cold events, on the other hand, lead to an increase in the number of heating installations and use for longer periods of time, and encourage people to choose cleaner fuels for heating. These results reveal how extreme temperature shocks drive residents to increase their reliance on thermostats, which in turn increases energy consumption, while also driving them to invest in more efficient and energy-efficient devices, providing strong evidence for adaptive household behavior.
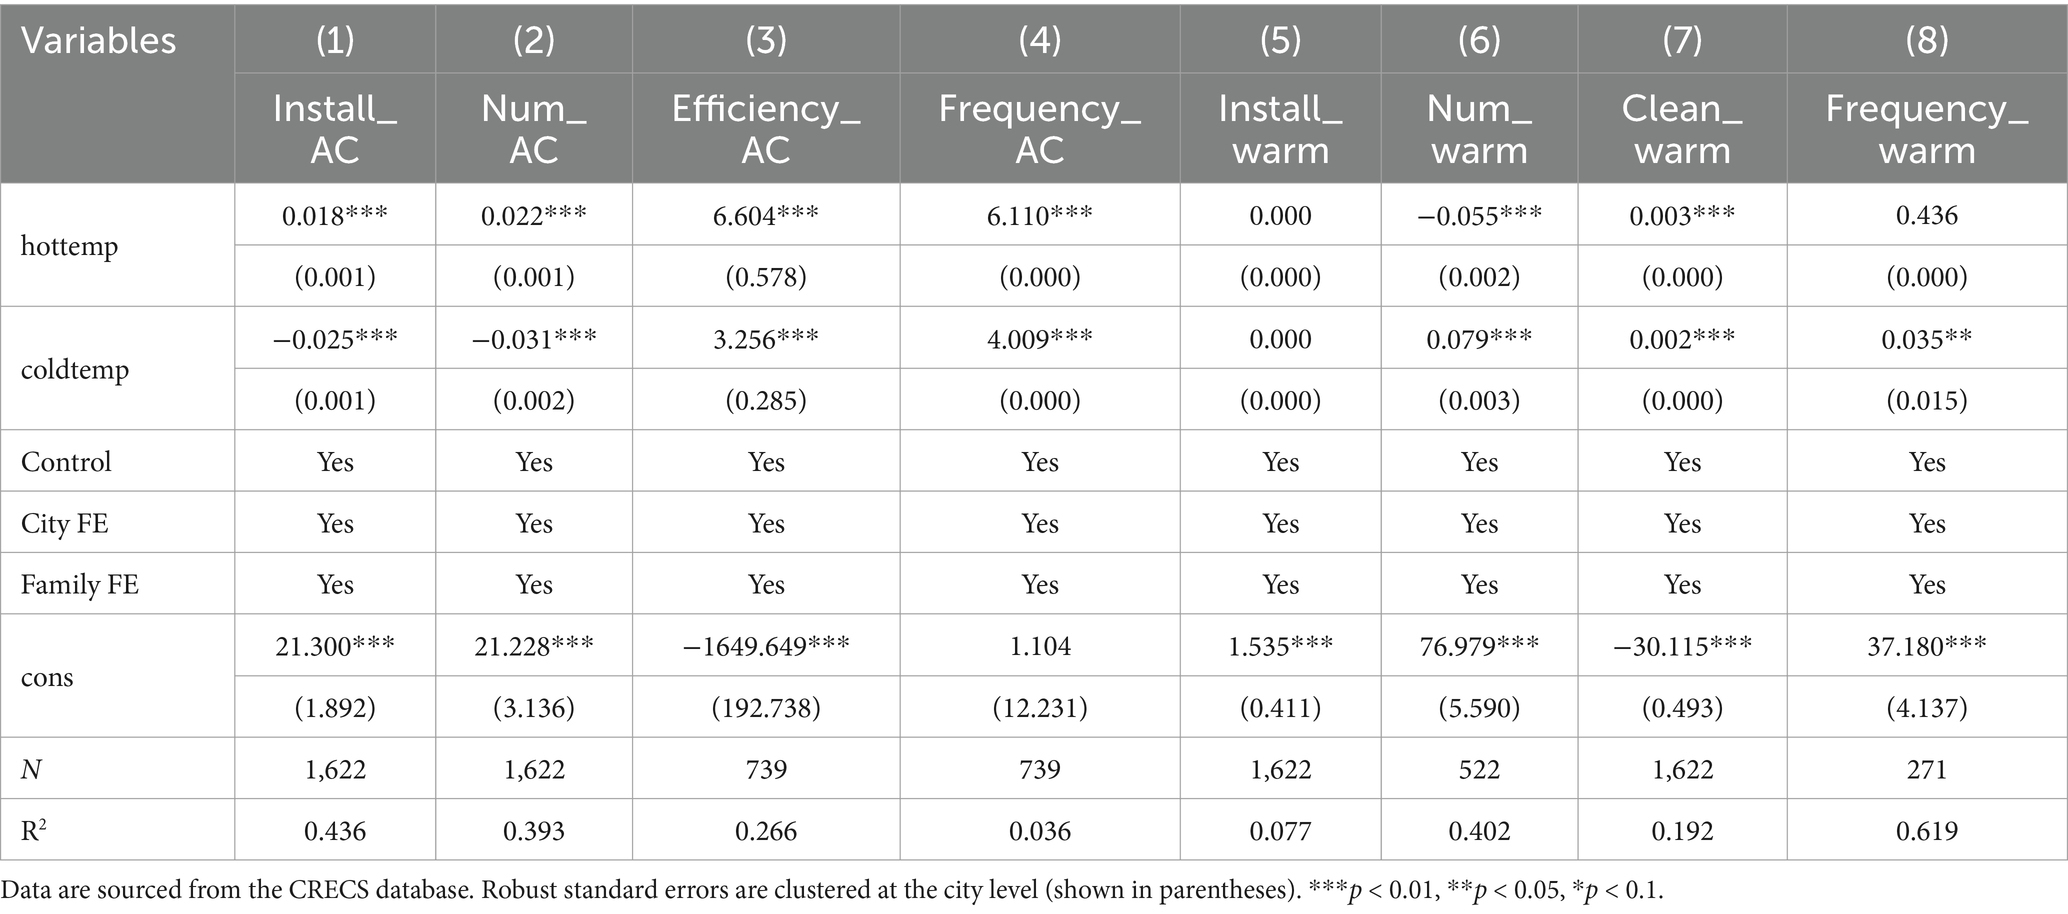
Table 9. Impact of extreme temperatures on household thermostatic devices.
Extreme temperatures not only directly increase the demand for cooling and heating facilities among residents but also indirectly increase energy consumption by extending the time residents spend indoors. This indirect impact occurs because as residents stay indoors for longer periods, energy-intensive activities such as indoor lighting, entertainment, and living facilities become more frequent, leading to an increase in energy consumption. Therefore, this section will analyze the impact of extreme temperatures on residents’ working hours to indirectly verify how adaptive behaviors of residents in response to extreme temperature shocks lead to changes in energy consumption.
Table 10 illustrates the impact of extreme temperatures on residents’ work hours. To more accurately study the impact of extreme weather on the working hours of ordinary residents, we excluded samples whose workplaces and working time are not affected by extreme temperatures, such as workers in the catering, logistics, and other service industries, as well as emergency service personnel like government officials, maintenance technicians, and medical staff.
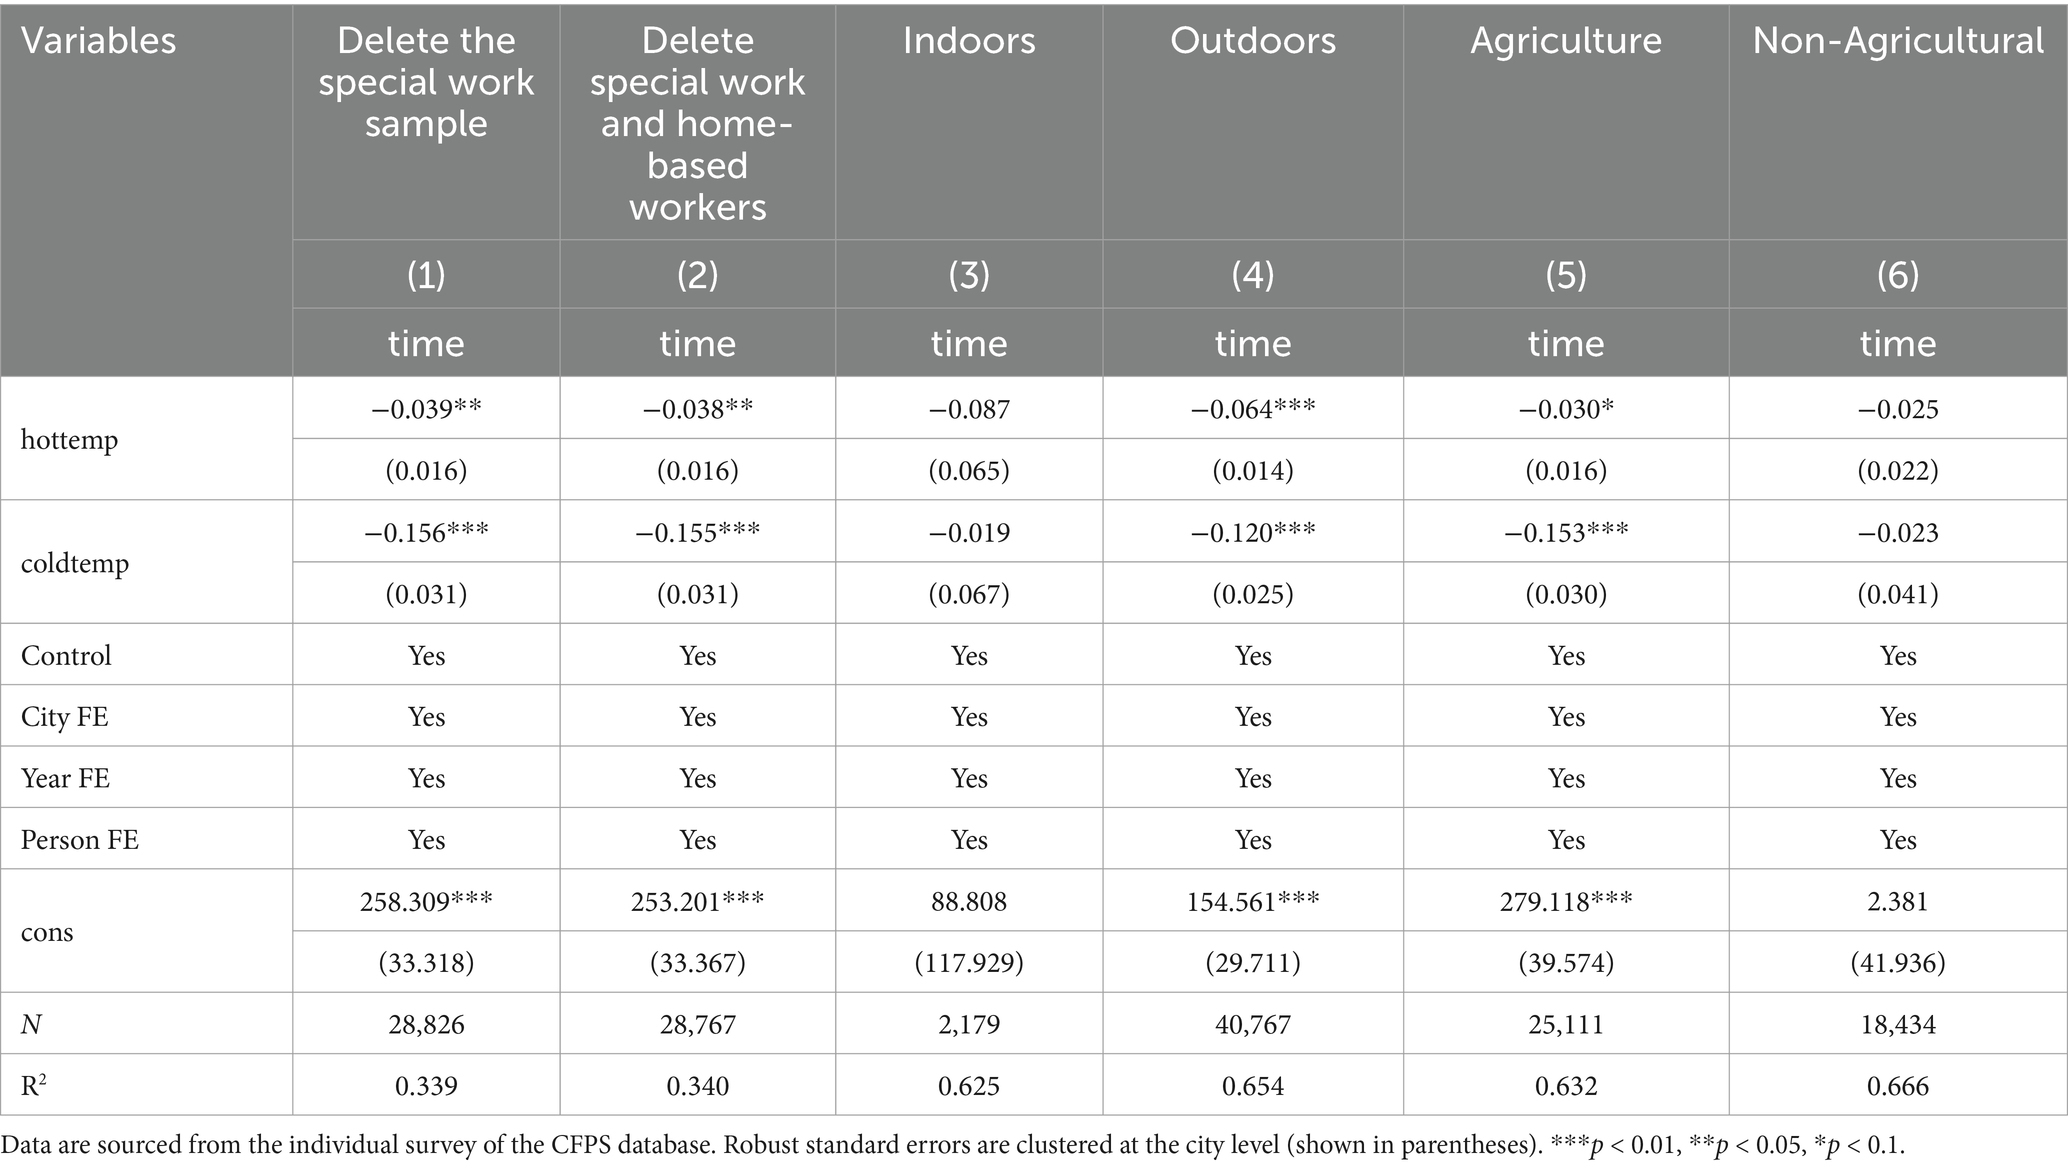
Table 10. Impact of extreme temperatures on working hours.
As shown in columns (1), for each additional day of extreme heat, residents significantly reduce their work hours by 0.039 h, and by 0.156 h for each additional day of extreme low temperature. Considering that some residents work from home, where extreme temperatures may not affect their working hours, this paper further excludes the samples of home-based workers. The relevant regression results are presented in column (2) of Table 10. The results show that extreme temperatures indeed intrude upon the working hours of residents. Extreme temperatures can lead to fatigue, discomfort, and health issues, decreasing the marginal utility of outdoor leisure and the marginal productivity of labor. Therefore, in response to extreme temperatures, individuals tend to reallocate their time from outdoor work to indoor leisure (Graff Zivin et al., 2018), preferring to stay indoors to minimize heat exposure (Garg et al., 2020) and cope with harsh temperature conditions (Zander et al., 2015). This change can lead to more frequent use of indoor lighting, heating or cooling devices, such as turning on lights, heating or air conditioning (Sun and Hanemann, 2024; Han et al., 2010). The result is increased energy consumption in places such as homes or offices. In short, extreme temperatures prompt people to increase their use of indoor facilities, which leads to higher energy consumption. Furthermore, this paper conducts sub-sample regression on whether they work outdoors and whether they are engaged in agriculture. Columns (3, 4) in Table 10 show the effect of extreme air temperature on the working hours of residents whose workplaces are indoors and outdoors, respectively. The results show that neither extreme heat nor extreme cold has a significant effect on the working hours of indoor residents. In contrast, hours worked by outdoor workers are significantly and negatively affected by temperature extremes. Specifically, for each additional day of extreme heat, residents tend to spend 0.064 h less working outdoors. For each additional day of extreme cold, residents spend 0.12 fewer hours working outdoors. We also find that extreme temperature has heterogeneous effects on the working hours of residents with different job nature, and the working hours of residents working in agriculture are more significantly affected by extreme temperature, while the working hours of residents working in non-agriculture are not significantly affected by extreme temperature, as shown in columns (5, 6) of Table 10. This is because outdoor work is more vulnerable to climate damage, and agricultural workers tend to work outdoors and are more vulnerable to climate damage. Therefore, in the face of extreme weather, outdoor workers and agricultural workers are more inclined to reduce or even stop outdoor work and stay indoors. Spending less time outdoors may increase household energy consumption. When people spend more time at home, indoor lighting, heating, cooling and household appliances are likely to be used more frequently, leading to higher energy consumption (Wu et al., 2023).
6 Conclusion
This paper attempts to explore the effects of extreme temperature on household energy consumption from the perspective of adaptive behavior. Grounded in theoretical analysis, this paper employs microdata from China’s CFPS and CRECS to empirically assess the impact of extreme climate on household energy consumption and its mechanisms. It also investigates the heterogeneous effects of extreme temperatures on energy consumption across urban and rural areas, northern and southern regions, and among households with different income levels. Empirical results indicate: (1) household energy consumption increases by 3.437 yuan for each additional day of extreme high temperature; for each additional day of extreme low temperature, it increases by 8.071 yuan. (2) Heterogeneity analysis reveals that southern regions, as well as rural and low-income households, are more sensitive to the impacts of extreme temperatures. (3) Extreme temperatures influence residents’ adaptive behaviors, leading to reductions in food and medical expenditures and working hours, and increased usage of home thermostatic devices, thereby raising household energy consumption.
The policy implications are as follows: Firstly, it is crucial to enhance awareness across all societal sectors about the risks associated with extreme temperatures, especially the economic costs related to increased energy burdens and consumption displacement caused by such conditions. It is necessary for the government to actively promote energy conservation education, such as through education and publicity activities, to effectively enhance the public’s awareness of energy conservation. Secondly, the government should refine the targeting of energy subsidies to provide support and concessions to rural and impoverished households, enhancing their energy accessibility and affordability. Through rational development and utilization of energy resources in poor areas to promote the economic development of deeply poor areas, indirectly increase the income of poor people, and finally establish a long-term mechanism of energy poverty alleviation. Finally, there should be an increased focus on promoting clean energy and energy-efficient technologies, reducing the costs associated with purchasing and using thermostatic equipment through technological advancements. Specifically, encourage the public to use clean energy, such as solar, wind and other renewable energy, to optimize the energy structure. At the same time, authorities are setting and enforcing higher energy efficiency standards to push businesses and households to use energy more efficiently. The government has stepped up efforts to support technological innovation and provided policy and financial support for the research, development and application of green energy technologies. Additionally, in order to further refine the geographical division scheme for centralized heating in China, the government should further consider the climate characteristics and energy needs of different regions, which can improve energy efficiency and reduce energy waste.
Data availability statement
The raw data supporting the conclusions of this article will be made available by the authors, without undue reservation.
Author contributions
QL: Conceptualization, Writing – original draft. TY: Writing – review & editing, Writing – original draft. HT: Methodology, Writing – review & editing. JP: Data curation, Writing – review & editing.
Funding
The author(s) declare that financial support was received for the research, authorship, and/or publication of this article. This research was supported by the National Natural Science Foundation of China (grant no. 72303174), the Humanities and Social Sciences Youth Foundation, Ministry of Education (grant no. 21YJC790145), Hubei Provincial Education Science Planning Project (grant no. 2022GB035), Wuhan Institute of Technology Higher Education Research Project (grant no. 2024ZD02), and Pre funding Project of Hubei Provincial Social Science Fund (grant no. 23ZD182).
Conflict of interest
The authors declare that the research was conducted in the absence of any commercial or financial relationships that could be construed as a potential conflict of interest.
Publisher’s note
All claims expressed in this article are solely those of the authors and do not necessarily represent those of their affiliated organizations, or those of the publisher, the editors and the reviewers. Any product that may be evaluated in this article, or claim that may be made by its manufacturer, is not guaranteed or endorsed by the publisher.
References
Ajzen, I. (1991). The theory of planned behavior. Organ. Behav. Hum. Decis. Process. 50, 179–211. doi: 10.1016/0749-5978(91)90020-T
Akhmat, G., Zaman, K., Shukui, T., Irfan, D., and Khan, M. M. (2014). Does energy consumption contribute to environmental pollutants? Evidence from SAARC countries. Environ. Sci. Pollut. Res. 21, 5940–5951. doi: 10.1007/s11356-014-2528-1
Alexander, L. V., Zhang, X., Peterson, T. C., Caesar, J., Gleason, B., Klein Tank, A. M. G., et al. (2006). Global observed changes in daily climate extremes of temperature and precipitation. J. Geophys. Res. Atmos. 111, 148–227. doi: 10.1029/2005JD006290
Auffhammer, M., and Mansur, E. T. (2014). Measuring climatic impacts on energy consumption: a review of the empirical literature. Energy Econ. 46, 522–530. doi: 10.1016/j.eneco.2014.04.017
Beatty, T. K. M., Blow, L., and Crossley, T. F. (2014). Is there a ‘heat-or-eat’ trade-off in the UK? J. R. Stat. Soc. Ser. A Stat. Soc. 177, 281–294. doi: 10.1111/rssa.12013
Bhattacharya, J., DeLeire, T., Haider, S., and Currie, J. (2003). Heat or eat? Cold-weather shocks and nutrition in poor American families. Am. J. Public Health 93, 1149–1154. doi: 10.2105/AJPH.93.7.1149
Biesiot, W., and Noorman, K. (1999). Energy requirements of household consumption: a case study of the Netherlands. Ecol. Econ. 28, 367–383. doi: 10.1016/S0921-8009(98)00113-X
Bonatz, N., Guo, R., Wu, W., and Liu, L. (2019). A comparative study of the interlinkages between energy poverty and low carbon development in China and Germany by developing an energy poverty index. Energ. Buildings 183, 817–831. doi: 10.1016/j.enbuild.2018.09.042
Cao, J., Ho, M. S., Li, Y., Newell, R. G., and Pizer, W. A. (2019). Chinese residential electricity consumption: estimation and forecast using micro-data. Resour. Energy Econ. 56, 6–27. doi: 10.1016/j.reseneeco.2017.10.003
Cevik, S., and Jalles, J. T. (2022). This changes everything: climate shocks and sovereign bonds. Energy Econ. 107, 105856–109883. doi: 10.1016/j.eneco.2022.105856
Charlier, D., and Kahouli, S. (2019). From residential energy demand to fuel poverty: income-induced non-linearities in the reactions of households to energy price fluctuations. Energy J. 40, 101–138. doi: 10.5547/01956574.40.2.dcha
Chen, Y., and Li, L. (2023). Differential game model of carbon emission reduction decisions with two types of government contracts: green funding and green technology. J. Clean. Prod. 389:135847. doi: 10.1016/j.jclepro.2023.135847
Chen, S., Li, N., Yoshino, H., Guan, J., and Levine, M. (2011). Statistical analyses on winter energy consumption characteristics of residential buildings in some cities of China. Sustain. Cities Soc. 43, 1063–1070. doi: 10.1016/j.enbuild.2010.09.022
Chen, F., Qiu, H., and Zhang, J. (2022). Energy consumption and income of the poor in rural China: inference for poverty measures. Energy Policy 163:112865. doi: 10.1016/j.enpol.2022.112865
Chirakijja, J., Jayachandran, S., and Ong, P. (2019). Inexpensive heating reduces winter mortality. NBER Working Papers 25681. doi: 10.3386/w25681
Davis, L. W., and Gertler, P. (2015). Contribution of air conditioning adoption to future energy use under global warming. Proc. Natl. Acad. Sci. USA 112, 5962–5967. doi: 10.1073/pnas.1423558112
Dell, M., Jones, B. F., and Olken, B. A. (2014). What do we learn from the weather? The new climate–economy literature. J. Econ. Lit. 52, 740–798. doi: 10.1257/jel.52.3.740
Ding, L. X., Ma, C. Q., Li, J. W., Robinson, P. T., Deng, X. D., Zhang, C., et al. (2011). Timing and genesis of the adakitic and shoshonitic intrusions in the Laoniushan complex, southern margin of the North China craton: implications for post-collisional magmatism associated with the Qinling Orogen. Lithos 126, 212–232. doi: 10.1016/j.lithos.2011.07.008
Doremus, J. M., Jacqz, I., and Johnston, S. (2022). Sweating the energy bill: extreme weather, poor households, and the energy spending gap. J. Environ. Econ. Manag. 112, 0095–0696. doi: 10.1016/j.jeem.2022.102609
Easterling, D. R., Meehl, G. A., Parmesan, C., Changnon, S. A., Karl, T. R., and Mearns, L. O. (2000). Climate extremes: observations, modeling, and impacts. Science 289, 2068–2074. doi: 10.1126/science.289.5487.2068
Fang, G., Yang, K., Tian, L., and Ma, Y. (2022). Can environmental tax promote renewable energy consumption? — an empirical study from the typical countries along the belt and road. Energy 260:125193. doi: 10.1016/j.energy.2022.125193
Galvin, R., and Sunikka-Blank, M. (2018). Economic inequality and household energy consumption in high-income countries: a challenge for social science based energy research. Ecol. Econ. 153, 78–88. doi: 10.1016/j.ecolecon.2018.07.003
Gao, X., Song, R., and Timmins, C. (2024). The fertility consequences of air pollution in China. J Assoc Environ Resour Econ. 11, 657–688. doi: 10.1086/726316
Garg, T., Gibson, M., and Sun, F. (2020). Extreme temperatures and time use in China. J. Health Econ. 180, 309–324. doi: 10.1016/j.jebo.2020.10.016
Glasenapp, S., Aguilar, F. X., Weimar, H., and Mantau, U. J. B. (2019). Assessment of residential wood energy consumption using German household-level data. Biomass Bioenergy 126, 117–129. doi: 10.1016/j.biombioe.2019.04.020
Graff Zivin, J., Hsiang, S. M., and Neidell, M. J. (2018). Temperature and human capital in the short and long run. NBER Working Papers. 5, 77–105. doi: 10.1086/694177
Guo, J., Huang, Y., and Wei, C. (2015). North–south debate on district heating: evidence from a household survey. Energy Policy 86, 295–302. doi: 10.1016/j.enpol.2015.07.017
Han, H. J., Jeon, Y. I., Lim, S. H., Kim, W. W., and Chen, K. (2010). New developments in illumination, heating and cooling technologies for energy-efficient buildings. Energy 35, 2647–2653. doi: 10.1016/j.energy.2009.05.020
Han, B., Kong, D., and Liu, S. (2018). Do analysts gain an informational advantage by visiting listed companies? Contemp. Account. Res. 35, 1843–1867. doi: 10.1111/1911-3846.12363
Han, S., Wang, B., Qiu, Y. M., Deng, N. N., Xie, B. C., Zhang, B., et al. (2019). The unequal impacts of extremely high temperatures on households’ adaptive behaviors: empirical evidence from fine-grained electricity consumption data. Energy Policy 190:114170. doi: 10.1016/j.enpol.2024.114170
Hernandez, D. (2016). Understanding ‘energy insecurity’ and why it matters to health. Soc. Sci. Med. 167, 1–10. doi: 10.1016/j.socscimed.2016.08.029
Hosier, R. H., and Dowd, J. (1987). Household fuel choice in Zimbabwe: an empirical test of the energy ladder hypothesis. Resour. Energy Econ. 9, 347–361. doi: 10.1016/0165-0572(87)90003-X
Hsiang, S., Kopp, R., Jina, A., Rising, J., Delgado, M., Mohan, S., et al. (2017). Estimating economic damage from climate change in the United States. Science 356, 1362–1369. doi: 10.1126/science.aal4369
Huang, J. K., Jiang, J., Wang, J. X., and Hou, L. L. (2014). Crop diversification in coping with extreme weather events in China. J. Integr. Agric. 13, 677–686. doi: 10.1016/S2095-3119(13)60700-5
Huang, K., Zhao, H., Huang, J., Wang, J., and Findlay, C. (2020). The impact of climate change on the labor allocation: empirical evidence from China. J. Environ. Econ. Manag. 104, 102376–100696. doi: 10.1016/j.jeem.2020.102376
IPCC (2012). Managing the risks of extreme events and disasters to advance climate change adaptation. Cambridge: Cambridge University Press.
Joos, F., Prentice, I. C., Sitch, S., Meyer, R., Hooss, G., Plattner, G. K., et al. (2001). Global warming feedbacks on terrestrial carbon uptake under the intergovernmental panel on climate change (IPCC) emission scenarios. Glob. Biogeochem. Cycles 15, 891–907. doi: 10.1029/2000GB001375
Kahn, M. E., Mohaddes, K., Pesaran, M. H., Raissi, M., and Yang, J. (2021). Long-term macroeconomic effects of climate change: a cross-country analysis. Energy Econ. 104, 105624–109883. doi: 10.1016/j.eneco.2021.105624
Lan, F., Yan, L., Zhou, T., Wang, Y., and Jiao, C. (2023). Housing differences, credit constraints and household energy consumption: an empirical study from household tracking survey data in China. J. Green Build. 18, 71–93. doi: 10.3992/jgb.18.1.71
Lee, C., Zeng, M., and Luo, K. (2024). How does climate change affect food security? Evidence from China. Environ. Impact Assess. Rev. 104:107324. doi: 10.1016/j.eiar.2023.107324
Li, C., and Pan, Z. (2021). How do extremely high temperatures affect labor market performance? Evidence from rural China. Empir. Econ. 61, 2265–2291. doi: 10.1007/s00181-020-01954-9
Li, Y., Pizer, W. A., and Wu, L. (2019). Climate change and residential electricity consumption in the Yangtze River Delta. China. Proc. Natl. Acad. Sci. U.S.A. 116, 472–477. doi: 10.1073/pnas.1804667115
Li, C., Su, X., Fan, C., and Han, H. (2024). Behavior-encoded models reveal differentiated access to public cooling environment by race and income. Urban Sustain. 4, 2661–8001. doi: 10.1038/s42949-024-00157-w
Liu, L. C., Wu, G., Wang, J. N., and Wei, Y. M. (2011). China’s carbon emissions from urban and rural households during 1992–2007. J. Clean. Prod. 19, 1754–1762. doi: 10.1016/j.jclepro.2011.06.011
Longden, T., Quilty, S., Riley, B., White, L. V., Klerck, M., Davis, V. N., et al. (2021). Energy insecurity during temperature extremes in remote Australia. Nat. Energy 7, 43–54. doi: 10.1038/s41560-021-00942-2
Moustris, K. P., Nastos, P. T., Bartzokas, A., Larissi, I. K., Zacharia, P. T., and Paliatsos, A. G. (2015). Energy consumption based on heating/cooling degree days within the urban environment of Athens. Greece. Theor. Appl. Climatol. 122, 517–529. doi: 10.1007/s00704-014-1308-7
Nguyen, T. T., Nguyen, T.-T., Hoang, V.-N., Wilson, C., and Managi, S. (2019). Energy transition, poverty and inequality in Vietnam. Energy Policy 132, 536–548. doi: 10.1016/j.enpol.2019.06.001
Niu, S., Jia, Y., Ye, L., Dai, R., and Li, N. (2016). Does electricity consumption improve residential living status in less developed regions? An empirical analysis using the quantile regression approach. Energy 95, 550–560. doi: 10.1016/j.energy.2015.12.029
O'Neill, B. C., Ren, X., Jiang, L., and Dalton, M. (2012). The effect of urbanization on energy use in India and China in the iPETS model. Energy Econ. 34, S339–S345. doi: 10.1016/j.eneco.2012.04.004
Pan, M., Liu, H., and Cheng, Z. (2022). The impact of extreme climate on commercial banks' risk-taking: evidence from local commercial banks in China. J. Financial Res. 508, 39–57.
Pavanello, F., De Cian, E., Davide, M., Mistry, M., Cruz, T., Bezerra, P., et al. (2021). Air-conditioning and the adaptation cooling deficit in emerging economies. Nat. Commun. 12, 2041–1723. doi: 10.1038/s41467-021-26592-2
Peng, J., Shi, W., and Xiao, J. (2023). Exploring the nexus of green finance and renewable energy consumption: unraveling synergistic effects and spatial spillovers. Environ. Sci. Pollut. Res. 30, 100753–100769. doi: 10.1007/s11356-023-29444-2
Rosenzweig, C., Iglesius, A., Yang, X. B., Epstein, P. R., and Chivian, E. (2001). Climate change and extreme weather events-implications for food production, plant diseases, and pests. Glob. Environ. Change. 2, 90–104. doi: 10.1023/A:1015086831467
Roson, R., Calzadilla, A., and Pauli, F. (2006). Climate change and extreme events: an assessment of economic implications. FEEM Working Papers. 44:893035. doi: 10.2139/ssrn.893035
Sakka, A., Santamouris, M., Livada, I., Nicol, F., and Wilson, M. (2012). On the thermal performance of low income housing during heat waves. Energ. Buildings 49, 69–77. doi: 10.1016/j.enbuild.2012.01.023
Santamouris, M., Alevizos, S. M., Aslanoglou, L., Mantzios, D., Milonas, P., Sarelli, I., et al. (2014). Freezing the poor—indoor environmental quality in low and very low income households during the winter period in Athens. Energ. Buildings 70, 61–70. doi: 10.1016/j.enbuild.2013.11.074
Santamouris, M., and Kolokotsa, D. (2015). On the impact of urban overheating and extreme climatic conditions on housing, energy, comfort and environmental quality of vulnerable population in Europe. Energ. Buildings 98, 125–133. doi: 10.1016/j.enbuild.2014.08.050
Schär, C., Ban, N., Fischer, E. M., Rajczak, J., Schmidli, J., Frei, C., et al. (2016). Percentile indices for assessing changes in heavy precipitation events. Clim. Chang. 137, 201–216. doi: 10.1007/s10584-016-1669-2
Simcock, N., and Mullen, C. (2016). Energy demand for everyday mobility and domestic life: exploring the justice implications. Energy Res. Soc. Sci. 18, 1–6. doi: 10.1016/j.erss.2016.05.019
Sun, Y., and Hanemann, M. (2024). Climate change adaptation in China: differences in electricity consumption between rural and urban residents. Energy Econ. 140:107958. doi: 10.1016/j.eneco.2024.107958
Sun, C., and Zeng, Y. (2023). Does the green credit policy affect the carbon emissions of heavily polluting enterprises? Energy Policy 180, 301–4215. doi: 10.1016/j.enpol.2023.113679
Wei, X., Li, J., Liu, H., and Wan, J. (2023). Temperature and outdoor productivity: evidence from professional soccer players. J. Asian Econ. 87, 1049–0078. doi: 10.1016/j.asieco.2023.101622
White, C. (2017). The dynamic relationship between temperature and morbidity. J. Assoc. Environ. Resour. Econ. 4, 1155–1198. doi: 10.1086/692098
Wu, J., Niu, Z., Li, X., Huang, L., Nielsen, P. S., and Liu, X. (2023). Understanding multi-scale spatiotemporal energy consumption data: a visual analysis approach. Energy 263:125939. doi: 10.1016/j.energy.2022.125939
Wu, S., Zheng, X., You, C., and Wei, C. (2019). Household energy consumption in rural China: historical development, present pattern and policy implication. J. Clean. Prod. 211, 981–991. doi: 10.1016/j.jclepro.2018.11.265
Xiang, Y., and Yue, P. P. (2023). Financial literacy and household energy efficiency: an analysis of credit market and supply chain. Finance Res. Lett. 52, 1544–6123. doi: 10.1016/j.frl.2022.103563
You, L., Jiang, Z., Chen, A., and Xu, W. (2024). Energy saving effects of digital technologies from a life-cycle-analytical perspective: evidence from China. Environ. Sci. Pollut. Res. 31, 21811–21828. doi: 10.1007/s11356-024-32538-0
Yu, X., Lei, X., and Wang, M. (2019). Temperature effects on mortality and household adaptation: evidence from China. J. Environ. Econ. Manag. 96, 195–212. doi: 10.1016/j.jeem.2019.05.004
Zander, K. K., Botzen, W. J., Oppermann, E., Kjellstrom, T., and Garnett, S. T. (2015). Heat stress causes substantial labour productivity loss in Australia. Nat. Clim. Chang. 5, 647–651. doi: 10.1038/nclimate2623
Zhang, S., Guo, Q., Smyth, R., and Yao, Y. (2022). Extreme temperatures and residential electricity consumption: evidence from Chinese households. Energy Econ. 107, 105890–109883. doi: 10.1016/j.eneco.2022.105890
Keywords: extreme temperature, household energy consumption, adaptive behavior, crowding out effect, working hours, thermostatic devices
Citation: Liu Q, Yao T, Tong H and Peng J (2025) Extreme temperatures and household energy consumption in China: insights from adaptive behavior. Front. Sustain. Cities. 7:1475103. doi: 10.3389/frsc.2025.1475103
Edited by:
Manoj Kumar Nallapaneni, City University of Hong Kong, Hong Kong SAR, ChinaReviewed by:
Guochang Fang, Nanjing University of Finance and Economics, ChinaYufeng Chen, Zhejiang Normal University, China
Copyright © 2025 Liu, Yao, Tong and Peng. This is an open-access article distributed under the terms of the Creative Commons Attribution License (CC BY). The use, distribution or reproduction in other forums is permitted, provided the original author(s) and the copyright owner(s) are credited and that the original publication in this journal is cited, in accordance with accepted academic practice. No use, distribution or reproduction is permitted which does not comply with these terms.
*Correspondence: Tingting Yao, MjEwODEwMDFAd2l0LmVkdS5jbg==