 Joe Ravetz
 Mehebub Sahana
94% of researchers rate our articles as excellent or good
Learn more about the work of our research integrity team to safeguard the quality of each article we publish.
Find out more
ORIGINAL RESEARCH article
Front. Sustain. Cities, 14 February 2025
Sec. Urban Resource Management
Volume 7 - 2025 | https://doi.org/10.3389/frsc.2025.1436287
This article is part of the Research TopicLand-Use Management in Peri-urban AreasView all 6 articles
The peri-urban, the areas ‘around, beyond and between’ the urban, may be the fastest expanding land-use around the world. Its many dimensions can include population density, economic activity, travel patterns, urban infrastructure, land cover, water basins or material flows. To explore the question ‘where is the peri-urban’, we adopt a twin-track approach. One is a conceptual ‘integrated framework’, which includes tangible parameters of land-use, relational linkages and systemic emergence. The second track is a practical ‘basic delineation’, a simple combination of population density and functional area, based on the Global Human Settlements Layer (GHSL), as developed by the project Peri-cene, through consultation with city-region partners. This delineation is here applied to a sample of 21 city-regions, covering in total 10% of the global urban population. The peri-urban land area in this sample is estimated at around 180,000 km2, with a rapid growth rate of 2.9% per annum. This basic delineation is then combined with a wider set of social, economic and governance variables, to provide a basic global typology. The same method then highlights the internal peri-urban structure and growth pattern of each city-region, to derive a typology of six main peri-urban patterns. Overall, the basic delineation provides a foundation for quantitative analysis of the global peri-urban: and also supports further investigation of more complex systems-level problems and policy pathways.
The peri-urban is generally defined broadly as the area between urban and rural, or as the outer gravity field of urban areas: the areas ‘around, beyond and between’ the urban. With peri-urban land-use types expanding around the world, along with many types of urban impacts and vulnerabilities, it seems urgent to delineate and locate such areas as far as possible (Sahana et al., 2023).
In practice this is a very challenging question. On the ground there are many possible definitions: population density, economic activity, travel patterns, urban infrastructure, land cover, material flows, water systems or bio-regions. There are also intangibles, such as community, identity, expropriation and structural dependency. And as both urban and rural areas are rapidly changing, in both physical and societal systems, at scales from local to regional, the peri-urban territories ‘around, beyond and between’ may be especially ‘volatile, uncertain, contested and ambiguous’ (‘VUCA’) (Bennis and Nanus, 1985).
So, the simple question addressed here, is ‘where is the peri-urban’, for which we take a twin-track approach. One track proposes a conceptual integrated framework, with three distinct framings: tangible, relational and systemic. The other track is a practical basic delineation, a simple classification of peri-urban types by population density and function, as developed by the global project Peri-cene. Combined with the stakeholder consultation as below, this helps to explore and define a wide range of peri-urban types around the world, from high density desakotas, to ‘edge city’ sprawl (McGee, 2002; Garreau, 2011).
A brief overview of this question includes both simple and multi-layered definitions (Woltjer, 2014; Gonçalves et al., 2017). A previous delineation came from the EU project PLUREL (‘Peri-urban land-use relationships’), where Piorr et al. (2011) and Ravetz and Warhurst (2013), classified the components of the ‘rural–urban region’. Cusin et al. (2016) define the peri-urban as a ‘discontinuous sub-urbanized space with a mixed rural–urban interface’. Gonçalves et al. (2017) differentiated the peri-urban areas with a typology of peri-urban areas for Lisbon. Danielaini et al. (2018) provided more accurate rural–urban definitions for peri-urban delineation, with 11 social, economic and spatial variables. Balk et al. (2018) used the time-series of the Global Human Settlement Layer (‘GHSL’) to describe peri-urban areas with <30% of the census-designated urban population in less built-up areas. In the global south, Karg et al. (2019) studied a medium-sized city in Ghana, in terms of ‘urbanicity’, livelihood and land use dynamics.
Overall, given such diversity, there is no single methodology for spatial delineation of the peri-urban (Mortoja et al., 2020; Sahana et al., 2023): however there is clearly an urgent need for evidence to inform policy and governance. This is in a nutshell, the research gap which this paper aims to address: as (to our knowledge) the first to link technical data with an integrated framework, validated as far as possible by stakeholder consultation at the global level.
This challenge was then addressed in a practical sense by the project Peri-cene (‘Exploring the peri-eco-urban anthropocene’; https://peri-cene.net). This worked with a Policy Lab of 16 active partner cities, and spatial data from 21 cities, with two in-depth case studies on Chennai (India) and Manchester (UK). The Peri-cene explored both the risks and vulnerabilities, and the potential for adaptive pathways and collaborative governance. The research also connected with parallel themes, such as the ‘Urban–Rural Linkages’ of UN Habitat (2019), the bio-regional approach (Fanfani and Matarán Ruiz, 2018), the political ecology approach (Heynen et al., 2006), and the cognitive systems approach of a ‘collective peri-urban intelligence’ (Ravetz, 2020:79).
The Peri-cene then highlighted the policy context, where the basic delineation shown here in section 4, is part of a bigger picture which connects evidence to policy application. Figure 1 shows the outline. On the top left the integrated framework shows a matrix with three alternative framings of peri-urban phenomena. ‘Tangibles’ refers to physical issues on the ground, with specific data or spatial mappings, such as land-use or population density. ‘Linkages’ refers to the relations, flows or interfaces of such tangibles, for instance traffic flows or ecosystem services. Thirdly, ‘systemic’ refers to emergent or synergistic whole-system effects, for instance gentrification or auto-dependency. Two of the ‘tangible’ items, i.e., those with extensive data on populationdensity and commuting patterns, are then used for a map-based basic delineation, as shown on the lower left of Figure 1, with global data from the GHSL and FUA systems (Pesaresi et al., 2019; Dijkstra et al., 2019).

Figure 1. ‘Making sense of the per-urban’—analysis to applications.
The applications are then seen with the ‘pathways approach’ on the right, as developed in the Peri-cene, a structure and process for exploring complex peri-urban problems and responses. The multiple cycles of problem and response in this diagram, show the three levels of framing: tangibles or causal factors: ‘linkages and relations’: and the ‘systemic’ layer of emergent and synergistic effects. On each level the mapping identifies firstly problems, challenges, impacts or risks: and then the responses, visions, and ‘adaptive pathways’ for transformation.
The basic delineation itself covers only population density and functional areas: these can then overlay with other spatial data such as flood risk, land cover, forest loss etc. (Ravetz et al., 2022b). This is only a starting point for policy applications: some peri-urban effects can be seen cell by cell, while others need interpolation. For instance, the typical combination of landscape degradation, increased flooding, peri-urban sprawl, vulnerable residents and under-funded government, can be highlighted at grid-cell level, and then investigated further, with hydrological models, census data or policy analysis (Carter et al., 2018; Sahana and Ravetz 2024).
In summary, the scheme in Figure 1 starts with the integrated framework (top left) and the three main levels of tangible, relational and systemic. The basic delineation then takes data in one corner of this framework, the physical-spatial parameters of density and commuting. This then supports key policy applications as identified in the peri-urban ‘pathways approach’ (centre right). This paper focuses mainly on one part of this scheme, the basic delineation, and the typologies which can derive from it: we point to possible applications and the pathways approach in the final section.
Figure 1 also shows the various forms of consultation with stakeholders (academics, policy-makers and civic society): this included both a methodological focus on the basic delineation and integrated framework here, and also a thematic focus on problems and responses, such as peri-urban wildfires or flood risk. The consultation is outlined in section 3.
The paper structure is based on an extended series of research questions, each the result of methodological development balanced with consultation. The second section is a literature review on ‘what is the peri-urban’, with its multiple layers and framings. Thirdly, we ask ‘how to explore the peri-urban’, and propose the integrated framework. Fourth, we ask ‘where is the peri-urban’, and propose the peri-urban basic delineation. Fifth, this delineation is applied to ‘which peri-urban types’ with a global typology of land/population/economic/social parameters. Sixth, the question ‘how do peri-urban dynamics work’ applies the basic delineation for an internal typology of the sample city-regions. The paper concludes with an outline of policy applications, limitations and signposts for further research.
As above, there are many layers and framings of the peri-urban showing up in the literature. The brief review in this section is structured by the integrated framework, as in Figure 1, with its three framings: ‘tangibles’ on the ground: ‘linkages’, relations, flows or interfaces: and ‘systemic’ emergent whole-system effects. Also to consider are the multi-scale dimensions, with the peri-urban as an entity not only locally, but in the wider ‘rural–urban-region’ (Ravetz et al., 2013), and the global ‘planetary urbanization’ (Brenner, 2013). With that bigger picture in mind, this section is a brief literature review on the question of ‘what is the peri-urban?’
The historical dichotomy of urban and rural space started to blur in Europe with the emergence of industrialized and liberalized nation states (Bengs and Schmidt-Thomé, 2006). With the growth of mass commuter transport, and then car ownership, the areas ‘beyond and between’ settlements became ever more attractive for living, recreation, and sometimes working. This development led to an expansion of cities, not only in physical housing but also in functional relationships, creating an area of urban influence around cities (Friedmann and Weaver, 1979).
A low-medium residential population density is often taken as the primary definition of the peri-urban, as an intermediate zone between urban and rural. However, much depends on the unit size for analysis, and the questions of contiguity and proximity to urban centres: with further complexity on transient populations or non-residential uses, such as airports.
The PLUREL, a large EU-funded project on ‘peri-urban land-use relations’, considered the peri-urban to be part of a ‘rural–urban-region’ (RUR) as unit of analysis (Piorr et al., 2011; Bryant et al., 1982; Champion et al., 1989; Loibl and Toetzer, 2003; Gallent et al., 2006; Leontidou and Couch, 2007). The basic spatial types which define the RUR include, an urban core, inner areas, suburban, urban fringe, periphery and hinterland (Haase et al., 2013). A working peri-urban definition includes both fringe and periphery, as presented by Ravetz et al. (2013): ‘discontinuous built development, containing settlements of each less than 20,000 people, with an average density of at least 40 persons per km2 (averaged over 1 km cells)’. A functional urban area (FUA) was then defined as “an urban core and the area around it that is economically integrated with the centre, e.g., the local labour market” (Nilsson et al., 2014), based on the statistical unit ‘Larger Urban Zone’ in the European Urban Audit (ESPON, 2008). More recently the FUA has a new global definition and dataset, based on census areas with >15% commuting to the main urban area, with zones now calculated via census data and a learning algorithm (OECD/European Commission, 2019): and this is taken as one part of the ‘basic delineation’ in Section 4.
In contrast “counter-urbanisation” implies an opposite trend to simple urbanisation, i.e., an increase in migration from the city to the countryside (Robinson, 1990). Besides the relocation of services and industry into rural areas, the development of part-time farming, second homes and retirement migration play an important role in this process. Champion et al. (1989) emphasized that such phenomena are not unidirectional but a complexity of flows tending towards de-concentration.
The blurring of the urban–rural boundary inspired research into the idea of an urban–rural continuum. Bryant et al. (1982) showed a model where the urban–rural region ranges from core city through inner and outer fringe, a zone of an urban shadow and out to the rural hinterland. Most recently the term ‘urban–rural interface’ was discussed, emphasizing the mixed character of these areas without fixing them on a single, simple gradient (McGregor et al., 2005). There are many angles on this complex phenomenon. ‘Ex-urbanisation’ was originally coined as “ex-urban” by Spectorsky (1955), for the development of a ring of wealthy rural communities around New York City, characterized by settlements of urban professionals commuting to the urban core for work. Today many of these areas could also be called suburban, and Nelson and Sanchez (1999, p. 689) argued that ex-urbanisation does not differ from suburbanisation, but that ex-urbia ‘is simply the latest incarnation of the continued suburbanisation of American cities.’ Ex-urbs are now found in many forms, such as in southern Spain with new estates for retired people from northern Europe (Zasada et al., 2010; Taylor and Hurley, 2016).
There are specific applications in different locations, such as the Wildland-Urban Interface (WUI) (Radeloff et al., 2005). This is based on a minimum one dwelling per 16 ha, with ‘intermix’ where over >50% of land is vegetated, or ‘interface’ with less than 50%.
The global urban system shows huge variety: for example cities in developing countries have three times the average density of cities in industrialised countries (Angel et al., 2005). However, the current trend sees density reducing by 1.7 per cent per year, and if such trends continue to 2050, built-up areas could triple to more than 600,000 km2. A global remote monitoring study looked at four main types of urban growth: low-growth cities with modest rates of infilling; high-growth cities with rapid, fragmented development; expansive-growth cities with extensive dispersion at low population densities (generally North American); and ‘frantic-growth’ cities with very high land conversion rates and population densities (generally found in developing countries) (Schneider and Woodcock, 2008). Each of these types had different spatial patterns, whether dispersed or constrained: and scattered or contiguous development. To this could be added a fifth type, that of negative growth, or shrinking cities (Couch et al., 2007). A global study also defined ‘urbanized’ in contrast to ‘steadily/rapidly urbanizing’ (Gao and O’Neill, 2020). Generally, these definitions of ‘urban’ include what we term here the ‘inner peri-urban’ or fringe, in close proximity to the urban area. The ‘outer peri-urban’, which could be termed ‘peri-rural’, where the rural areas are in transition under urban pressures—has not yet been studied at this scale. Generally, urban and peri-urban expansion should be seen not only as negative, but with major benefits for the majority of the world’s population who currently occupy an average 3.5 m2 habitable area per person (Hardoy et al., 2001; UN Habitat, 2022).
Clearly peri-urban areas are not isolated entities, but highly inter-connected parts of larger city-region systems, a spatial-functional hinterland, with overlapping economic, ecological, social or political units (Ravetz, 2000). Often, the peri-urban is used to describe newly urbanised zones at the fringes of cities, especially in developing countries, which are then called the ‘peri-urban interface’ (Adell, 1999; McGregor et al., 2005). The Council of Europe (CEMAT, 2007) defines the peri-urban as a transition area moving from strictly rural to completely urban, related to a high pressure towards urban development (Bertrand, 2007). Conversely, peri-urban areas can be far from ephemeral, but instead can form a new kind of landscape. Furthermore, such development is not only physical development with urban characteristics, but sees the emergence of urban activities in rural areas, such as hobby farms and second homes (Briquel and Collicard, 2005; Ravetz, 2011, 2024).
Perhaps the principal enabler of modern peri-urbanization is the transport network and infrastructure, and the systemic effects of car-dependency. Charting transport energy demand against urban density shows a huge spectrum, from hyper-dense Hong Kong at 300 persons per hectare, to Atlanta or Phoenix, with just 6 pph (Newman and Kenworthy, 1999). One practical application is the ‘Urban Fabrics’ scheme, which maps three types of urban form and accessibility (Newman et al., 2016): ‘walking city’ with densities over 100 pph (persons per hectare) near to major nodes: the ‘transit city’ over 50 pph: and an ‘automobile city’ of less than 20 pph spread out across large areas. In reality while urban policies promote walking/transit, there are powerful forces pushing the other way: as shown by European cities of low population growth, where peri-urban areas are doubling every 30 years (Piorr et al., 2011). This points towards a landscape of ‘non-places’, transient, artificial, anonymous and alienated: with the logic of speed, this generates ‘auto-areo-mobility’, mono-functional nodes with rapid expansion at road interchanges, where the main pedestrian areas are now inside the hyper-malls and airport terminals (Kasarda and Lindsay, 2011).
The role of the peri-urban in Asia can be very different to that in Europe or North America. The Asian model shows a rapid transition from subsistence agriculture towards a globalized development pattern (Jones and Douglass, 2008; Ginsburg and Koppel, 2004; Leaf, 2011; Sreeja et al., 2017; Webster, 2011). By contrast, in the North American type there is a focus on the ‘edge city’ as a new kind of CBD, and the rural as a zone of enterprise and opportunity (Garreau, 2011; Daniels, 1998). Overall the peri-urban and rural hinterland is rarely a defined zone, but highly inter-dependent and inter-woven with urban areas. Indeed, Webster (2011) suggests that it is, perhaps, fruitless to try to define the peri-urban, but rather more useful are grounded accounts of the varieties of ‘peri-urbanisation as a process’.
Such complexity is then visible as urban sprawl—generally a land use pattern with lower density, inefficient or wasted land-use, car dependency and ambiguous structures and patterns (Reckien and Karecha, 2007). This raises many questions on which spatial unit of analysis is to be assessed: for example, is an airport or peripheral industrial zone classed as urban sprawl, or development zone, or both? A more technical definition of sprawl looks for low values in one or more of eight measures: density, continuity, concentration, clustering, centrality, nuclearity, mix of uses, and proximity (Galster et al., 2001). In simple terms two definitions for sprawl seem relevant: ‘unplanned incremental urban development, characterised by a low density mix of land uses on the urban fringe’ (EEA, 2006): and ‘Low density, scattered urban development, without systematic large scale or regional public land-use planning’ (Bruegmann, 2008, p. 18; Reckien and Karecha, 2007).
Such definitions can be explored further by looking at the systemic features of sprawl versus ‘normal’ urban areas. At the system level, a city or city-region can be framed as a ‘system’ of inter-connected parts, with multiple layers of interactions, social, economic, technical or political. By contrast areas of urban sprawl are apparently ‘non-systems’, characterized by gaps and conflicts, where the normal concept of ‘system’ is hardly relevant, as in the concept of ‘anti-city-region’ (Ravetz, 2020, p. 79–83).
Human-ecosystem linkages and interactions are decisive for peri-urban land use relationships. For example, the peri-urban has aesthetic and social cultural value for a variety of people (Gallent et al., 2006; Sylla et al., 2019), not least for those living in the urban core (Ives and Kendal, 2013). This implies an important cultural dimension and place-based agenda in defining the peri-urban (Taylor and Hurley, 2016). For example, early definitions of ‘exurbia’ noted the attraction for the affluent middle classes, in search of cheaper house prices along with proximity to countryside (Spectorsky, 1955). Meanwhile, in cities such as Mumbai and Johannesburg, there is a complex mix of residents including both rich and poor, in competition for scarce resources with existing peri-urban informal settlements and villages (Sreeja et al., 2017). Such a phenomenon sees the peri-urban indigenes as ‘bypassed’ or ‘left-behind’ by a dynamic and largely unplanned peri-urbanisation process (Rajan, 2017). Meanwhile Hui and Wescoat (2019) visualized the peri-urban and ‘rurban’ (‘rural–urban’) areas based on water systems in transition zones, and Sutton et al. (2010) used night-time satellite imagery for mapping peri-urban areas of Australia.
Such linkages raise challenges on distribution, access to resources, decision-making and representation, and hence the concepts of political ecology have emerged (Heynen et al., 2006; Karpouzoglou et al., 2018). Peri-urban areas generally contain large urban infrastructures, such as water, waste and sewage treatment, typically located away from the central urban core. The displacement of former activities, environmental impacts, and associated privatization or financialization of resources, all have significant implications for environmental justice (Tzaninis et al., 2021). Meanwhile peri-urban areas offer significant climate change functions for urban areas, e.g., through green corridors or catchment-based flood management, which may be eroded by land use change and changing agricultural practices (Carter et al., 2018). The protection of such areas by ecological or spatial planning, then attracts higher income residents and visitors, in a process of peri-urban ‘eco-gentrification’ and polarization (Gallent et al., 2006; Ives and Kendal, 2013). Urban–rural combinations have emerged in national cultures, such as the ‘rus in urbe’ of English urban design (Melvin, 2018).
From the above it is clear that the peri-urban, as a different type of settlement pattern that is neither urban or rural, can facilitate new lifestyles and modes of being (Cusin et al., 2016): this calls for both technical analysis and deeper anthropological accounts (Webster, 2011; Garner, 2017). Historically, some have characterised the peri-urban as an enclave of the middle classes who have access to cheap land and can perform long commutes, or those who cherish living close to nature combined with urban lifestyles (Luka, 2017; Vejre et al., 2010). However, the peri-urban has also been characterised as the space where the have-nots may be ‘banished’, such as the banlieus in Greater Paris, ‘projects’ and peripheral estates in the USA or UK, or shanty towns or ‘resettlement zones’ in India (Cusin et al., 2016). Across both South and North, rural villages become engulfed or bypassed in the peri-urban wave, which disrupts livelihoods and generates conflicts over land uses and natural resources (Abramson, 2016; Rajan, 2017; Sreeja et al., 2017).
Such widespread fragmentation can then be framed as a system transition in itself. For example the so-called ‘post-metropolis’ or ‘carceral city’ is not only a physical sprawl over huge areas of the peri-urban: it tracks ‘increasing cultural diversity, rising economic inequalities and social polarization, and changing urban forms and functions’ (Soja, 2000).
In general peri-urban areas expand around the highway network, often in a landscape of ‘non-places’: transient, artificial, anonymous and alienated (Augé, 1999). The logic of speed generates mono-functional ‘parks’ and ‘malls’ around road interchanges and the ‘aero-tropolis’ (Kasarda and Lindsay, 2011). As such areas are lacking in traditional urban qualities of proximity and synergy, the term ‘anti-city-region’ is a useful frame (Ravetz, 2020, p. 89). The anti-city-region includes an expanding range of peri-urban settlements: from airport complexes to tourist villages, mining camps, university towns, religious communities, prison complexes, squatter or refugee camps. As such ‘planetary peri-urbanization’ is now accelerated by digital communications, we may expect many more peri-urban types in the anti-city-region of the future (Brenner, 2013).
The systemic dimension includes not only the tangibles of land-use and population, but of governance and cognitive systems at every level. For peri-urban governance, lacking the proximities and synergies of urban areas, the challenges are greater, as are the opportunities. Green Belt and equivalent policies around the world, often struggle with urban pressures, and many such areas are polluted, damaged and divided (Gallent et al., 2006; Henderson, 2005; Westerink et al., 2013).
Generally the peri-urban governance combination can be framed on different levels: (a) a functional system of regulation, (b) an evolutionary system of value competition and gentrification: or a ‘co-evolutionary’ system of synergies, between residents, workers, ecologists, farmers, visitors and so on (Ravetz, 2020). Such synergistic qualities can be seen in many peri-urban initiatives which address governance gaps, expropriation, exclusion or ecosystems destruction: from ‘sprawl repair’ (Tachieva, 2010), to ‘eco-belts’ (Douglas and Ravetz, 2011), and socio-ecological innovations (Scott et al. 2013). Such new opportunities can be framed as an emerging ‘collective peri-urban intelligence’: the capacity for mutual communication, learning, co-innovation and co-production, between a wider community of stakeholders, with deeper layers of value, and further horizons of change (Ravetz, 2020, p. 92).
The above review shows not only peri-urban diversity, but also ‘policy diversity’, in how policymakers and other stakeholders perceive, plan, manage or operate in the peri-urban. With that as a starting point, the integrated framework and basic delineation were developed in tandem through the 24-month Peri-cene consultation. This included academics, urban-regional policy-makers and civil society (also entrepreneurs in Manchester and Chennai), in each of the 16 active partner city-regions, via interviews and workshop sessions (there was an additional challenge of shifting all discussion to online due to COVID-19). The first stage (2019–20) focused more on the existing concepts and prototypes for the basic delineation, (in parallel with other issues on climate change risk and resilience):
• Literature/technical review of the recently launched GHSL/FUA systems, was discussed with stakeholders
• Initial questions for consultation focused on scoping and problem mapping: (a) “Where is the peri-urban in your area, (i.e., which locations are generally considered peri-urban)”: (b) ‘What are the key issues and challenges in the peri-urban?’ and (c) ‘How far does policy recognize or respond to such peri-urban areas?’
A second stage (2021) then focused on testing the methods and pilot results with stakeholders, and exploring the application to the forward ‘adaptive pathways’ and collaborative governance:
• Technical review: the stakeholders were shown draft maps of their areas, and asked to comment on the question - ‘How far do the results of the ‘basic delineation’ method help with the question for your area, on ‘where is the peri-urban”?
• Systemic review of the integrated framework and its policy applications, with questions such as ‘Can the integrated framework help with policy development for ‘adaptive pathways’?
The overall finding was a widespread lack of awareness of peri-urban issues, with fragmented and ineffective governance systems, and near-zero levels of operational climate change policy (Ravetz et al., 2022b). Most stakeholders had some idea of the peri-urban concept and its many challenges, but could not commit to anything more precise. However in some city-regions the question was answered in part by the existence of policies such as green belt, housing restrictions, or peri-urban village schemes, with defined areas on the map. This is a brief summary of findings, based on the Peri-cene synthesis report (Ravetz et al., 2022a, 2022b).
• Formal policies similar to green belt were found generally in higher income cities such as Manchester, Toronto, Helsinki, Changsha, San Diego;
• Peri-urban village or rural housing policies were found in Chennai, Surabaya, Santiago;
• Rapid expansion areas saw various types of infrastructure policies: e.g. Melbourne, Bangkok, Dhaka, Doha, Cairo, Johannesburg;
• Slower expansion areas, such as around Naples, were managed with rural-facing socio-economic policies more than land-use zones.
Further details would be reported elsewhere, but here the consultation showed the Peri-cene integrated framework was found by most stakeholders to be a useful ‘boundary object’. It could help with mapping of complex problems and responses, and further down the line, inform policy delineations such as green belt or similar above. The basic delineation as described here, also raised technical questions such as band definition, grid cell size, or the continguity rules, but as a ‘best available’, linked to global urban data analysis, it was deemed by most stakeholders to make a useful contribution to developing evidence-based policy.
For the question of ‘where’, the above suggests no simple answer. As in the above review, the peri-urban appears as many things—tangible conditions on the ground, relations and linkages, and emergent systems, with endless diversity from local to global. By review and consultation a peri-urban integrated framework has emerged (following an earlier version in Sahana et al., 2023). This includes three main framings, and multiple layers in each, as in Table 1 and Figure 2 below:
a. Tangible, physical, spatial framings: starting with land-use, population density and built form: these are the tangible physical features seen ‘on the map’, and hence the first focus of any peri-urban definition, ‘delineation’ or ‘demarcation’;
b. Relational flows and linkages: the many forms and patterns of interactions, proximities, flows, inter-dependencies and linkages. Some aspects can be referenced to the tangible data above, but others may not show directly on the mapping, and may have a different logic;
c. Systemic/emergent framings: this applies to whole system with qualities more than the sum of the parts, such as the examples above of sprawl, bypass or carceral cities. This also points to fundamental systems features such as complexity, emergence, transitions, co-evolution of cognitive systems and capacity for ‘collective peri-urban intelligence’ as above.
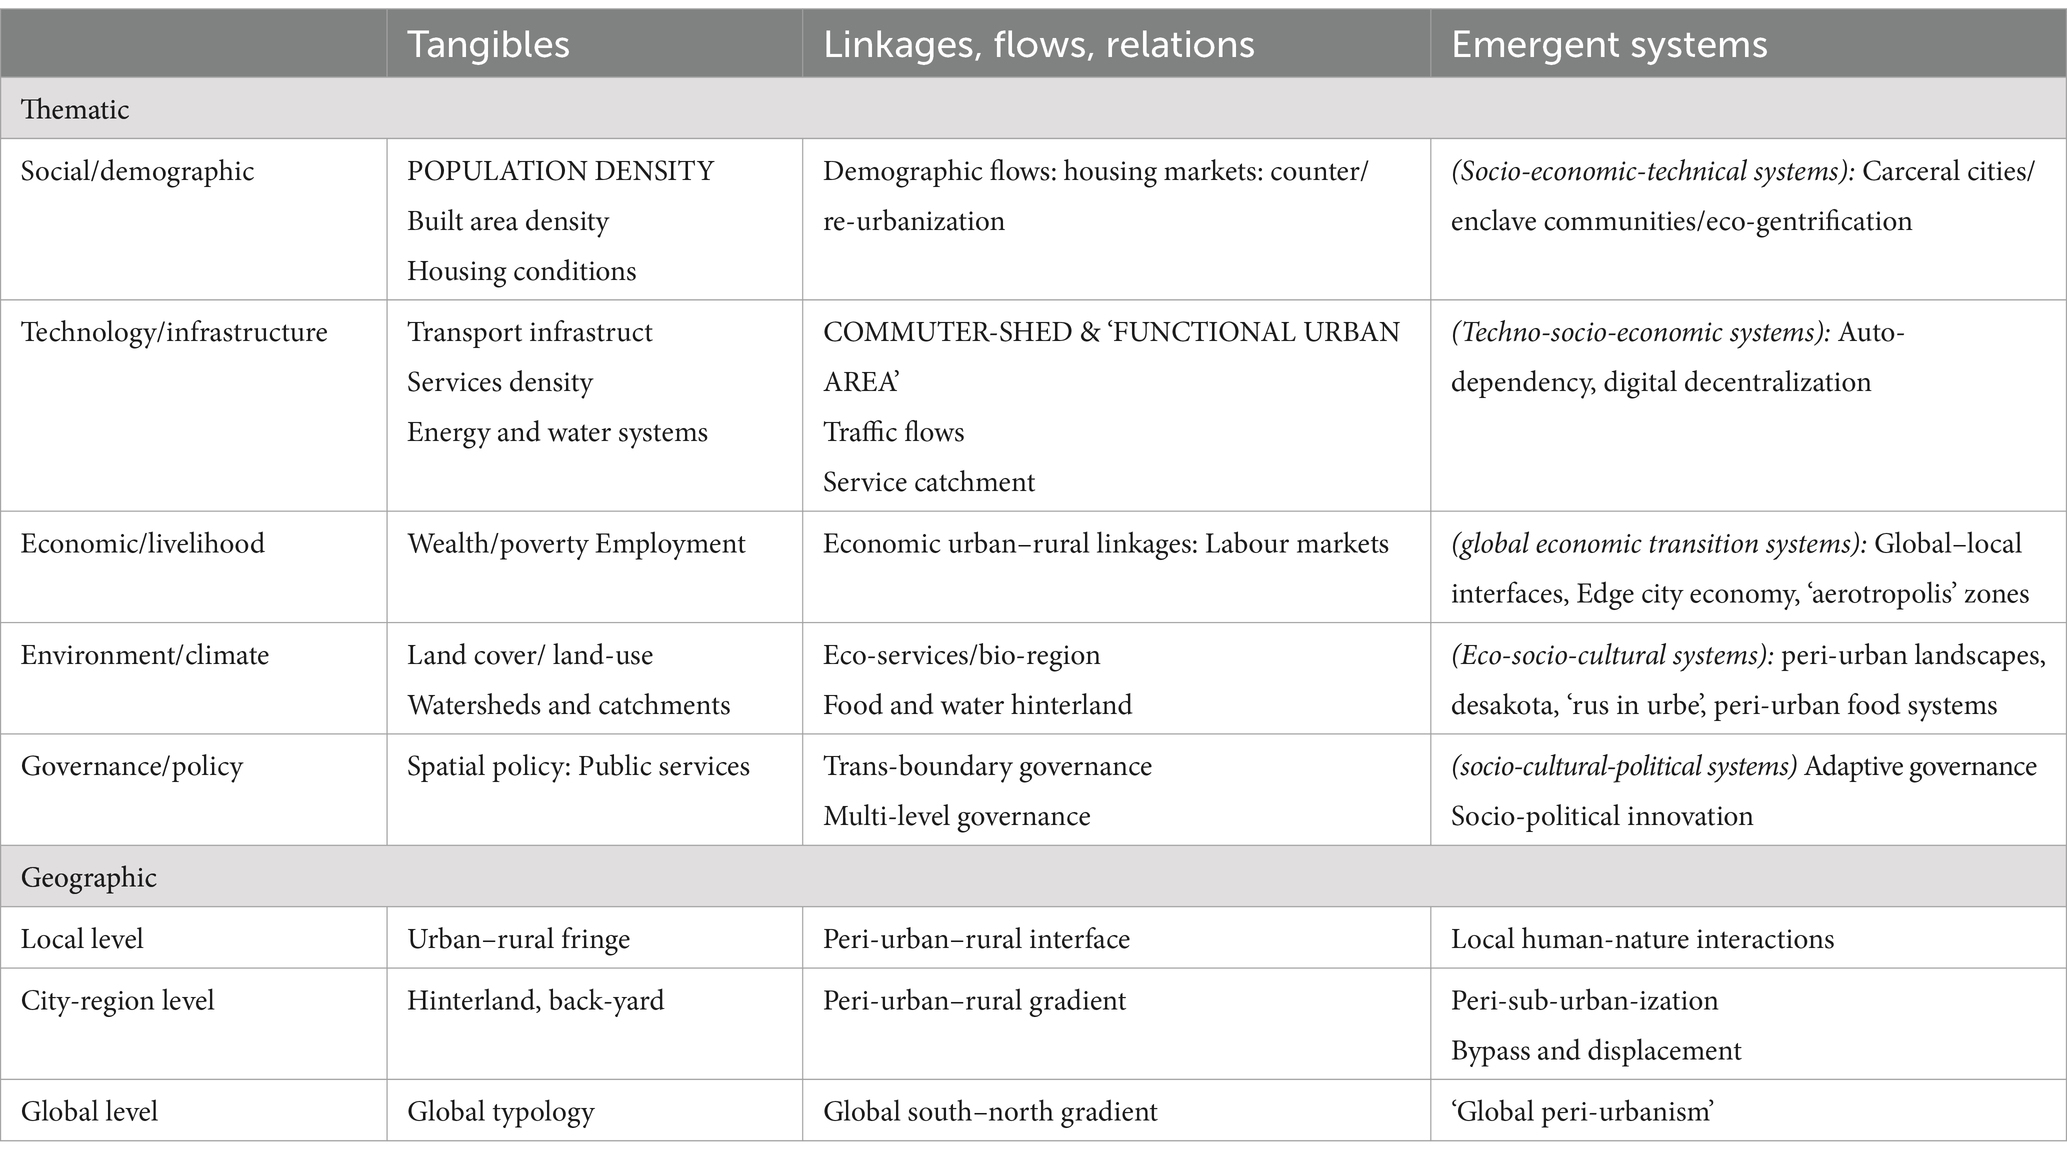
Table 1. Peri-urban integrated framework.
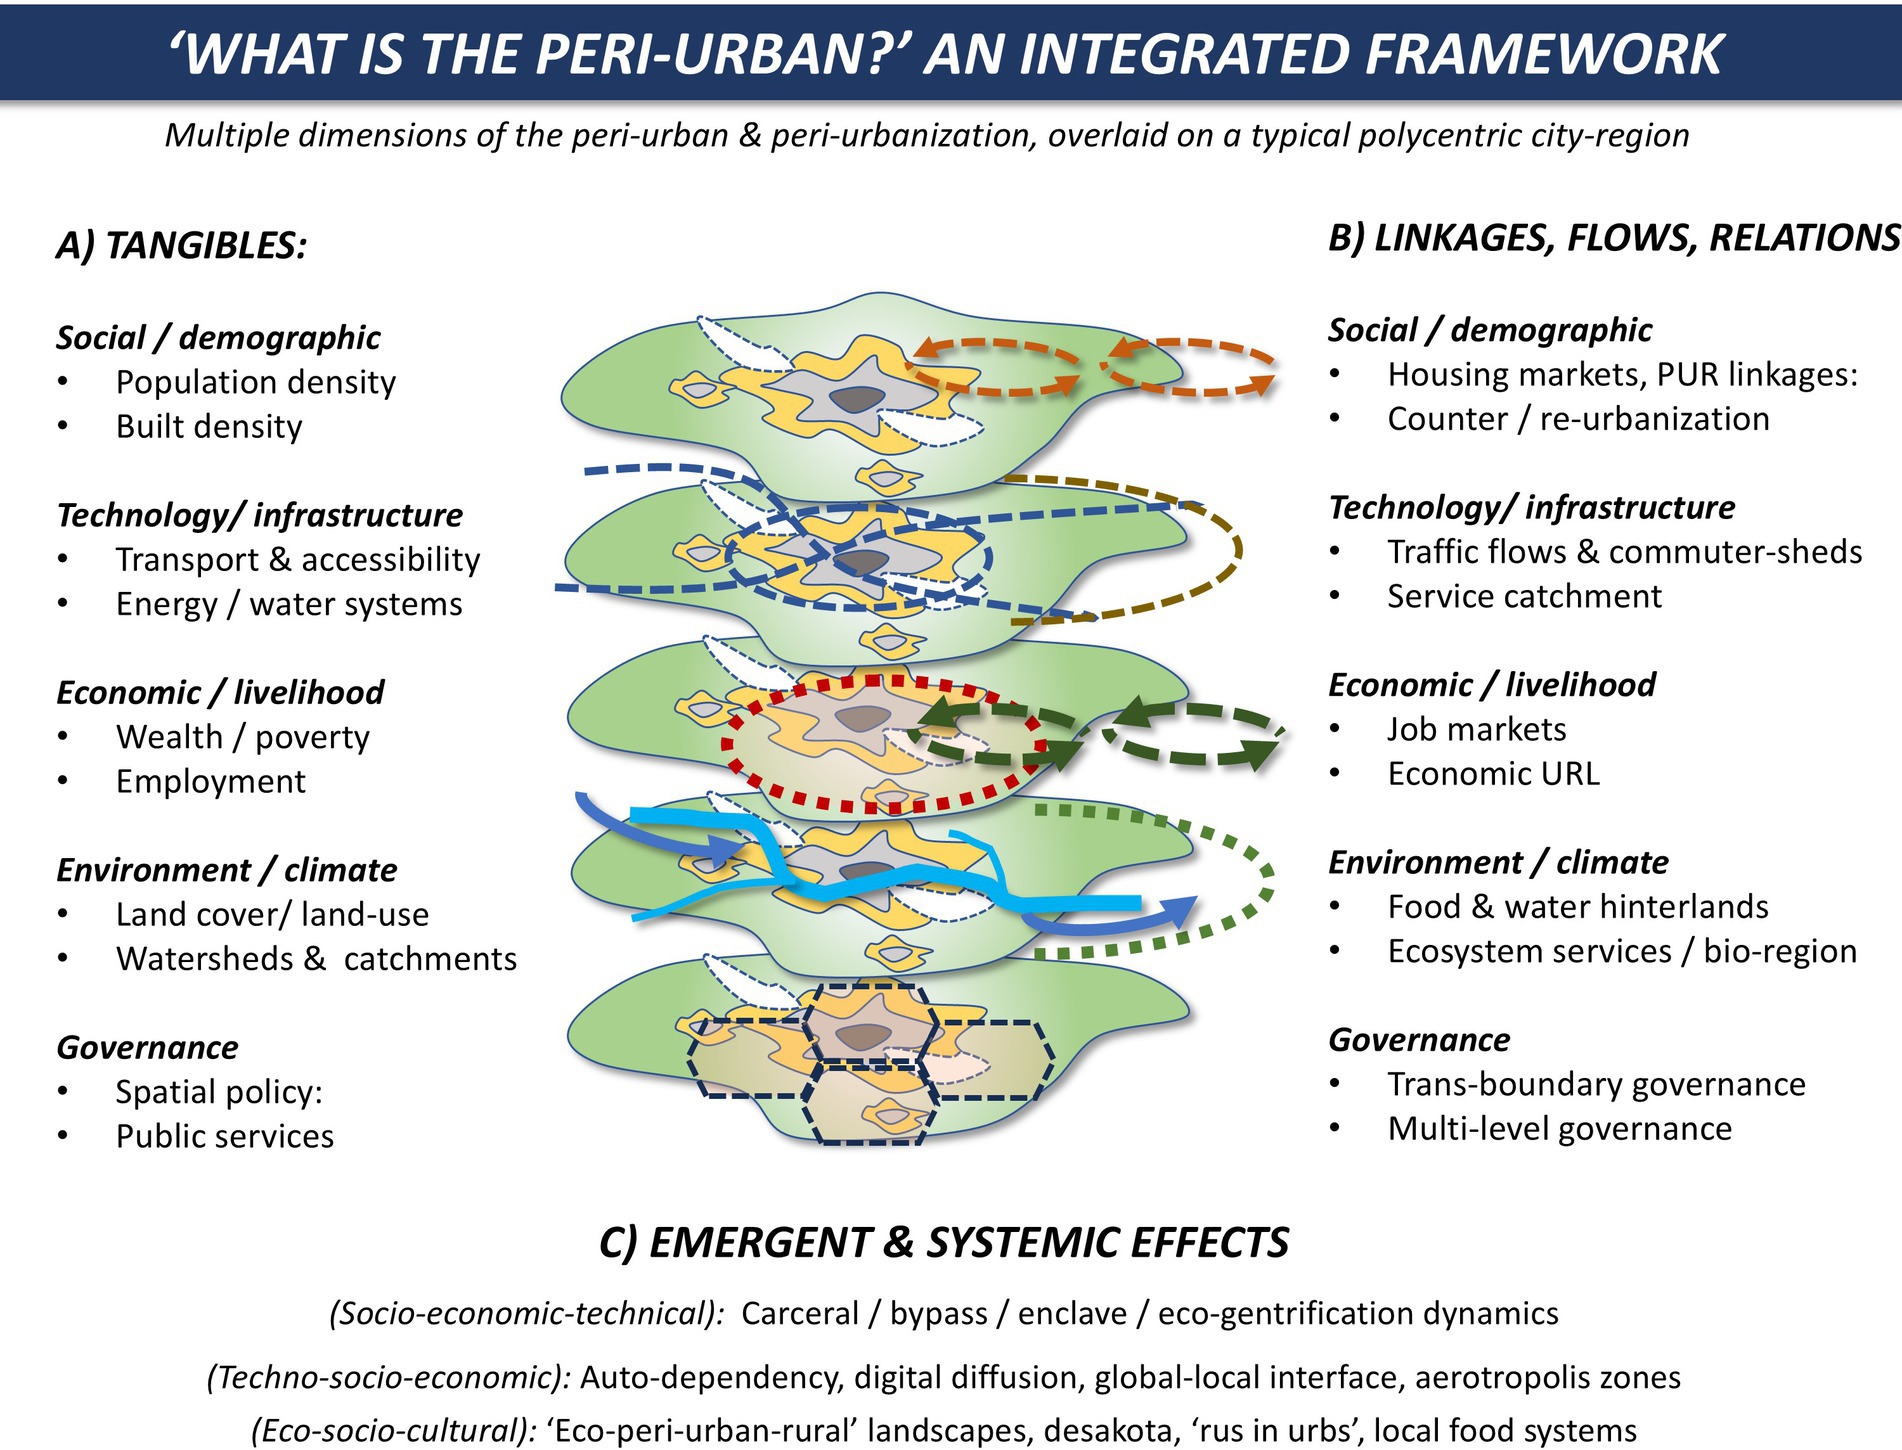
Figure 2. What is the peri-urban? An integrated framework.
Each of these can be found in different thematic layers: (this scheme is a simple summary based on the ‘STEEP’—‘social, technical, economic, environmental, political’ as in Loveridge, 2008).
• Social/demographic: residential population density: demographic flows: housing provisions and markets: counter- or re-urbanization. Systemic effects such as carceral cities, sprawl cities, eco-gentrification and exclusion (Soja, 2000).
• Technology and infrastructure: transport and accessibility: commuter-sheds and service catchments: energy, water, materials, waste systems and hinterlands. Systemic effects include auto-dependency and digital decentralization (Newman and Kenworthy, 1999);
• Economic/livelihood: ‘functional urban area’ and gravity fields: economic development processe: real estate and land markets as drivers of change; labour markets and services catchments: peri-urban–rural linkages and transfers. Systemic effects of aerotropolis, ‘local globalization’, bypass communities (Kasarda and Lindsay, 2011).
• Environment/climate: land cover, land-use or landscape types: eco-region/bio-region: food/energy/water landscapes: ecosystems and climate services: climate impacts, risk and resilience, adaptation: bio-regional and socio-ecological perspectives. Systemic effects include the desakotas, and other eco-peri-urban–rural combinations (McGee, 2002).
• Policy/governance: territorial spatial planning: multi-level governance and under/over bounding questions. Fiscal and service models in extended forms of spatial planning, sub-regional development: also including systemic features of nepotism and elitism, and/or emerging forms of adaptive-collaborative governance (Winter and Karvonen, 2022).
Each of these can be seen at different unit scales and geographical levels, with many forms of interaction between local, regional and global:
• Local level: tangible details include edges, fringes, pockets, clusters, corridors, etc. Linkages are seen with social-ecological interactions, housing values, or leisure and tourism. Systemic effects see micro-geographies of ‘place-making’ or ‘locality’, with places/spaces of innovation, identity, disorder and resistance (Clay, 1994);
• City-region/conurbation levels: at the territorial level, more linkages and co-dependencies come into view with peri-urban expansion. Systemic effects see many overlapping transition effects, where the peri-urban is a vital component of metropolitan regions or bio-regions (Friedmann and Weaver, 1979);
• Mega-regional/global level: here the south–north tangibles and linkages point to the macro-scale typologies of income, inequality, urbanization, and governance. Systemic effects suggest global perspectives such as the anthropo-cene or ‘urban-ocene’, which suggest the concept of a planetary peri-urbanism (Brenner, 2013).
The unit combined integrated framework is summarized in Table 1, noting that many categories overlap. Key synergistic combinations can then be identified, at least in outline: for instance, road-building (a tangible effect) may encourage auto-dependency (systemic effects), which then impacts on land-use change (tangible effect) and ecosystems services (linkages) (Taylor and Hurley, 2016). This is then the key to policy applications and the Peri-cene ‘pathways approach’ (Figure 1, right side), which takes the 3-part framework into a structured mapping of complex systems problems and responses (Ravetz et al., 2022a, 2022b).
Of these alternative approaches, the upper left corner in Table 1 provides the focus of the basic delineation in the following sections. Again, the aim of such a framework is not one ultimate definition or ‘boundary on the map’: rather a broad structuring of a diverse and complex landscape. This helps to put in context the ‘where’ question: some parameters are suited to spatial data, while others require other modes of enquiry, which may be supported with spatial data. This is an ongoing discussion, in which the basic delineation is one small contribution to a wider investigation.
Alongside the over-arching integrated framework, there is a practical need to delineate peri-urban areas ‘on the map’, for policy, enterprise, civil society and research. In that sense we address the question of ‘where’, not as some ultimate truth, but as a practical reference point for further enquiry.
The Peri-cene developed through various pilots this basic delineation, tested by consultation with stakeholders and academics, centred on the practical question—‘where is the peri-urban in your city-region?’. There is huge variation in urban and peri-urban densities and gradients around the world, so that any single typology is challenged by outliers. In Bangladesh for instance, many ‘rural’ areas of mainly subsistence farming are at >750 pp/km2, while in the USA, many ‘urban’ areas are spread out at <125 pp/km2. Some extended megacities and poly-centric agglomerations spread widely ‘beyond or between’, so the mapping adopted a standard 200 km wide ‘box’ to include for such effects.
The development process included various experiments, such as urban ‘potential’ or gravity field mapping, of a population-weighted proximity function. The results were interesting but not favoured in consultation: there was little consensus on band delineations, and larger gravity fields tended to over-ride the fields of smaller towns. In the event, a decision was taken to adopt the ready-made FUA database of the OECD, based on labour market/commuting data, with empirical evidence from OECD countries, and a learning algorithm for other areas (Dijkstra et al., 2019).
The GHSL (‘Global Human Settlements Layer’) system was then selected as the new global standard dataset, with an evolving methodology which had not previously focused on the peri-urban question (Pesaresi et al., 2019). A geospatial analytic process retrieved 1 km cell built-up and population layers from the GHSL portal for the 21 case study cities: urban density bands were delineated from raster layers of both built-up and population data, using the ArcGIS raster calculator and spatial analysis tools. To differentiate built-up areas within Functional Urban Area (FUA) for each city, we utilized vector layers, with ArcGIS zonal statistical functions. Analysis of rates of urbanization and other statistical comparisons then proceeded on spreadsheets.
From the above, the basic delineation is a simple combination of two factors, as shown by the capital letters in top left and centre of Table 1, with colour coding as shown in Table 2 and Figure 3.
• Residential population density: the peri-urban is defined as 2 land-use types, between 50–125 (light green) and 125–300 persons/km2 (yellow), as defined by the GHSL system in 1 km2 grid cells;
• FUA (‘Functional Urban Area’), i.e., zones of clustered economic activity, from a global classification (OECD/European Commission, 2019) (shown as pink overlay).
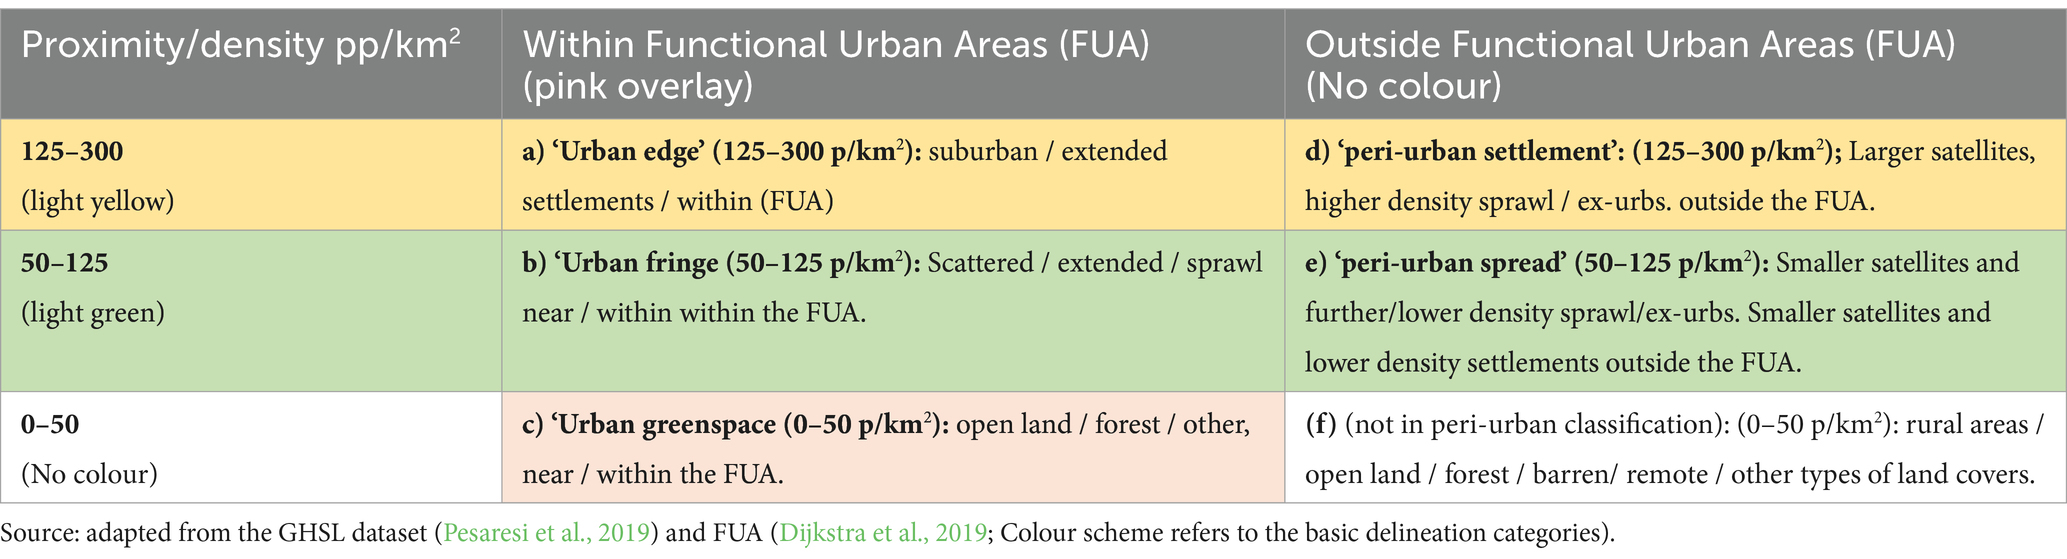
Table 2. Where is the peri-urban? A basic delineation.
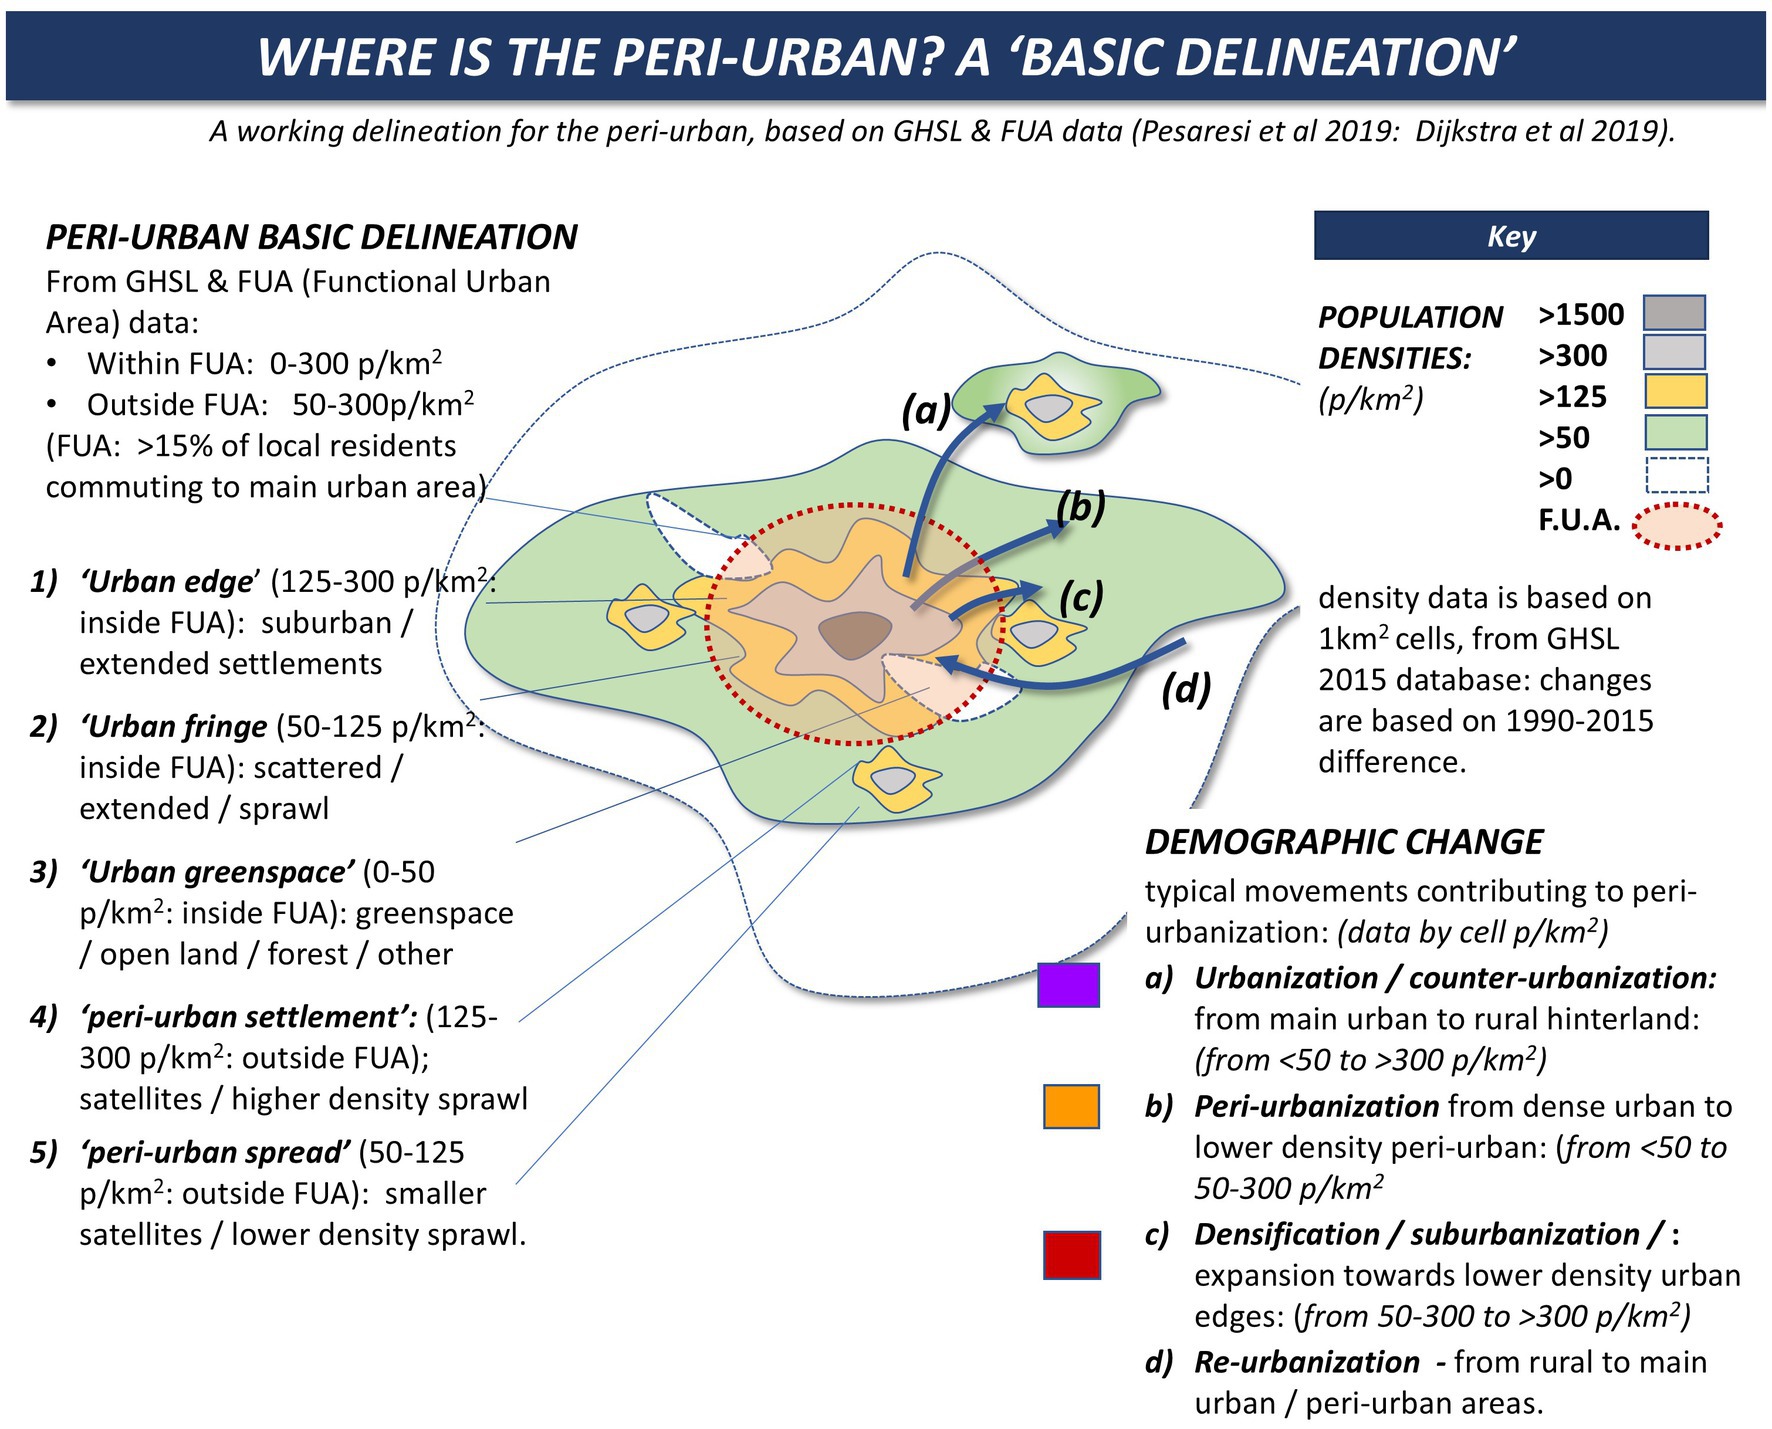
Figure 3. Where is the peri-urban? A basic delineation.
Fitting the different densities with the FUA units (or equivalent), produces five distinct geographical zones, each described with a simple label:
a. ‘Urban edge’ (125–300 p/km2: inside FUA): suburban/extended settlements.
b. ‘Urban fringe’ (50–125 p/km2: inside FUA): scattered/extended/sprawl.
c. ‘Urban greenspace’ (0–50 p/km2: inside FUA): greenspace/open land/forest/other.
d. ‘Peri-urban settlement’: (125–300 p/km2: outside FUA); satellites/higher density sprawl.
e. ‘Peri-urban spread’ (50–125 p/km2: outside FUA): smaller satellites/lower density sprawl (the final category (f) (0–50 p/km2: outside FUA), is deemed ‘non-peri-urban’). This ‘rural areas/bio region’ category includes open land/forest etc., from near urban to rural hinterland or remote/uninhabited areas).
Based on this typology, a set of ‘key mappings’ was created for each of the 21 cities in the Peri-cene Policy Lab. As in the example comparison of Manchester and Chennai in Figure 4, the yellow 1 km cells show the higher peri-urban densities of 125–300 p/km2, while the green cells show the lower peri-urban densities of 50–125 p/km2. The transparent overlay then shows the ‘Functional Urban Areas’, defined by the OECD as areas of most concentrated urban/economic activity (Dijkstra et al., 2019).
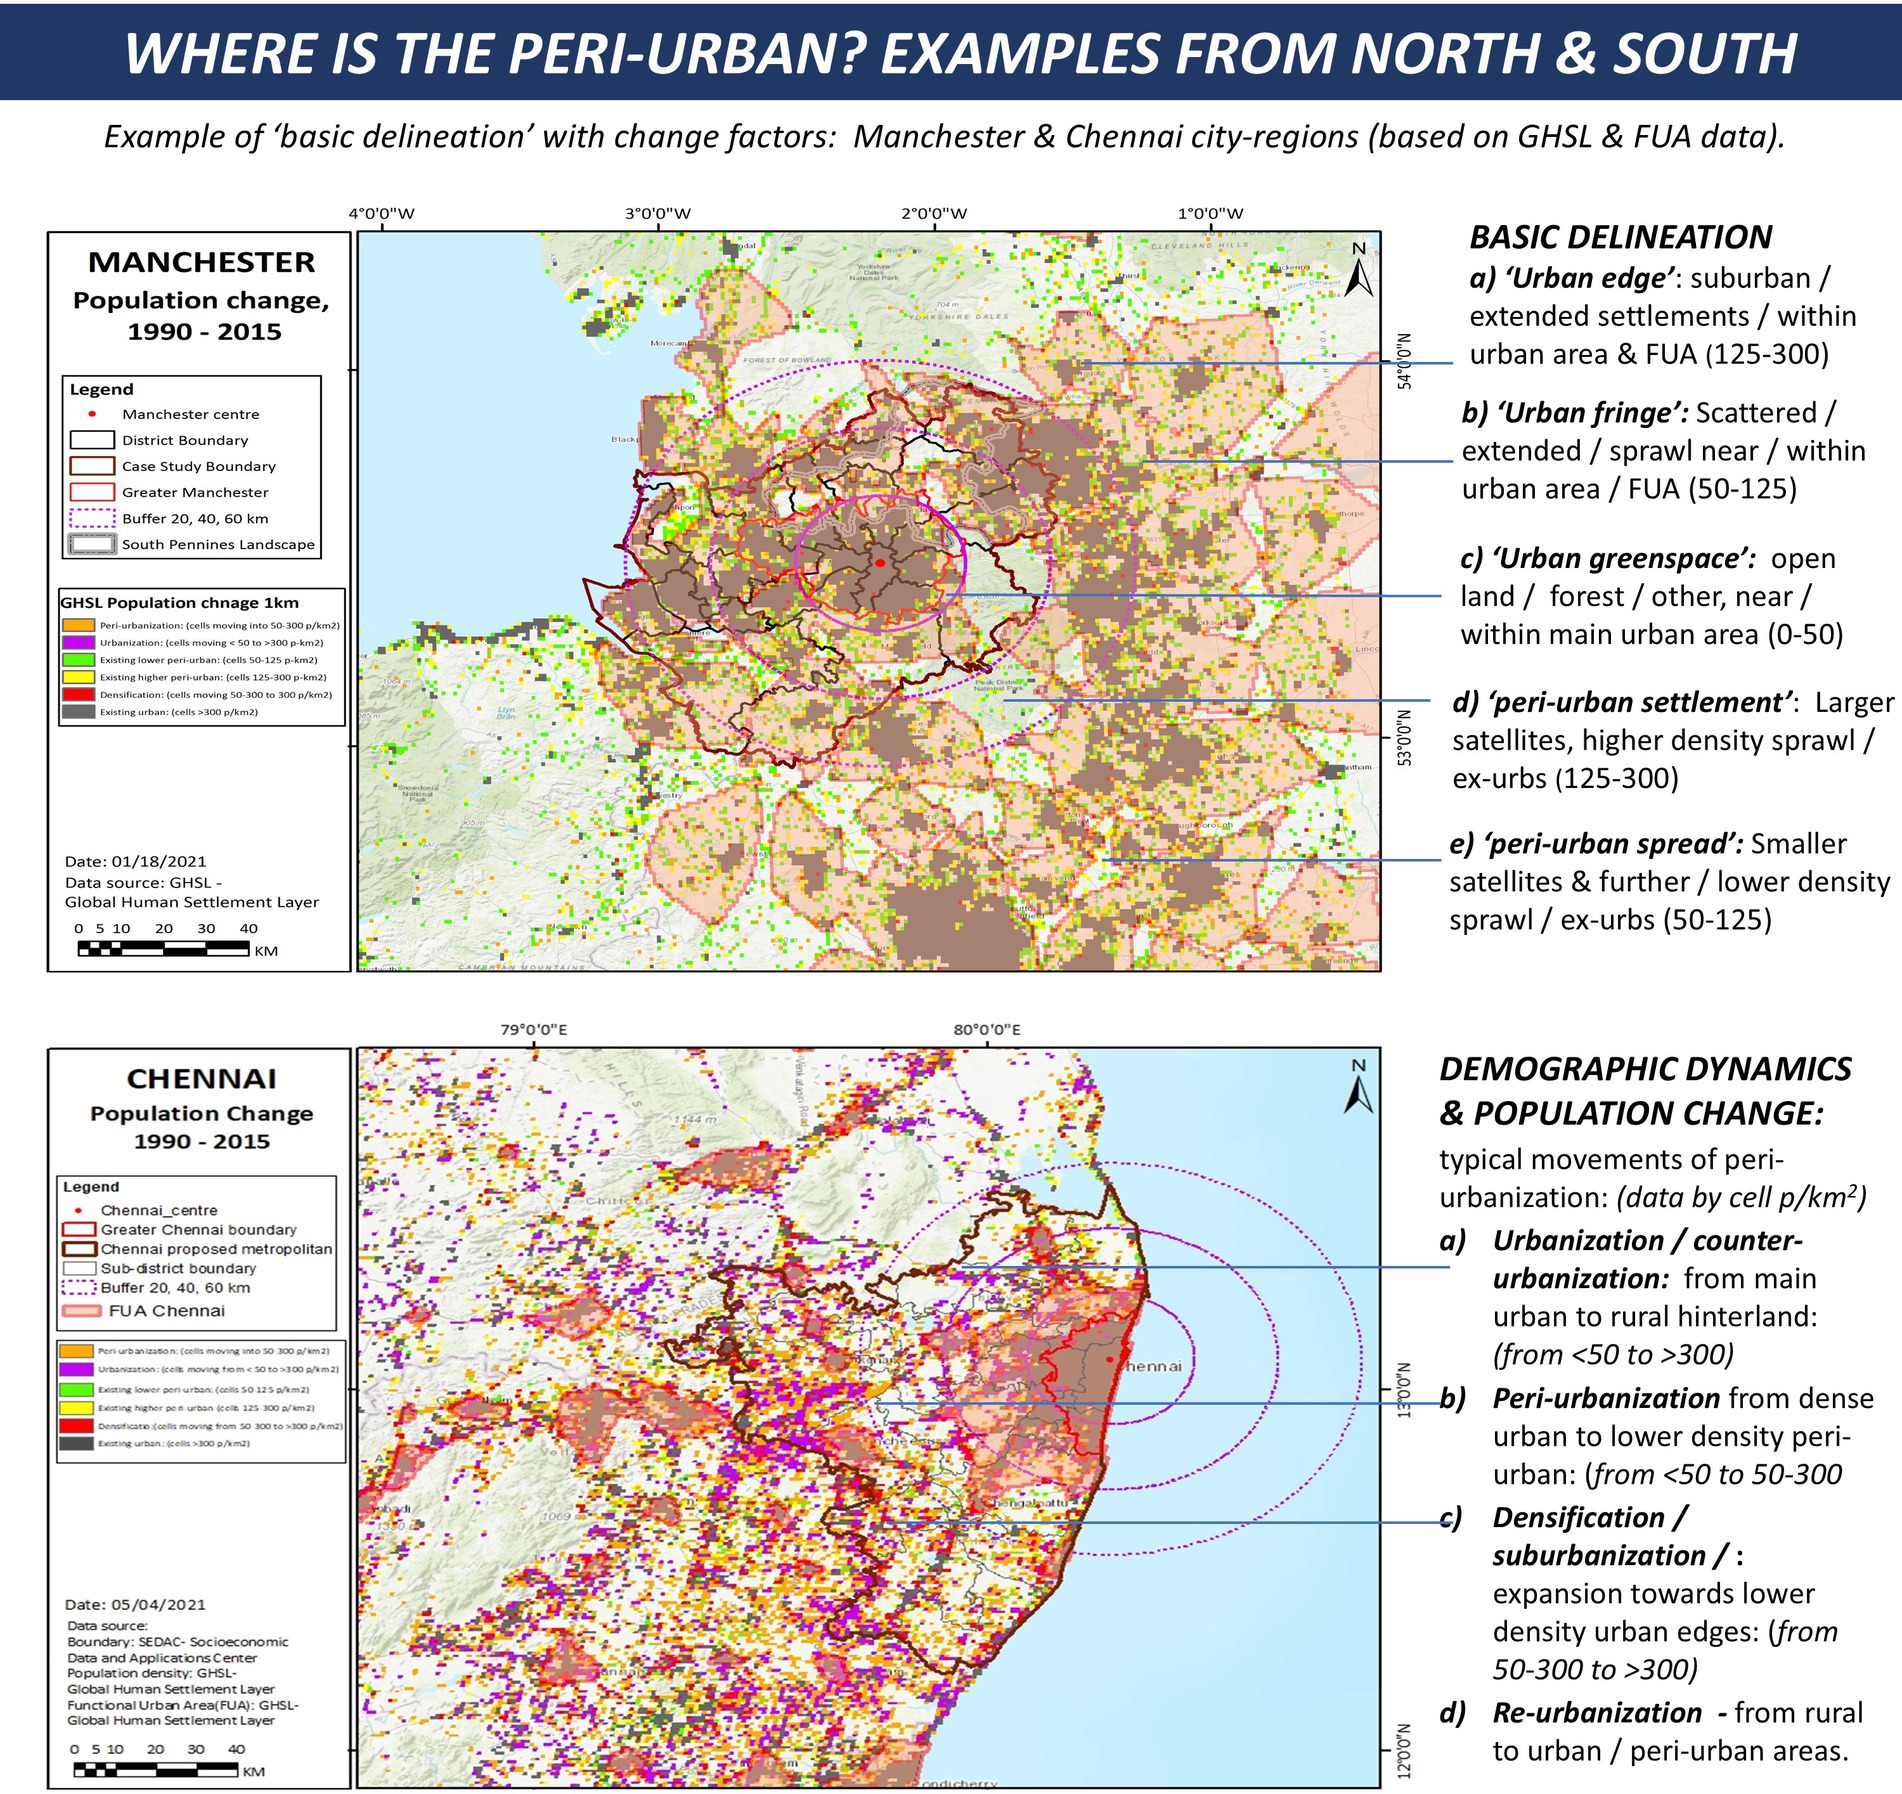
Figure 4. Where is the peri-urban? Manchester/Chennai comparison.
This combined mapping also includes change factors: orange, red and purple cells show changes from 1990 to 2015, to and from rural to peri-urban and to urban types (see the legend on the left). In addition the dotted circles of 20, 40, and 60 km radius, show rough proximity bands from the main CBD: this non-scientific measure was suggested by stakeholders, as a very simple measure of conurbation effects, underlying any more complex polycentric patterns.
The basic delineations above then provide a set of indices for global comparison on peri-urbanization (Table 3). We can then explore questions such as - What is the current proportion of the population in the peri-urban classes? How fast is the peri-urban population or land area growing, and what is the projected growth in 25 years? Here the compound growth figures are the key item of concern, and this is the basis for the comparative review in the following sections.
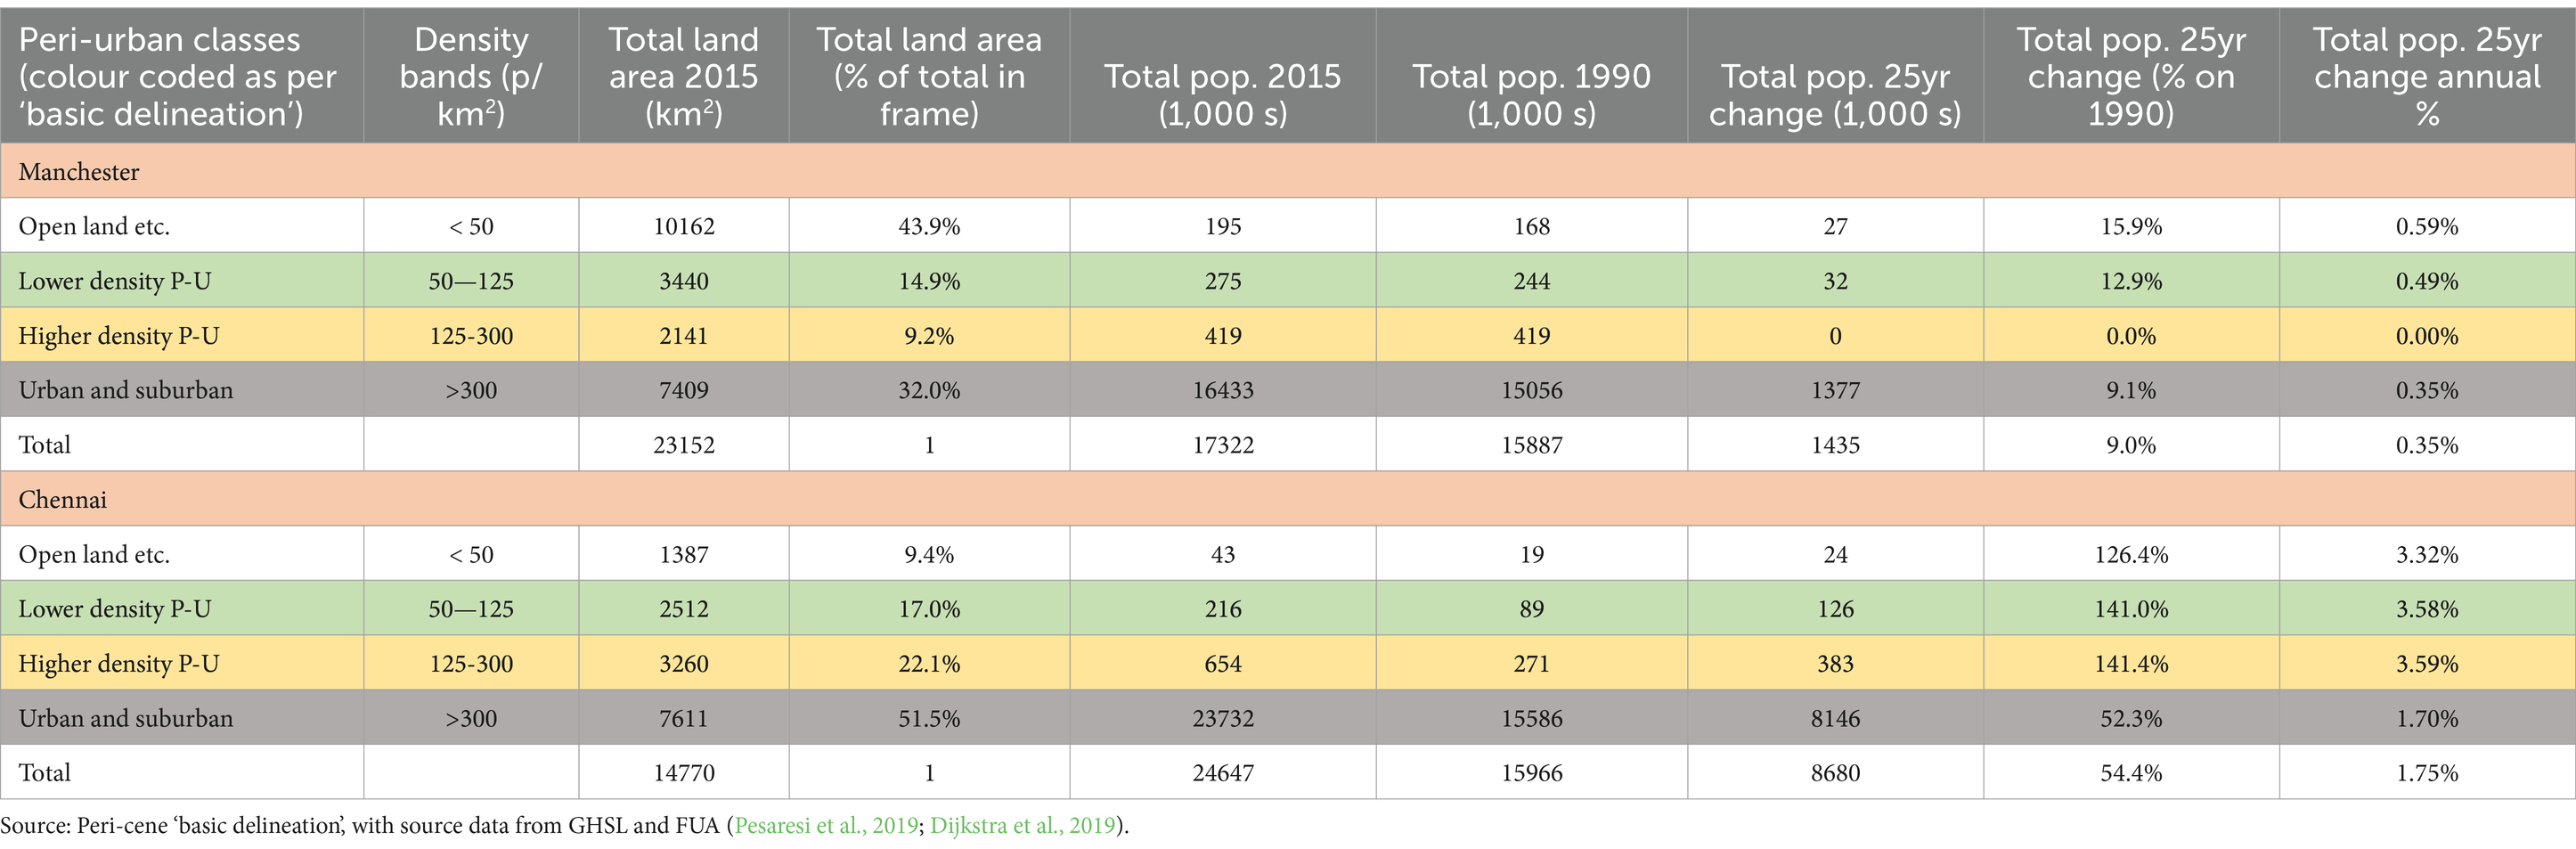
Table 3. Key indicators for peri-urban change: Manchester/Chennai comparison.
Firstly some limitations should be noted: some are acknowledged in the work-arounds and special arrangements in the GHSL method and its applications (Pesaresi et al., 2019):
• The GHSL is calculated on the census data on resident population, and so would miss other categories: industrial or infrastructure areas, ‘non-place’ categories as above, or areas where the census is unreliable for various reasons.
• The grid-cell unit of 1 km2 provides a useful global standard, but may conceal important differences, e.g., scattered rural villages and suburban sprawl may be classed in the same band.
• The FUA is calculated as >15% of local population commuting to defined ‘cities/urban centres’, as in the table below. Such a boundary is somewhat arbitrary and possibly volatile: as highlighted by the COVID-19 episode, there are new patterns of distributed working, from local to global networks, and such dynamics may change rapidly.
While this development was in progress the full ‘DEGURBA’ definition was launched (European Union/FAO/UN-Habitat/OECD/World Bank et al., 2020). In Table 4 (a format developed by Peri-cene), the basic delineation contribution is shown at lower right. This is topical, as the stakeholder consensus on the ‘peri-urban’, corresponds to what is termed ‘low-density rural’ (>50 pp/km2) by the DEGURBA classification. As above there is no final objectivity in such band definitions, for the wide range of geographies around the world, but seems to deserve further investigation.
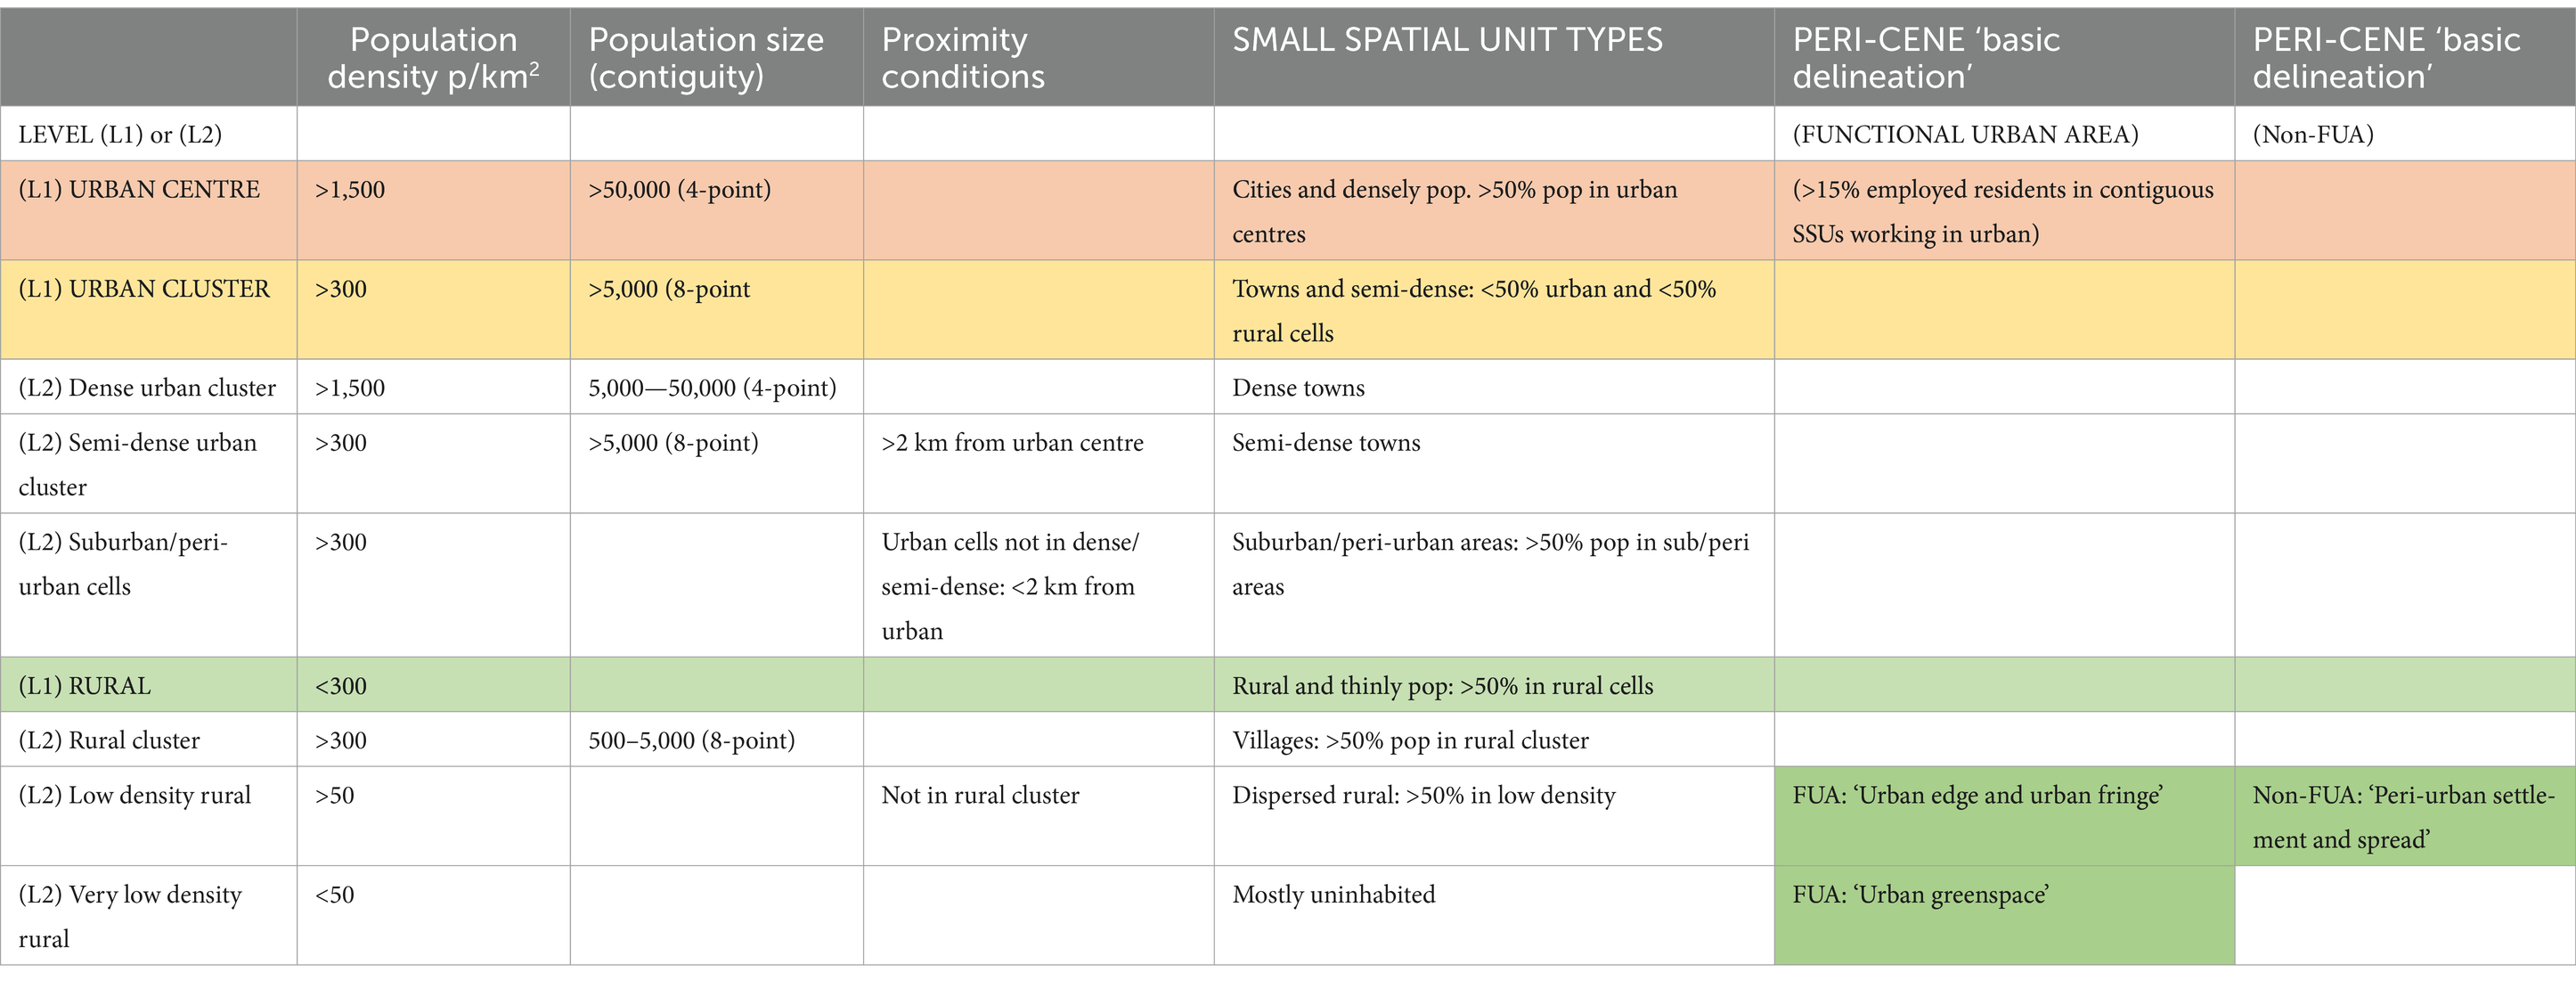
Table 4. Peri-cene ‘basic delineation’ within DEGURBA framework (Adapted from European Union/FAO/UN-Habitat/OECD/World Bank et al., 2020; Dijkstra et al., 2021).
The comparative example in Figure 4 shows Manchester and Chennai, the two in-depth case studies from the Peri-cene. The figure also shows for reference, the basic delineation bands applied to Manchester, along with the change factors (1990–2015) applied to Chennai. As above this delineation is a small cross-section of a complex and many layered city-region.
The Manchester city-region is a typical northern post-industrial agglomeration, with many satellite towns, extended suburbs, car-dependent sprawl, a fast-growing aerotropolis zone, along with urban greenspaces and river-valleys, urban fringes, post-industrial hinterland, tourist hotspots, ancient woodlands, upland peat bogs and so on. With the many layers of control in the UK planning system, slow change in peri-urban population of around 0.5% APR (‘annual percentage rate’), may conceal more rapid change in socio-economic conditions, less visible on the map. These include an economic post-industrial transition, new ‘socio-ecological’ lifestyles, farming/landscape transitions, integrated ecosystems management, and new patterns of adaptive governance (Ravetz and Warhurst, 2013).
Consultation with planning officers from three local authorities, identified firstly the ‘peri-urban spread’ (50–125 p/km2): smaller satellites and further/lower density sprawl or ex-urban settlements, outside the FUA. A second priority was the inner ‘urban edge’ (125–300 p/km2 within FUA, of suburban and/orextended settlements: and the ‘urban fringe’ (50–125 p/km2, within FUA, of scattered, extended or diffused suburbs. Overall there was some consensus that a simple basic delineation would be helpful for spatial analysis and policy development.
Chennai by comparison, is a rapidly developing Asian coastal megacity. The data shows over 3.5% APR peri-urban population growth, a doubling time of just 20 years, with chaotic peri-urban sprawl on a sensitive water-based landscape. There are many peri-urban syndromes showing on the map: rapid urban and industrial sprawl into low-lying landscape of complex water systems and further hinterland: a general disruption of ecosystems with development in high-risk locations, bypassing of local rural economies and livelihoods (Rajan, 2017).
This intersects with climate change syndromes of riverine flash flooding, coupled with major cyclones, sea level rise and saline incursion. There is general water stress, disruption to soil/ecosystems, displacement of floodwater to urban areas: urban heat island and air pollution effects combine with extreme wet heat days. Societal vulnerabilities include large scale transformation of rural economies and livelihoods: rapid social change and gentrification, with disruption to rural farming and landscape systems. In the background are the governance syndromes of political fragmentation, widespread elite capture, illegal construction and land encroachment.
There are various developments in strategic governance, partnership governance, and integrated socio-ecological policy at different levels, from the local to the bio-region and state level (Woiwode et al., 2024). Only a small fraction of this long story is visible on the basic delineation here, but this supports further analysis of tangibles such as flood risk: relational linkages such as watersheds or commuter-sheds: and the beginning of systemic effects both negative and positive, via the integrated framework and pathways approach (Ravetz et al., 2022b).
Applying the basic delineation, some summary ‘headline’ results are derived from the sample of 21 cities, covering a total of 10% of the global urban population (Table 5). This starts with the questions, how big is the global peri-urban, in land and population, and how fast is it changing?
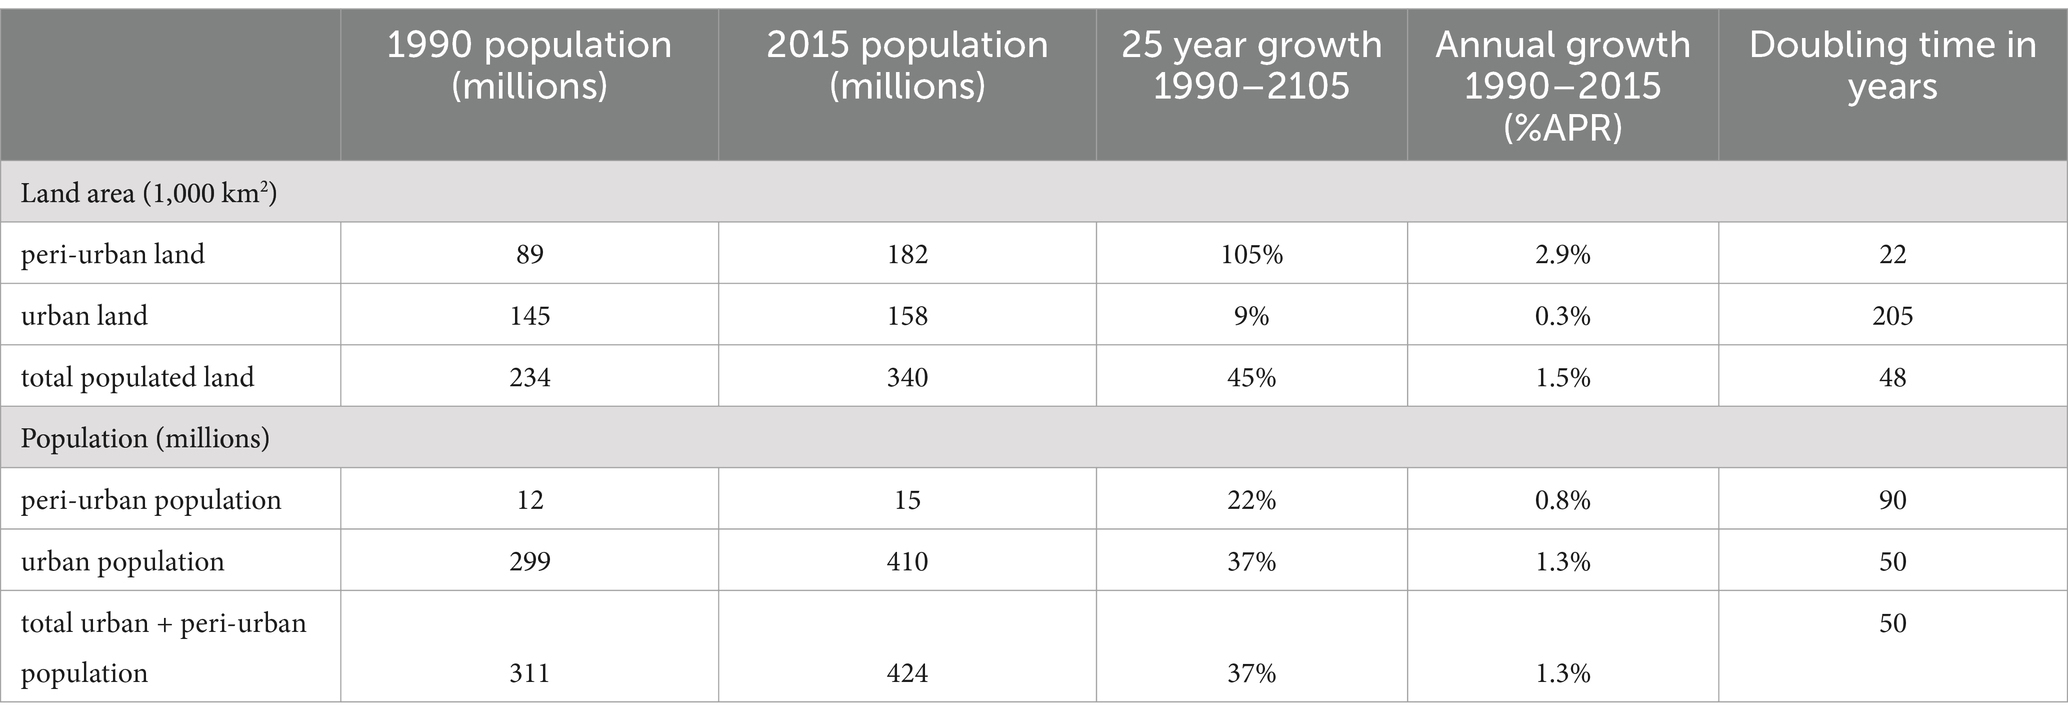
Table 5. Summary global indicators for peri-urban land and population change (drawn from the 10% of global urban population in the Peri-cene sample).
At the centre of the Peri-cene project was the international ‘Policy Laboratory’, a community of practice for mapping of problems and design of responses as ‘adaptive pathways’. The total of 21 partners included, from east to west: Melbourne, Tokyo, Guangzhou, Changsha, Surabaya, Bangkok, Dhaka, Chennai, Cairo, Doha, Kumasi, Helsinki, Johannesburg, Manchester, Naples, Granada, Belo Horizonte, Santiago, Mexicali, San Diego, Toronto: (italics shows ‘sleeping partners’ with data analysis only). The total population represented is around 420 million (as of 2015), nearly 10% of the global urban total: full maps and charts for the partner city-regions are available in the Peri-cene Library of Cases (Ravetz et al., 2022b). Together these partners represent most major urban types and climate risk types, from global south and north.
In this sample of 21, each was mapped on a standard 200 km square frame, to allow for a maximum 100 km radius from the CBD or centroid. This frame size was drawn to include the peri-urban hinterland of larger city-regions, and the wider peri-rural hinterland of smaller or poly-centric city-regions. As above, peri-urban land categories were based on the GHSL data at 1 km2 resolution, with FUA vector overlays: the time period was 25 years with available data for 1990–2015. The ‘headline results’ include:
• The total sample contains a 2015 population of 424 million (over 10% of the global urban total). The size (including the extended agglomerations and polycentric hinterland) ranges from Dhaka and Cairo (69 and 60 million), to Mexicali and Helsinki (1.7 and 2.6 million).
• The growth 1990–2015 of the total population (in the sample) is 37% or 1.26% APR.
• The growth 1990–2015 of the peri-urban population (in the sample) is 22% or 0.79% APR.
• The growth 1990–2015 of the peri-urban land area (in the sample) is 105% or 2.9% APR
• this indicates a peri-urban land area doubling time of 22 years.
This rapid doubling time is especially topical where it coincides with parallel trends, which could be defined as ‘mega-threats’, such as climate tipping points, digital-dependency, bio-diversity loss, air and water pollution, water and food crisis, community displacement, inequality and exclusion, financial crash, political repression and/or conflict (Roubini, 2022).
Meanwhile, in the same period, the population change in peri-urban classes is a more moderate 22% (total urban area populations by 37%). This shows broadly, the effect of a smaller peri-urban population spreading out further, while the majority are still expanding and infilling urban areas at higher densities, where the cells are in urban classifications.
These results may then be placed within a basic global typology, following the STEEP layers of the integrated framework above. The first level is a simple combination of three parameters: (a) peri-urban growth, (b) economic type in terms of national income, and (c) societal type with an outline measure of inequality (Table 6). This then highlights the global range, e.g., from Manchester, (‘complex agglomeration with changing social and economic structures’), to Chennai, (‘rapid spread of higher income enclaves, industrial zones and informal settlements’).
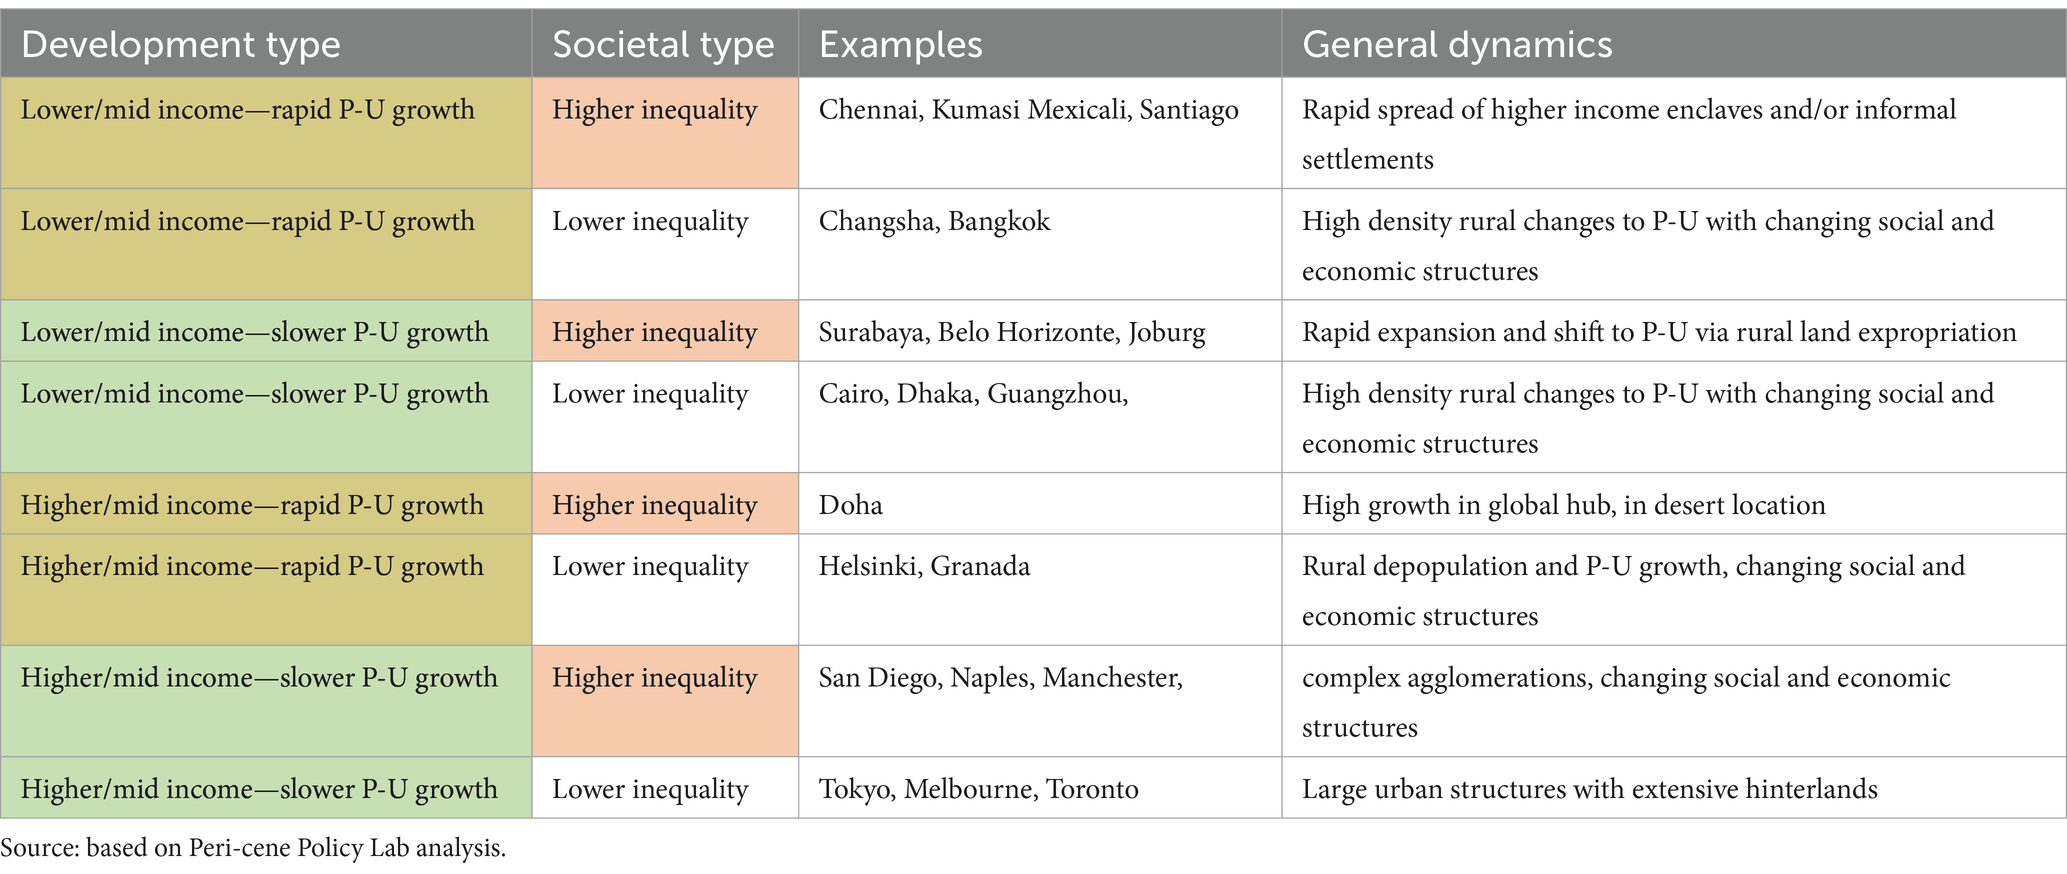
Table 6. Summary global typology of the peri-urban.
Following the basic profiling, these key indicators for each city-region can provide further cross sections. With a sample size of just 21, these charts are not for statistical significance, rather for comparison and case study context. They provide insights on the peri-urban typology, with simple ratios for land and population, combined with socio-economic measures of income and inequality:
• Peri-urban to urban land ratio: (i.e., ‘peri-urban footprint’): this compares (as of 2015) the total peri-urban land area (defined on the GHSL system as 50–300 pp/km2), to urban land (over 300 pp/km2). A higher figure shows a more diffused lower density urban form. The range is from Helsinki and Naples (146 and 120%) to Dhaka and Cairo (15 and 35%).
• Peri-urban population change: (i.e., ‘peri-urban dynamic’): average growth (1990–2015) of the total population living on peri-urban land (50–300 pp/km2). A higher figure shows a more rapid spread, either outward from the urban area, or infilling/peri-urbanization of rural areas.
• Average income (shown as national GDP in USD $1,000 per person, from World Bank data): this is a key reference point, notwithstanding the widespread critique of both the data and of GDP as an indicator. Our sample shows a huge range from India ($2.1 k/pp), to USA ($63.5 k/pp).
• Average inequality (shown as a national-level Gini index from World Bank data 2011–2020): this is taken as a rough proxy for a wide range of social and institutional factors, which then indicate the level of social vulnerability to climate change. The chart shows the range from the most equal in Helsinki (27.4), to the greatest inequality, as seen in Johannesburg (63.1).
An additional table (not shown here) would chart the context of national population growth, 1990–2015, generally dominated by the main urban population. Such urban growth may be indigenous or a result of in-migration. Here the extreme cases are Doha and Johannesburg (283 and 99%), and the case of negative growth in Naples (−3.6%), and very slow growth in Guangzhou (3.8% or 0.16%APR), which could be explained by out-migration to the surrounding hinterland. The Manchester wider region also shows slower population growth at 9% in the same 25 year period.
The scatter plots here in Figure 5, demonstrate the combinations and bring insights on the typologies. The limitations should be noted of the GHSL data on a relatively coarse 1 km grid: e.g. the same density of 125p/km2 could indicate small dense villages, or free-standing suburban dwellings. Figure 5 shows four charts:
1. Peri-urban to urban land ratio: Peri-urban population growth: this combines the ‘peri-urban footprint’ with the ‘peri-urban dynamic’. A high/low combination shows a relatively static but diffused pattern: (e.g., Helsinki, with a smaller core and larger hinterland). A low/high combination shows rapid change on a modest starting point (e.g., Chennai, with a large urban core rapidly filling up its surroundings). There is a cluster of medium-high growth with medium footprints (Bangkok, Santiago, Doha) and a lower growth/smaller footprint corner. The outlier here is Dhaka with −26% shrinkage, indicating a rapid densification/urbanization of previously higher-density rural areas, (which show up as peri-urban in this global classification).
2. Peri-urban population growth/inequality index: this charts the ‘peri-urban dynamic’ against the index of inequality, acting as a proxy for social vulnerability and institutional dysfunction of many kinds. There are clear outliers, with the extreme inequality of Johannesburg, runaway peri-urbanization of Chennai, and apparently negative growth in Dhaka. A cluster of very different cities shows up in the corner of lower inequality/lower growth, and another cluster in the middle of the ranges.
3. Peri-urban to urban land ratio/average income: a basic measure of the type and quality of the peri-urban footprint is the level of affluence, which indicates housing conditions, infrastructure and social vulnerability in general. The west coast model of San Diego shows a relatively contained peri-urban footprint, while others such as Toronto, Naples and Granada are more spread out, each with a highly populated hinterland. At the other end of the scale, Asian cities such as Surabaya or Guangzhou are already at relatively higher density in much of the hinterland (with such areas then classed as urban).
4. Peri-urban population growth/average income: The dynamic side of the picture then shows the growth against the same income data. Here the outliers range from Chennai (high growth/lower income), to Cairo and Dhaka (low growth/lower income). At the top of the scale is San Diego, with a second tier of Doha, Helsinki, Toronto and Melbourne, each with relatively medium levels of peri-urban population growth.
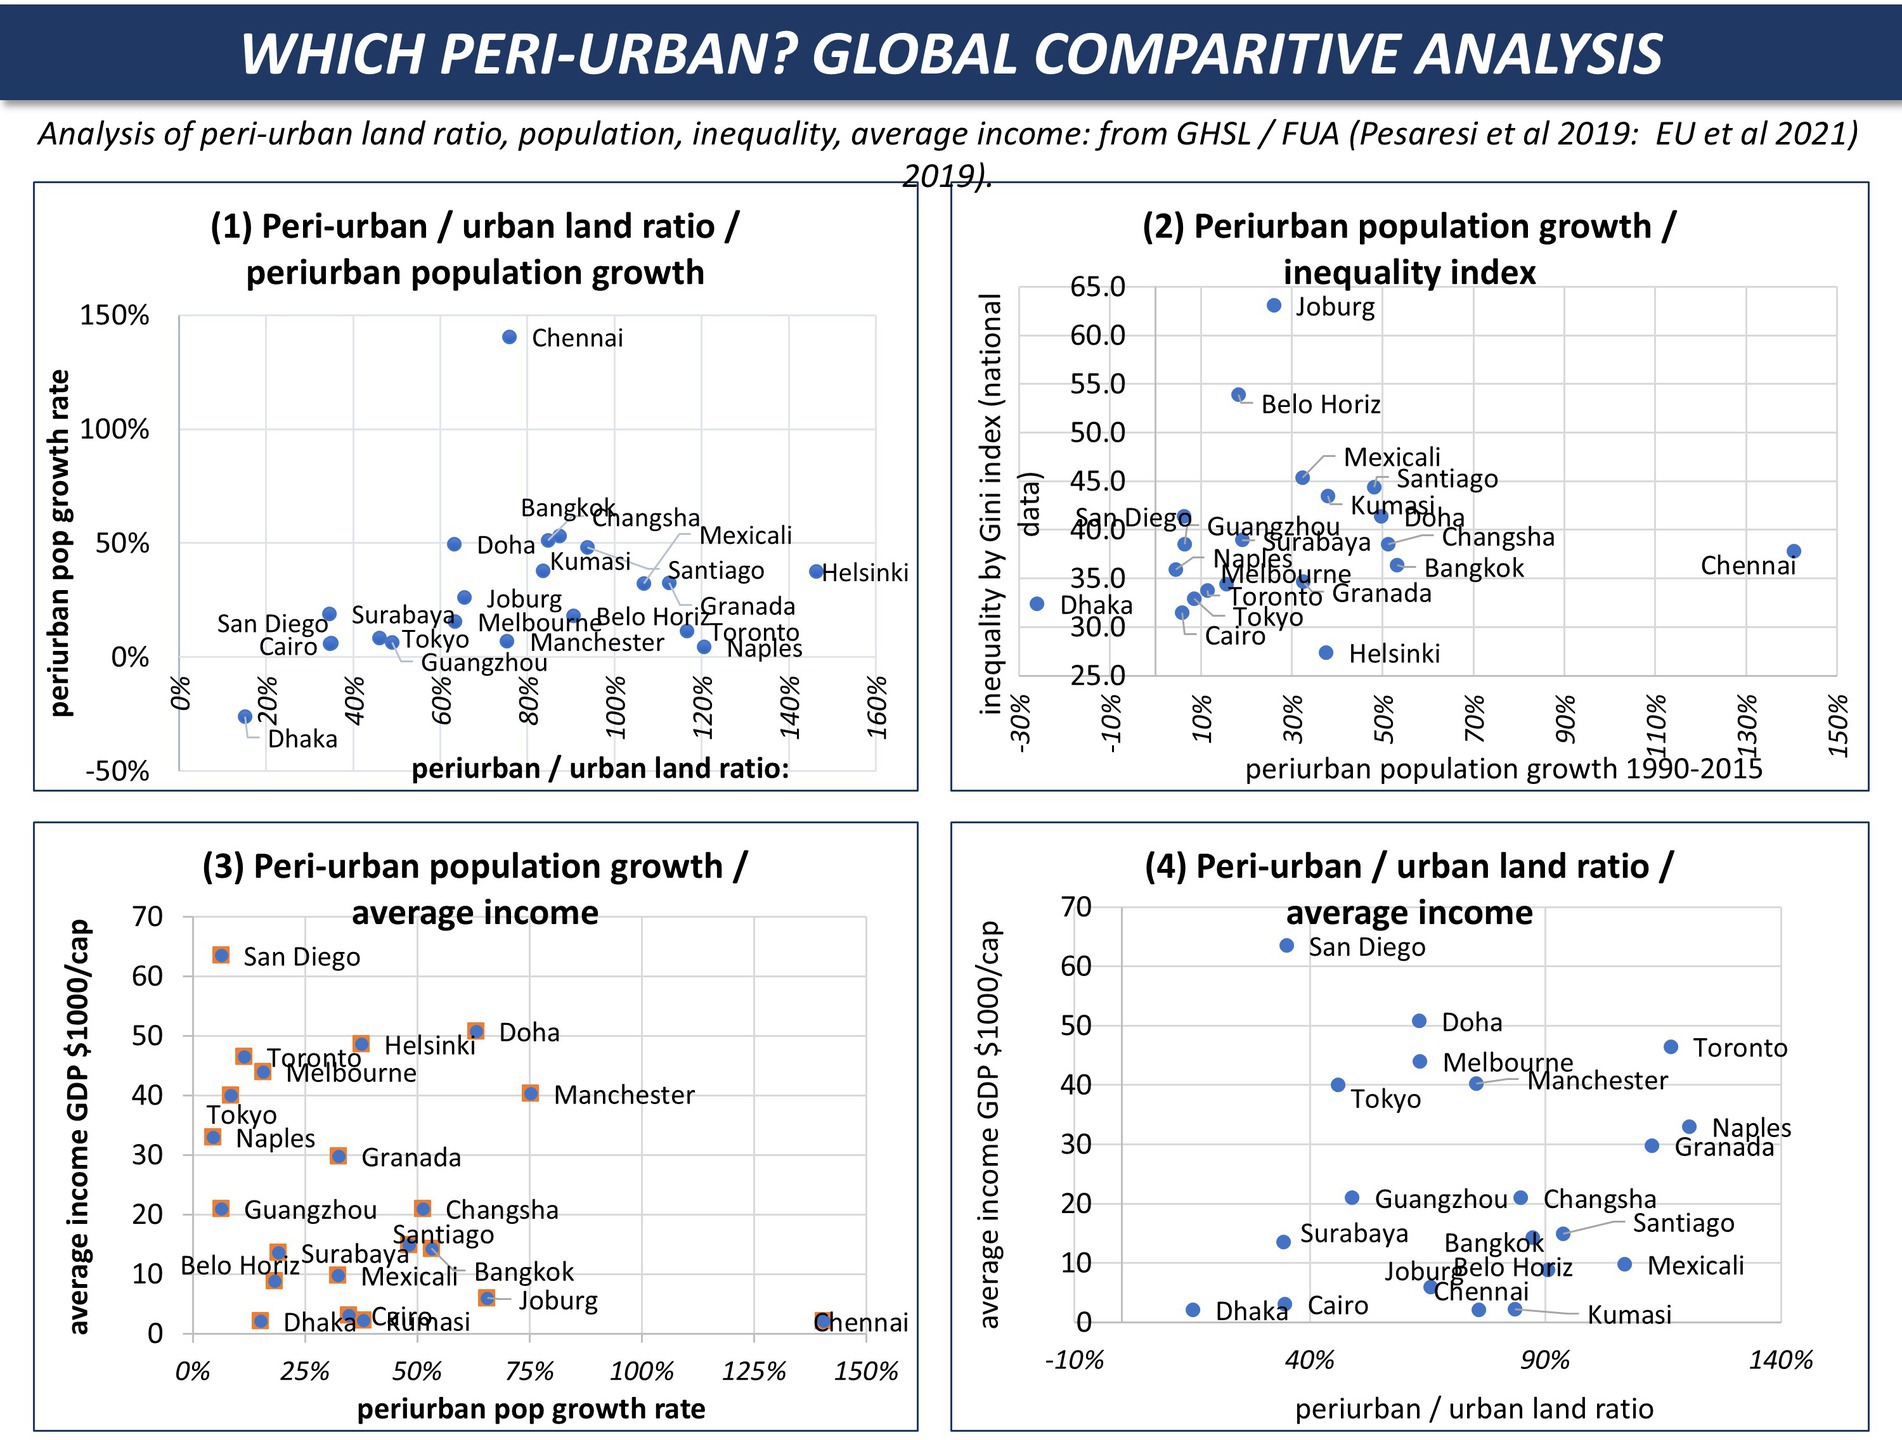
Figure 5. Peri-urban global comparative analysis.
Such comparative analysis can then be used in more detailed investigation of land-use patterns, climate hazards and vulnerabilities, infrastructure development, housing markets or governance structures: as highlighted in the Peri-cene reports (Ravetz et al., 2022a). As with any global comparison or indicators scheme, simple numbers can be enablers of policy research and development.
The above basic delineation also provides insights and comparative analysis on the internal structure of each case city-region. The result is a unique library of cross-sections, with many variations in peaks, gradients and growth rates. Datasets on peri-urban land area and population density classes were calculated for 21 city-regions, with changes 1990–2015, and charted as comparative cross-sections, for eastern and western locations (Figures 6, 7). In each chart, the vertical axis shows land area in km2: the horizontal axis shows population density classes, from 7,500 to 10 pp/km2. Red lines show population within the FUA, green for non-FUA: solid lines show recent (2015) data: and dotted lines show 1990.
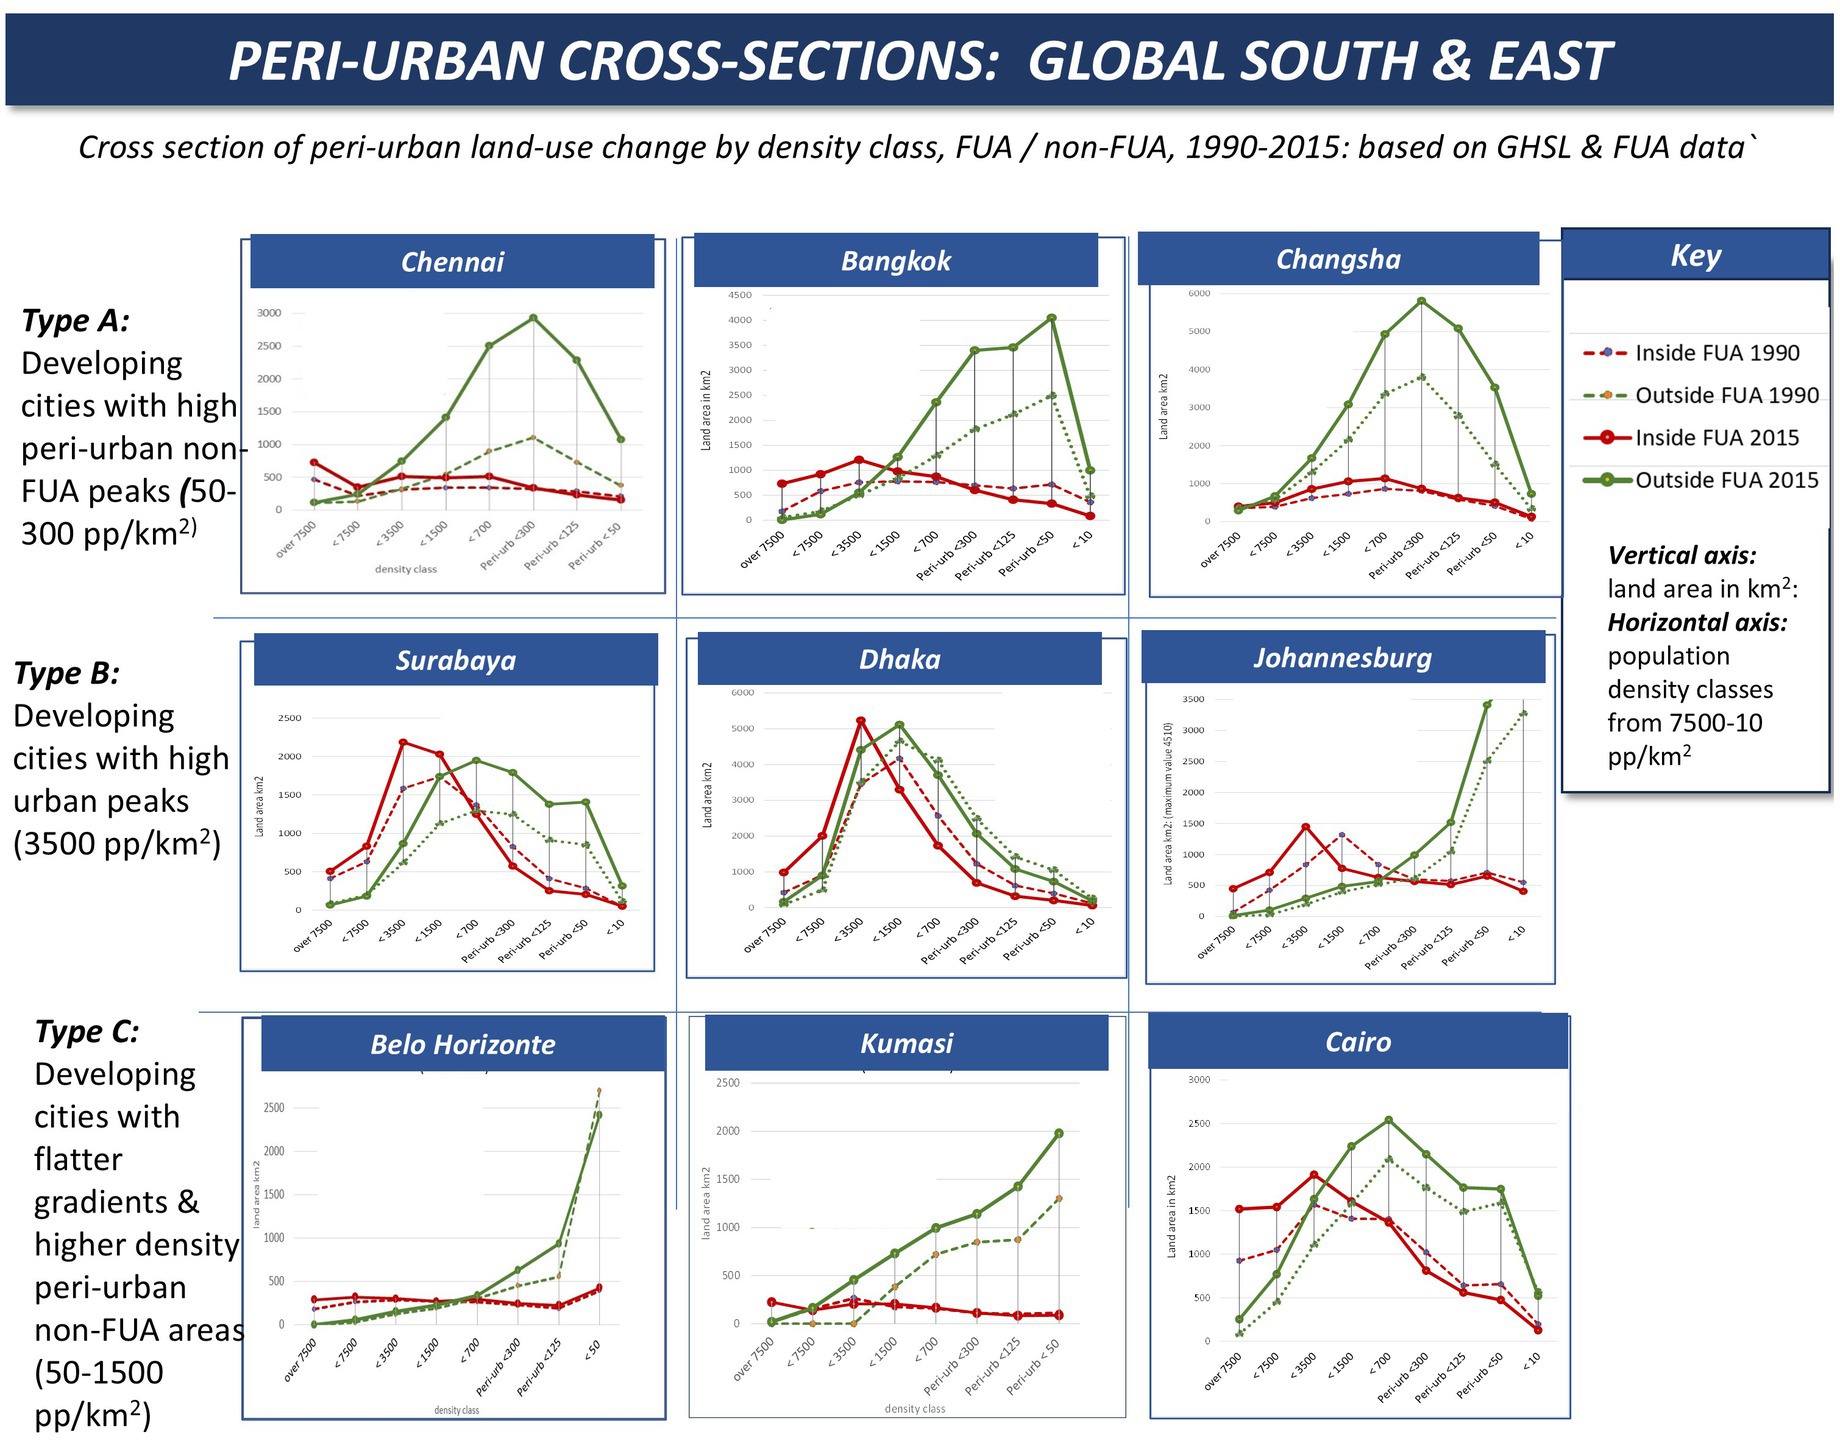
Figure 6. Peri-urban cross sections: global south/east.
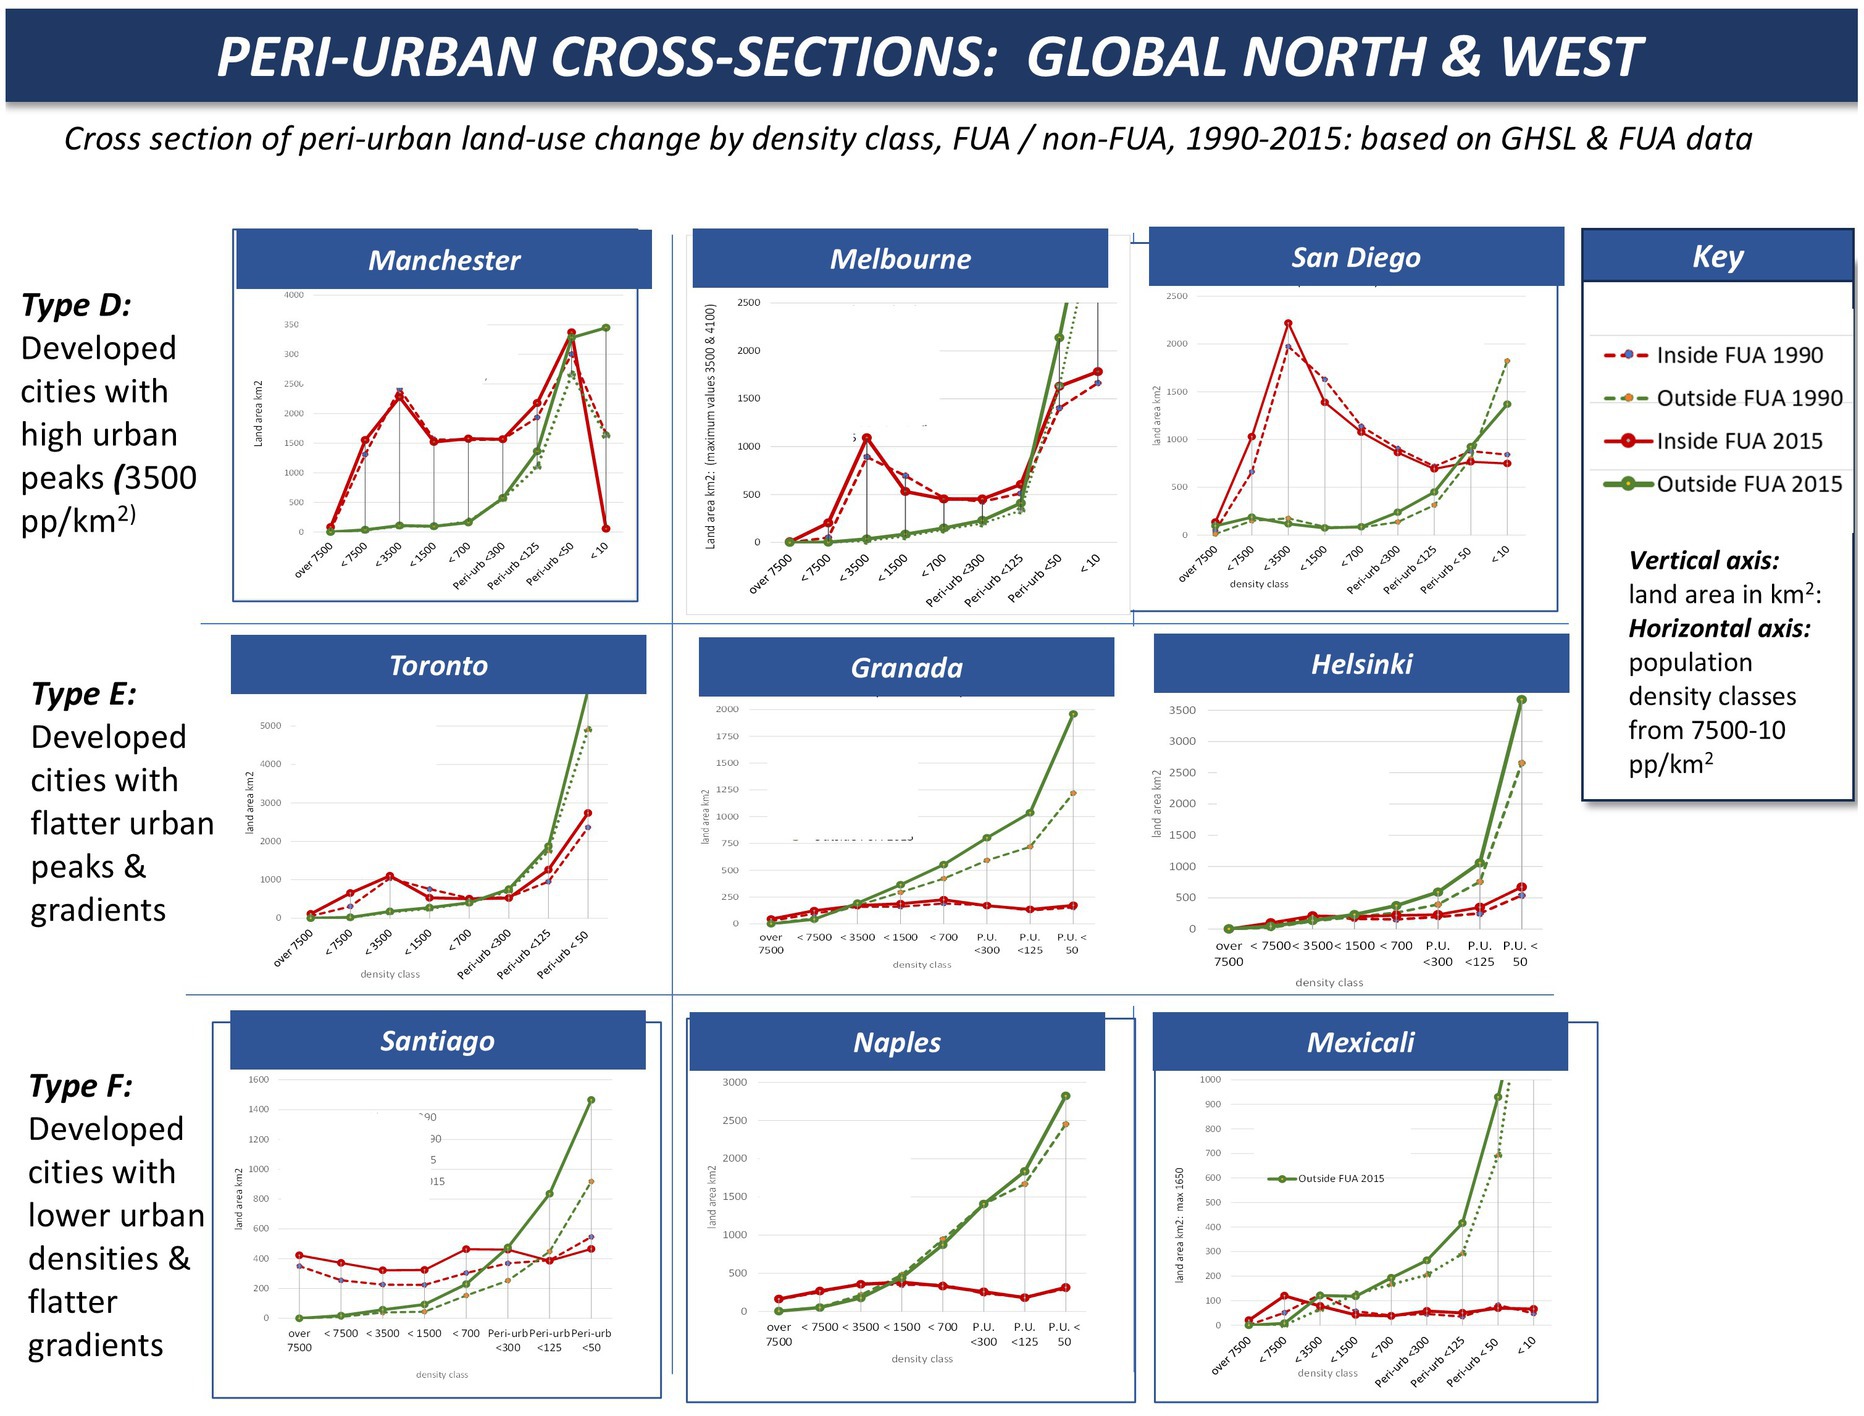
Figure 7. Peri-urban cross sections: global north/west.
As above, the data is calculated on a standard geographical frame of 200 × 200 km: a few megacities (Dhaka, Tokyo) spread beyond these limits. Most cities sit easily within this frame, some with large land areas at rural/remote densities of 0–50 p/km2. Some cities such as Manchester are in highly polycentric urbanized agglomerations, and so the amount of low-density land is relatively small within the frame. (Note, these charts include the non-FUA low density land curve where relevant, at 0–10 and 10–50 pp/km2, which is not included in the peri-urban basic delineation). Also, as above the FUA definition (visible here as the difference between red and green curves) is in some ways an arbitrary distinction, especially in the more extreme cases (low income mega-cities, high income sprawl regions etc.). By implication, such diagrams do not aim at definitive analysis, more a ‘best available’ cross-section of a complex picture.
The result is a unique library of cross-sections of the urban/peri-urban structure of each city-region, with peaks, gradients and spreads. Three main types are visible in the eastern (mainly developing) city-regions:
• Type A: Developing cities with high peri-urban peaks in non-FUA areas (50–300 pp/km2): Chennai, Bangkok, Changsha each show very high peri-urban growth rates of 50–100% in the peri-urban density classes of 50–300 pp/km2, and overall higher peri-urban densities. Chennai is the outlier with non-FUA peri-urban more than doubling with a peak at 300 pp/km2.
• Type B: Developing cities with high urban density peaks (3,500 pp/km2): Surabaya, Dhaka, Johannesburg: showing extreme concentrations of population from 1,500 to over 7,500 pp/km2. Each of these also shows a de-concentration of the most dense areas, with outward movement and rapid growth of non-FUA areas, at both urban and peri-urban densities.
• Type C: Developing cities with flatter gradients and higher density peri-urban land in non-FUA areas (50–1,500 pp/km2): Belo Horizonte shows a very widespread rural population at peri-urban densities. Kumasi shows an extreme case of rapid peri-urban non-FUA growth at all density classes. Cairo shows a combination of ultra-high urban densities tapering off, with a non-FUA peak at 700 pp/km2, also tapering off.
Three main types are also visible in western (mainly developed) city-regions, with somewhat more moderate socio-economic change and governance conditions.
• Type D: Developed cities with urban peaks: Manchester, San Diego, Melbourne each show a similar concentration of FUA development in the bands >1,500 and > 3,500 pp/km2. At the lower density bands, apparent differences may be due to the somewhat volatile FUA definitions.
• Type E: Developed cities with flatter FUA gradients: Toronto, Granada, Helsinki show a more even distribution change through the density bands. Toronto has a small urban peak at 3,500, along with an extended spread of in-FUA peri-urban land. Granada and Helsinki each show rapid peri-urban non-FUA development.
• Type F: Developed peri-urban areas which spread out rapidly at lower densities. Santiago shows a combination of high growth urban spread and peri-urban growth. Naples and Mexicali each show extended peri-urban densities, with relatively stable growth, reflecting an inbuilt hinterland structure.
Such cross-sections highlight overall policy implications, which also emerged through the Peri-cene consultation. It appears that peri-urban land areas are generally larger than urban, while the policy focus is mainly on the urban: also that peri-urban growth rates are much higher, especially in the global south. For ‘developed’/global north cities, the comparison of three main types suggests that systemic planning challenges such as in Manchester, might gain insight from comparison of the very different profiles of Toronto or Santiago. Overall this suggests a shift of focus for land-use planning towards the peri-urban, with new modes of responsive planning and ‘sprawl repair’ (Tachieva, 2010).
This paper has presented a novel combination for the peri-urban ‘beyond and between’ around the world, on two tracks: (a) the systems-level integrated framework, and (b) a basic delineation for spatial analysis. This enables some topical responses to the questions raised. The review on ‘what is the peri-urban’ highlighted the multiple layers and perspectives: and ‘how to explore the peri-urban’, provided an integrated framework as a guide to system-level investigation. Focusing in, the question ‘where is the peri-urban’, developed the basic delineation from the GHSL-FUA classifications: this provides some very topical results, such as the aggregate 3% annual growth rate in global average peri-urban land area. For the question ‘which are the peri-urban types’ (in our 10% global sample), we set out a typology based on land, population, economic and social parameters. Finally, for ‘how do the peri-urban dynamics work’ a further typology is suggested for the internal structure of each city-region. Each of these methodological development was tested by stakeholder consultation as far as possible.
For the policy applications of these results, we refer back to Figure 1. The three framings of the integrated framework correspond to the three levels of the pathways approach, both for problem analysis and policy development. The simple grid-cell mapping of the basic delineation contributes to the central tangible layer, which includes the STEEP categories. The typologies derived from the basic delineation help to inform policy both local and global. One example from Manchester illustrates the scheme (Ravetz and Warhurst, 2013; Ravetz et al., 2022b). The upland areas to the north contain populated peri-urban classes, and unpopulated peat bog areas, which show up on the basic delineation: and further layers of tangible data or linkages can be added, such as water, transport or housing. This then can support more system-level research and policy development: in this case, with an uncertain future for marginal farming, combined with social exclusion, gentrification, landscape degradation and increasing flood risk, there is an urgent agenda for adaptive pathways and collaborative governance.
Clearly this combination of methods has limitations. The integrated framework is only a starting point for highly complex phenomena as above, which typically cross between social/economic/political domains, between scale levels, and between tangible/systemic effects. Likewise, the basic delineation is only one contribution into such investigations, where the tangible grid-cell data is one part of a much bigger picture. The data unit at 1 km2 may conceal important effects, and the 10% global sample needs extending, as does the range of case studies, from villages to megacities. Furthermore, our statistical analysis, empirical results and graphical representations show that peri-urban growth may not correlate directly with urban growth or population growth: some smaller metropolitan regions may have a wider peri-urban shadow compared to larger metropolitan city-regions, where the peri-urban is already more populated and merging into urban. Clearly the urban-regional structure, geographical situation, climate and environmental, economic and political systems, social structure and urban policies, each intersect in the diversity of peri-urban patterns and dynamics around the world.
While the stakeholder consultation so far could only touch the surface of such complex issues, this paper is (to our knowledge) the first to begin the linkage of technical data and a systemic framework, with stakeholder perspectives, at the global peri-urban level.
In that light, some pointers towards further research can be raised. First, there is ongoing consultation to compare the basic delineation results, with other social, economic or environmental layers, and then with grounded experience of stakeholders and policy-makers. This applies to the mainstream peri-urban, and also to the more extreme cases and further outliers, the ‘anti-city-region’ settlements such as refugee camps, mining towns, tourist villages, religious communities, temporary festivals, or other spaces of ‘non-place’, peripherality, exclusion, displacement, expropriation and/or resistance (Augé, 1999). This highlights to the urgent agenda of urban climate risk and resilience, and the role of the peri-urban in (a) magnifying the hazard and vulnerability, or (b) enhancing the adaptive capacity of both peri-urban and urban areas. In that light we hope this paper may contribute to a wider and deeper understanding of the ‘global peri-urban anthro-pocene’.
The raw data supporting the conclusions of this article will be made available by the authors, without undue reservation.
JR: Writing – original draft, Writing – review & editing Visualization, Project administration. MS: Writing – review & editing.
The author(s) declare that financial support was received for the research, authorship, and/or publication of this article. The Peri-cene project was funded in the UK by Natural Environment Research Council (NERC) & Economic and Social Research Council (ESRC), under the Towards a Sustainable Earth programme Ref NE/S013172/1. International funders included Formas, Sweden (grant 2019-00037), and the Department of Biotechnology, India (Project No. BT/IN/TaSE/72/SR/2018–1).
We acknowledge the valuable contributions of partners in the project Peri-cene (https://peri-cene.net), in particular for the Work Package 2 led by Nuno Pinto, University of Manchester, with A. Ramachandran, Indian Institute of Technology Madras. Peri-cene research partners included the University of Manchester (UK), KTH Royal Institute of Technology (Sweden), and the Indian Institute of Technology Madras (India). We also thank the Peri-cene Policy Lab partners from: Melbourne, Changsha, Surabaya, Bangkok, Dhaka, Chennai, Cairo, Doha, Johannesburg, Kumasi, Helsinki, Manchester, Naples, Granada, Santiago, Toronto, Mexicali, San Diego. (For a full list of partners see Ravetz et al., 2022a). All diagrams and tables are supplied by the authors, based on the interim versions available in Ravetz et al. (2022a, 2022b).
The authors declare that the research was conducted in the absence of any commercial or financial relationships that could be construed as a potential conflict of interest.
The author(s) declared that they were an editorial board member of Frontiers, at the time of submission. This had no impact on the peer review process and the final decision.
All claims expressed in this article are solely those of the authors and do not necessarily represent those of their affiliated organizations, or those of the publisher, the editors and the reviewers. Any product that may be evaluated in this article, or claim that may be made by its manufacturer, is not guaranteed or endorsed by the publisher.
Abramson, D. B. (2016). Periurbanization and the politics of development-as-city-building in China. Cities 53, 156–162. doi: 10.1016/j.cities.2015.11.002
Adell, G. (1999). Theories and models of the peri-urban interface. A changing conceptual land-scape. London: Development Planning Unit, University College.
Angel, S., Sheppard, S. C., and Civco, D. L. (2005). The dynamics of global urban expansion. Washington DC: World Bank, Transport, Urban Development Dept.
Balk, D., Leyk, S., Jones, B., Montgomery, M. R., and Clark, A. (2018). Understanding urbanization: a study of census and satellite-derived urban classes in the United States, 1990-2010. PLoS One 13:e0208487. doi: 10.1371/journal.pone.0208487
Bengs, C., and Schmidt-Thomé, K., (2006). ESPON 1.1.2. Urban-rural relations in Europe. Final Report. ESPON, Luxembourg.
Bertrand, N. (2007) in Introduction. ESDP ideals and the inheritance of rural planning failures in Europe's City-regions competitiveness. Growth regulation and peri-urban land management. eds. N. Bertrand and V. Kreibich (Van Gorcum: Assen).
Brenner, N. (2013). “Introduction: urban theory without an outside” in Implosions/explosions: Towards a study of planetary urbanization. ed. N. Brenner (Berlin: Jovis Verlag), 14–35.
Briquel, V., and Collicard, J.-J. (2005). “Diversity in the rural hinterlands of European cities” in The City's hinterland - dynamism and divergence in Europe's Peri-urban territories. ed. K. Hoggart (Aldershot: Ashgate), 19–40.
Bryant, C. R., Russwurm, L. H., and McLellan, A. G. (1982). The city's countryside. New York: Land and its management in the rural-urban fringe. Longman Inc.
Carter, J. G., Handley, J., Butlin, T., and Gill, S. (2018). Adapting cities to climate change – exploring the flood risk management role of green infrastructure landscapes. J. Environ. Plan. Manag. 61, 1535–1552. doi: 10.1080/09640568.2017.1355777
Champion, A. G., Fielding, A. J., and Keeble, D. (1989). Counterurbanization in Europe. Geogr J. 155, 52–80.
Clay, G. (1994). Real places: An unconventional guide to America's generic landscape. Chicago: University of Chicago Press.
Couch, C., Karecha, J., Nuissl, H., and Rink, D. (2007). Decline and sprawl: an evolving type of urban development – observed in Liverpool and Leipzig. Eur. Plan. Stud. 13, 117–136. doi: 10.1080/0965431042000312433
Cusin, F., Lefebvre, H., and Sigaud, T. (2016). The Peri-urban question: a study of growth and diversity in peripheral areas in France. Revue française de sociologie (English Edition) 57, 437–471.
Danielaini, T. T., Maheshwari, B., and Hagare, D. (2018). Defining rural–urban interfaces for understanding ecohydrological processes in West Java, Indonesia: part I. Development of methodology to delineate peri-urban areas. Ecohydrol. Hydrobiol. 18, 22–36. doi: 10.1016/j.ecohyd.2017.11.006
Daniels, T. (1998). When City and country collide. Managing growth in the metropolitan fringe. NY: Island Press.
Dijkstra, L., Florczyk, A., Freire, S. M. C., Kemper, T., Melchiorri, M., Pesaresi, M., et al. (2021). Applying the degree of urbanisation to the globe: a new harmonised definition reveals a different picture of global urbanisation. J. Urban Econ. 125:103312. doi: 10.1016/j.jue.2020.103312
Dijkstra, L., Poelmani, H., and Veneri, P. (2019). The EU-OECD definition of a functional urban area. Paris: OECD.
Douglas, I., and Ravetz, J. (2011). “Urban ecology: Patterns, processes, and applications” in Urban Ecology: Patterns, Processes, and Applications. eds. J. Niemelä, J. H. Breuste, G. Guntenspergen, N. E. McIntyre, T. Elmqvist, and P. James. (Oxford: Oxford University Press), 246–262.
European Union/FAO/UN-Habitat/OECD/World Bank (2020). Applying the degree of urbanisation: A methodological manual to define cities, towns and rural areas for international comparisons. EU: Luxembourg.
Fanfani, D, and Matarán Ruiz, A, (2018). Introduction to bioregional planning: Relocalizing cities and communities for a post-oil civilization.
Friedmann, J., and Weaver, C. (1979). Territory and function: Evolution of regional planning. London: Edward Arnold.
Gallent, N., Andersson, J., and Bianconi, M. (2006). Planning on the edge. The Context for Planning at the Rural-Urban Fringe. Abingdon: Routledge.
Galster, G., Hanson, R., Ratcliffe, M., Wolman, H., Coleman, S., and Freihage, J. (2001). Wrestling sprawl to the ground. Defining and measuring an elusive concept. Hous. Policy Debate 12, 681–717. doi: 10.1080/10511482.2001.9521426
Gao, J., and O’Neill, B. C. (2020). Mapping global urban land for the 21st century with data-driven simulations and shared socioeconomic pathways. Nat. Commun. 11:2302. doi: 10.1038/s41467-020-15788-7
Garner, B. (2017). “Perfectly positioned”: the blurring of urban, suburban, and rural boundaries in a southern community. Ann. Am. Acad. Pol. Soc. Sci. 672, 46–63. doi: 10.1177/0002716217710490
Ginsburg, N. S., and Koppel, B. (2004). The extended metropolis. Settlement transition in Asia. Honolulu, Hawaii: East-West Environment and Policy Institute.
Gonçalves, J., Gomes, M. C., Ezequiel, S., Moreira, F., and Loupa-Ramos, I. (2017). Differentiating peri-urban areas: a transdisciplinary approach towards a typology. Land Use Policy 63, 331–341. doi: 10.1016/j.landusepol.2017.01.041
Haase, D., Piorr, A., Schwarz, N., Rickebusch, S., Kroll, F., van Delden, H., et al. (2013). “Tools for modelling and assessing peri-urban land use futures” in Peri-urban futures: Scenarios and models for land use change in Europe (Berlin, Heidelberg: Springer), 69–88.
Habitat, U. N. (2022). Envisaging the future of cities: (state of the world’s cities report). UN Habitat: Nairobi.
Hardoy, J., Mitlin, D., and Satterthwaite, D. (2001). Environmental problems in an urbanizing world. London: Earthscan.
Henderson, K. (2005). “Tensions, strains and patterns of concentration in England’s city-regions” in The City’s hinterland: Dynamism and divergence in Europe’s peri-urban territories. ed. K. Hoggart (Aldershot: Ashgate).
Heynen, N. C., Kaika, M., and Swyngedouw, E. (2006). In the nature of cities: Urban political ecology and the politics of urban metabolism. London: Routledge.
Hui, R., and Wescoat, J. L.Jr. (2019). Visualizing peri-urban and rurban water conditions in Pune District, Maharashtra, India. Geoforum 102, 255–266. doi: 10.1016/j.geoforum.2018.01.008
Ives, C. D., and Kendal, D. (2013). Values and attitudes of the urban public towards peri-urban agricultural land. Land Use Policy 34, 80–90. doi: 10.1016/j.landusepol.2013.02.003
Jones, G. W., and Douglass, M. (2008). Mega-urban regions in Pacific Asia. Urban dynamics in a global era. Singapore: NUS Press.
Karg, H., Hologa, R., Schlesinger, J., Drescher, A., Kranjac-Berisavljevic, G., and Glaser, R. (2019). Classifying and mapping Periurban areas of rapidly growing medium-sized sub-Saharan African cities: a multi-method approach applied to tamale, Ghana. Land 8:40. doi: 10.3390/land8030040
Karpouzoglou, T., Marshall, F., and Mehta, L. (2018). Towards a peri-urban political ecology of water quality decline. Land Use Policy 70, 485–493. doi: 10.1016/j.landusepol.2017.11.004
Kasarda, J., and Lindsay, G. (2011). Aerotropolis: The way we'll live next. NY: Farrar, Strauss & Giroux.
Leaf, M. (2011). Periurban Asia: a commentary on “becoming urban”. Pac. Aff. 84, 525–534. doi: 10.5509/2011843525
Leontidou, L, and Couch, C. (2007). “Urban sprawl and hybrid city-scapes in Europe: comparisons, theory construction and conclusions,” in Urban sprawl in Europe: landscapes, land-use change and policy. eds. C Couch, L Leontidou, and G Petschel-Held (Oxford: Blackwell).
Loibl, W., and Toetzer, T. (2003). Modelling growth and densification processes in sub-urban regions – simulation of landscape transition with spatial agents. Environ Modell Softw. 18, 553–563. doi: 10.1016/S1364-8152(03)00030-6
Loveridge, D. (2008). Foresight: The art and science of anticipating the future. London: Taylor & Francis.
Luka, N. (2017). Contested periurban amenity landscapes: changing waterfront ‘countryside ideals’ in Central Canada. Landsc. Res. 42, 256–276. doi: 10.1080/01426397.2016.1267335
McGee, T. G. (2002). Reconstructing “the southeast Asian City” in an era of volatile globalization. Asian J. Soc. Sci. 30, 8–27. doi: 10.1163/15685310260188718
McGregor, D., Simon, D., and Thompson, D. (2005). The Peri-urban Interface: Approaches to sustainable natural and human resource use. Routledge: NY.
Melvin, J, (2018). Rus in urbe, unpacked: on countryside running through the heart of English cities. Architectural Review. Available at: https://www.architectural-review.com/essays/rus-in-urbe-unpacked-on-countryside-running-through-the-heart-of-english-cities (Accessed December, 2024).
Mortoja, M. G., Yigitcanlar, T., and Mayere, S. (2020). What is the most suitable methodological approach to demarcate peri-urban areas? A systematic review of the literature. Land Use Policy 95:104601. doi: 10.1016/j.landusepol.2020.104601
Nelson, A. C., and Sanchez, T. W. (1999). Debunking the exurban myth. A comparison of suburban households. Hous. Policy Debate 10, 689–709. doi: 10.1080/10511482.2020.12097374
Newman, P., and Kenworthy, J. (1999). Sustainability and cities: Overcoming automobile dependence. Washington D.C: Island Press.
Newman, P., Kosonen, L., and Kenworthy, J. (2016). Theory of urban fabrics: planning the walking, transit and Automobile City. Town Plan. Rev. 87, 429–458. doi: 10.3828/tpr.2016.28
Nilsson, K, Nielsen, T.S, Aalbers, C, Bell, S, Boitier, B, Chery, J.P, et al. (2014) Strategies for sustainable urban development and urban-rural linkages, European Journal of Spatial Development. Available at: https://nordregio.org/wp-content/uploads/2014/03/article4.pdf (Accessed October 2023).
OECD/European Commission. (2019). Cities in the world: A new perspective on urbanisation, OECD Urban Studies, OECD Publishing, Paris.
Pesaresi, M., Melchiorri, M., Siragusa, A., and Kemper, T. (2019). “Atlas of the human planet” in Mapping human presence on earth with the global human settlement layer (Luxembourg: EU).
Piorr, A, Ravetz, J, and Tosics, I, (2011). Peri-urbanisation in Europe: Towards a European policy to sustain urban-rural futures: (synthesis report of the PLUREL project): Luxembourg, European Commission communications unit, with university of Copenhagen. Available at: https://trimis.ec.europa.eu/sites/default/files/project/documents/20130619_102649_92107_Peri_Urbanisation_in_Europe_printversion.pdf (Accessed October 2023).
Radeloff, V. C., Hammer, R. B., Stewart, S. I., Fried, J. S., Holcomb, S. S., and McKeefry, J. F. (2005). The wildland-urban Interface in the United States. Ecol. Appl. 15, 799–805. doi: 10.1890/04-1413
Rajan, S. C. (2017). Becoming urban or bypassed in the periurban? An emerging challenge for global ethics. J. Glob. Ethics 15, 6–20. doi: 10.1080/17449626.2019.1594344
Ravetz, J. (2000). City-region 2020: integrated planning for a sustainable environment’: (foreword by the UK secretary of state for the environment). London: Earthscan with the Town & Country Planning Association.
Ravetz, J. (2011), Peri-urban ecology: green infrastructure in the twenty-first century metro-scape: In: Douglas, I. D Goode, Houck, M.C, R Wang (Eds) The Routledge Handbook of Urban Ecology, Abingdon, Routledge.
Ravetz, J. (2020). Deeper City: collective intelligence and the pathways from smart to wise. NY: Routledge.
Ravetz, J. (2024). Beyond and Between: connecting urban and rural for shared prosperity: Compendium of inspiring practices on peri-urban-rural linkages. Nairobi: UN Habitat. Available at: https://unhabitat.org/topic/urban-rural-linkages (accessed December 2024).
Ravetz, J., Fertner, C., and Nielsen, T. S. (2013). “The dynamics of peri-urbanization” in Peri-urban futures: Land use and sustainability. eds. S. Pauleit, S. Bell, and C. Aalbers (Berlin: Springer).
Ravetz, J., and Warhurst, P. (2013). “Towards the new local-global: the emerging peri-urban of the Manchester city-region” in Peri-urban futures: Land use and sustainability. eds. S. Pauleit, S. Bell, and C. Aalbers (Berlin: Springer).
Ravetz, J, Adrianto, D., and Rees, J. L. (2022a). Peri-cene synthesis report I: overview - a first exploration of the ‘peri-eco-urban anthropocene’. Available at: http://peri-cene.net (Accessed December, 2024).
Ravetz, J, Adrianto, D., and Rees, J. L. (2022b). Peri-cene synthesis report II: library of cases – a knowledge platform for peri-urban-climate research & policy. Available at: http://peri-cene.net (Accessed December, 2024).
Reckien, D., and Karecha, J. (2007). “Sprawl in European cities. The comparative background” in Urban sprawl in Europe: landscapes, landuse change and policy. eds. C. Couch, L. Leontidou, and G. Petschel-Held (Oxford: Blackwell).
Robinson, G. M. (1990). Conflict and change in the countryside: rural society, economy and planning in the developed world. London: Belhaven Press.
Roubini, N. (2022). Megathreats: Ten dangerous trends that imperil our future, and how to survive them. NY: Little, Brown.
Sahana, M., and Ravetz, J. (2024). “Where is the peri-urban? A working definition and global typology” in Remote sensing and GIS in Peri-urban research: Perspectives on global change, sustainability and resilience. ed. M. Sahana (Amsterdam: Elsevier).
Sahana, M., Ravetz, J., Patel, P. P., Dadashpoor, H., and Follmann, A. (2023). Where is the Peri-urban? A systematic review of Peri-urban research and approaches for its identification and demarcation worldwide. Remote Sens. 15:1316. doi: 10.3390/rs15051316
Schneider, A., and Woodcock, C. (2008). Compact, dispersed, fragmented, extensive? A comparison of urban expansion in twenty-five global cities using remotely sensed, data pattern metrics and census information. Urban Stud. 45, 659–692. doi: 10.1177/0042098007087340
Scott, A. J., Carter, C., Reed, M. R., Larkham, P., Adams, D., Morton, N., et al. (2013). ‘Disintegrated development at the rural–urban fringe: Re-connecting spatial planning theory and practice’, Progress in planning. Elsevier Ltd, 83, 1–52.
Sreeja, K. G., Madhusoodhanan, C. G., and Eldho, T. I. (2017). Processes of peri-urban resource – livelihood transitions: glimpses from the periphery of greater Mumbai city, India. Land Use Policy 69, 49–55. doi: 10.1016/j.landusepol.2017.09.008
Sutton, P., Goetz, A. R., Fildes, S., Forster, C., and Ghosh, T. (2010). Darkness on the edge of town: mapping urban and Peri- urban Australia using nighttime satellite imagery. Prof. Geogr. 62, 119–133. doi: 10.1080/00330120903405006
Sylla, M., Lasota, T., and Szewrański, S. (2019). Valuing environmental amenities in peri-urban areas: evidence from Poland. Sustainability 11:570. doi: 10.3390/su11030570
Taylor, L. E., and Hurley, P. T. (2016). A comparative political ecology of exurbia: Planning, environmental management, and landscape change. Heidelberg: Springer.
Tzaninis, Y., Mandler, T., Kaika, M., and Keil, R. (2021). Moving urban political ecology beyond the ‘urbanization of nature’. Prog. Hum. Geogr. 45, 229–252. doi: 10.1177/0309132520903350
UN Habitat. (2019). Urban-rural linkages: Guiding principles: Nairobi, UN Human Settlements Programme. Available at: https://unhabitat.org/topic/urban-rural-linkages (accessed December 2024).
Vejre, H., Jensen, F. S., and Thorsen, B. J. (2010). Demonstrating the importance of intangible ecosystem services from peri-urban landscapes. Ecol. Complex. Ecosyst. Serv. 7, 338–348. doi: 10.1016/j.ecocom.2009.09.005
Webster, D. (2011). An overdue agenda: systematizing east Asian Peri-urban research. Pac. Aff. 84, 631–642. doi: 10.5509/2011844631
Westerink, J., Haase, D., Bauer, A., Perpar, A., Grochowski, M., Ravetz, J., et al. (2013). Dealing with sustainability trade-offs of the compact city in peri-urban planning across European city regions. Eur. Plan. Stud. 21, 473–497. doi: 10.1080/09654313.2012.722927
Winter, A. K., and Karvonen, A. (2022). Climate governance at the fringes: Peri-urban flooding drivers and responses. Land Use Policy 117:106124. doi: 10.1016/j.landusepol.2022.106124
Woiwode, C., Ramachandran, A., Philip, T., Rishika, D., and Rajan, S. C. (2024). Identifying entry points for adaptive governance in peri-urban Chennai (India): a multi-dimensional, multi-level, and multi-scalar approach. Front. Sustain. Cities 6:1368240. doi: 10.3389/frsc.2024.1368240
Woltjer, J. (2014). A global review on Peri-urban development and planning. J. Reg. City Plan. 25, 1–16. doi: 10.5614/jpwk.2014.25.1.1
Keywords: bio-regions, hinterlands, ‘functional urban area’, edge city, ‘global human settlements layer’, urban–rural gradient, peri-urban
Citation: Ravetz J and Sahana M (2025) Where is the peri-urban? Mapping the areas ‘around, beyond and between’. Front. Sustain. Cities. 7:1436287. doi: 10.3389/frsc.2025.1436287
Edited by:
Marco Casazza, University of Salerno, ItalyReviewed by:
Manuel Wolff, Humboldt University of Berlin, GermanyCopyright © 2025 Ravetz and Sahana. This is an open-access article distributed under the terms of the Creative Commons Attribution License (CC BY). The use, distribution or reproduction in other forums is permitted, provided the original author(s) and the copyright owner(s) are credited and that the original publication in this journal is cited, in accordance with accepted academic practice. No use, distribution or reproduction is permitted which does not comply with these terms.
*Correspondence: Joe Ravetz, am9lLnJhdmV0ekBtYW5jaGVzdGVyLmFjLnVr
Disclaimer: All claims expressed in this article are solely those of the authors and do not necessarily represent those of their affiliated organizations, or those of the publisher, the editors and the reviewers. Any product that may be evaluated in this article or claim that may be made by its manufacturer is not guaranteed or endorsed by the publisher.
Research integrity at Frontiers
Learn more about the work of our research integrity team to safeguard the quality of each article we publish.