Abstract
Introduction:
Urban power load forecasting is essential for smart grid planning but is hindered by data imbalance issues. Traditional single-model approaches fail to address this effectively, while multi-model methods mitigate imbalance by splitting datasets but incur high costs and risk losing shared power distribution characteristics.
Methods:
A lightweight urban power load forecasting model (DLUPLF) is proposed, enhancing LSTM networks with contrastive loss in short-term sampling, a difference compensation mechanism, and a shared feature extraction layer to reduce costs. The model adjusts predictions by learning distribution differences and employs dynamic class-center contrastive learning loss for regularization. Its performance was evaluated through parameter tuning and comparative analysis.
Results:
The DLUPLF model demonstrated improved accuracy in forecasting imbalanced datasets while reducing computational costs. It preserved shared power distribution characteristics and outperformed traditional and multi-model approaches in efficiency and prediction accuracy.
Discussion:
DLUPLF effectively addresses data imbalance and model complexity challenges, making it a promising solution for urban power load forecasting. Future work will focus on real-time applications and broader smart grid systems.
1 Introduction
The ability to intelligently control energy transmission and transformation equipment, fast transformation of urban power-generating methods, smart urban grids (Songhorabadi et al., 2023), and scientific advancements (Tian et al., 2024) have all become conceivable. Power load forecasting is a crucial instrument for smart, sustainable urban growth (Bibri, 2018a) decision-making (Hazra et al., 2024). Smart urban grids use power load forecasting models to plan the city’s power dispatching methods, estimate future trends in urban power loads, and identify the amount of power generation that will minimize power losses and maintain a stable supply and demand balance (Mahajan et al., 2022). Accurate urban smart power load forecasting is crucial for urban power networks to remain stable and financially sustainable. Due to businesses ceasing operations on Sundays, the power load scale in urban power load data is typically smaller on Sundays than it is on weekdays. This leads to inconsistent data in power load predictions. The power load dataset is divided according to various load distributions in existing multi-model systems (Huseien and Shah, 2022), which then create forecasting models for each subset and provide distinct predictions. However, developing models with many models increases the total cost and splits the shared characteristics of power distribution among load distribution variations (Xie et al., 2024).
Smart power load forecasting in metropolitan areas can cause poor prediction performance of single-model approaches (Feng et al., 2022). Compensation for discrepancies and contrastive loss in short-term sampling are ideas that this model incorporates into the LSTM (Yazici et al., 2023). The idea behind discrepancy compensation is to build a discrepancy compensation module that compares smart energy load samples with different distributions and uses that information to adjust the main sequence prediction module’s prediction results according to the predicted samples’ characteristics (Bibri, 2018b). We can train the main sequence prediction module to learn the common patterns of power load variation of samples with diverse distributions of power loads by using this strategy. Regularization functions for model training that rely on dynamic centroids are known as short-term sampling contrastive losses. As a result, it highlights intra-class compactness by making sure that power load sequences on the same day are close to each other. For days of the week with similar smart energy load distributions, the model can differentiate because of this loss. In addition, the discrepancy compensation module is trained more effectively with the help of short-term sampling contrastive loss, which increases the learning weight of a small number of sample data. To further reduce the number of model parameters, we also propose the idea of a common feature extraction layer. The discrepancy correction module and the primary sequence prediction module can share this layer. Creating hyperparameter tweaking and comparison tests validated the model’s performance. The experimental results show that the suggested model outperforms state-of-the-art models in prediction by correctly capturing power load fluctuations between weekends and weekdays, due to the discrepancy compensation module and short-term sampling contrastive loss.
The main contributions of this study are as follows:
-
Improving the predictive efficacy: Enhancing the predictive performance of single-model methodologies in urban smart power load forecasting tasks affected by data imbalance through the integration of discrepancy compensation into LSTM.
-
Introducing short-term sampling contrastive loss: We propose short-term sampling contrastive loss as a regularization method in model training. This approach helps augment the learning weight of limited sample data and distinguish between weekday power load data exhibiting analogous load curves.
-
Developing a unified feature extraction module: We introduce a unified feature extraction module that enables both the primary sequence prediction and discrepancy compensation modules to utilize a single feature extraction layer. This reduces the model’s parameter count while preserving predictive accuracy.
-
Conducting an experimental evaluation: We perform an experimental evaluation of the Lighten-Dynamic Channel-Selection Convolution (DCSC)-LSTM model against other traditional methodologies. The article utilizes RMSE, MAPE, and MAE to evaluate mistakes. In the experimental evaluations, the Lighten-DCSC-LSTM outperforms other models.
Section 2, an overview of previous studies, highlights gaps addressed by this research, and Section 3 defines symbols and notations and outlines the problem being investigated. Section 4 presents and explains the proposed model’s framework, algorithms, and assumptions; Section 5 describes experiments, analyzes the results, and compares the model with existing methods; and Section 6 concludes findings and contributions and suggests directions for future research.
2 Related work
2.1 Traditional power load forecasting models
In recent years, the field of smart power load forecasting has made extensive use of statistical approaches and AI computation (Kılkış et al., 2023). Autoregressive (AR) (Sarker, 2022), moving average (MA) (Alomar, 2023), autoregressive moving average (ARMA) (Olabi et al., 2023), and autoregressive integrated moving average model (ARIMA) (Mehmood et al., 2024) are some of the most popular statistical forecasting models used for power load forecasting. Although these models do not necessitate a lot of processing power (Bine et al., 2024), they are not as accurate as models based on artificial intelligence (Javed et al., 2022). However, greater accurate performance comes at a cost—computationally more expensive—when using artificial intelligence approaches such as support vector regression (SVR) (Ouallane et al., 2022) and artificial neural networks (ANN) (Li et al., 2023). More importantly, the algorithms do not consider the correlation between consecutive power load series data. As a classic time series data, there is a high correlation between consecutive power load time series. Hence, conventional time series forecasting techniques fail to account for the correlation between successive power load data and time-dimensional distance features, resulting in imprecise predictions.
2.2 Deep learning-based power load forecasting models
Researchers have suggested several deep learning models to address the smart power load forecasting issue in light of the current advances in machine learning and deep learning. Hopfield (Ahmed et al., 2024) first suggested the RNN in the early 1980s. By connecting nodes in a directed graph, RNN can take the temporal dimension of correlation into account while processing time series data. However, RNNs are prone to gradient expansion and gradient vanishing during training because of their endless dynamic loop. An RNN-based long short-term memory network (LSTM) was suggested by the author (Atitallah et al., 2020) as a solution to the gradient vanishing problem. To prevent problems with gradient explosion and disappearance, a typical LSTM network has four gates: an input gate, a forget gate, a memory cell, and an output gate. The bidirectional LSTM (Bi-LSTM) (SaberiKamarposhti et al., 2024) is an enhanced version of the LSTM network that learns the input time series in both directions. Power load forecasting activities that depend on previous data will benefit greatly from deep learning features. One deep learning framework that the author suggested (Olabi et al., 2023) combines LSTM with convolutional neural networks (CNNs). To learn sequences, the CNN-LSTM model uses LSTM layers, while CNN layers extract characteristics from the input data. By including an attention mechanism, Attention-LSTM (Pandiyan et al., 2024) improves the LSTM network’s capacity to learn important characteristics from lengthy input sequences. Power load forecasting is another area that has benefited from this model’s use to enhance prediction accuracy (Powell et al., 2024). These networks are currently trending in several industries, including NLP (Nguyen et al., 2024), SR (Deng et al., 2021), MF (Boopathy et al., 2024), and WSM (Mukherjee et al., 2020).
The authors (Fadhel et al., 2024) suggested splitting the dataset into weekday, Saturday, and Sunday groups depending on power load data in studies on smart power load forecasting with data imbalance. The team then developed three separate forecasting models for each day of the week. By dividing the electricity load information into workday, weekend, and holiday clusters, the author (Hazra et al., 2024) was able to make predictions. Based on our review of the literature, it appears that the majority of studies dealing with power load forecasting in the face of data imbalance use the technique of sample segmentation based on load distribution to conduct independent forecasts. There has not been much effort to improve single-model approaches without changing the dataset to fix this issue.
Therefore, this study attempts to add a discrepancy compensation module that learns the differences in samples with LSTM network training regularization using varying load factors and a contrastive loss based on short-term sampling. With these enhancements, the model is currently well under data imbalance conditions. In addition, we extract a shared feature extraction layer to construct a more lightweight power forecasting model.
3 Symbols definition and problem description
3.1 Symbols definition
Table 1 contains the symbols that were utilized in this article.
Table 1
| Sign | Definition |
|---|---|
| Electricity load of the previous βth days | |
| Electricity load observation of the tth day | |
| Electricity load detection of the tth day | |
| Dynamic class center of the tth day |
Signs definition.
3.2 Problem description
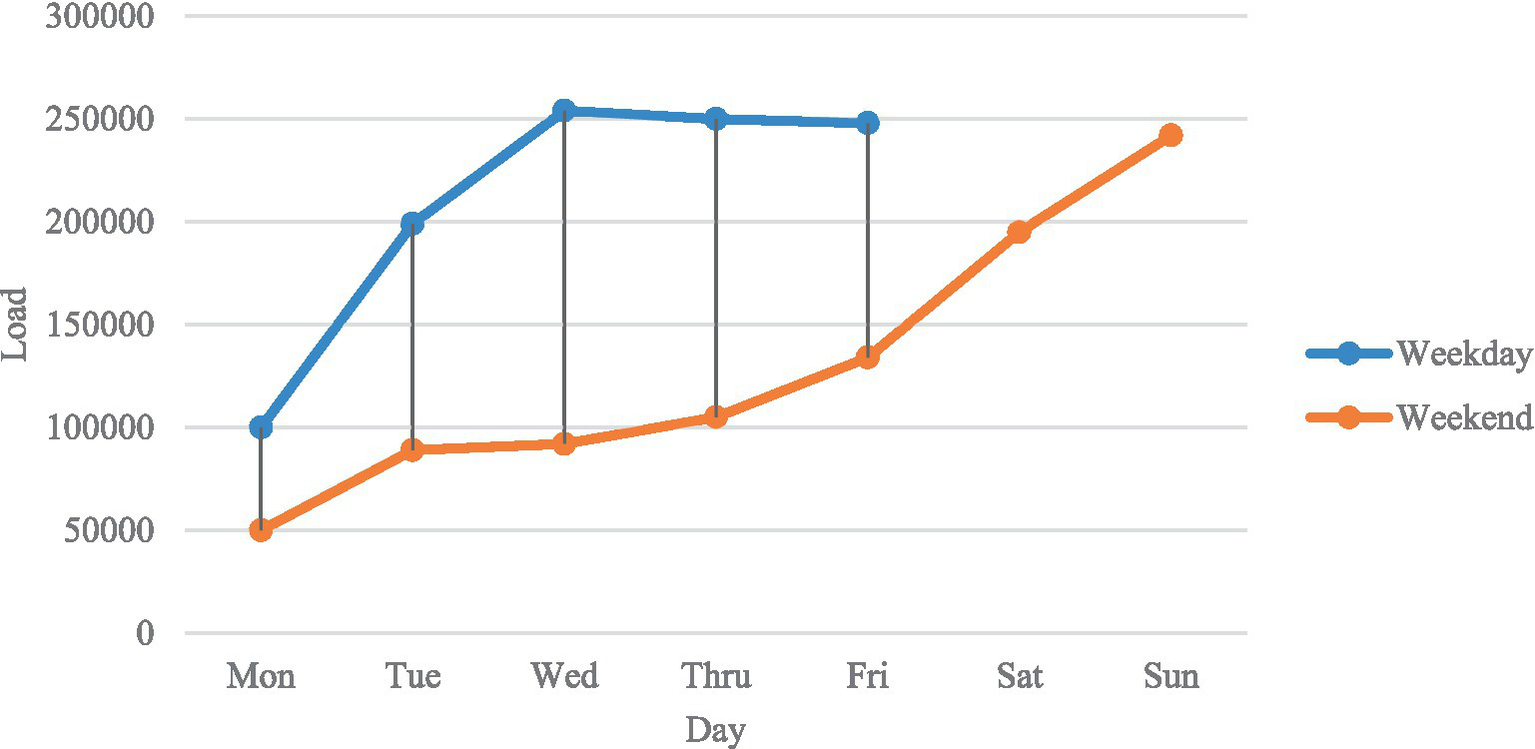
Sustainable urban growth power load mainly consists of residential and industrial power loads. Residential power load includes the electricity usage of typical home electronics including lights, washers, air conditioners, and TVs. This burden is intricately linked to the daily lives of residents and thus exhibits a stable daily pattern over time. Industrial power load refers to the electricity consumption used for industrial production by enterprises. Although industrial power load shows regularity according to the working hours of sustainable urban growth residents, most enterprises choose to halt or reduce production on Sundays, leading to significant differences in industrial power load between weekdays and weekends. This introduces an imbalance in the data used to predict urban power loads, which is a major obstacle to reliable smart power load forecasting in cities. This article visualizes experimental data to specifically describe the daily regularity and data imbalance problem in urban power load data.
As shown in Figures 1, 2, two characteristics of the smart energy load distribution can be clearly observed:
-
The power load data exhibit daily regularity. By observing Figure 1, it can be seen that the power load shows regularity with a cycle of 96 sampling points (1 day). A comprehensive review of the entire experimental dataset confirms that the power load data indeed display strong daily regularity.
-
The magnitude of Sunday power consumption is often less than that of weekdays. Figure 2 illustrates that the magnitude of sustainable urban growth power load is reduced on weekends, exhibiting a significant decline on Sundays in contrast to weekdays. The rationale behind this is that the majority of firms opt to cease or diminish production on Sundays, resulting in a corresponding decrease in power load on weekends. Due to the lesser reduction in power load on Saturdays relative to weekdays, this study categorizes Saturdays as weekdays. The consistent patterns in urban power load data enable academics to project future sustainable urban growth power load trends through the development of deep learning-based forecasting models. The issue of data imbalance in sustainable urban growth power load poses a hurdle to deep learning-based smart power load forecasting.
Figure 1

Urban power load distribution for a week.
Figure 2
Box plot of load data distribution for different weeks from 2018 to 2021.
4 Model construction
4.1 Long short-term memory network (LSTM)
The LSTM network is an extension of the recurrent neural network (RNN) architecture, first proposed in a previous study (Fadhel et al., 2024), to solve the problems of gradient vanishing and explosion in RNNs. In sequence modeling and prediction tasks, RNNs, represented by LSTM, have strong capabilities in extracting features from time series data. Figure 3 shows the architecture of LSTM.
Figure 3
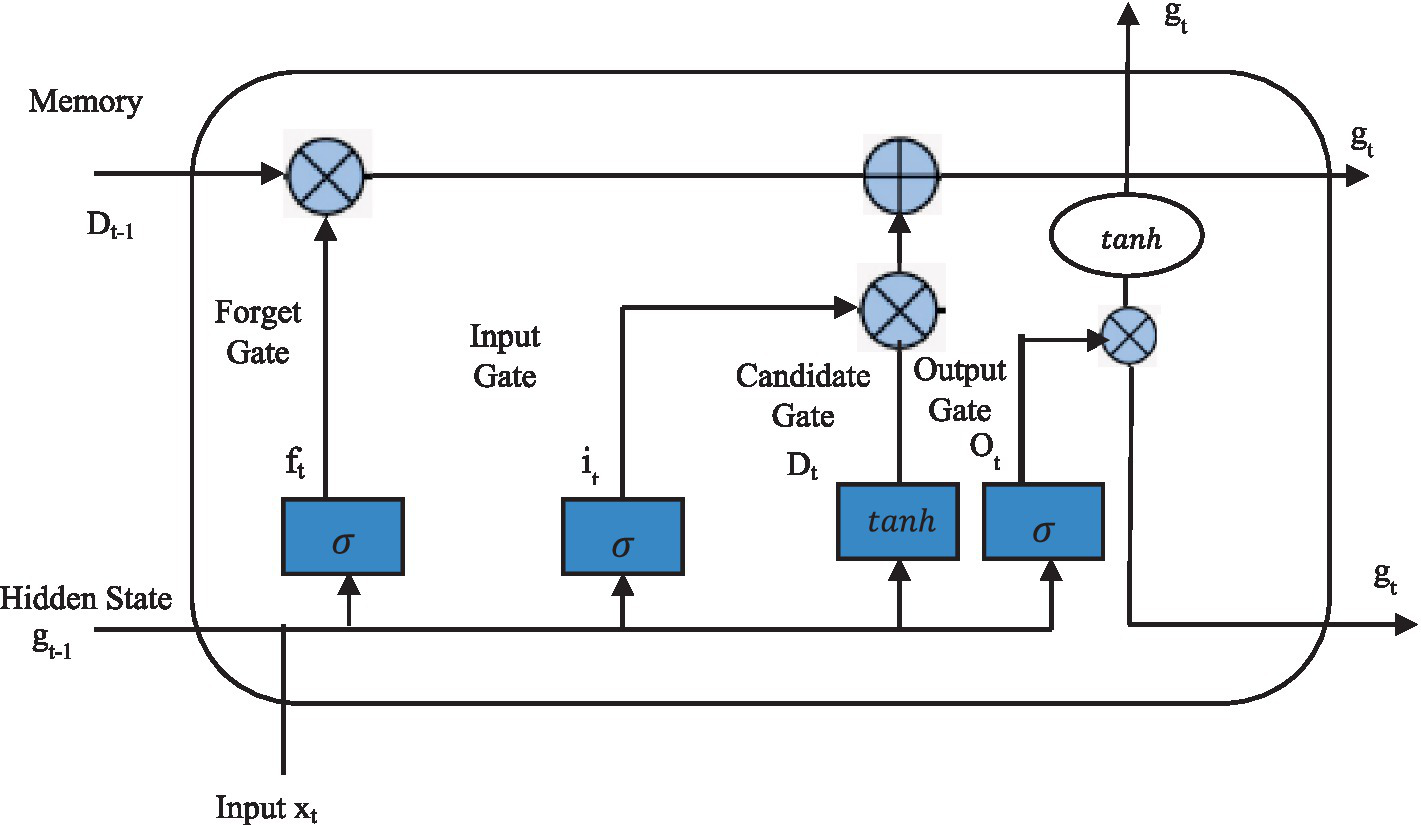
LSTM network structure.
As shown in Figure 3, each LSTM unit contains multiple operations, specifically as shown in Equations 1–6.
Where and c are the bias vector and the weight matrix, respectively; , , and are the forget gate, input gate, and output gate, respectively. The computation of these three gates depends on the current input and the previous output . is the cell state, is the new candidate value for the cell state, is the hidden output at time u, and ⊙ represents the element-wise product. In LSTM, the forget gate controls the amount of historical data from state that can be passed through and the amount that is erased. What fresh data are utilized to modify the cell’s state is decided by the input gate , and the output gate determines which information in the cell state needs to be output. These three gates work together to learn and store sequential information. The weights and biases are learned during model training by minimizing the difference between the LSTM unit’s output and the actual training samples.
4.2 Contrastive loss in short-term sampling
Even on neighboring weekdays, urban electrical load sequences could vary slightly. To train the model to predict daily power loads, it must generate 96 observations for the following day, with each observation sampled every 15 min. To determine training loss, the model can easily disregard discrepancies in observations between load sequences on the same workday but on different dates (for example, Monday and Tuesday). Consequently, a training-based regularization loss function must be included.
However, there is no way to utilize a constant class center to get close samples of electrical load data because it is a time series that fluctuates over time. Instead of using fixed class centers, this study suggests a contrastive learning loss based on short-term samples. A dynamic class center, as opposed to a static one, is utilized in this loss. The current prediction sequence’s power load sequence from 7 days prior serves as the class center for sampling in this investigation. To determine the decrease in contrastive learning from short-term sampling, we use the power load sequence from the previous Monday as the dynamic class center. This is performed for situations where the current predicted smart energy load sequence is set to occur on Monday.
Figure 4 shows that a contrastive learning loss function allows the model to prioritize intra-class compactness by drawing power load sequences from the same class closer together. Furthermore, by including this loss function, the model can differentiate between datasets of weekday power load with similar distributions, and it can learn more from small samples (weekend samples).
Figure 4
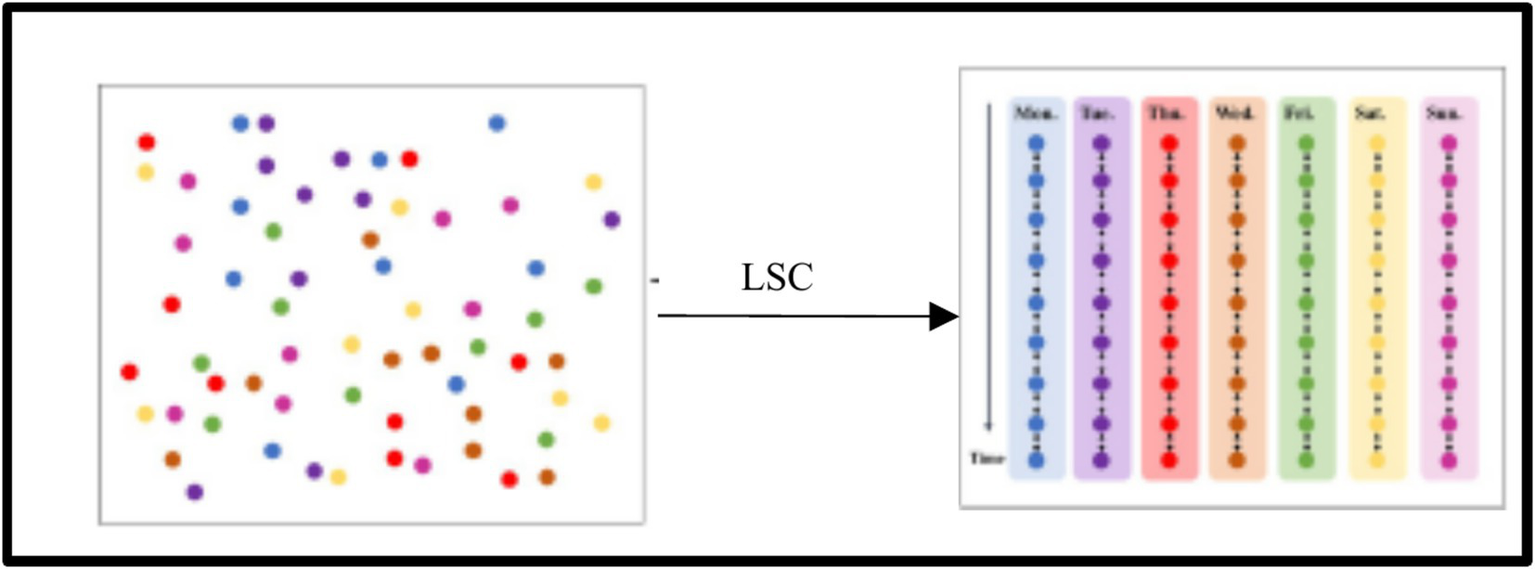
Short-term contrastive loss causes the model to prioritize compactness within classes.
The specific contrastive learning loss calculation formula is shown in Equation 7:
where refers to the size of the batch and is the Euclidean distance (Pliatsios et al., 2023). , and stand for the batch samples’ anticipated sequences and dynamic class centers, respectively.
4.3 Discrepancy compensation and shared feature extraction
Based on the idea of discrepancy compensation, this article divides the traditional single sequence prediction into part of a portion of the DC module and the MSF module, both of which are for discrepancy compensation. Its core sequence prediction module and its discrepancy compensation module both use LSTM and FC layers. The primary roles of the two components are illustrated in Figure 5 and are:
-
Sequence Prediction Module: The main sequence prediction module ignores the differences between power load data samples with different power load curves and learns to predict the power load data of normal samples.
-
Discrepancy Compensation Module: When comparing normal samples to those with a low power load, the discrepancy adjustment module picks up on the differences. When the prediction sample is a few samples, it comes into play.
Figure 5
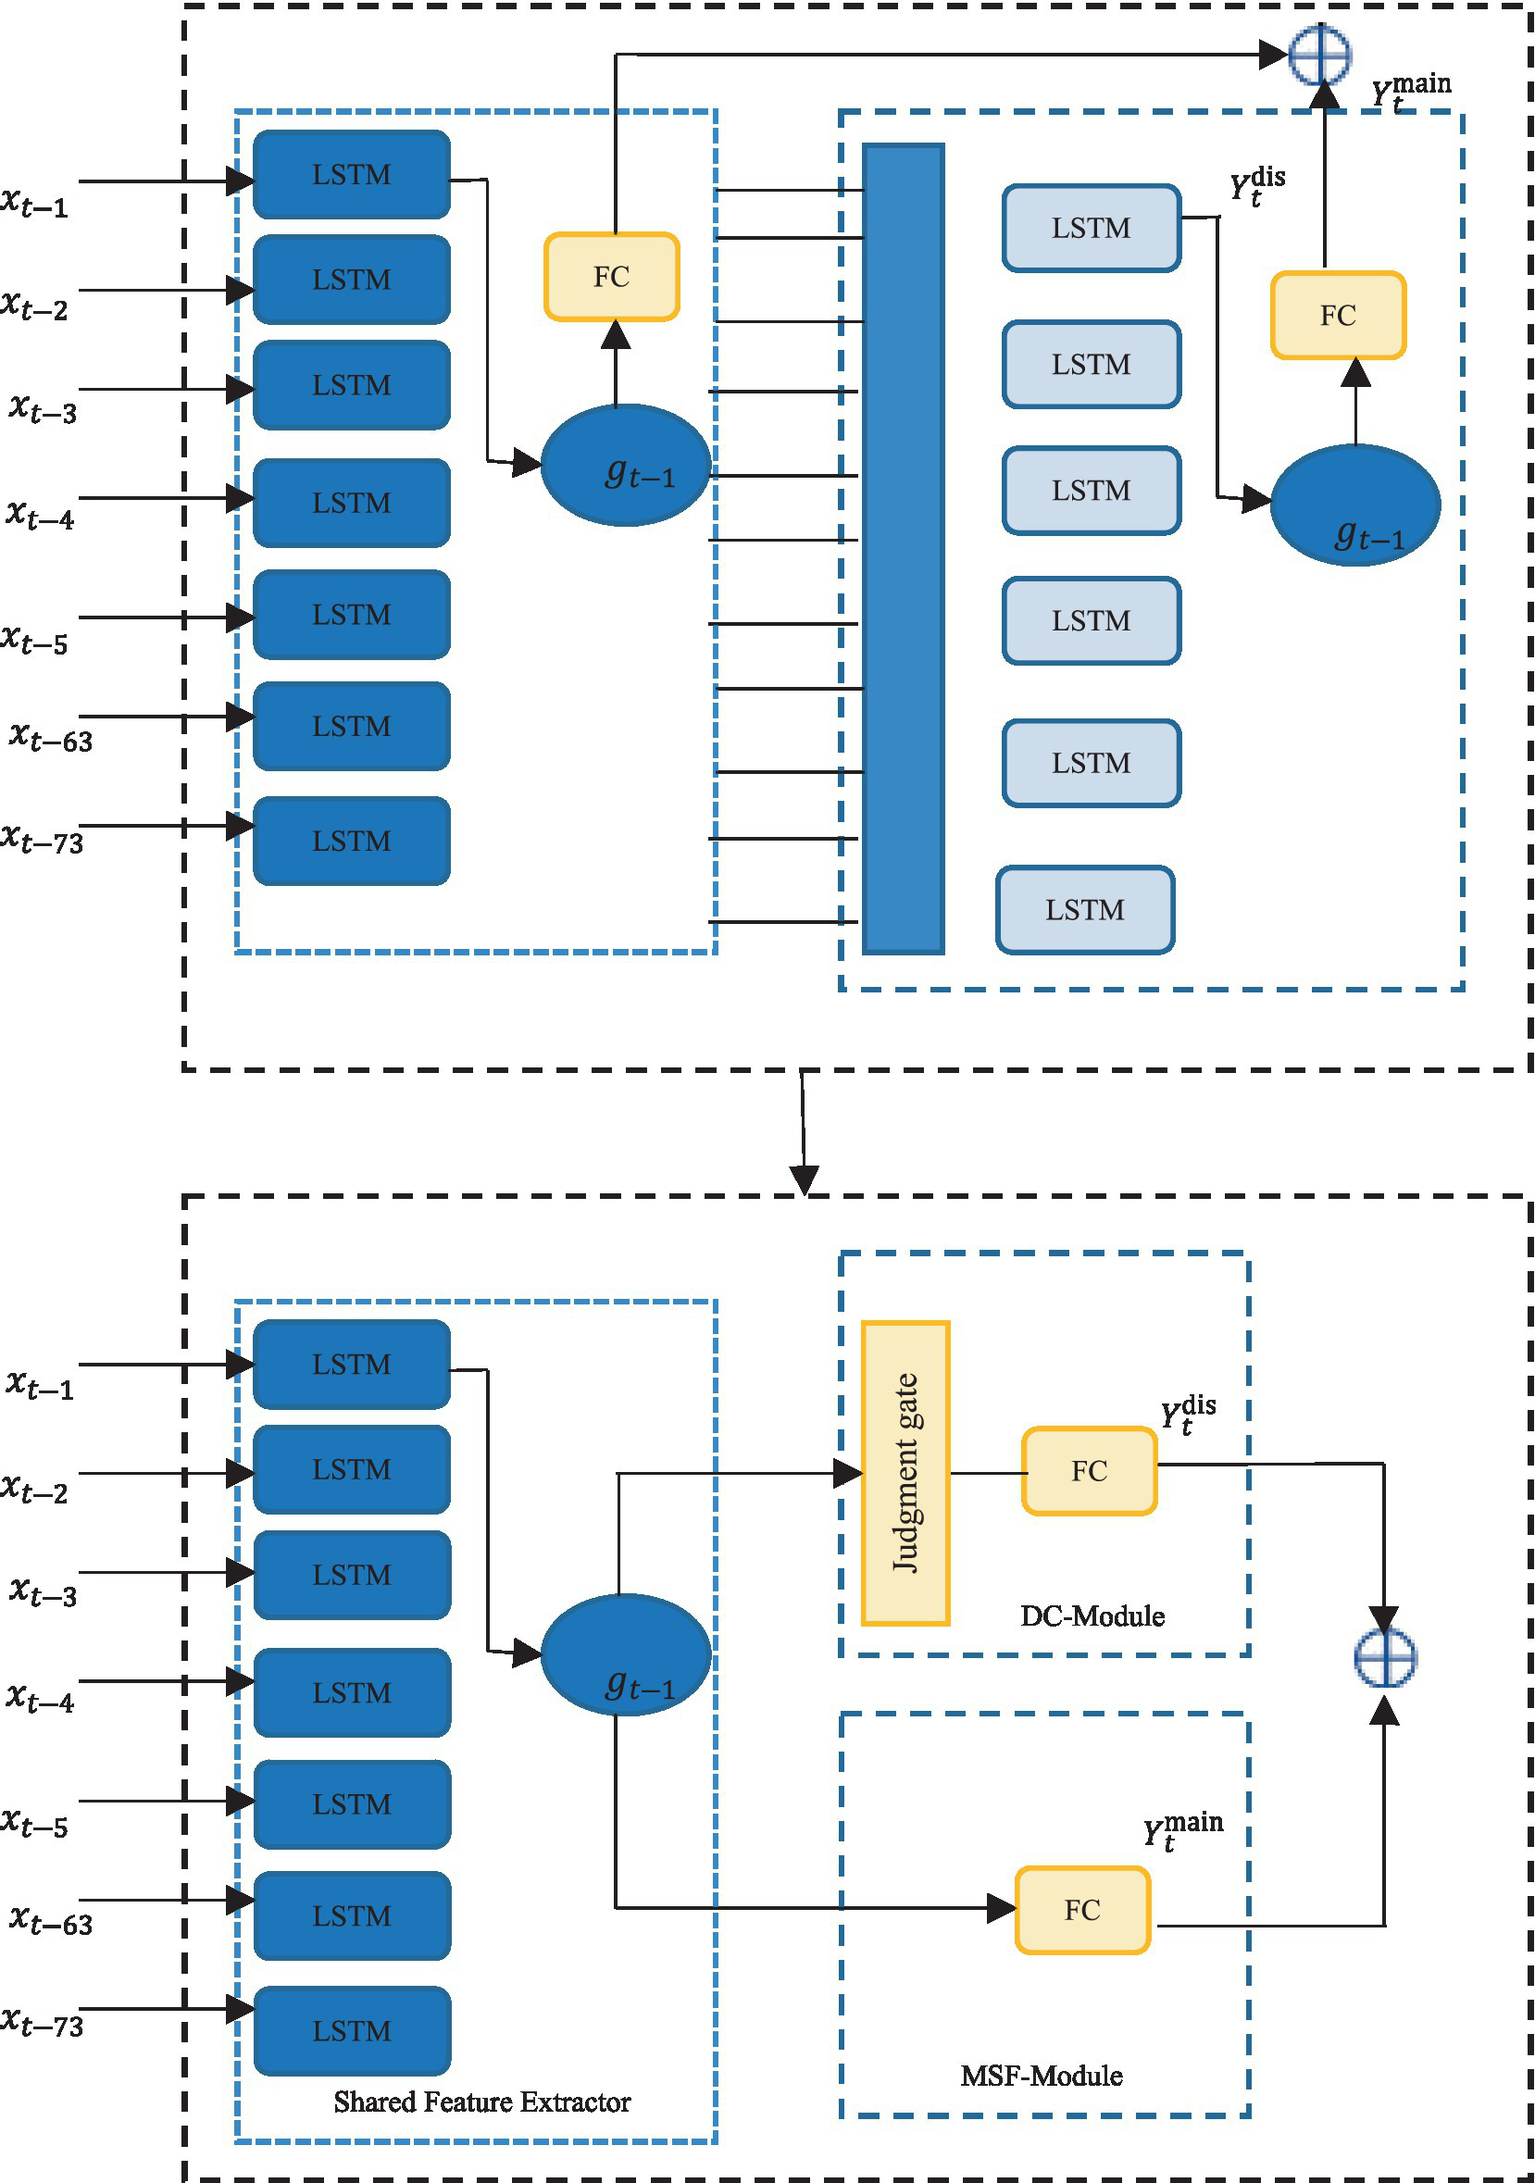
Extracting shared feature extraction layer.
Based on this, this article constructs a shared feature extractor by extracting the LSTM responsible for extracting power load time series features in both the primary module for predicting sequences and the module for compensating for discrepancies. This reduces the number of model parameters and enables the model to focus more on extracting the common time series features among samples with different smart energy load distributions.
4.4 Lighten-DCSC-LSTM model
The shared feature extractor, main sequence forecast, discrepancy compensation, and training loss calculation modules make up the Lighten-DCSC-LSTM model. There is also a discrepancy module.
Mean squared error (MSE) and short-term sampling contrastive (SC) losses are a part of the training loss calculation module (TLC Module) (Habibi, 2021). Predicted and observed values are used to compute the mean squared error (MSE) loss, while the dynamic center and observed values are used to calculate the short-term sampling contrastive loss. Here are the detailed procedures for putting the Lighten-DCSC-LSTM model into action:
Step 1: Input the sequence X into the shared feature extraction layer for feature extraction to obtain the time series features .
Step 2: Input the extracted time series features into the main sequence prediction module for prediction to obtain the main prediction sequence .
Step 3: Input the extracted time series features and the auxiliary input for use by the DC module. If the anticipated sample is more than a fewt samples through, the DC module’s judgment gate will flag it . If it is, the DC module is turned on to anticipate the discrepancy compensation sequence for the time series features , obtaining . Then, is applied to the main prediction sequence , resulting in the final sequence prediction result .
Step 4: To get the ultimate training loss L, add the two losses. Equation 8 displays the loss calculation formula:
Among them, λ represents the weight of short-term sampling contrast loss.
5 Experimental evaluation
To evaluate the capability of the Lighten-DCSC-LSTM model in solving power load data with uneven distributions, this study conducted hyperparameter optimization and comparative experiments.
5.1 Data explanation
The dataset used in this study comes from the 10th TDI Cup Data Mining Challenge’s Problem B. It includes 44 months of electricity load data, with readings every 15 min, from 1 January 2018 at 0:00 to 31 August 2020 at 23:45 (Herath and Mittal, 2022). Specifically, these data track patterns in electricity use and offer insightful information about long-term, sustainable urban growth. The dataset’s granularity, coupled with regular and reliable measurements, makes it a perfect tool for examining energy use in scenarios involving urban expansion.
5.2 Data preparation
Due to potential instability in the detection and transmission of power load data, the dataset may contain missing, abnormal, and noisy data. Therefore, pre-processing of the dataset is necessary before constructing the model. This study performed several pre-processing steps, including filling in missing values, removing duplicates, handling outliers, and normalizing the data. There were two sets of data used to validate the experiment: one set for the most recent 10 days and another set for the most recent 30 days of sustainable urban growth power load data. The rest of the dataset was divided into two parts: one for training and another for testing. The training set covered the period from January 1, 2018, to July 25, 2020 and the testing set covered the time from July 25, 2020, to July 31, 2020 (Nižetić et al., 2019), and the testing set covered the same time from 25 July 2020 to 11:45. From the power load sequence, we also extracted the day-of-week feature to obtain the auxiliary input.
5.3 Measures for assessment
This study utilized three popular measures in time series forecasting evaluation: root mean square error (RMSE) (Jie Chen and Ramanathan, 2021), mean absolute percentage error (MAPE) (Wai et al., 2022), and mean absolute error (MAE) (Howell and Rezgui, 2017) to assess the effectiveness of various power load forecasting methods. As demonstrated in Equation 9: MAE is the average of the total absolute errors between the actual values and the estimated values.
In this context, and stand for the 96 points each day that combine to form the predicted and actual power load for the 𝑖 day. While MAE and MAPE are similar, MAPE accounts for the degree to which actual and predicted values differ by dividing each MAPE difference by the actual value, as shown in Equation 10:
The root mean squared error (RMSE) measures precision by contrasting the actual and estimated values’ dispersion, as shown in Equation 11:
The model’s accuracy is proportional to the minimization of MAE, MAPE, and RMSE.
5.4 Hyperparameter tuning
The model in this study is constructed using a deep learning framework, and its predictive performance depends on the number of parameters, which are influenced by the model’s hyperparameters. This study selected two common parameters for hyperparameter optimization: the hidden layer HHH in the LSTM (Lin et al., 2024) of the feature extraction layer, in addition to the fully linked layers’ CCC (Abdul Matin et al., 2023) dimension in the discrepancy correction module and the primary sequence prediction module. The model’s parameter size is primarily determined by these two parameters. The larger the hidden layer HHH and the dimension CCC, the larger the model’s parameter size. In addition, as the hidden layer HHH (Singh et al., 2020) of the feature extraction layer increases, the extracted power load features become larger, which, in turn, increases the dimension CCC of the fully connected layers in both the primary module for predicting sequences and the module for compensating for discrepancies. The specific relationships are shown in Table 2 under the columns “Hyperparameters” and “Number of Params.”
Table 2
| Hyperparameters | Number of parameters | Future 30 days | Future 10 days | ||||
|---|---|---|---|---|---|---|---|
| RMSE | MAE | MAPE | RMSE | MAE | MAPE | ||
| G = 6,D = 6(shared) | 3,840 | 4404.1 | 3082.2 | 0.013 | 3,574 | 2739.7 | 0.013 |
| G = 12,D = 12(shared) | 780 | 4342.3 | 3132.5 | 0.013 | 3,539 | 2619.3 | 0.012 |
| G = 24,D = 24(shared) | 16,510 | 4246.7 | 3082.2 | 0.013 | 3,534 | 2739.6 | 0.013 |
| G = 48,D = 48(shared) | 37,440 | 4184.3 | 3046.8 | 0.013 | 3,303 | 2539.9 | 0.013 |
Hyperparameter tuning results.
The studies were conducted utilizing the PyTorch framework. The model training used the Adam optimizer (Rizi and Seno, 2022) for parameter optimization, with an initial learning rate of α = 0.001, a weight λ = 0.5 for short-term sampling contrast loss, and an input sequence length β = 7. Furthermore, we incorporated two callback APIs during training: Early Stopping and the ReduceLROnPlateau callback function, employing the specified parameters: factor = 0.85 and patience = 300. Table 2 presents the results of the parameter modification. The hyperparameters G and D delineate the model’s complexity, with G potentially signifying the number of groups or nodes and D indicating the depth or dimensionality of shared layers. Augmenting G and D typically enhances the model’s capability and the parameter count, hence affecting prediction accuracy and computational expenses.
From the fifth and sixth rows in Table 2, it can be seen that by constructing a shared feature extraction layer, the model’s parameter size can be reduced from 121,150 to 93,120 without changing other hyperparameters. Moreover, the model performs best when both hyperparameters HHH and CCC are set to 96 for predicting the next 10 days and 30 days. Therefore, based on the parameter tuning, we set both HHH and CCC to 96 in this study.
5.5 Comparative experiments
Six different prediction models were compared to the Lighten-DCSC-LSTM model to determine its efficacy. These models included RNN, SVR, LSTM, Bi-LSTM, CNN-LSTM, and Attention-LSTM. The results of our studies comparing this model to multi-model LSTM, Bi-LSTM, and CNN-LSTM models are presented in Table 3.
Table 3
| Type of model | Model | Future 30 days | Future 10 days | ||||
|---|---|---|---|---|---|---|---|
| RMSE | MAE | MAPE | RMSE | MAE | MAPE | ||
| Single-model-based model | SVR [12] | 9568.7 | 7216.8 | 0.03 | 8,828 | 6590.5 | 0.03 |
| RNN [15] | 5858.3 | 4338.5 | 0.018 | 4,501 | 3457.7 | 0.018 | |
| LSTM [16] | 5369.3 | 3652.5 | 0.015 | 5,693 | 4395.8 | 0.019 | |
| Bi-LSTM [22] | 6785.9 | 5126.3 | 0.022 | 6,471 | 5,055 | 0.022 | |
| CNN-LSTM [25] | 6962.3 | 5606.6 | 0.024 | 5,103 | 4255.1 | 0.024 | |
| Attention-LSTM [28] | 6381.8 | 4651.6 | 0.019 | 5,899 | 4288.5 | 0.019 | |
| Multi-model-based model |
LSTM [16] | 4638.7 | 3184.9 | 0.015 | 4,977 | 3804.8 | 0.015 |
| Bi-LSTM [18] | 5087.7 | 3722.9 | 0.016 | 5,693 | 3995.8 | 0.016 | |
| CNN-LSTM [25] | 5313.9 | 3751.7 | 0.016 | 5,753 | 4255.6 | 0.016 | |
| Proposed model | Lighten-DCSC-LSTM | 3927.9 | 2825.1 | 0.013 | 3,303 | 2,294 | 0.013 |
Comparative experiment results.
Compared to the Attention-LSTM, CNN-LSTM, Bi-LSTM, and LSTM models built using a single model, the multi-model versions fared better when dealing with data on uneven sustainable urban growth power loads in predicting the next 10 days and 30 days of sustainable urban growth power load. This indicates that the multi-model approach can indeed alleviate the problem of uneven data distribution.
Simultaneously, looking at the prediction accuracy of the Lighten-DCSC-LSTM model versus that of the LSTM, Bi-LSTM, and CNN-LSTM models that were built using a multi-model approach, the Lighten-DCSC-LSTM model performs better when it comes to forecasting urban power loads for the next 10 and 30 days.
To illustrate the efficacy of the Lighten-DCSC-LSTM model on urban power load datasets characterized by uneven data distribution, we depicted the model’s power load forecasts for the subsequent 30 days alongside the actual dataset values, as presented in Figure 6, where orange denotes the predicted values and blue signifies the actual values. The model’s forecast results closely mirror the actual power load time series.
Figure 6
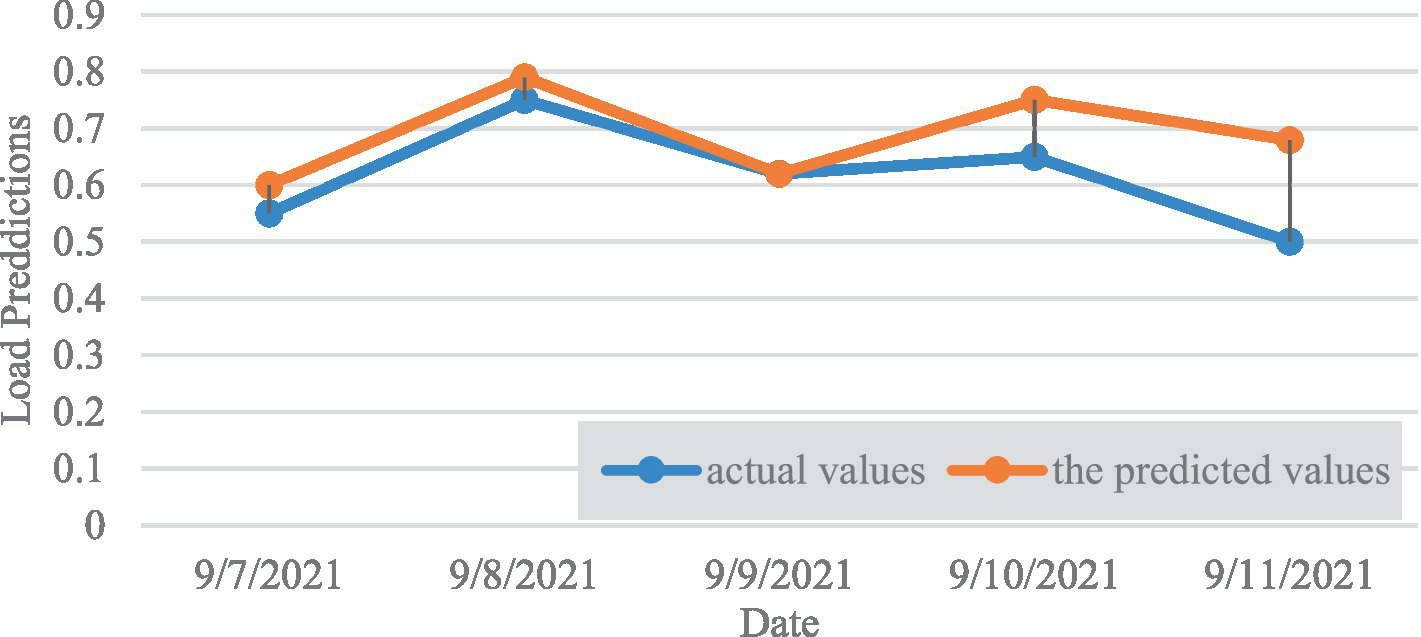
Model prediction results (Color version available in the electronic version).
6 Conclusion
Forecasting urban power loads is crucial for unit activation, allocation, and operating strategy in urban power systems. This research aims to address the suboptimal performance of single-model approaches on imbalanced urban power load datasets. The study clarifies the origins of data irregularity in urban power load datasets: the significant reduction in power demand on Sundays, due to industrial shutdowns or reduced output compared to weekdays, exacerbates the problem of data imbalance in urban energy consumption. The study elucidates contemporary power load forecasting techniques, emphasizing the shortcomings of multi-model approaches utilizing disparate power load datasets and illustrating how single-model approaches can more adeptly identify prevalent temporal trends across diverse samples. This study introduces a correction strategy for inconsistencies and contrast loss in short-term sampling, employing a single-model approach to tackle the problem of uneven data in urban power load forecasting. Moreover, by extracting shared characteristics from the extraction layer, the model’s parameters are further minimized, resulting in a more efficient model (Lighten-DCSC-LSTM). The model’s hyperparameters were optimized by tuning, and comparative studies have shown that the proposed model outperforms traditional power forecasting methods and existing multi-model power load forecasting strategies on datasets containing irregular data. This study illustrates that improving single-model approaches and loss functions can lead to enhanced performance in forecasting urban power loads using distributed data. We intend to improve the model’s forecasting accuracy in future endeavors by optimizing the short-term sample contrast loss function. In addition, we will strive to implement similar solutions to tackle other forecasting issues related to irregular data.
Statements
Data availability statement
The raw data supporting the conclusions of this article will be made available by the authors, without undue reservation.
Author contributions
HB: Conceptualization, Funding acquisition, Investigation, Writing – original draft. AA: Data curation, Software, Writing – review & editing. IK: Data curation, Methodology, Supervision, Writing – review & editing. MS: Resources, Validation, Visualization, Writing – original draft. SM: Methodology, Supervision, Writing – review & editing. GS: Formal analysis, Resources, Validation, Writing – original draft.
Funding
The author(s) declare that financial support was received for the research, authorship, and/or publication of this article. This research supported by Basic Science Research Program through the National Research Foundation of Korea (NRF) funded by the Ministry of Education (NRF- RS-2023-00237287, NRF-2021S1A5A8062526) and local government-university cooperation-based regional innovation projects (2021RIS-003).
Conflict of interest
The authors declare that the research was conducted in the absence of any commercial or financial relationships that could be construed as a potential conflict of interest.
Publisher’s note
All claims expressed in this article are solely those of the authors and do not necessarily represent those of their affiliated organizations, or those of the publisher, the editors and the reviewers. Any product that may be evaluated in this article, or claim that may be made by its manufacturer, is not guaranteed or endorsed by the publisher.
References
1
Abdul Matin M. Islam R. Wang X. Huo H. (2023). Guandong Xu, AIoT for sustainable manufacturing: overview, challenges, and opportunities. Internet Things24:100901. doi: 10.1016/j.iot.2023.100901
2
Ahmed A. A. Sayed S. Abdoulhalik A. Moutari S. (2024). Lukumon Oyedele, Applications of machine learning to water resources management: A review of present status and future opportunities. J. Clean. Prod.441:140715. doi: 10.1016/j.jclepro.2024.140715
3
Alomar M. A. (2023). An IOT based smart grid system for advanced cooperative transmission and communication. Physical Commun.58:102069. doi: 10.1016/j.phycom.2023.102069
4
Atitallah S. B. Driss M. Boulila W. Ghézala H. B. (2020). Leveraging deep learning and IoT big data analytics to support the smart cities development: review and future directions. Comput Sci Rev38:100303. doi: 10.1016/j.cosrev.2020.100303
5
Bibri S. E. (2018a). A foundational framework for smart sustainable city development: theoretical, disciplinary, and discursive dimensions and their synergies. Sustain. Cities Soc.38, 758–794. doi: 10.1016/j.scs.2017.12.032
6
Bibri S. E. (2018b). The IoT for smart sustainable cities of the future: an analytical framework for sensor-based big data applications for environmental sustainability. Sustain. Cities Soc.38, 230–253. doi: 10.1016/j.scs.2017.12.034
7
Bine L. M. S. Boukerche A. Ruiz L. B. Loureiro A. A. F. (2024). Connecting internet of drones and urban computing: methods, protocols and applications. Comput. Netw.239:110136. doi: 10.1016/j.comnet.2023.110136
8
Boopathy P. Liyanage M. Deepa N. Velavali M. Reddy S. Maddikunta P. K. R. et al . (2024). Deep learning for intelligent demand response and smart grids: A comprehensive survey. Comput Sci Rev51:100617. doi: 10.1016/j.cosrev.2024.100617
9
Deng T. Zhang K. Shen Z.-J. (2021). A systematic review of a digital twin city: A new pattern of urban governance toward smart cities. J. Manage. Sci. Engin.6, 125–134. doi: 10.1016/j.jmse.2021.03.003
10
Fadhel M. A. Duhaim A. M. Saihood A. Sewify A. Al-Hamadani M. N. A. Albahri A. S. et al . (2024). Comprehensive systematic review of information fusion methods in smart cities and urban environments. Information Fusion107:102317. doi: 10.1016/j.inffus.2024.102317
11
Feng J. Gao K. Garshasbi S. Karlessi T. Pyrgou A. Ranzi G. et al . (2022). Urban heat island and advanced mitigation technologies. Comprehensive Renewable Energy (Second Edition). 742–767.
12
Habibi S. (2021). Developing strategies for improving sustainable and smart buildingsBuilding Automation and Digital Technologies. 1–38.
13
Hazra A. Tummala V. M. R. Mazumdar N. Sah D. K. Adhikari M. (2024). Deep reinforcement learning in edge networks: challenges and future directions. Physical Commun.66:102460. doi: 10.1016/j.phycom.2024.102460
14
Herath H. M. K. K. M. B. Mittal M. (2022). Adoption of artificial intelligence in smart cities: A comprehensive review. Int. J. Inform. Manage. Data Insights2:100076. doi: 10.1016/j.jjimei.2022.100076
15
Howell S. Rezgui Y. (2017). Thomas Beach, Integrating building and urban semantics to empower smart water solutions. Autom. Constr.81, 434–448. doi: 10.1016/j.autcon.2017.02.004
16
Huseien G. F. Shah K. W. (2022). A review on 5G technology for smart energy management and smart buildings in Singapore. Energy AI7:100116. doi: 10.1016/j.egyai.2021.100116
17
Javed A. R. Shahzad F. Rehman S. Zikria Y. B. Razzak I. Jalil Z. et al . (2022). Future smart cities: requirements, emerging technologies, applications, challenges, and future aspects. Cities129:103794. doi: 10.1016/j.cities.2022.103794
18
Jie Chen L. Ramanathan M. A. (2021). Holistic big data integrated artificial intelligent modeling to improve privacy and security in data management of smart cities. Microprocess. Microsyst.81:103722. doi: 10.1016/j.micpro.2020.103722
19
Kılkış Ş. Krajačić G. Duić N. Rosen M. A. Al-Nimr M.'d. A. (2023). Sustainable development of energy, water and environment systems in the critical decade for climate action. Energy Convers. Manag.296:117644. doi: 10.1016/j.enconman.2023.117644
20
Li Y. Xie S. Wan Z. Lv H. Song H. Lv Z. (2023). Graph-powered learning methods in the internet of things: A survey. Machine Learn. Appl.11:100441. doi: 10.1016/j.mlwa.2022.100441
21
Lin W. Lin J. Peng Z. Huang H. Lin W. Li K. (2024). A systematic review of green-aware management techniques for sustainable data center. Sustain. Comput.42:100989. doi: 10.1016/j.suscom.2024.100989
22
Mahajan H. B. Junnarkar A. A. Tiwari M. Tiwari T. Upadhyaya M. (2022). LCIPA: lightweight clustering protocol for industry 4.0 enabled precision agriculture. Microprocess. Microsyst.94:104633. doi: 10.1016/j.micpro.2022.104633
23
Mehmood H. Khalid A. Kostakos P. Gilman E. Pirttikangas S. (2024). A novel edge architecture and solution for detecting concept drift in smart environments. Futur. Gener. Comput. Syst.150, 127–143. doi: 10.1016/j.future.2023.08.023
24
Mukherjee A. Mukherjee P. Dey N. Debashis De B. K. (2020). Panigrahi, Lightweight sustainable intelligent load forecasting platform for smart grid applications. Sustain. Comput.25:100356. doi: 10.1016/j.suscom.2019.100356
25
Nguyen H. Nawara D. Kashef R. (2024). Connecting the indispensable roles of IoT and artificial intelligence in smart cities: A survey. J. Inform. Intell.2, 261–285. doi: 10.1016/j.jiixd.2024.01.003
26
Nižetić S. Djilali N. Papadopoulos A. Rodrigues J. J. P. C. (2019). Smart technologies for promotion of energy efficiency, utilization of sustainable resources and waste management. J. Clean. Prod.231, 565–591. doi: 10.1016/j.jclepro.2019.04.397
27
Olabi A. G. Wilberforce T. Obaideen K. Sayed E. T. Shehata N. Alami A. H. et al . (2023). Micromobility: Progress, benefits, challenges, policy and regulations, energy sources and storage, and its role in achieving sustainable development goals, 100292. Int. J. Thermofluids. doi: 10.1016/j.ijft.2023.100292
28
Ouallane A. A. Bakali A. Bahnasse A. Broumi S. Talea M. (2022). Fusion of engineering insights and emerging trends: intelligent urban traffic management system. Inform. Fusion88, 218–248. doi: 10.1016/j.inffus.2022.07.020
29
Pandiyan P. Saravanan S. Kannadasan R. Krishnaveni S. Alsharif M. H. Kim M.-K. (2024). A comprehensive review of advancements in green IoT for smart grids: paving the path to sustainability. Energy Rep.11, 5504–5531. doi: 10.1016/j.egyr.2024.05.021
30
Pliatsios A. Kotis K. Goumopoulos C. (2023). A systematic review on semantic interoperability in the IoE-enabled smart cities. Internet Things22:100754. doi: 10.1016/j.iot.2023.100754
31
Powell J. McCafferty-Leroux A. Waleed Hilal S. Gadsden A. (2024). Smart grids: A comprehensive survey of challenges, industry applications, and future trends. Energy Rep.11, 5760–5785. doi: 10.1016/j.egyr.2024.05.051
32
Rizi M. H. P. Seno S. A. H. (2022). A systematic review of technologies and solutions to improve security and privacy protection of citizens in the smart city. Internet Things20:100584. doi: 10.1016/j.iot.2022.100584
33
SaberiKamarposhti M. Kamyab H. Krishnan S. Yusuf M. Rezania S. Chelliapan S. et al . (2024). A comprehensive review of AI-enhanced smart grid integration for hydrogen energy: advances, challenges, and future prospects. Int. J. Hydrog. Energy67, 1009–1025. doi: 10.1016/j.ijhydene.2024.01.129
34
Sarker I. H. (2022). Smart City data science: towards data-driven smart cities with open research issues. Internet Things19:100528. doi: 10.1016/j.iot.2022.100528
35
Singh S. Sharma P. K. Yoon B. Shojafar M. Cho G. H. Ra I.-H. (2020). Convergence of blockchain and artificial intelligence in IoT network for the sustainable smart city. Sustain. Cities Soc.63:102364. doi: 10.1016/j.scs.2020.102364
36
Songhorabadi M. Rahimi M. MoghadamFarid A. M. (2023). Mostafa Haghi Kashani, fog computing approaches in IoT-enabled smart cities. J. Network Computer Appl.211:103557. doi: 10.1016/j.jnca.2022.103557
37
Tian Q. Zhou J. Hou J. Zhou Z. Liang Z. Sun M. et al . (2024). Building the future: smart concrete as a key element in next-generation construction. Constr. Build. Mater.429:136364. doi: 10.1016/j.conbuildmat.2024.136364
38
Wai K. P. Chia M. Y. Koo C. H. Huang Y. F. Chong W. C. (2022). Applications of deep learning in water quality management: A state-of-the-art review. J. Hydrol.613:128332. doi: 10.1016/j.jhydrol.2022.128332
39
Xie H. Ahmad T. Zhang D. Goh H. H. Wu T. (2024). Community-based virtual power plants’ technology and circular economy models in the energy sector: A techno-economy study. Renew. Sust. Energ. Rev.192:114189. doi: 10.1016/j.rser.2023.114189
40
Yazici İ. Shayea I. Din J. (2023). A survey of applications of artificial intelligence and machine learning in future mobile networks-enabled systems. Engin. Sci. Technol. Int. J.44:101455. doi: 10.1016/j.jestch.2023.101455
Summary
Keywords
deep learning, power load forecasting, smart energy, sustainable urban growth, LSTM, load distribution
Citation
Byeon H, AlGhamdi A, Keshta I, Soni M, Mekhmonov S and Singh G (2025) Deep learning and smart energy-based lightweight urban power load forecasting model for sustainable urban growth. Front. Sustain. Cities 6:1487109. doi: 10.3389/frsc.2024.1487109
Received
27 August 2024
Accepted
26 December 2024
Published
15 January 2025
Volume
6 - 2024
Edited by
Riaz Ullah Khan, University of Electronic Science and Technology of China, China
Reviewed by
Sivasubramanian Balasubramanian, New York University, United States
Pavan Patel, ITM Vocational University, India
Updates
Copyright
© 2025 Byeon, AlGhamdi, Keshta, Soni, Mekhmonov and Singh.
This is an open-access article distributed under the terms of the Creative Commons Attribution License (CC BY). The use, distribution or reproduction in other forums is permitted, provided the original author(s) and the copyright owner(s) are credited and that the original publication in this journal is cited, in accordance with accepted academic practice. No use, distribution or reproduction is permitted which does not comply with these terms.
*Correspondence: Haewon Byeon, bhwpuma@naver.com
Disclaimer
All claims expressed in this article are solely those of the authors and do not necessarily represent those of their affiliated organizations, or those of the publisher, the editors and the reviewers. Any product that may be evaluated in this article or claim that may be made by its manufacturer is not guaranteed or endorsed by the publisher.