 Temesgen Walelign Bishaw
 Gebrechiristos Nurye Dolebo2
 Ranavijai Bahadur Singh
- 1Department of Mobility and Infrastructure Planning and Management, College of Urban Development and Engineering, Ethiopian Civil Service University, Addis Ababa, Ethiopia
- 2Department of Urban Planning and Design, Faculty of Civil Engineering and Built Environment, Institute of Technology, Hawassa University, Hawassa, Ethiopia
Transport demand has been increasing in most third-world countries. However, poorly maintained facilities and poor planning exposed pedestrians to high-traffic accidents. This paper aims to evaluate pedestrian facilities using the pedestrian level of service to enhance pedestrian safety in Addis Ababa. Relevant data was collected through field measurement and direct observation from 13 purposively identified pedestrian sites across the Piyasa to Bole bridge and Megenagna to Torihayloch road corridors. Pedestrian level of service derivation considered capacity, traffic, comfort, safety, and security conditions and their sub-components. The weight of each criterion and sub-factor was decided according to the Saaty scale using the judgment of experts under the analytical hierarchical process. The result of the study strongly stipulates the presence of the problem of pedestrian facilities in Megenagna, Mexico, Urael Church, and Golagol which can affect the level of pedestrian safety. However, Denibel City, Legahare, Torhayloch, and National Theater sites have scored better Pedestrian level of service for the walking population. Finally, the study recommended the requirement of prior attention for the sites with very poor and poor pedestrian levels of service by the concerned sectors.
1 Introduction
Transportation and its infrastructure are fundamental to people’s daily lives and have developed into the basic aspect of modernity in recent decades (Miller et al., 2018). The demand for mobility has risen significantly worldwide since the end of the Second World War due to rapid urbanization (Soathong et al., 2019). However, rapid urbanization and economic growth significantly increase urban transport crises in many countries (WHO, 2013; Pucher, 2017). With the rapid growth of cities, the extent of road accidents has increased, posing a threat to the safety of citizens (Islam and Bhuiyan, 2024). Road traffic accidents are now a universal problem in the transportation system (Komol et al., 2021), resulting in an estimated 1.35 million deaths and 50 million injuries per year (WHO, 2018; UNECA, 2020). It is the leading cause of death next to TB and malaria for individuals aged 15 to 29 and the second leading cause of death for children aged 5 to 14 (WHO, 2018).
Unfortunately, among such deaths of accidents, pedestrians are becoming the most vulnerable road users (Bharathy and Karthigaipriya, 2017; Levulytė et al., 2017; Lulie, 2019; Golakiya et al., 2022). A lack of planning for pedestrian facilities is reported to create vehicle-pedestrian conflicts that hinder pedestrians from co-existing with vehicles in urban settings (Rosario and Fillone, 2018). Moreover, the inadequate pedestrian facilities for the increasing number of pedestrians contribute to increased pedestrian accident problems (Rosario and Fillone, 2018; Reta and Jote, 2022). That is why, providing pedestrian facilities is essential to ensure vulnerable road users’ safety, security, and comfort (Tinumbia et al., 2022). As a result, many countries constructed pedestrian facilities across roads to enhance the safe mobility of their pedestrian (Huber et al., 2013; Shafabakhsh and Mohammadi, 2014; Sulaksono and Nurhalima, 2018), to minimize pedestrian traffic problems and to promote sustainable transportation systems (Eboli et al., 2023). However, less attention given to pedestrian facilities significantly affects traffic problems (Ismael and Athab, 2023), and about 400,000 Pedestrian deaths are reported annually worldwide, with most (93%) of pedestrian deaths occurring in low-income countries (Tulu et al., 2015b; Haile, 2018). Therefore, Pedestrian facilities play a paramount role in enhancing pedestrian safety.
Urban transport in third-world countries has shown huge traffic growth and is responsible for high-traffic incidents (WHO, 2018; UNECA, 2020). Conflicts between pedestrians and vehicles are often sensitive to pedestrian traffic accident events (Sulaksono and Nurhalima, 2018). It was indicated that most pedestrian-related traffic events in developing countries occur in urban road locations where high fleets’ volume prevail (Kitosi, 2023). In these countries, pedestrians are treated as second-class residents compared to vehicle owners, and most facilities consider only the context of vehicular flow (Sulaksono and Nurhalima, 2018). Regardless of the shortage of adequately maintained transport facilities and traffic system inefficiency (Erga, 2019; Hussain et al., 2022), most of the urban road facilities are built without considering pedestrian road safety in mind (Tulu et al., 2013a; World Bank, 2020). Surprisingly, most pedestrian facilities (For example, sidewalks) serve as public areas with many social activities aside from serving pedestrian movement (Hidayat et al., 2022). As a result, pedestrian traffic problems are worse and resulted in the loss of millions of lives in developing countries (Tulu et al., 2015b; Lulie, 2019; Soathong et al., 2019; Nadrian et al., 2020; Sosik-Filipiak and Osypchuk, 2023). Thus, pedestrian safety is a prime concern in designing and managing facilities to support pedestrian-friendly environments.
In Ethiopia, pedestrians are more vulnerable to traffic accidents than other modes of transport in urban areas (Tulu et al., 2015a; Alemgena et al., 2018; UNECA, 2020; World Bank, 2020). However, Pedestrians are frequently neglected by policymakers and urban planners (Tulu et al., 2013b). Still, most of the urban road networks in the country are built by neglecting the safety of the walking population. This problem is aggravated in the CBDs of urban areas, where facilities are insufficient and increasingly occupied by non-pedestrian activities (Tulu et al., 2013a). Thus, the development of urban spaces lacks consideration of pedestrian facilities for the walking communities in stipulating the safe flow of pedestrians.
In Addis Ababa, walking is the main modal split at the expense of the city’s rapid car growth (Mohapatra, 2015; AACTMA, 2021). The rate of growth of mobility demand (10%) and interest in people’s car ownership (13.5%) is very high compared to the city’s annual road network expansion rate (4.1%; Asres, 2018). Thus, the city’s road network coverage fails to accommodate the increasing transport demand and vehicle fleets (Asres, 2018; Erga, 2019). This resulted in an imbalance between the growing demand for transport and transport services, creating pedestrian insecurity (Taddesse, 2011; Zewude, 2015; Erga, 2019). As the report of Addis Ababa City Road Transport Bureau (AARTB) (2016) cited in Haile (2018) pedestrian safety problems, high accident rates, and very limited pedestrian facilities were observed in the city (Haile, 2018). It was reported that the city takes 10% and 26% of the country’s traffic-based deaths and injuries, respectively (Vision Zero for Youth, 2021; AACTMA, 2022).
Pedestrian accidents took the majority of road accidents (83%) in the city (UNECA, 2020; AACTMA, 2021). Recent evidence shows that most roads and associated facilities are designed to promote mobility while discouraging pedestrian safety. According to the Group of World Bank (2022) report in Addis Ababa, sidewalk and other road facilities are increasingly obstructed by non-pedestrian activities (AACTMA, 2022; World Bank, 2022). Similarly, problems with pedestrian facilities, such as the inconvenience of the facility, large spacing between crossing facilities, or insufficiency to satisfy crossing demand, safety and security highly debated the walking modality in the city (Haile, 2018; Gebresenbet and Aliyu, 2019). As a result, research that evaluates pedestrian facilities’ performances is important to improve the challenges of pedestrian safety problems.
Pedestrian infrastructures are critical to the sustainable transportation system (Bhaduri et al., 2019; Reta and Jote, 2022). One of these infrastructures is facilities for pedestrians. In a city layout, one critical element is all complete buildings provided for pedestrians to provide smoothness, security, comfort, and safety for pedestrians (Sun et al., 2021). Pedestrian facilities are all infrastructure and facilities provided for pedestrians to increase the smoothness, security, comfort, and safety of their users. According to Tinumbia et al. (2022), Pedestrian facilities are divided into (i) Main facilities that hold pedestrian paths, such as sidewalks, walkways, pedestrian crossings (zebra crossings, bridges, tunnels), and pathways; (ii) Supporting facilities that hold all supporting facilities like signs, markings, speed controllers, information boards, lighting lamps, fences, shades, benches, bins, bus stops, drainage, bollards (Tinumbia et al., 2022). They are essential to ensure vulnerable road users’ safety, security, and comfort.
The quality or performance of pedestrian facilities can be evaluated to improve the problem of pedestrian affairs. Pedestrian level of service (PLOS) is the most commonly used technique to evaluate the quality, standard, or performance of service offered by pedestrian facilities (Sulaksono and Nurhalima, 2018; Frazila et al., 2019; Nag and Goswami, 2019; Bhuiya et al., 2020; Nag et al., 2020; Paul et al., 2024). The HCM, Trip Quality, Gainesville, Australian, and analytic hierarchy process (AHP) methods are from the several methods developed for deriving pedestrian level of service in evaluating pedestrian facilities.
1. The HCM method explains that the main performance to be measured in assessing PLOS is the space available for walking; in other words, HCM primarily considers the capacity of pedestrian facilities. The parameters considered in the assessment were pedestrian space, average velocity, average flow rate, and volume-capacity ratio, with a level of service ranging from A to F (HCM, 2010).
2. The Trip Quality method used nine qualitative PLOS evaluation steps to analyze pedestrians’ pleasures, safety, and comfort when traveling in a pedestrian facility (Jaskiewicz, 2000). The clarity of street boundaries, the complexity of path networks, building articulation, the complexity of public places, the presence of shelters, tents, and roof lines, the existence of buffer zones, the presence of trees, the accessibility of natural characteristics, and the condition of the sidewalk were the criteria used in the trip quality method. A score of 1 to 5 is applied to each parameter assessed, with a score of 5 reflecting excellent conditions and 1 reflecting poor conditions. The sum and average of each parameter score are used to get the PLOS value from A to F (Jaskiewicz, 2000).
3. The Gainesville method was developed and applied in the city of Gainesville (Florida) as part of mobility plans for congestion management (Dixon, 1996). The basic criteria for PLOS assessment were the type of pedestrian facility, the pedestrians and vehicle incidents, supporting facilities to accommodate the movement of pedestrians, vehicular level of service, maintenance, maintenance, and demand for multimodal transport. The total score obtained from the sum of each category score determines the PLOS value with a score of 1 to 21 or A–F (Dixon, 1996).
4. In the Australian method PLOS assessment is based on three factors, namely physical characteristics, location factor, and user factor. The condition of the pedestrian facility is explained by a PLOS scale ranging from ideal pedestrian condition (A) to unsuitable condition (E) (Gallin, 2001).
5. Multi-criteria decision-making (MCDM) can be applied in evaluating transport facilities, including pedestrian facilities (Zainol et al., 2014; Bhuiya et al., 2020; Henke et al., 2020). The analytic hierarchy process (AHP) is one of the MCDM methods to evaluate road transport facilities (Shafabakhsh and Mohammadi, 2014; Baric and Zeljko, 2021). It employs a pairwise comparison procedure to arrive at a scale of preferences among sets of alternatives (Alonso and Lamata, 2006; Saaty and Tran, 2007). In the AHP method, criteria and sub-criteria weights or relative importance are defined and ranked using the Saaty scale of pairwise comparison (Barić et al., 2016). The AHP method is preferable to the above four methods due to its inclusive advantage of microscopic elements in facility evaluation. Hence, this study follows the AHP method for evaluating pedestrian facilities.
A few researches were found that targeted pedestrian facility evaluation in Addis Ababa. For example, Fikirtework (2020) examines the pedestrian level of service in the periphery of Addis Ababa using ordered Logit regression. However, PLOS scaling was derived from qualitative analysis of questionnaire responses only and did not apply AHP to integrate different factors to determine PLOS. Lulie (2019) estimated the level of service for walkway rehabilitation projects in Addis Ababa. However, his study employed the HCM method, which failed to investigate pedestrians’ security, comfort, and safety concerns and could not fit into the context of developing countries. Erga (2019) also examines Pedestrian facilities using HCM standards. However, it was not for pedestrian safety but for vehicular congestion and its impact on the road corridor. Furthermore, Haile (2018) examines pedestrian facilities by pedestrian level of service using HCM standards. However, its focus was only on pedestrian overpass facilities, which ignored sidewalk facilities that too many pedestrians usually used.
The review of the above studies indicates that pedestrian safety studies related to the evaluation of the performance of pedestrian facilities in Addis Ababa city in the case of the Piyasa to Bole bridge and Megenagna to Torihayloch road corridors are not well investigated using appropriate methods and inclusive parameters. Therefore, this study is proposed to fill the above-listed analysis gaps by integrating the different factors using the AHP-based PLOS estimation technique and these crucial issues instigated the researcher to answer the questions: (1) What magnitude of influences do the factors have in determining PLOS? (2) What is the performance of pedestrian facilities in the sites? (3) Which sites should have to get special prioritizing to enhance pedestrian safety? This study has practical contributions in ensuring sustainable urban mobility as it fills the existing knowledge gap in evaluating pedestrian facilities and enhances the direction of looking at improving pedestrian road safety in the city of Addis Ababa.
This study is organized into five main sections. The first section contains an introduction that covers the background of pedestrian events, the different methods used to evaluate pedestrian facilities, the research gaps, and the objective and significance of the study. The second section covers the methodological section of the study. The third section assesses the main results and discussion of the study, and the last part presents the conclusion, recommendations, and limitations of the study.
2 Materials and methods
2.1 Description of the study area
Geographically, the city is located between 8049′55.929″–90 5′53.853″ North latitude and 38019.547″–380 38′16.555″ East longitudes (see Figure 1). It has an average elevation of 2,500 m above mean sea level and occupies a total area of 540 km2. It is Ethiopia’s capital city, the headquarters of the African Union and other global organizations. The Group of World Bank (2022) stated that Addis Ababa is home to 25% of the urban population in Ethiopia. The population is estimated to be 4.8 million, growing at a 4.39% annual rate (World Bank, 2022). The city holds more than 60% of the country’s fleet and has a total of 2,561 km of asphalt road, 2,030 km of gravel road, and 1,850 km of cobblestone road, as well as over 621 km of pedestrian ways (AACTMA, 2021). The road corridors that extend from Bole Bridge to Mesqel Square and Torhayloch to Megenagna are selected for this study. These road corridors are chosen based on black spot concentrations and high pedestrian traffic flow, which the Addis Ababa Traffic Management Agency selects in a 4-year non-motorized transport improvement strategy.
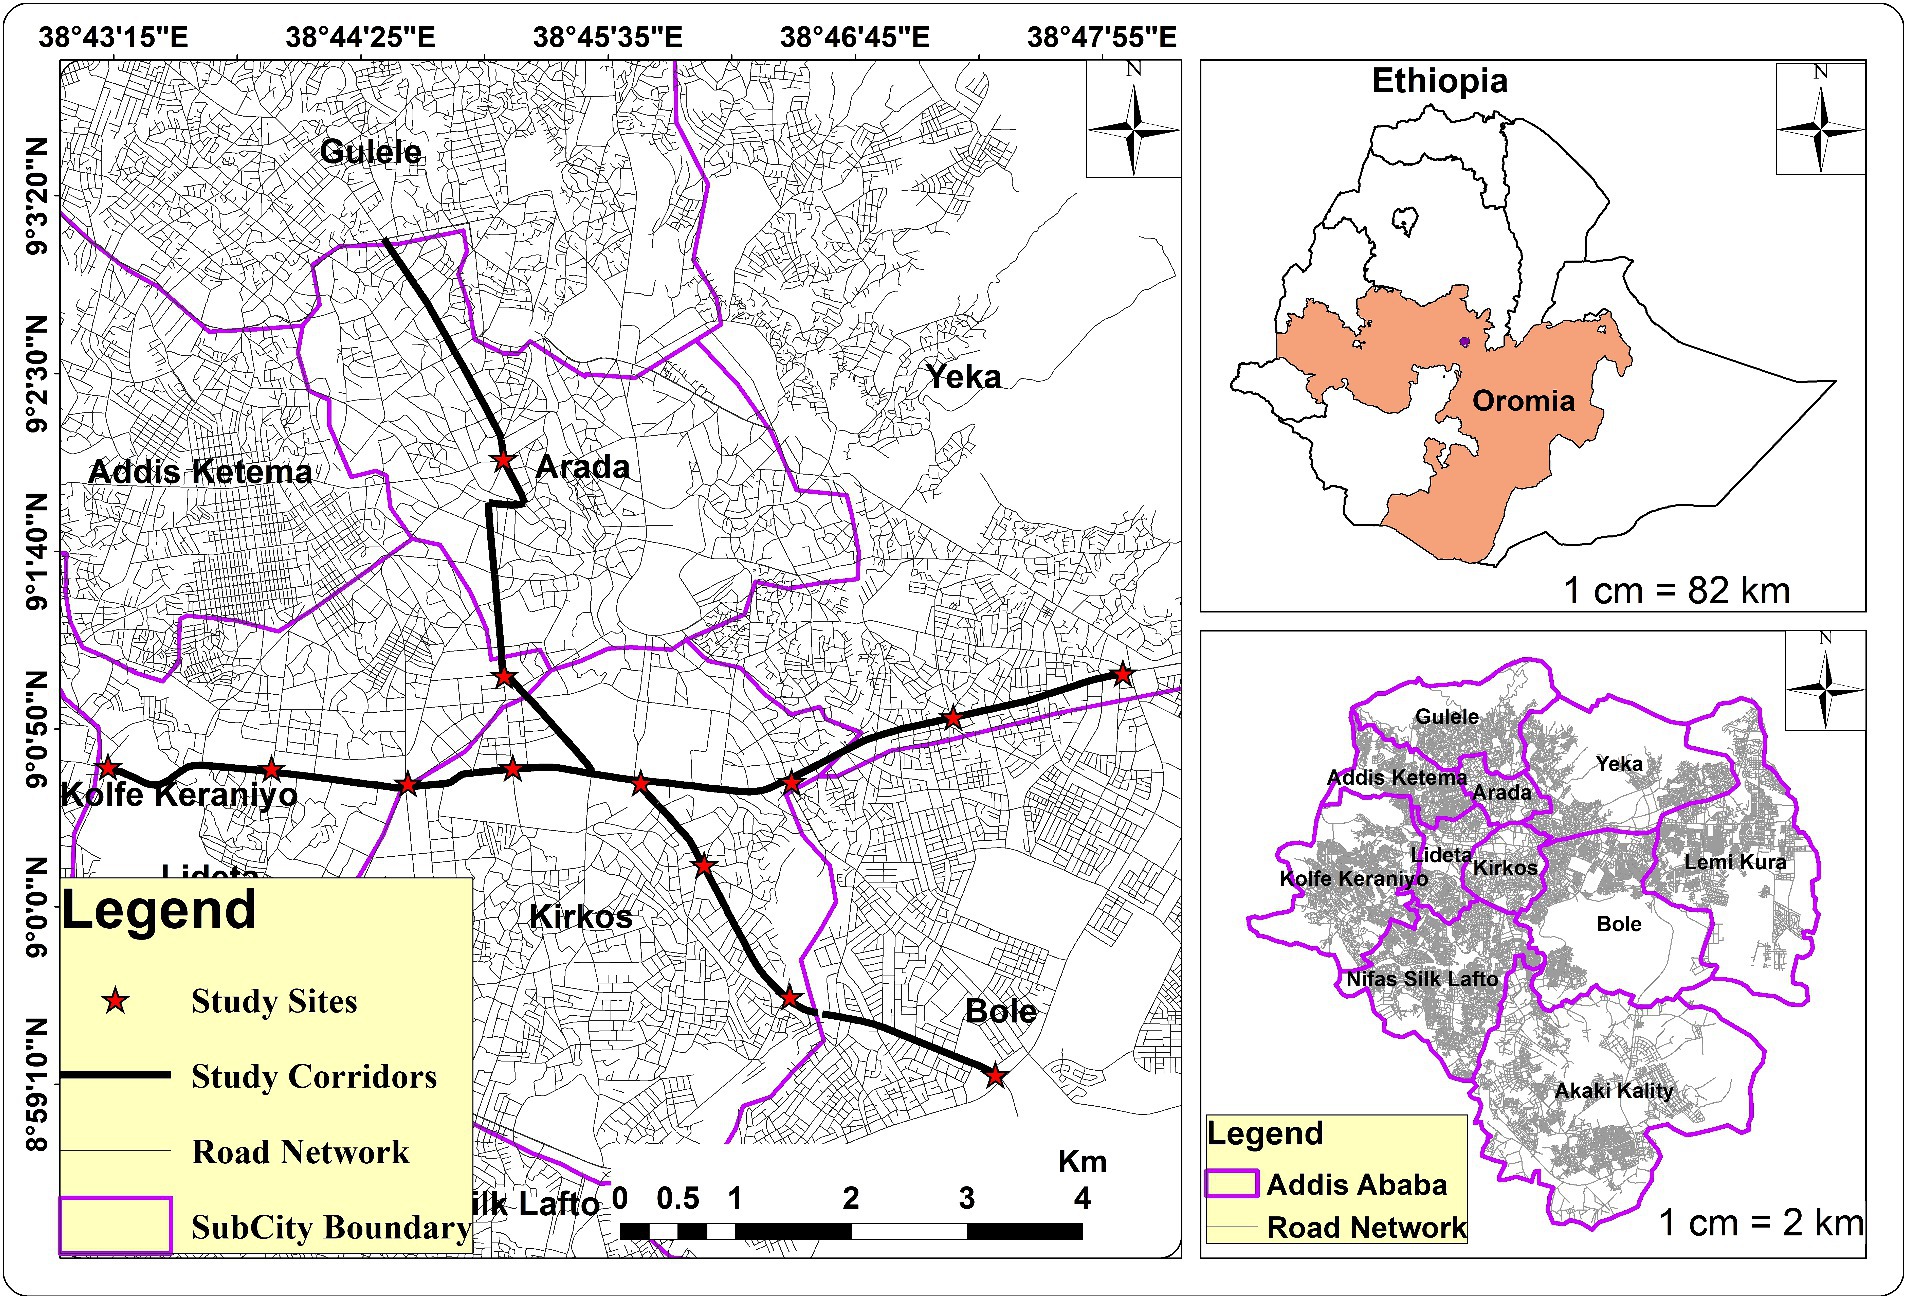
Figure 1. Location map of the study area.
2.2 Tools and software
In the data collection stage, a video camera, meter, and GPS were used to harvest relevant data for the study. Google Earth and ArcGIS software were used to visualize the magnitude of PLOS in spatial form. Besides, Microsoft Excel 2016 software was employed to calculate statistical results related to capacity and traffic-based data (see Table 1).
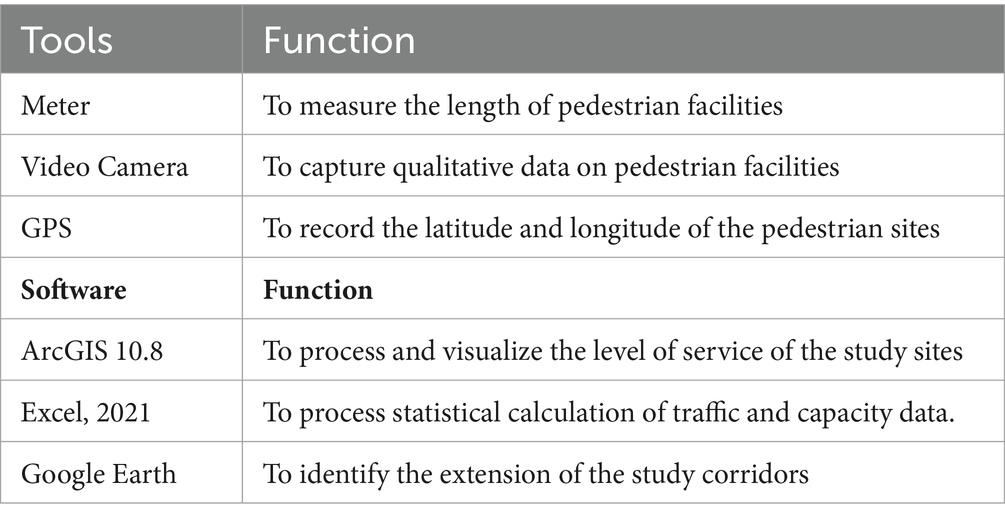
Table 1. Software and tools.
2.3 Research methods and data collection technique
A mixed (qualitative and quantitative) research approach is used due to its flexibility, which is well suited to support rigorous examinations of promising ideas. A descriptive research design is used to evaluate the existing nature of pedestrian facilities based on standards. A non-probabilistic sampling technique was used to select an appropriate and representative sample from all road corridors. Accordingly, two road corridors extending from Bole Bridge to Piassa and Torhayloch to Megenagna are chosen purposively. The selected road corridors are found within the central business district of the city of Addis Ababa and have a large volume of pedestrian population as well as a large size of traffic-based problems as compared to the other road corridors. Across these corridors, 13 sites are taken using purposive sampling to collect the required data that is used to evaluate the performance of pedestrian facilities.
This study used primary data sources, mainly observation and field surveys, to determine the existing pedestrian facility standards. The pedestrian data was counted manually during the peak hours every 15 min for each site from 7:00 a.m.–8:00 a.m. and 5:30 p.m.–6:30 p.m. To avoid the impact of bad weather conditions, pedestrian data was taken during the first 6 days (Monday to Saturday) of January 2023 (08 January 2023–13 January 2023). Thus, each of the selected sites was observed six times during the peak hour, both in the morning and in the afternoon. Pedestrian data was collected from the sites within 18 to 35 m horizontal distance from the origin of each site by considering the impact of nearby junctions and visibility to count pedestrian movement. Qualitative data on safety, security, and comfort factors were collected through observation and guidance of experts. Besides, quantitative-based data on safety, security, and comfort factors were collected through counting and direct measurement in the field. Secondary data gathered from websites and official statistical databases were used to support the result of the study.
2.4 Criterion for evaluating pedestrian facilities using PLOS
Level of Service (LOS) is a term used to describe the suitability of facilities for a mode of travel (Singh and Jain, 2011; Sulaksono and Nurhalima, 2018; Frazila et al., 2019; Bhuiya et al., 2020; Ahmed et al., 2021; Paul et al., 2024), and is mainly used to determine whether the facilities are enough for pedestrians to have a better trip across their flow (Singh and Jain, 2011; Kituku, 2017; Nag et al., 2020). The level of service (LOS) method is used for qualitative measurement and evaluation of a service to its user (Ujjwal and Bandyopadhyaya, 2021). According to Raad and Burke (2018) and Frazila et al. (2019), the level of service for pedestrians is strongly influenced by the capacity, comfort, safety, security, and traffic conditions of facilities. Therefore, the above-listed criteria are adapted and adopted to this study to evaluate pedestrian facilities, as shown in Table 2.
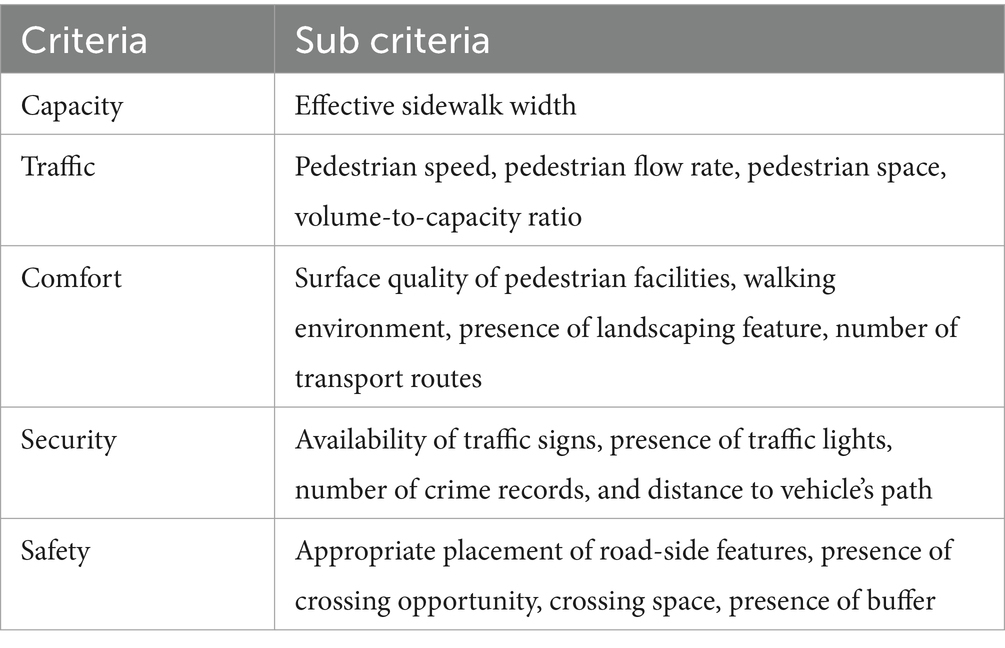
Table 2. Factors for evaluating facilities [Adapted from Frazila et al., 2019].
2.5 Capacity and traffic data measurement and standardization
2.5.1 Effective sidewalk width
It is the portion of a sidewalk that pedestrians can use effectively (HCM, 2010). The effective sidewalk width (WE) was computed by subtracting the total sidewalk width (WT) from the sum of fixed object effective widths (WO) and linear feature shy distances at a given point along the facility (Sahani and Bhuyan, 2015). According to Bhuiya et al. (2020), as sidewalk path width increases, there will be more space for pedestrian flow, avoiding congestion and better accessibility for sidewalk users to move freely (Bhuiya et al., 2020). Based on the physical survey and the literature recommendation, a value range of 0–1.5, 1.5–2, 2–2.5, 2.5–3, and 3 meters is given for 1, 2, 3, 4, and 5 scales, respectively.
2.5.2 Pedestrian flow rate
Pedestrian flow rate (VP) is the number of pedestrians passing a point per unit of time, expressed as pedestrians per 15 min or minute (HCM, 2010). Dividing the peak 15-min count (V15) by the effective sidewalk width is used to compute the pedestrian unit flow rate in pedestrians/min/meter (Sahani and Bhuyan, 2015; Kituku, 2017).
2.5.3 Average pedestrian space
Pedestrian space is a more practical unit for evaluating pedestrian facilities and is defined as the average area for each pedestrian in a facility (Sahani and Bhuyan, 2015) expressed in terms of square meters per pedestrian (m2/ped). The average area occupied by the pedestrian can be calculated by dividing the area of the adequate sidewalk by the maximum pedestrian volume (HCM, 2010; Kituku, 2017; Banerjee et al., 2018).
Where: Ap is the average pedestrian space, and AWE is the area of adequate sidewalk.
2.5.4 Pedestrian speed
According to Mohammed and Mashros (2015), pedestrian speed has a strong inverse relation with pedestrian density. As the density and volume of pedestrians increase, pedestrian speed decreases, and the space occupied by each pedestrian decreases (Singh and Jain, 2011). Thus, the degree of mobility of each pedestrian and the mean speed of the pedestrian flow decreases (Mathew, 2014). Unlike Mathew, Al-Mukaram and Musa (2020) explain pedestrian speed as the product of peak hour pedestrian flow rate and average pedestrian space.
2.5.5 Volume to capacity ratio
It was computed by dividing the demand (peak flow rate) by 75 ped/min/m as recommended by Sahani and Bhuyan (2015) and HCM (2010). The highway capacity manual advised to compute the v/c ratio by assuming 75ped/min/m for capacity analysis of sidewalks and walkways when local data is unavailable.
After the computation of the capacity-related data, data standardizing was given to each component. The classes given are based on the HCM procedure with a little modification as presented in Table 3.
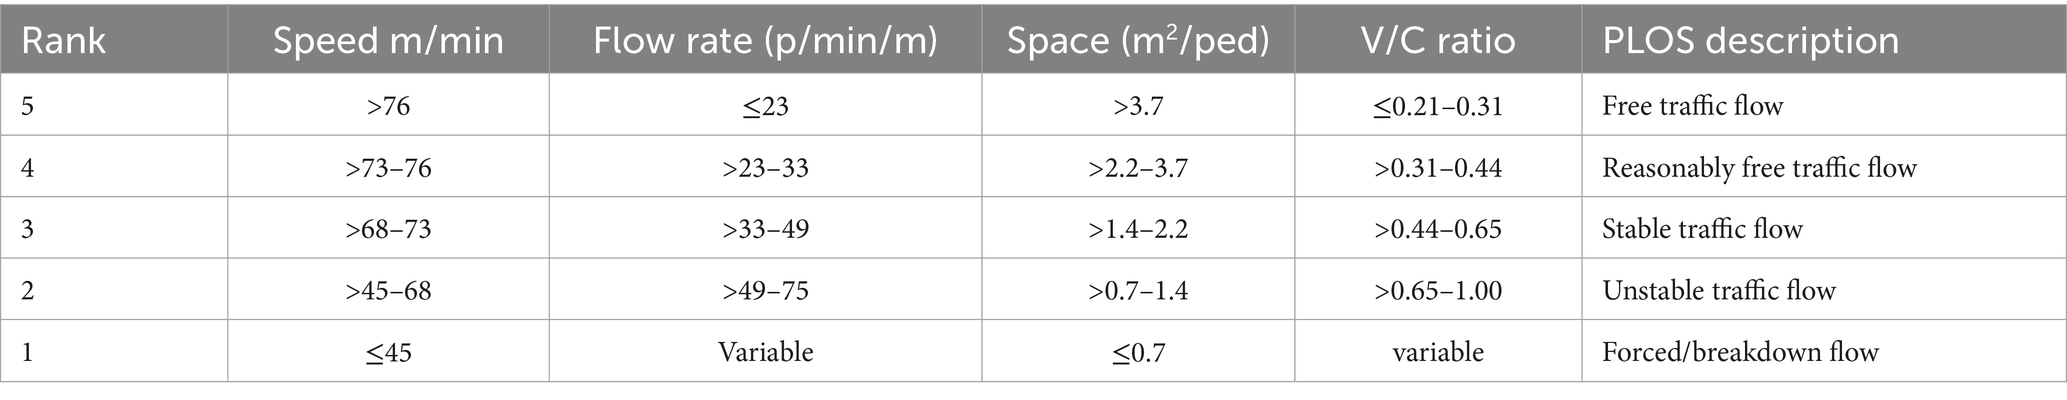
Table 3. Summary of pedestrian traffic factor standards [Adapted from HCM (2010)].
2.6 Comfort, security, and safety data standardization
According to Banerjee et al. (2018), Frazila et al. (2019), and Bhuiya et al. (2020), the comfort of facilities enhances the performance of facilities in improving pedestrian safety. Besides, Bivina et al. (2018) approved the importance of the security of facilities for better pedestrian safety. Bhuiya et al. (2020) also investigated the role of safety-related factors along with the comfort of facilities. Thus, the researcher critically observed and surveyed all the selected sites and standardized the sub-factors of each criterion into five classes as presented in Table 4.
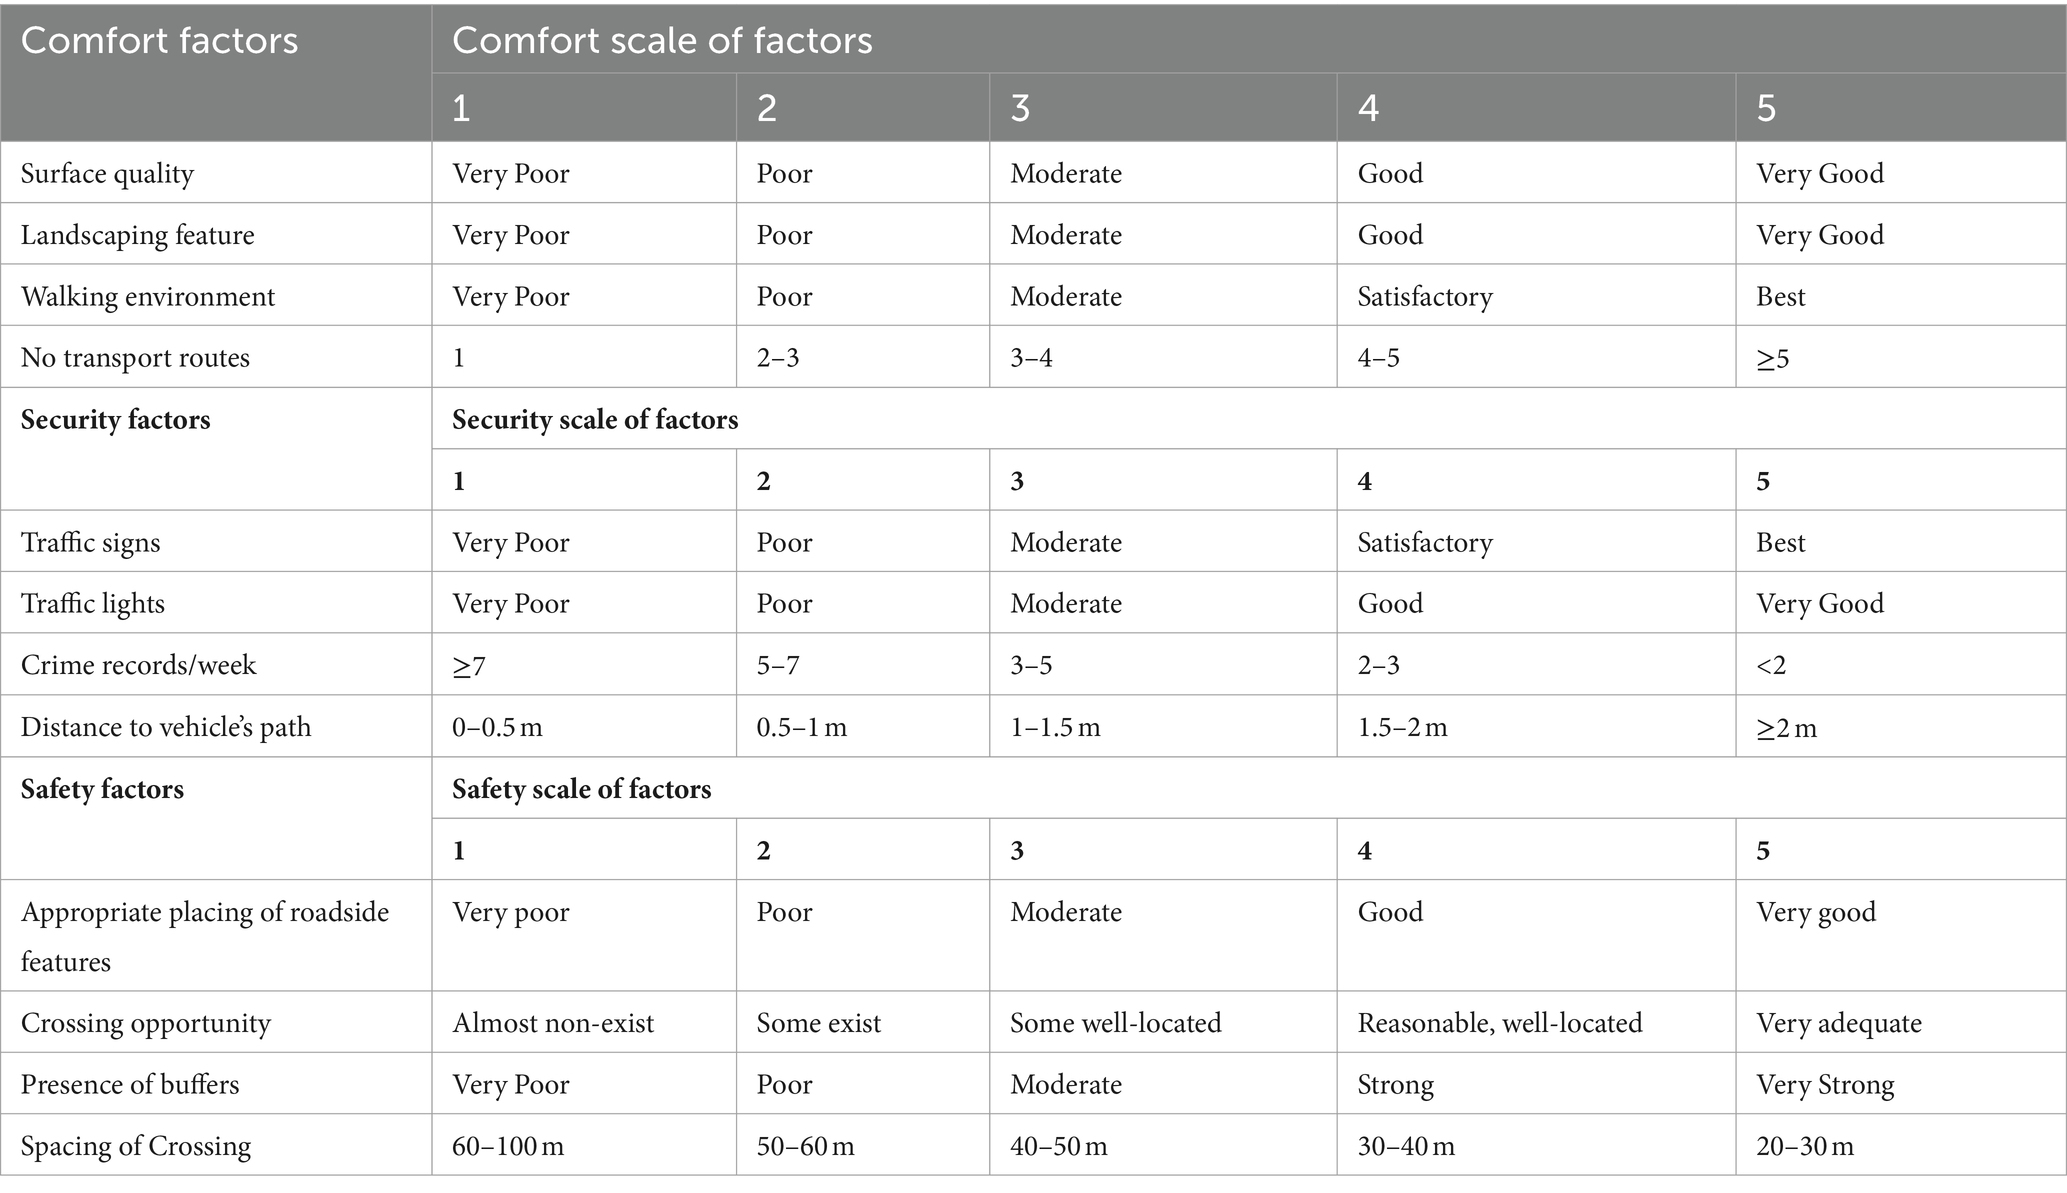
Table 4. Comfort, security, and safety scales [Adapted from Jaskiewicz (2000), Frazila et al. (2019), and Bhuiya et al. (2020)].
2.6.1 Comfort of pedestrian facilities
2.6.1.1 Surface quality
A crack-free, well-textured surface without undulation enhances the level of pedestrian walking environment (Banerjee et al., 2018). Through the guidance of road facility expert and observation, the rating values of 1, 2, 3, and 5 were given for very poor (A1), poor (A2), moderate (A3), good (A4), and very good (A5) quality of surfaces (see Figure 2).
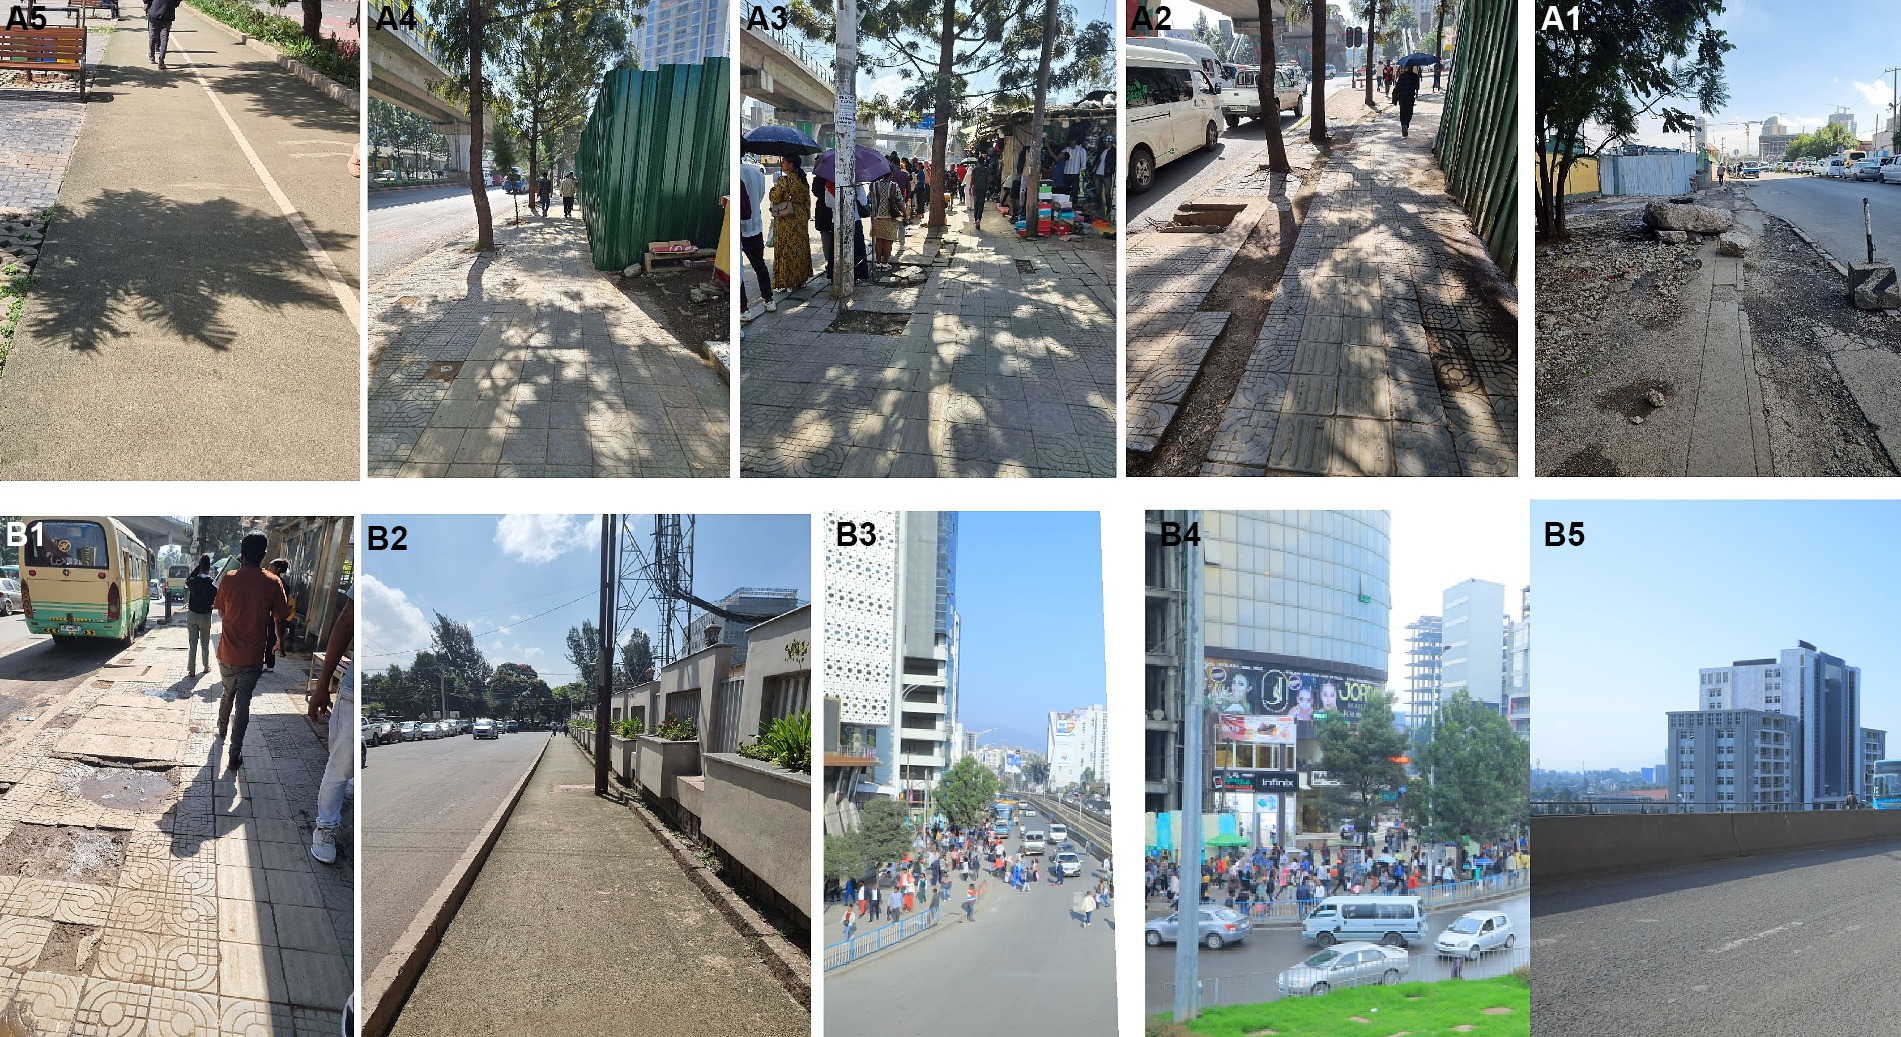
Figure 2. (A1–A5, B1–B5) Sample photos to show surface quality and buffer condition.
2.6.1.2 Landscaping features
In this research, landscaping features indicate the existence of different landscaping elements placed along the walking path, like benches and another attractive feature, as recommended by Banerjee et al. (2018). Based on the result of the expert’s observation, the value of this factor was indexed as 1, 2, 3, 4, and 5 for very poor, poor, moderate, good, and very good scales of landscapes.
2.6.1.3 Walking environment
A neat and clean footpath with an esthetically pleasing look encourages people to use the footpath. Besides, the existence of trees or other plants keeps the temperature of the atmosphere of the footpath at a pleasant level (Bhuiya et al., 2020). According to the guidance of the expert, points 1, 2, 3, 4, and 5 have been assigned to a very poor, poor, moderate, satisfactory, and highly satisfactory walking environment.
2.6.1.4 Number of transport routes
According to Frazila et al. (2019), as the number of transport routes at the pedestrian sites increases, the density of the population will be shared, and the free flow of the walking population will be enhanced across the pedestrian facilities. By counting the number of routes, points 1, 2, 3, 4, and 5 were given for 1, 2–3, 3–4, 4–5, and five and above transport routes.
2.6.2 Security of pedestrian facilities
2.6.2.1 Traffic signs and lights
The availability of street lights and signs is necessary to ease the movement of pedestrians and ensure safety for them from being mugged or victims of other crimes at night (Bhuiya et al., 2020). In this study, the availability of street lights and signs has been evaluated based on the frequency of occurrence in the pedestrian environment. Accordingly, very poor, poor, moderate, satisfactory/good, best scales were given as these facilities did not exist, some exist, some exist but not at a reasonable distance, exist but still require further and fully exist in order 1, 2, 3, 4, and 5.
2.6.2.2 Crime records
Traffic signs and light criminal records like murder, theft, and other illegal activities increase stress on pedestrian during their walking (Frazila et al., 2019). By considering the report forwarded from the Addis Ababa city police commission, crime recorded in the week has been taken as one element and class values of 1, 2, 3, 4, and 5 were given for those crime record values of 7 and above, 5–7, 3–5, 2–3 and less than 2.
2.6.2.3 Distance to vehicle’s path
With the increase in distance from vehicular way, the possibility of a conflict between vehicles and pedestrians will increase, and safety will decrease (Singh and Jain, 2011; Bhuiya et al., 2020). In this study, the distance between the pedestrian path and the vehicle’s path was considered as the distance from the vehicular path. It has been indexed as less than 0.5 m, 0.5–1 m, 1–0.5 m, 1.5–2 m, and greater than 2 m distances for points 1, 2, 3, 4 and 5, respectively.
2.6.3 Safety of pedestrian facilities
2.6.3.1 Appropriate placing of roadside features
Appropriate location of roadside features like benches, trees, birdbaths, etc., on the walking facilities are necessary so that pedestrians can move on the walking facilities without receiving hindrances on their way (Bhuiya et al., 2020). Based on the judgment of the expert, the value of this factor has been indexed as points 1,2,3,4 and 5 for very poor, poor, moderate, good, and very good, respectively.
2.6.3.2 Crossing opportunities
In this study, the availability of crossing opportunities has been referred to by the existence of foot-over bridges, zebra crossings, median refugees, and guard or police control crossings for pedestrians. Points 1, 2, 3, 4, and 5 have been allocated by the evaluation of the expert for the following situations: almost nonexistent, some provided but poorly located, some provided and are reasonably well located but more are needed, adequate crossing facilities, reasonably well located and dedicated pedestrian crossing facilities are provided at sufficient frequency in order.
2.6.3.3 Presence of buffers
Presence of Buffers like fences, bollards, and others are used to separate pedestrians from vehicular traffic for their safety (Bhuiya et al., 2020). According to the opinion of experts, points 1,2,3,4 and 5 have been assigned to buffers providing very poor (B1), poor (B2), moderate (B3), satisfactory/strong (B4), and highly satisfactory/very strong (B5) protection by buffers (see Figure 2).
2.6.3.4 Spacing of crossing opportunities
As crossing space increases, pedestrians are forced to cross the vehicle’s path illegally, and there is increased conflict between pedestrians and vehicles. Accordingly, values 5, 4, 3, 2, and 1 have been assigned for below 30 m, 30–40 m, 40–50 m, 50–60, and above 60 m distance between consecutive crossing facilities, respectively.
2.7 Derivation of pedestrian level of service using AHP
Analytical hierarchy process (AHP) is a multi-objective, multi-criteria decision-making approach that employs a pairwise comparison procedure to arrive at a scale of preferences among sets of alternatives (Saaty, 1995, 2008; Alonso and Lamata, 2006; Saaty and Tran, 2007; Barić et al., 2016; Li et al., 2021). It is one of the MCDM methods to evaluate road transport facilities, including pedestrian facilities (Shafabakhsh and Mohammadi, 2014; Baric and Zeljko, 2021). The AHP method is used in this study to derivate the pedestrian level of service (PLOS) by integrating multi-factors from the perspective of pedestrian facilities. In determining the weights of preferences ratio scales, the most well-known—Saaty-scale is used based on the recommendation of Saaty and Tran (2007) and Baric and Zeljko (2021) as presented in Table 5.

Table 5. Pairwise comparison scales.
The alternatives denoted by {A1, A2… An} (n is the number of compare alternatives), their current weights by {w1, w2… wn}, then the matrix of the ratios of all weights is computed by equation 5.
The matrix of pairwise comparisons A = [aij] represents the intensities of the expert’s preference between individual pairs of alternatives (A i vs. Aj, for all i, j = 1, 2… n). They are chosen from a given scale. Given n alternatives {A1, A2, …, An}, a decision maker compares pairs of alternatives for all the possible pairs, and a comparison matrix A is obtained, where the element aij shows the preference weight of Ai obtained by comparison with Aj as follows.
Where: The aij elements estimate the ratios wi/wj where w is the vector of current weights.
The consistency index (CI) that indicates the deviation or degree of consistency was calculated by considering the number of sub-factors (n) and the corresponding Eigenvectors (λmax) value using equation 7.
The CI was compared with the corresponding random index (RI; taken from Table 6) for better judgment using consistency ratio (CR) according to equation 8.
Finally, a weighted linear combination was employed to decide the PLOS of the study area. All main and sub-factors were overlaid as per the formula of Frazila et al. (2019) using equation 9.

Table 6. Random index value (Alonso and Lamata, 2006; Saaty, 2008).
Where: PLOS is the Pedestrian level of service, Ai is the weight value for main criteria-I, Bij is the performance level of indicator-j, which constructed sub-component criteria-I, and Cij is the weight value of indicator-j, which constructs sub-component criteria-i.
Finally, level of service (LOS) as a quantitative stratification of service quality was classified into five classes by adapting and adopting the class of Jaskiewicz (2000), Frazila et al. (2019), and Bhuiya et al. (2020) from A to E. The quantitative range <2.2, 2.2–2.7, 2.8–3.3, 3.4–3.9, and 4–5 represent very poor/unpleasant (E), poor/uncomfortable (D), moderate/acceptable (C), very good/comfortable (B) and excellent/very pleasant (A) rates orderly as proposed by Jaskiewicz (2000). The overall procedure followed in this study is generalized using the flow diagram presented in Figure 3.
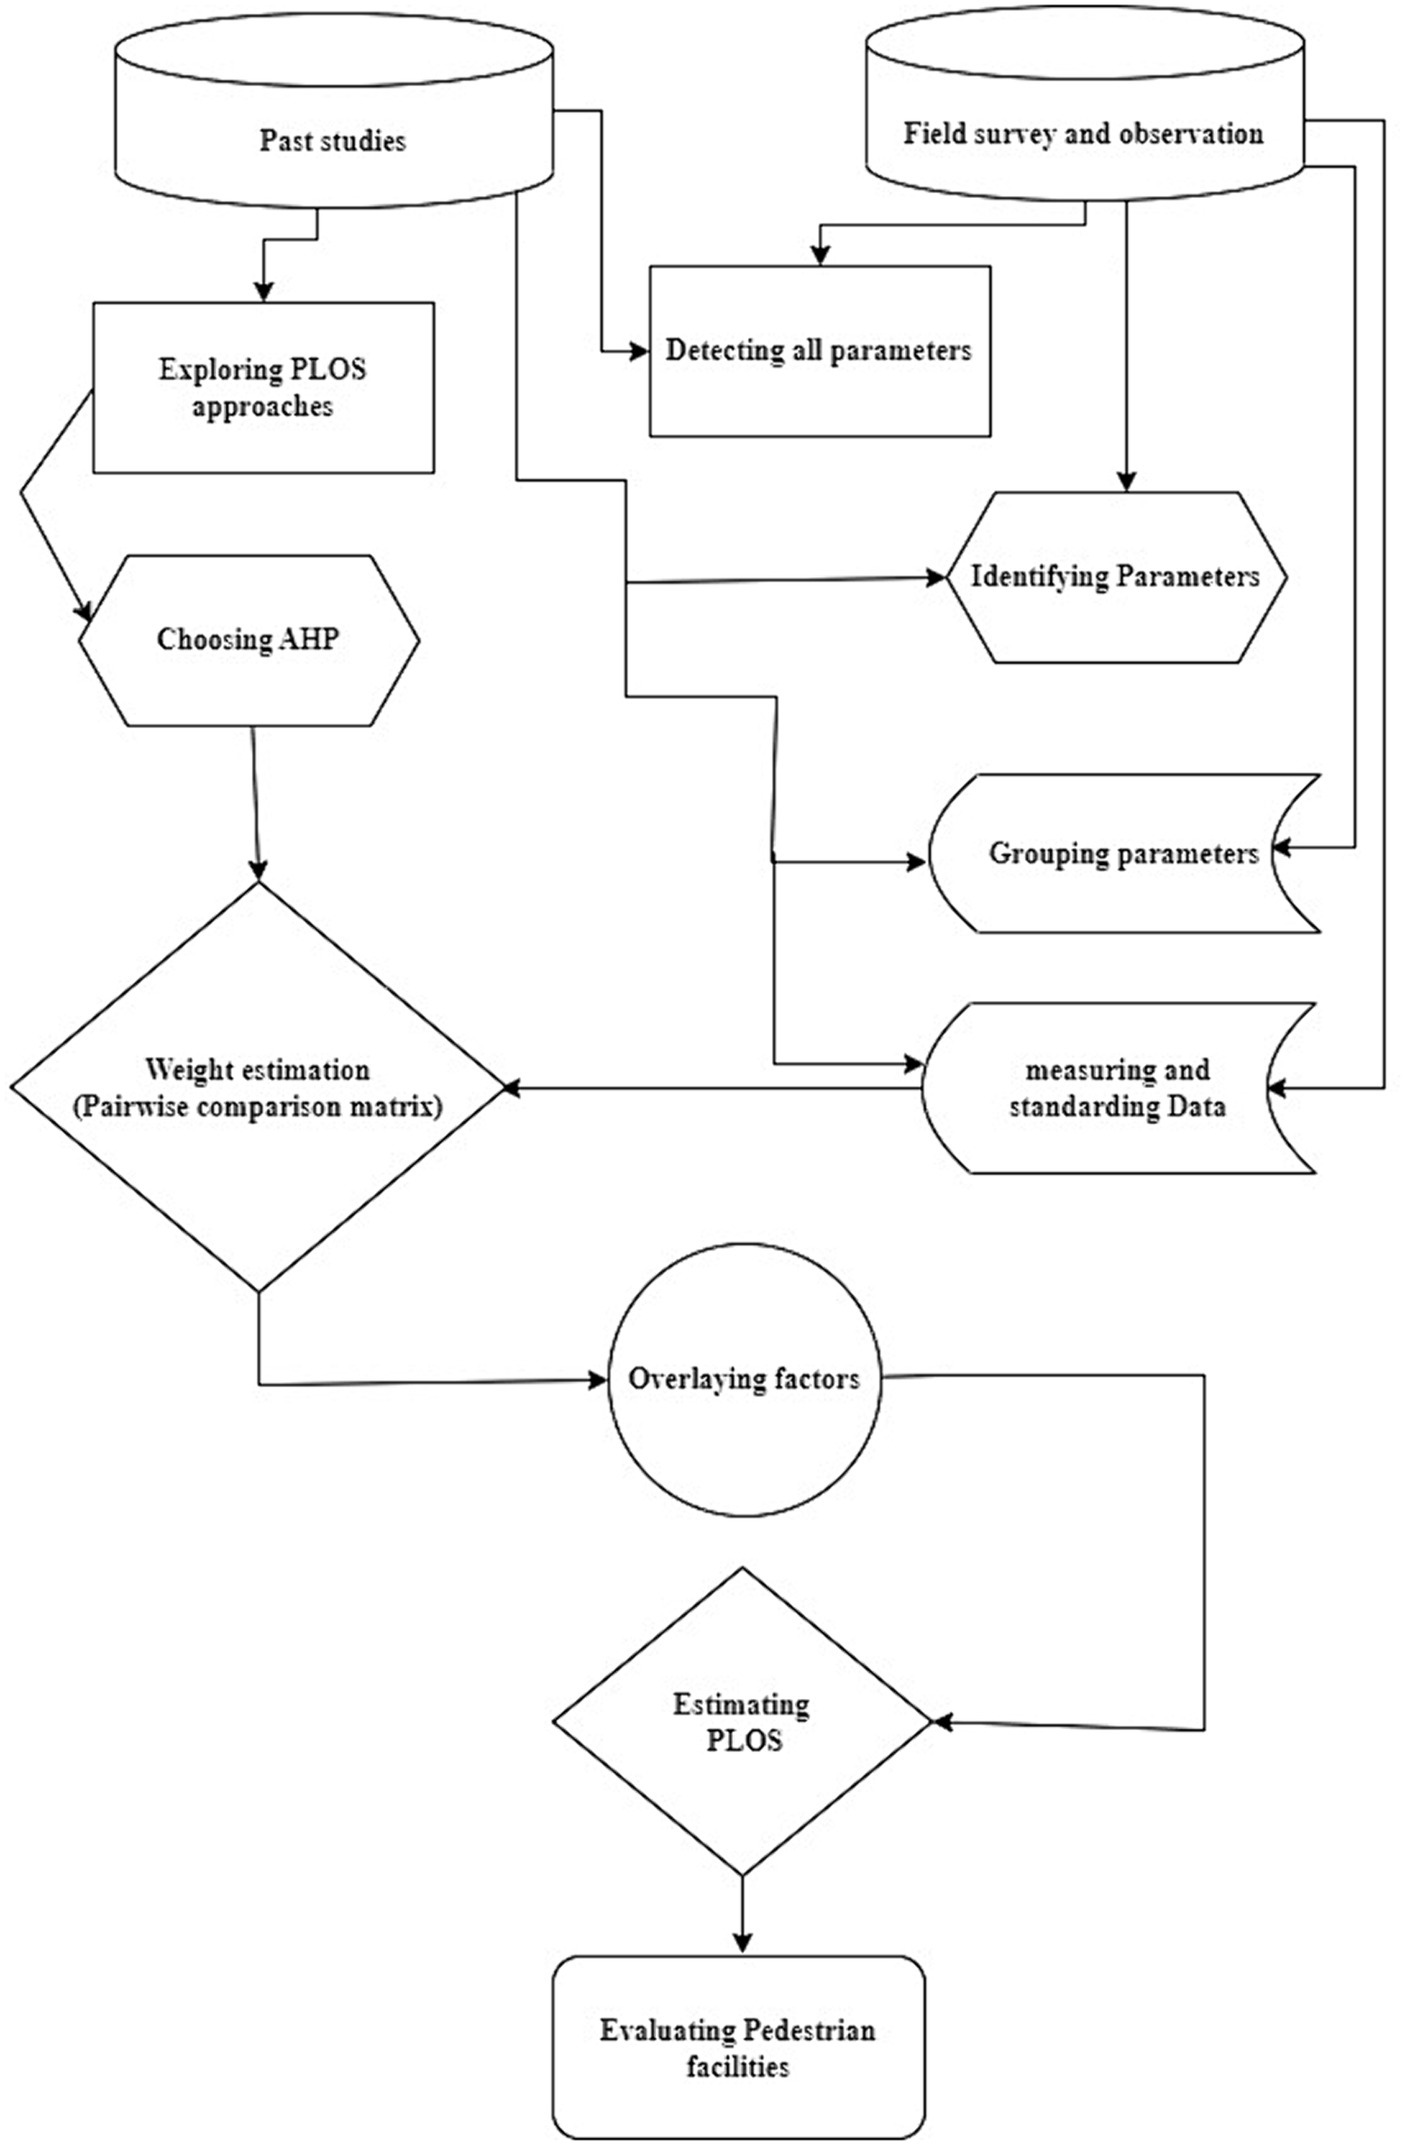
Figure 3. Methodological flow chart of the study.
3 Results and discussion
3.1 Capacity, traffic, safety, security, and comfort state of facilities
The portion of a sidewalk used effectively by pedestrians was calculated by reducing the portion not used by pedestrians from the total sidewalk width. Based on the survey result, a total of 36 m effective sidewalk width with a mean of 2.8 m, 332.5 m sidewalk length, and 902.5 m2 effective sidewalk area was measured in the field for this study. The broadest effective sidewalk width belongs to the Torhayloch site (3.8 m) and Piyasa (3.7 m), whereas the narrowest belongs to the Urael church site (2 m) and Wollo-Sefer site (2.1 m). Most road segments have more than 2.5 m effective sidewalk width (see Table 7). Research indicated that the greater the width of the sidewalk, the greater the level of safety being perceived by pedestrians as they feel more comfortable which results in a higher LOS (Kim et al., 2011; Rahimi, 2019). Therefore, those sites endowed with wider effective sidewalk width will have a better level of service as long as other factors remain constant.

Table 7. Summary of 15-minute peak hour pedestrian data (Field Survey, 2023).
The level of service was computed by taking the volume of pedestrian traffic counted every 15 min during the peak hours across sidewalks as one criterion (HCM, 2010; Kituku, 2017; Al-Mukaram and Musa, 2020). In this study, a total of 16,485 pedestrians were counted manually during the peak hours. The average number of pedestrians counted from all sites was 1,268 pedestrians. Megenagna and Lideta site holds the highest and lowest number of pedestrians population in order (see Table 7). Studies indicate that when the number of pedestrians in the facilities increases, there is a potential for decreased pedestrian flow. Thus, a reduction of LOS at pedestrian facilities is seen (Holland and Hill, 2007). According to the result of the study, the pedestrian flow rate, average speed, pedestrian space, and volume-to-capacity ratio measured for Megenagna and Mexico sites indicate the presence of narrow pedestrian space, slowed pedestrian speed, high pedestrian flow rate, and forced pedestrian flow. This shows these sites can have a poor level of service and approves the findings of Holland and Hill (2007). However, the pattern was opposite in Lideta, National Theater, Dembele, and Torihayloch sites, indicating stable and free traffic flow and a better level of service (see Table 7).
It is indicated that capacity-based quantitative evaluation of pedestrian facilities fails to consider other elements (Christopoulou and Pitsiava-Latinopoulou, 2012; Banerjee et al., 2018). The value pedestrian level of service of a facility will change due to the inclusion of quality-based factors and other microscopic extraneous factors (Christopoulou and Pitsiava-Latinopoulou, 2012). Therefore, this study overlain micro-factors from the qualitative and quantitative perspectives using the AHP technique to evaluate the performance of facilities in addition to the capacity-based system devised by HCM (2010) and other point-based systems. In this regard, the comfort, safety, and security conditions are important (Raad and Burke, 2018; Frazila et al., 2019) and taken into balance to evaluate the pedestrian facilities qualitatively (see Supplementary Table 1).
3.2 Reclassification of criteria and derivation of PLOS
Data standardization is a critical step in the analytical hierarchical process. Therefore, every factor of each main criterion was classified in its corresponding 5-point Likert scale range as decided in the literature of Jaskiewicz (2000) and Frazila et al. (2019). The value given for each factor for traffic volume was adapted from HCM (2010) standard, and the value given for other criterion sub-factors was given based on Jaskiewicz (2000), Frazila et al. (2019), Bhuiya et al. (2020), and personal observation of reality in the site. A higher value of a factor indicates better importance for pedestrian level of service (see Supplementary Table 2). AHP is used to combine these different types of factors and to turn them into a standardized numerical scale as recommended by Saaty (2008) and Stofkova et al. (2022).
A pairwise comparison matrix was prepared to calculate the potential contribution of each criterion and sub-factors (Saaty, 2008; Stofkova et al., 2022) for computing PLOS. Each criterion’s relative weight was given based on expert judgment and literature-based recommendations of Bhuiya et al. (2020), Li et al. (2021), and others. According to Alonso and Lamata (2006), Saaty (2008), and Baric and Zeljko (2021) the weights given in the pairwise comparison matrix are accepted if the consistency ratio (CR) calculated is below 10%. The result of CR derived in this study supports the recommendation of the above literature (see Table 8).
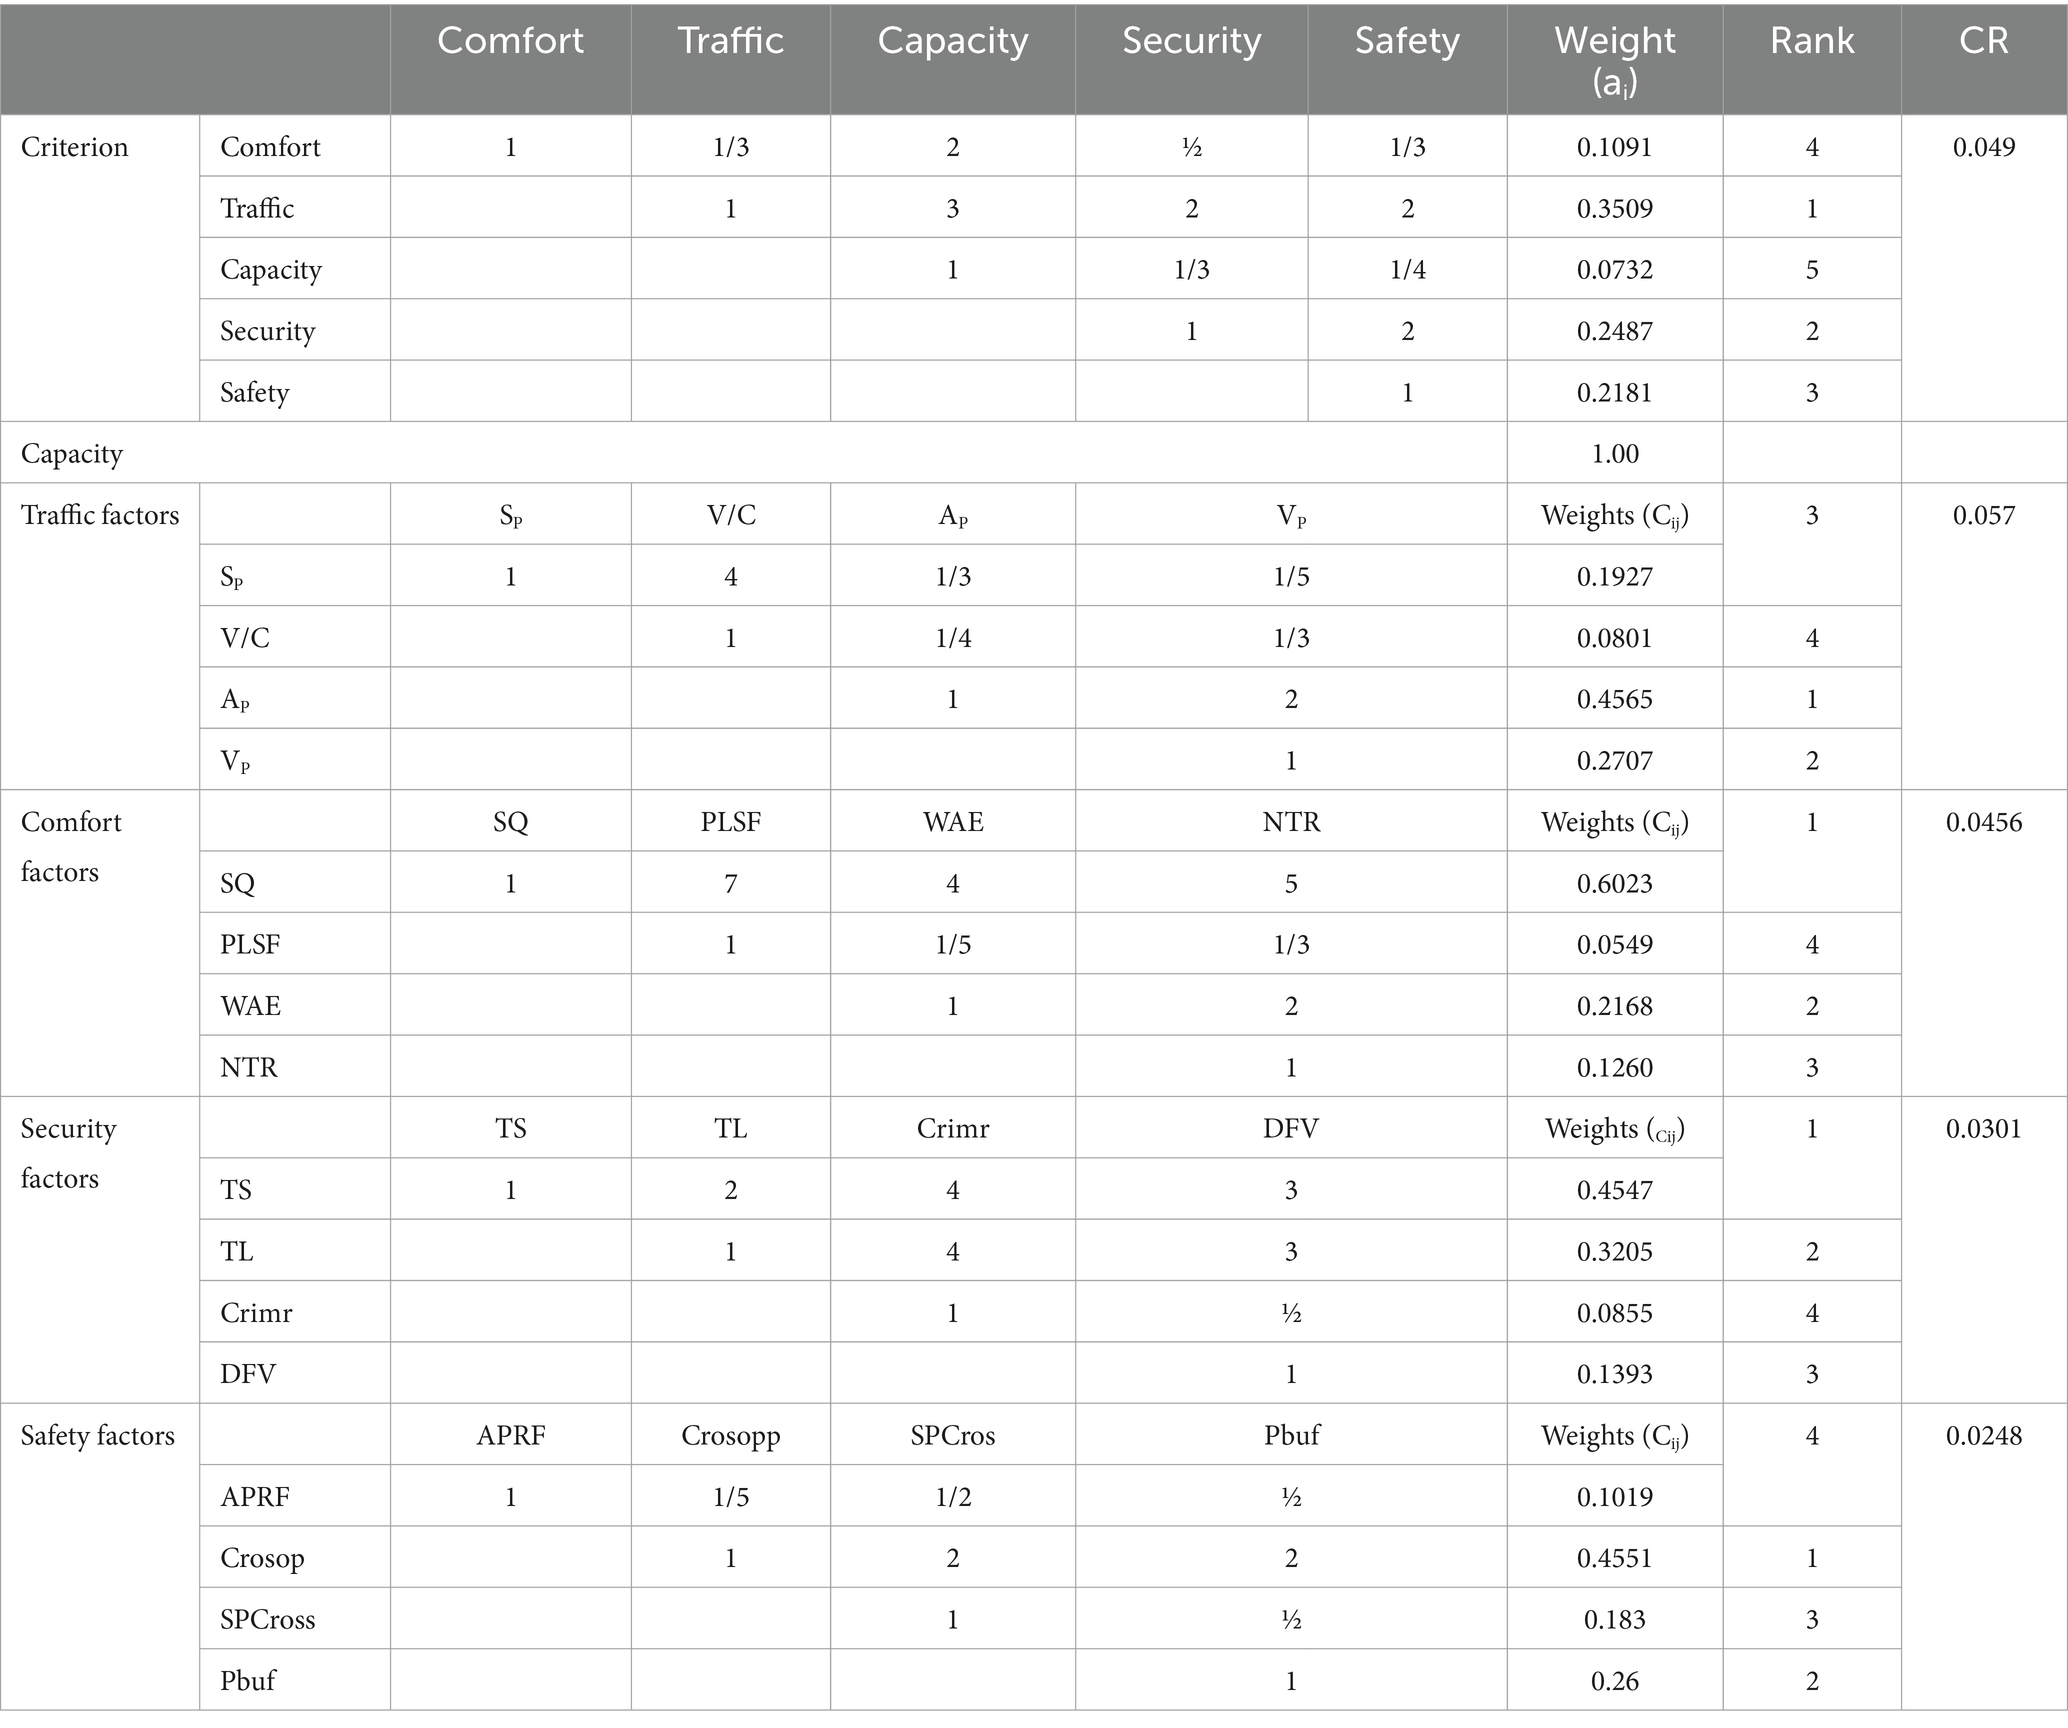
Table 8. Summary of analytical hierarchical process.
Based on the AHP result, traffic (35.1%), security (24.9%) and safety (21.8%) criteria share the highest contribution in order in this study. Comfort and capacity hold the lowest weight in the estimation of PLOS (see Table 8). The result was a little bit different from the findings of Frazila et al. (2019), who scored the highest weight for the security and safety criteria in determining PLOS. In addition to the major criterion, the sub-components were compared to assign relative weight. Accordingly, pedestrian space and pedestrian flow rate from traffic-based components; surface quality and walking environment from comfort-based factors; presence of traffic lights and traffic signs from security-based components and presence of crossing opportunities and availability of buffers from safety-based components have given the highest relative weight as compared to other components (see Table 8). As a result, those areas with those components of better quality will have a better pedestrian level of service and, thereby, better pedestrian safety.
PLOS was derived after the weights of each factor were identified using the AHP procedures. Finally, PLOS was calculated using equation 10 for each site.
The performance of each facility’s site was evaluated by classifying the PLOS classes into five scales ranging from “very poor (E)” to “excellent (A).” Gözenoğlu (2022) in his study compared the PLOS techniques employed by Highway Capacity Manual (HCM), SCI-Landis, Mozer, Tan Dandan, Disabled PLOS, Sarkar, Trip Quality, Gainesville, Conjoint Analysis, Gallin-Australian and Traffitec methods to determine the vehicle and pedestrian road service levels in Ankara province. Based on his findings the Trip Quality method developed by Jaskiewicz (2000) was recommended to evaluate the performance of pedestrian facilities. As a result, this study adopted and adapted the classification scheme of Jaskiewicz (2000) to assign a PLOS class for each pedestrian facility site.
Accordingly, a PLOS value between 1.9 and 4.2 was scored in this study. Only one site (National Theater) has excellent class PLOS value (PLOS ≥ 4); Dembel City, Legahare, and Torhayloch sites have very good PLOS class (3.4 ≤ PLOS ≤ 3.9). A higher PLOS value indicates the presence of better pedestrian facilities across the selected sites and vice versa. Hence, they can make a positive contribution to better pedestrian safety. On the other hand, the Megenagna and Mexico sites have very poor PLOS value (PLOS < 2.2), and Urael church, and Golagol sites have a poor PLOS value (2.2 ≤ PLOS ≤ 2.7). These sites were grouped from those sites characterized by the deficiency of adequate pedestrian facilities and therefore, the lower pedestrian feeling of safety will be there. Bole bridge, Meskel square, Lideta, Piyasa, Wollo Sefer, and Golagol sites have moderate or acceptable PLOS (2.8 ≤ PLOS ≤ 3.3). These sites have acceptable pedestrian facilities. However, they need further provision of pedestrian facilities for better safety (see Figure 4). The average PLOS value of the study corridor belongs to the “C” class. Therefore, the study corridor has moderate Pedestrian facilities indicating the requirement of further provisions and improvements of pedestrian facilities to enhance the performance of facilities and to create a safe environment for pedestrians.
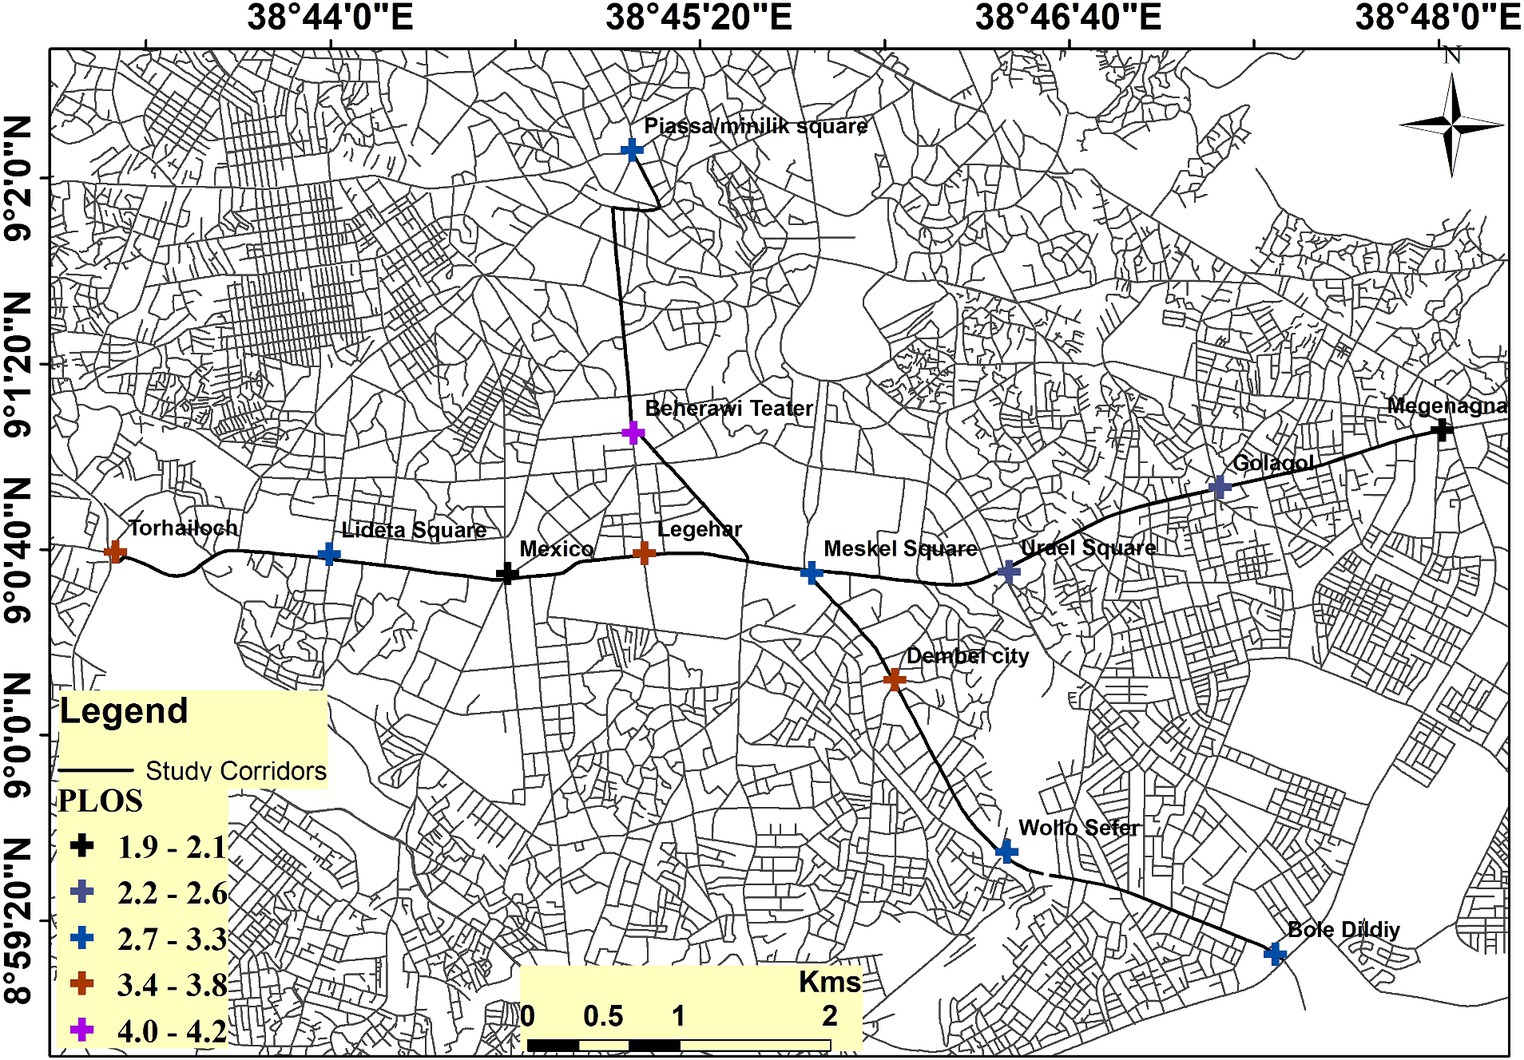
Figure 4. Distribution of pedestrian level of service.
3.3 Comparison of PLOS scoring method of different studies in Ethiopia
This study primarily compares the result of PLOS derivated by AHP and HCM techniques. This is because almost all of the research works in Addis Ababa and Ethiopia were based on HCM-based techniques. Therefore, After PLOS scores were determined through AHP, the results were compared with those of the HCM scoring method. Based on Appendix 3, only the PLOS values of 4 sites have a similar PLOS class, and the scores of the remaining 9 sites were evaluated below the HCM score. Besides, the HCM-based evaluations of Golagol, Lideta, Piassa, Mexico, and Megenagna facility sites did not indicate the reality observed (see Supplementary Table 3). Thus, the scoring technique of HCM that considers the flow magnitude of traffic exaggerates the pedestrian level of service. It could be because of its negligence to include other variables that can affect the performance of pedestrian facilities. HCM advises that adopting facility evaluation may enlarge the score of PLOS, especially in developing countries. Therefore, this study strongly approved the recommendation of the HCM pedestrian facility’s evaluation method.
The PLOS value computed from the pedestrian facilities across the study sites was also compared with the PLOS value generated for other sites that employed different methods of PLOS scoring. The study conducted by Alemgena et al. (2018) in Nekemte City applied Gallin’s method and scored the PLOS of study sites from C to D. None of the facilities in the study corridors did not score PLOS of A and B classes. Similarly, studies conducted by Erga (2019) and Lulie (2019)in Addis Ababa found a PLOS value ranging from B to E and C to F classes. In the same fashion, Fikirtework (2020) in the surrounding area of Addis Ababa also adopted the PLOS class of HCM by applying an ordered logit model and getting a PLOS class ranging from D to F. However, this study did not get all PLOS classes across the selected study sites. The difference in the score of the PLOS class could arise from the variation of the criterion used in the PLOS scoring method and the existing condition of the pedestrian facilities during the study period. Therefore, for testing the validity and practicality of each method, concurrent comparison is important, and this study is able to hold for all classes (from the worst to the best classes) due to its possibility of considering microscopic factors in the facility evaluation process (Table 9).
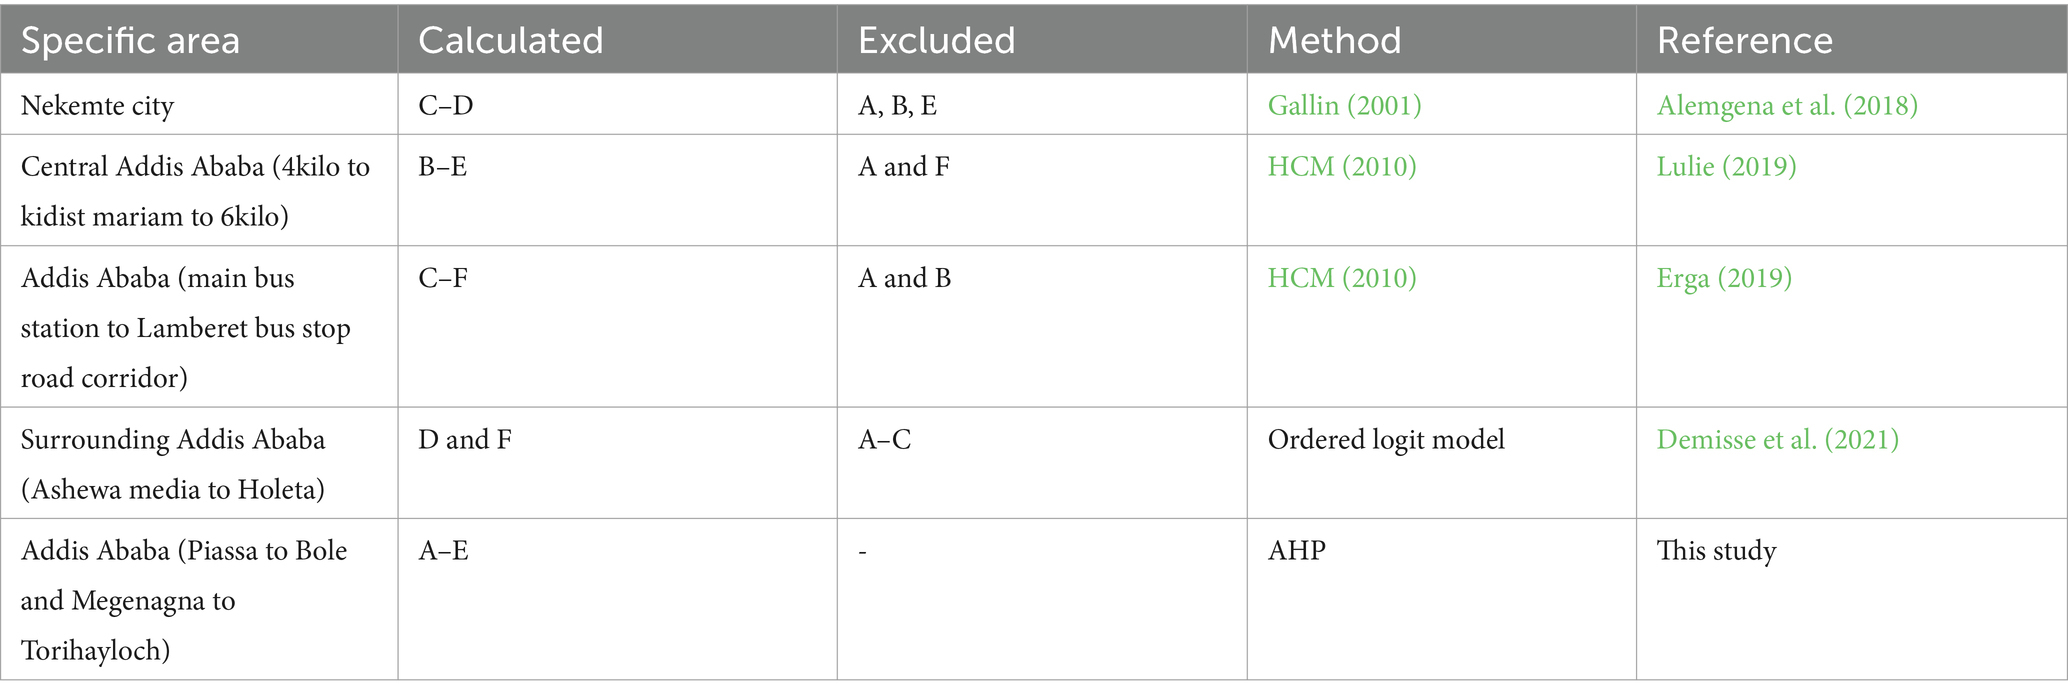
Table 9. Comparison of the PLOS scoring method of the study area and other sites.
4 Conclusion and recommendation
Rapid growth of vehicular volume at the expense of road facility problems and fast growth of
pedestrian population increased the vulnerability of road users to traffic problems in the city of Addis Ababa. This study is designed to examine the performance of pedestrian facilities to guarantee a safe system for the pedestrian population. To achieve the objectives of the study primary and secondary data collected from varieties of sources were integrated through AHP-based pedestrian level of service (PLOS). According to the findings obtained from the result of the study, the AHP method that can integrate multiple factors from traffic, capacity, safety, security, and comfort perspectives provides a reliable indication of PLOS for evaluating pedestrian facilities due to its strength in the inclusivity of varied parameters beyond the capacity of facilities. It predicts a level of service from very poor to excellent classes and approves the requirement of provision and improvement of pedestrian facilities in Megenagna, Mexico, Urael Church, and Golagol due to their lower pedestrian level of service. Therefore, these sites should get prior attention for better pedestrian safety. On the contrary, the better Pedestrian level of service identified in Denibel City, Legahare, Torhayloch, and National Theater sites approved the presence of better pedestrian facilities for the walking population. To improve the safety of the pedestrian, prior attention must be given to those sites that have very poor and poor pedestrian level of service by the local concerned bodies. Besides, further studies are important to evaluate the performance of pedestrian facilities in the study corridors and other road corridors.
5 Limitation of the study
The researcher finally identified limitations to be avoided in future works. Primarily, due to the absence of cc cameras along roads with high traffic volume for the selected sites, long-term data that can help detect the condition of pedestrian facilities was not used. Instead, the analysis was based on 6 days peak peak-hour data due to a lack of financial and time matters. This study was mainly conducted in areas with high pedestrian flow, sidewalk qualities, safety, and security concerns, and it does not include overpass and multi-highway areas. Besides, the perception of pedestrians when evaluating facilities was not considered. Therefore, the above gaps should be considered in the future studies.
Data availability statement
The raw data supporting the conclusions of this article will be made available by the authors, without undue reservation.
Author contributions
TW: Conceptualization, Data curation, Formal analysis, Investigation, Methodology, Software, Validation, Visualization, Writing – original draft, Writing – review & editing. GN: Formal analysis, Supervision, Writing – review & editing. RS: Formal analysis, Supervision, Writing – review & editing.
Funding
The author(s) declare that no financial support was received for the research, authorship, and/or publication of this article.
Acknowledgments
The authors are grateful to Ethiopia’s Ministry of Transport and Logistics (MOTL) for their continual support and eagerness to provide us with the necessary preconditions for this research study. Specifically, many thanks go to the Addis Ababa City Traffic Management Authority and Police Commission for their eagerness to provide Supportive data for this study.
Conflict of interest
The authors declare that the research was conducted in the absence of any commercial or financial relationships that could be construed as a potential conflict of interest.
Publisher’s note
All claims expressed in this article are solely those of the authors and do not necessarily represent those of their affiliated organizations, or those of the publisher, the editors and the reviewers. Any product that may be evaluated in this article, or claim that may be made by its manufacturer, is not guaranteed or endorsed by the publisher.
Supplementary material
The Supplementary material for this article can be found online at: https://www.frontiersin.org/articles/10.3389/frsc.2024.1412885/full#supplementary-material
Abbreviations
AACRTB, Addis Ababa City Road Transport Bureau; AACTMA, Addis Ababa City Traffic Management Agency; UNECA, United Nations Economic Commission for Africa; WHO, World Health Organization.
References
AACTMA (2021). Addis Ababa non-motorised transport strategy implementation plan 2019–2021. Addis Ababa, Ethiopia: AACTMA.
Addis Ababa City Road Transport Bureau (AARTB). (2016) Road traffic annual report, Addis Ababa, Ethiopia.
Ahmed, T., Moeinaddini, M., Almoshaogeh, M., Jamal, A., Nawaz, I., and Alharbi, F. (2021). A new pedestrian crossing level of service (PCLOS) method for promoting safe pedestrian crossing in urban areas. Int. J. Environ. Res. Public Health 18, 1–18. doi: 10.3390/ijerph18168813
Alemgena, H., Emer, P., Quezon, T., and Kumela, T. (2018). Investigation of pedestrian safety problems and its countermeasures: A case study in Nekemte City, Ethiopia. Int J Eng Tech Res 8, 58–64.
Al-Mukaram, N., and Musa, S. S. (2020). Determination of pedestrian level of service on sidewalks in Samawah City determination of pedestrian level of service on sidewalks in Samawah City. IOP Conf. Series. Mater. Sci. Eng. 928, 022077–022012. doi: 10.1088/1757-899X/928/2/022077
Alonso, A. J., and Lamata, T. M. (2006). Consistency in the analytic hierarchy process: a new approach. Int J Uncertainty Fuzz Knowl Based Syst 14, 445–459. doi: 10.1142/S0218488506004114
Asres, B. (2018). Analysis of land use and transportation demand interactions in Addis Ababa: A case study in Akaki Kality Sub City. Addis Abab.
Banerjee, A., Kumar, A., and Lämmel, G. (2018). A review of pedestrian flow characteristics and level of service over different pedestrian facilities. Collect Dyn 3, 1–52. doi: 10.17815/CD.2018.17
Barić, D., Pilko, H., and Strujić, J. (2016). An analytic hierarchy process model to evaluate road section design. Transport 31, 312–321. doi: 10.3846/16484142.2016.1157830
Baric, D., and Zeljko, L. (2021). Multi-criteria decision-making on road transport vehicles by the AHP method. Arch Automot Eng 94, 17–26. doi: 10.14669/AM.VOL94.ART2
Bhaduri, E., Manoj, B. S., and Sen, J. (2019). Measuring User Satisfaction of Pedestrian facilities and its heterogeneity in urban India—A tale of three cities. J. East. Asia Soc. Transp. Stud. 13, 144–171. doi: 10.11175/easts.13.144
Bharathy, G., and Karthigaipriya, T. (2017). Pedestrian characteristics and behaviour on surrounding Temple area Madurai. Int J Magaz Eng Technol Manage Res 4, 311–322.
Bhuiya, M. R., Mohiuddin, H., Patwary, S. H., and Tasneem, A. (2020). Evaluation of pedestrian level of Service of Selected Footpath Segments of Dhaka City using multi-criteria decision making approach. Glob J Hum Soc Sci 20, 1–9.
Bivina, G., Parida, P., Advani, M., and Parida, M. (2018). Pedestrian level of service model for evaluating and improving sidewalks from various land uses. Eur Transp 2, 1–18.
Christopoulou, P., and Pitsiava-Latinopoulou, M. (2012). Development of a model for the estimation of pedestrian level of Service in Greek Urban Areas. Procedia. Soc. Behav. Sci. 48, 1691–1701. doi: 10.1016/j.sbspro.2012.06.1144
Dixon, L. B. (1996). Bicycle and pedestrian level-of-service performance measures and standards for congestion management systems. Transport Res Record 1538, 1–9. doi: 10.1177/0361198196153800101
Demisse, A., Shore, H., Ayana, G. M., Negash, B., Raru, T. B., Merga, B. T., et al. (2021). Magnitude of death and associated factors among road traffic injury victims admitted to emergency outpatient departments of public and private hospitals at Adama Town, East Shewa Zone, Ethiopia. SAGE open medicine, 9:20503121211060203.
Eboli, L., Forciniti, C., Mazzulla, G., and Bellizzi, M. G. (2023). Establishing performance criteria for evaluating pedestrian environments. Sustain. For. 15, 1–23. doi: 10.3390/su15043523
Erga, D. G. (2019). Assessment of traffic congestion and its impact over selected road corridor in Addis Ababa city. Addis Ababa University Repository, MSc. Thesis.
Fikirtework, D. (2020). Developing level of service model for pedestrian sidewalks: The case of Ashewameda to Holeta, Addis Ababa University Repository. Published Master Thesis
Frazila, R. B., Zukhruf, F., Simorangkir, C. O., and Burhani, J. T. (2019). Constructing pedestrian level of service based on the perspective of a visually impaired person. MATEC Web Conf 270, 1–7. doi: 10.1051/matecconf/201927003009
Gallin, N. (2001). Quantifying pedestrian friendliness: guidelines for assessing pedestrian level of service. Road Transport Res 10, 47–55.
Gebresenbet, R. F., and Aliyu, A. D. (2019). Injury severity level and associated factors among road traffic accident victims attending emergency Department of Tirunesh Beijing Hospital, Addis Ababa, Ethiopia: A cross-sectional hospital-based study. PLoS One 14, 1–16. doi: 10.1371/journal.pone.0222793
Golakiya, H., Chauhan, R., Santosh Bari, C., and Dhamaniya, A. (2022). Pedestrian safety analysis at urban midblock section under mixed traffic conditions using time to collision as surrogate safety measure. Curr. Sci. 123, 1117–1128. doi: 10.18520/cs/v123/i9/1117-1128
Gözenoğlu, B. (2022). Determination of vehicle and pedestrian road service levels and investigation of road safety in Ankara Province some selected regions (issues 1–150) [Hacettepe University]. Unpublished Master Thesis
Haile, T. (2018). Assessment of pedestrian overpass facilities along the the Addis Ababa ring road. Addis Ababa University Repository.
HCM. (2010). Highway Capacity Manual Transportation Research Board: National Research Council (Vol. 1).
Henke, I., Carteni, A., Molitierno, C., and Errico, A. (2020). Decision-making in the transport sector: A sustainable evaluation method for road infrastructure. Sustain. For. 12:764. doi: 10.3390/su12030764
Hidayat, N., Haryanto, I., and Isheka, R. (2022). Evaluation of pedestrian facilities performance. IOP Conf. Series: earth and environmental. Science 1065, 012061–012010. doi: 10.1088/1755-1315/1065/1/012061
Holland, C., and Hill, R. (2007). The effect of age, gender, and driver status on pedestrians’ intentions to cross the road in risky situations. Accid. Anal. Prev. 39, 224–237. doi: 10.1016/j.aap.2006.07.003
Huber, T., Luecke, K., Hintze, M., Coffman, V., Toole, J., and Van Oosten, M. (2013). A guide for maintaining pedestrian facilities for enhanced safety. Department of Transportation Federal Highway Administration: U.S.
Hussain, S., Goswami, A., and Gupta, A. (2022). Predicting pedestrian crash locations in urban India: an integrated GIS-based spatiotemporal HSID technique. J Transport Saf Secur 15, 103–136. doi: 10.1080/19439962.2022.2048759
Islam, A., and Bhuiyan, A. (2024). Factors affecting citizen safety of urban transportation service in Bangladesh: the case of Pabna municipality. Heliyon 10:e24697. doi: 10.1016/j.heliyon.2024.e24697
Ismael, H., and Athab, H. A.-J. (2023). Evaluation of pedestrian facilities in Al-Najaf City. E3S Web of Conf 427, 1–8. doi: 10.1051/e3sconf/202342703024
Jaskiewicz, F. (2000). “Pedestrian level of service based on trip quality” in Transportation Research Circular (Transportation Research Board).
Kim, S., Choi, J., and Kim, Y. (2011). Determining the sidewalk pavement width by using pedestrian discomfort levels and movement characteristics. KSCE J. Civ. Eng. 15, 883–889. doi: 10.1007/s12205-011-1173-1
Kitosi, P. (2023). The influence of road users’ behaviors on pedestrian safety in urban built environment: the case of Kinondoni in Dar Es Salaam. Open Access Libr J 10, 1–9. doi: 10.4236/oalib.1110171
Kituku, M. O. (2017). Performance evaluation of pedestrian facilities at Donholm interchange along outer ring road, Nairobi. University of Nairobi, Master Thesis.
Komol, M. M. R., Hasan, M. M., Elhenawy, M., Yasmin, S., Masoud, M., and Rakotonirainy, A. (2021). Crash severity analysis of vulnerable road users using machine learning. PLoS One 16, 1–22. doi: 10.1371/journal.pone.0255828
Levulytė, L., Baranyai, D., Sokolovskij, E., and Török, Á. (2017). Pedestrians’ role in road accidents. Int J Traffic Transport Eng 7, 328–341. doi: 10.7708/ijtte.2017.7(3).04
Li, H., Lin, Y., Wang, Y., Liu, J., Liang, S., Guo, S., et al. (2021). Multi-criteria analysis of a people-oriented urban pedestrian road system using an integrated fuzzy AHP and DEA approach: A case study in Harbin, China. Symmetry 13, 1–22. doi: 10.3390/sym13112214
Lulie, B. (2019). Estimation of level of Service of Walkways Rehabilitation Projects of Addis Ababa City roads Authority in Central Addis Ababa, Addis Ababa University Repository. Master Thesis
Miller, E., Srikukenthiran, S., and Chung, B. (2018). Workshop synthesis: household travel surveys in an era of evolving data needs for passenger travel demand. In: Bonnel P, Munizaga M, Morency C, Trepanier M (eds) transport survey methods in the era of big data: facing the challenges. Transport Res Proc 32, 374–382. doi: 10.1016/j.trpro.2018.10.067
Mohammed, A. H., and Mashros, N. (2015). Modeling of pedestrian speed-density and volume-density relationships in outdoor walkways. J. Technol. 73, 1–13. doi: 10.11113/jt.v73.4295
Mohapatra, D. R. (2015). Feasibility of non-motorized transport facilities in Addis Ababa City of Ethiopia: an economic analysis. Eur. Acad. Res. 2, 13347–13369.
Nadrian, H., Haghighi, M., Bakhtari, F., and Sadeghi-Bazargani, H. (2020). What are the challenges of pedestrian safety from the viewpoints of traffic and transport stakeholders? A qualitative Study, 1–20. doi: 10.21203/rs.3.rs-41143/v1
Nag, D., and Goswami, A. K. (2019). Identification of measures of effectiveness (MOEs) for developing pedestrian level of service (PLOS). Int Rev Spat Plann Sustain Dev 7, 56–82. doi: 10.14246/irspsd.7.4_56
Nag, D., Goswami, A. K., Gupta, A., and Sen, J. (2020). Assessing urban sidewalk networks based on three constructs: a synthesis of the pedestrian level of service literature. Transplant. Rev. 40, 204–240. doi: 10.1080/01441647.2019.1703841
Paul, D., Moridpour, S., Venkatesan, S., and Withanagamage, N. (2024). Evaluating the pedestrian level of service for varying trip purposes using machine learning algorithms. Sci. Rep. 14, 2813–2815. doi: 10.1038/s41598-024-53403-7
Pucher, J. (2017). The urban transport crisis in emerging economies. Transplant. Rev. 38, 271–273. doi: 10.1080/01441647.2017.1313333
Raad, N., and Burke, M. (2018). What are the Most important factors for pedestrian level-of-service estimation? A systematic review of the literature. Transp. Res. Rec. 2672, 101–117. doi: 10.1177/0361198118790623
Rahimi, M. (2019). Evaluation of pedestrian level of service and users’ satisfaction on selected pedestrian sidewalks in downtown Walnut Creek. East Bay: California State University.
Reta, T., and Jote, T. (2022). Assessment of pedestrian infrastructures of road transport: A case study of Jimma town. J Sustain Dev Transport Logist 7, 41–52. doi: 10.14254/jsdtl.2022.7-2.3
Rosario, A. F., and Fillone, A. M. (2018). Evaluation of existing pedestrian network and facilities: An analysis to formulate pedestrian planning guidelines, 1–8.
Saaty, T. (1995). Transport planning with multiple criteria-the analytic hierarchy process applications and Progress review. J. Adv. Transp. 29, 81–126. doi: 10.1002/atr.5670290109
Saaty, T. L. (2008). Decision making with the analytic hierarchy process. Int J Serv Sci 1, 83–98. doi: 10.1504/IJSSCI.2008.017590
Saaty, T. L., and Tran, L. T. (2007). On the invalidity of Fuzzifying numerical judgments in the analytic hierarchy process. Mathematical Comput Model 46, 962–975. doi: 10.1016/j.mcm.2007.03.022
Sahani, R., and Bhuyan, P. (2015). Pedestrian level of service criteria for urban off-street facilities of mid-size cities using SOM in ANN. Indian Highways, 1–12.
Shafabakhsh, G., and Mohammadi, M. (2014). An improvement to pedestrian’ s mobility by rehabilitating the sidewalk with application of AHP (case study). J Rehabil Civil Eng 1, 65–74.
Singh, K., and Jain, P. K. (2011). Methods of assessing pedestrian level of service. J Eng Res Stud 2, 116–124.
Soathong, A., Wilson, D., Ranjitkar, P., and Chowdhury, S. (2019). A critical review of policies on pedestrian safety and a case study of New Zealand. Sustain. For. 11, 1–27. doi: 10.3390/su11195274
Sosik-Filipiak, K., and Osypchuk, O. (2023). Identification of solutions for vulnerable road users safety in urban transport systems: grounded theory research. Sustain. For. 15, 1–14. doi: 10.3390/su151310568
Stofkova, J., Krejnus, M., Stofkova, K. R., Malega, P., and Binasova, V. (2022). Use of the analytic hierarchy process and selected methods in the managerial decision-making process in the context of sustainable development. Sustain. For. 14, 1–20. doi: 10.3390/su141811546
Sulaksono, W. S., and Nurhalima, D. R. (2018). Pedestrian facilities evaluation using pedestrian level of service (PLOS) for university area: case of Bandung institute of technology. MATEC Web Conf 181, 1–9. doi: 10.1051/matecconf/201818102005
Sun, S., Zhou, Q., Lal, S., Xu, H., Goh, K., and Wong, Y. D. (2021). Quantifying performance of sheltered linkway facility in Singapore using human-centric indicators. Int J Urban Sustain Dev 13, 187–198. doi: 10.1080/19463138.2020.1858422
Taddesse, W. (2011). Assessing and quantifying the level of traffic congestion at major intersections in Addis Ababa: A case for east-west corridor. Addis Ababa University Repository, MSc. Thesis.
Tinumbia, N., Meutia, W., Suryaatmaja, G., and Pancasila, U. (2022). The evaluation of pedestrian facilities in Universitas Pancasila area. J. Infrastruct. 8, 61–69. doi: 10.35814/infrastruktur.v8i1.2957
Tulu, G., Mazharul, H., Washington, S., and King, M. J. (2015a). Investigating pedestrian injury crashes on modern roundabouts in Addis Ababa, Ethiopia. Transp. Res. Rec. 2512, 1–10. doi: 10.3141/2512-01
Tulu, G., Washington, S., Haque, M., and King, M. (2015b). Investigation of pedestrian crashes on two-way two-lane rural roads in Ethiopia. Accid. Anal. Prev. 78, 118–126. doi: 10.1016/j.aap.2015.02.011
Tulu, G., Washington, S., and King, M. (2013a). Characteristics of police-reported road traffic crashes in Ethiopia over a six year period. Peer review stream: proceedings of the 2013 Australasian road safety research, Policing & Education Conference, 1–14.
Tulu, G., Washington, S., King, M., and Haque, M. (2013b). Why are pedestrian crashes so different in developing countries? A review of relevant factors in relation to their impact in Ethiopia. Australasian transport research forum, ATRF 2013-proceedings.
Ujjwal, J., and Bandyopadhyaya, R. (2021). Development of PLOS assessment guidelines for mixed land use areas considering quality of service parameters. Transport Dev Econ 7, 1–11. doi: 10.1007/s40890-021-00113-8
WHO (2013). “Why is addressing pedestrian safety necessary?” in Pedestrian safety: A road safety manual for decision-makers and practitioners., 1–21.
WHO. (2018). Global status report on road safety 2018. Available at: https://www.who.int/violence_injury_prevention/road_safety_status/en/(Accessed 23 January 2023).
World Bank. (2022). Addis Ababa sidewalk safety and improvement study, Project Report (Issue 169923). Washington D.C.
Zainol, R., Ahmad, F., Nordin, N. A., and Aripin, A. W. M. (2014). Evaluation of users’ satisfaction with pedestrian facilities using a pair-wise comparison approach. Earth Environ. Sci. 18, 1–7. doi: 10.1088/1755-1315/18/1/012175
Keywords: analytical hierarchical process, pedestrian, facility evaluation, level of service, pedestrian safety, pedestrian facility
Citation: Walelign Bishaw T, Nurye Dolebo G and Singh RB (2024) Evaluating pedestrian facilities for enhancing pedestrian safety in Addis Ababa city. Front. Sustain. Cities. 6:1412885. doi: 10.3389/frsc.2024.1412885
Edited by:
Joachim G. Taiber, International Alliance for Mobility Testing and Standardization (IAMTS), AustriaReviewed by:
Giannis Adamos, Aristotle University of Thessaloniki, GreeceAdam Radzimski, Adam Mickiewicz University, Poland
Copyright © 2024 Walelign Bishaw, Nurye Dolebo and Singh. This is an open-access article distributed under the terms of the Creative Commons Attribution License (CC BY). The use, distribution or reproduction in other forums is permitted, provided the original author(s) and the copyright owner(s) are credited and that the original publication in this journal is cited, in accordance with accepted academic practice. No use, distribution or reproduction is permitted which does not comply with these terms.
*Correspondence: Temesgen Walelign Bishaw, dGVtZXNnZW53YWxlbGlnbjExQGdtYWlsLmNvbQ==