 Marjolein H. J. van Huijgevoort
 Dirk Gijsbert Cirkel
 Joris G. W. F. Voeten
- 1KWR Water Research Institute, Nieuwegein, Netherlands
- 2Environmental Sciences Group, Wageningen University & Research, Wageningen, Netherlands
The number of artificial turf fields in cities has increased due to increased pressure on outside sport facilities caused by a higher population density. Downsides of these fields are changes in thermal conditions and decreased infiltration of rain. Artificial turf can reach very high surface temperatures leading to unfavourable playing conditions and contributing to the urban heat island effect. In this study the possibilities of a subsurface water storage and capillary irrigation system for evaporative cooling of artificial turf based on rainwater capture, storage and reuse are investigated. The system consists of an 85 mm water-retention subbase with capillary columns, a capillary shockpad and a natural infill. First, a laboratory experiment was conducted to test the evaporative potential of the system with different types of infill and artificial turf. Next, four research plots were designed in Amsterdam, The Netherlands, which consisted of natural grass, conventional artificial turf and two versions of the cooled artificial turf system (non-infill and standard). Evaporation from the cooled artificial turf reached maximum values around 4 mm/d during summer and surface temperatures were significantly lower than at the conventional artificial turf. Rainwater was stored below the fields. By combining these functions, these fields can help cities adapt to climate change.
1 Introduction
The increasing population density in cities results in increased pressure on outside sport facilities like soccer fields. As a result, the number of fields with artificial turf instead of natural grass is increasing significantly (McNitt, 2005; Fleming, 2011), e.g., in the city of Amsterdam the percentage of artificial turf pitches grew from 9% in 2006 to near 40% in 2019 (Hylkema, 2018; Klein et al., 2019). Natural grass sport fields are converted to artificial turf, because natural grass is too vulnerable for intensive use under all weather conditions (Fleming, 2011). Switching to artificial turf permits high intensity usage of up to 50 h per week (Fleming, 2011; Klein et al., 2019). This conversion however has consequences for the surroundings; artificial turf decreases net soil infiltration of rain and leads to changes in thermal conditions (Cheng et al., 2014). Infiltration of rain into soil is decreased, because water is caught by sub-surface drainage systems and quickly discharged to sewers or surface water instead of percolating into the subsoil. Surface evaporation is strongly reduced in artificial turf when compared to natural turf, resulting in increased surface and air temperatures, exacerbating the urban heat island effect (Yaghoobian et al., 2010; Jim, 2017; Carvalho et al., 2021). Depending on meteorological conditions artificial turf can reach very high surface temperatures (Kandelin et al., 1976; Devitt et al., 2007; Petrass et al., 2014, 2015; Jim, 2017). In the Netherlands, climate change is expected to lead to higher temperatures, longer dry periods and more frequent high intensity precipitation (Philip et al., 2020). Converting natural grass to artificial turf exacerbates the effects of climate change instead of helping cities to adapt to these changes.
Besides the negative effects on the surroundings and lack of adaptation possibilities to climate change, the very high surface temperatures of conventional artificial turf pitches can lead to unfavourable playing conditions and health risks (Kandelin et al., 1976; McNitt and Petrunak, 2007; Lim and Walker, 2009; Cheng et al., 2014; Jim, 2017). Increased surface temperatures can lead to burn injuries through direct contact (Pfautsch et al., 2022) and exertional heat illness (Liu and Jim, 2021). Heat illness can occur in mild forms, like heat edema, heat rash, heat syncope and heat cramps, but can progress to heat exhaustion and potentially life-threatening heat stroke (Howe and Boden, 2007). Surface temperatures of conventional artificial turf are found to reach values of above 70°C on sunny summer days. Williams and Pulley (2003) even measured a surface temperature of almost 93°C on a day with an air temperature of almost 37°C. Several studies since the ‘70 have shown that surface temperatures of artificial turf regularly exceed the 45°C heat-pain threshold in several cities in temperate regions (Kandelin et al., 1976; McNitt, 2005). The Brigham Young University (Idaho, US) maintains a maximum surface temperature threshold of around 50°C after an incident where higher surface temperatures led to blisters on the soles of a coach’s feet. Above this temperature threshold activities are suspended (Williams and Pulley, 2003).
High surface temperatures at artificial turf fields are related to, besides meteorological conditions, the type of infill, shockpad and heat transfer from the synthetic jarn and backing to the shockpad (Devitt et al., 2007; Petrass et al., 2014; Villacañas et al., 2017). Adjustments to the type of infill (e.g., changing albedo) have led to only small improvements compared to conventional systems (Devitt et al., 2007; Penn State’s Center for Sports Surface Research, 2012). Several studies have shown that cooling by evaporation is the only effective way to reduce surface temperatures (Penn State’s Center for Sports Surface Research, 2015; Kanaan et al., 2020). This cooling effect can be achieved by sprinkler irrigation of the artificial turf. The downside of irrigation is that the cooling effect is very temporary, playability is negatively affected and large amounts of fresh water are needed (McNitt et al., 2008; Penn State’s Center for Sports Surface Research, 2015). Besides these downsides, irrigation might cause a health risk for athletes and spectators if untreated non-potable water is used.
In this study, the possibilities of a subsurface water storage and capillary irrigation system for cooling artificial turf and reducing the impact of high intensity precipitation events are investigated. The aims of the subsurface water storage system are to (1) store precipitation below the field for later onsite use for evaporation or slow discharge and (2) cool the artificial turf by enabling evaporation without affecting the playing characteristics of the field. Through a pilot study, it is shown to what extent the system can reach these aims and thus contribute to a climate adaptive and water sensitive sports system.
2 Materials and methods
The general set-up of the research is described in Figure 1. Details of the experiments are given in the following sections.
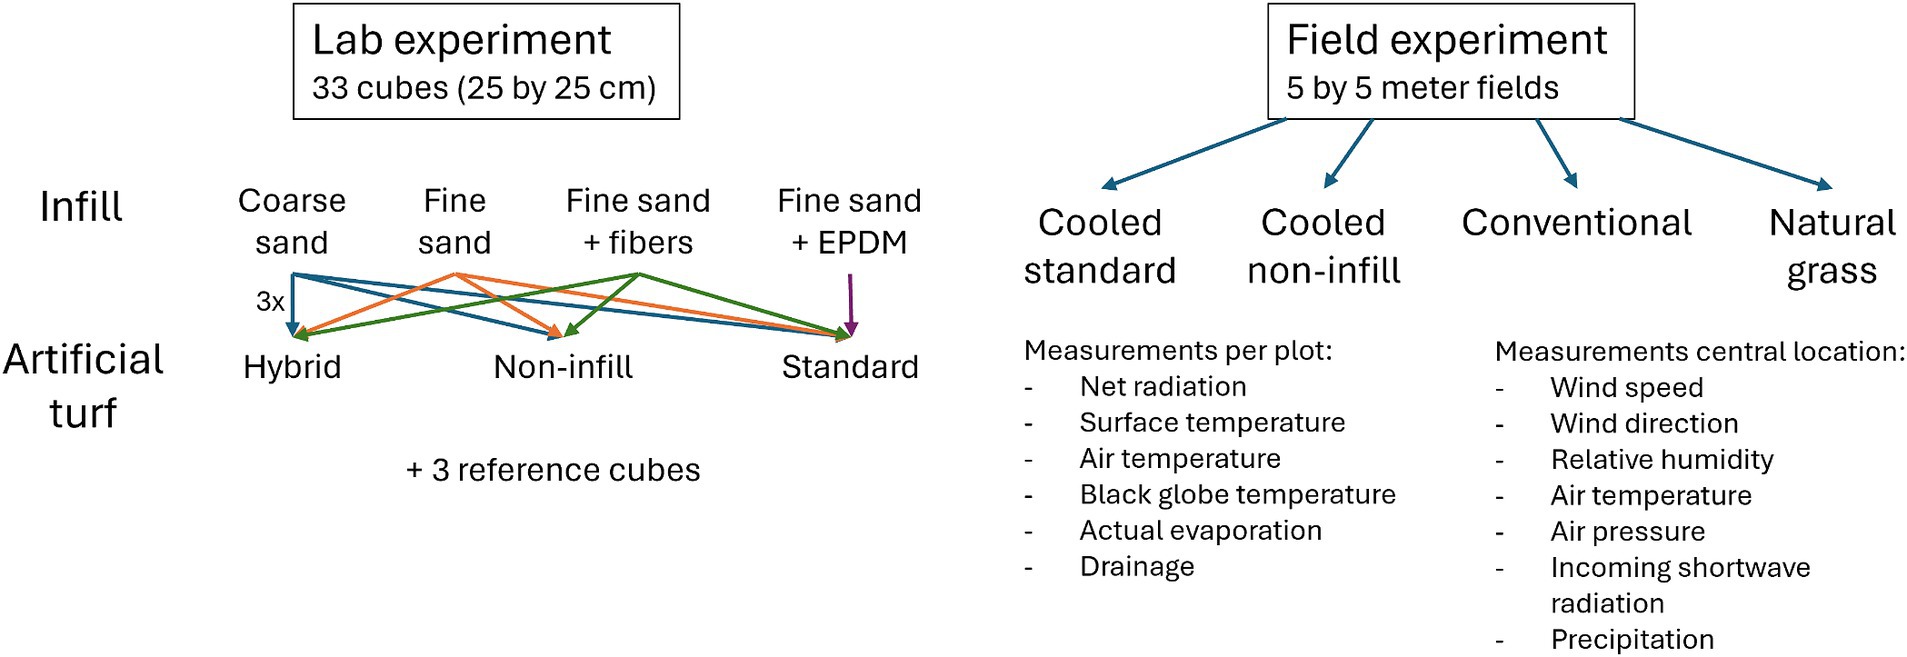
Figure 1. Set-up of the research with details about the lab experiment (left) and the field experiment (right). Details are described in section 2.2 and section 2.3.
2.1 Water storage and capillary irrigation system
For water management, the Permavoid 85S sub-surface water storage and capillary irrigation system (Voeten et al., 2016) was used (Figure 2). This system was originally developed as stormwater retention and irrigation system for vegetated roofs, also known as blue-green roofs (Cirkel et al., 2018). The maximum water retention capacity in the 85 mm high storage system was 80 mm. However, using passive or active water level controls, retention levels could be set to designed or specified retention levels. When the maximum water level was exceeded, water was discharged. Stored water was made available for passive irrigation through capillary cylinders, consisting of hydrophilic rockwool fibres, placed inside cylinders in the Permavoid units to supply the above lying layer with water by capillary draw. In our setup the units were topped with a 20 mm thick capillary shockpad of hydrophilic rockwool fibres developed by DutchBlue and open-backed artificial turf with a sand infill (Figure 2). In this way, stored water could be transported from storage to the surface for evaporation without the use of pumps or energy.
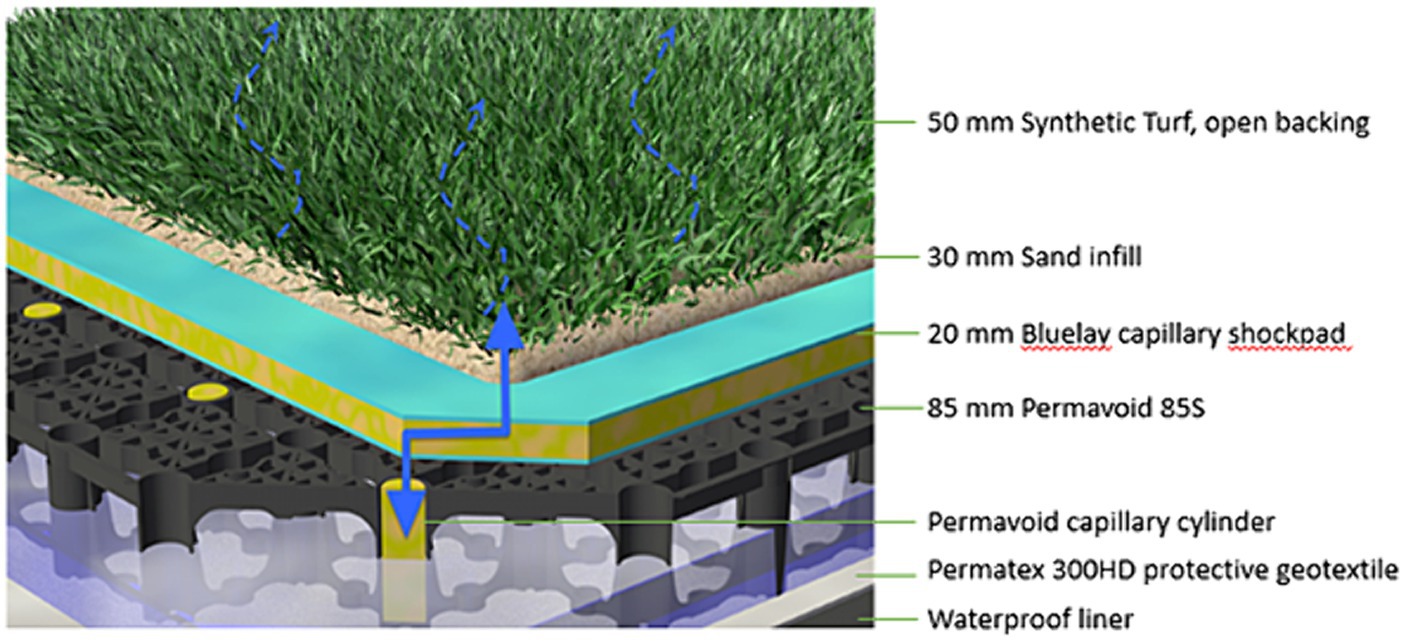
Figure 2. Cross section of the used sub-surface drainage, water detention and capillary irrigation system in an artificial turf field. Image courtesy of Permavoid.com.
2.2 Lab experiment
As a first step to determine the evaporative potential of the system, different types of infill and artificial turf were tested in a climate-controlled room to achieve required conditions for evaporation (Figure 3). Temperature was kept constant at 27°C and relative humidity ranged between 30.5 and 38.5%. Four different types of infill were tested: a coarse (1.0–2.0 mm) standard sand infill, a fine (0.2–0.6 mm) standard sand infill, a mixture of fine sand and SportsAddit capillary fibres (‘mixed sand infill’), and an infill of fine sand covered with a layer of ethylene propylene diene monomer (EPDM) rubber granulate to investigate the possible evaporation inhibiting effect of a granulate layer.
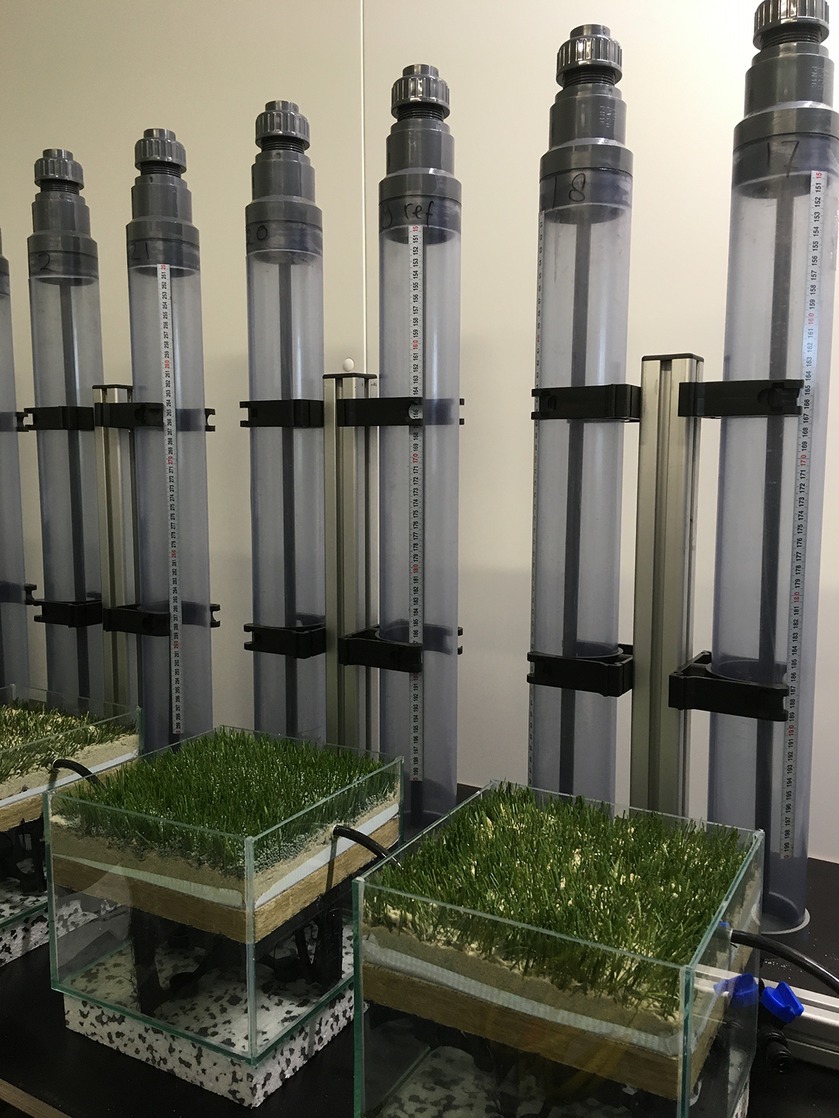
Figure 3. Set-up of the evaporation experiment under controlled conditions, with Mariotte’s bottles behind the cubes.
Infills were combined with three different types of artificial turf: (1) a woven monofilament artificial turf with a filament height of 50 mm (‘standard’), a woven hybrid artificial turf with a filament height of 40 mm (‘hybrid’) and a woven non-infill artificial turf with a filament height of 30 mm (‘non-infill’). Infill heights were 30 mm for ‘standard’ and ‘hybrid’ and 7 mm for ‘non-infill’. The combination of sand and EPDM crumb rubber consisted of 20 mm fine sand and 10 mm crumb rubber. The infill of fine sand with EPDM was only combined with the ‘standard’ artificial turf.
Each combination of artificial turf and infill was placed in a 25 by 25 cm glass cube on a shockpad above the water storage unit with a single capillary fibre cylinder (centered). The water level in the water storage unit was kept constant at 5 cm by connecting each cube to a Mariotte’s bottle (Figure 3). As a reference, three cubes were filled with water to the top of the (‘standard’) artificial turf. For each combination and for the reference, three cubes were included in the experiment, resulting in a total of 33 cubes. Water level in the Mariotte’s bottle was recorded manually on a daily basis for each cube to determine actual evaporation.
2.3 Field experiment
To verify the results from the lab experiment in a real-life situation with solar radiation, a field experiment was conducted at a site in Amsterdam (Marineterrein), the Netherlands (52.37° latitude, 4.92° longitude). The climate of the research site is temperate maritime, with average precipitation of 852 mm/y and an average Makkink reference crop evapotranspiration (Makkink, 1957) of 593 mm/y (based on 30 years of meteorological data from climate station Schiphol of the Royal Netherlands Meteorological Institute, located 11 km from the research site).
In the field experiment, four 5 meters by 5 meters research plots were designed (Figure 4):
• a capillary irrigated plot with the 50 mm ‘standard’ artificial turf with 45 kg/m2 (30 mm) fine sand infill (‘cooled standard’).
• a capillary irrigated plot with the 30 mm ‘non-infill’ artificial turf with 10 kg/m2 (10 mm) fine sand infill (‘cooled non-infill’).
• a plot with a traditional artificial turf design with black crumb rubber infill (‘conventional’). The traditional design consisted of a foundation of 10 cm lava granulate on a sand bed, a tufted artificial turf with latex backing and an infill of 10 mm sand and 30 mm black crumb rubber.
• a capillary irrigated natural grass plot (‘natural grass’). The natural turf plot consisted of a 85 mm water storage and drainage layer with capillary fibre cylinders, covered with a 30 cm thick layer of soil planted with pre-grown natural grass.
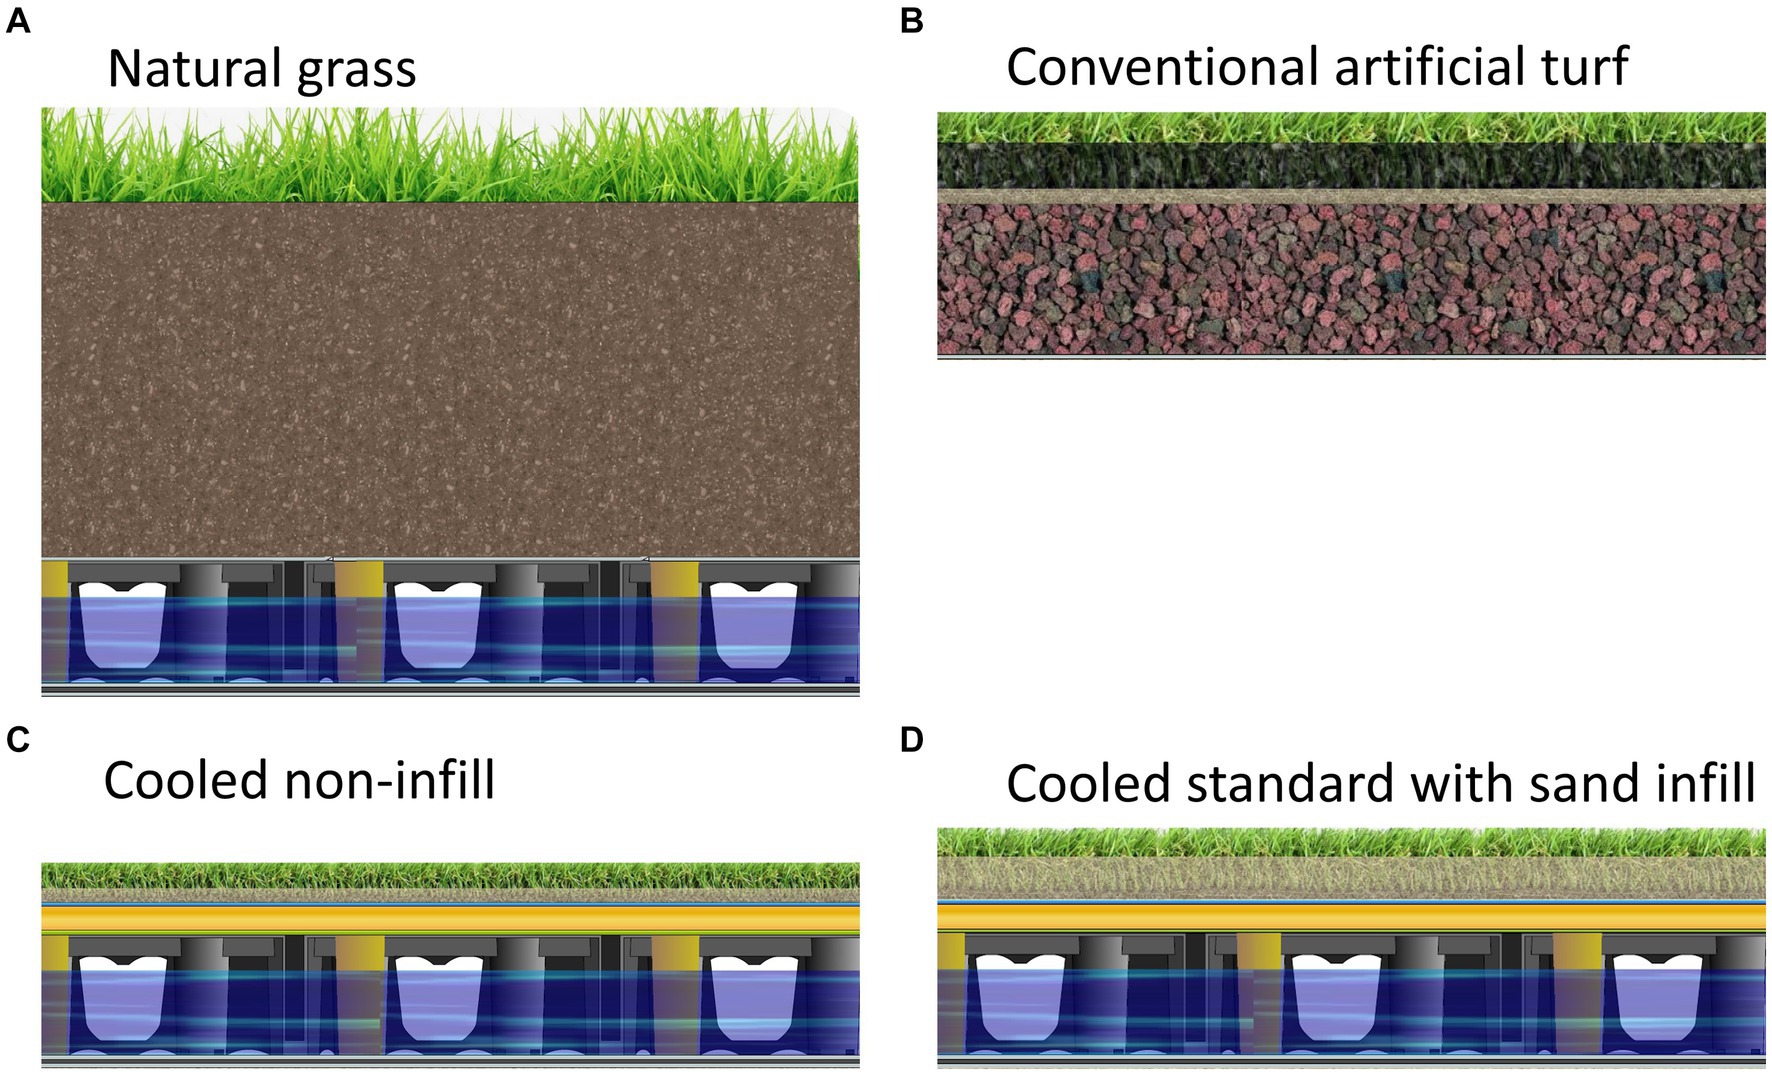
Figure 4. Design of the four research plots: natural grass (A) conventional (B) cooled non-infill (C) and cooled standard (D).
The drainage conditions and storage of water resulted in optimal growth conditions for the natural grass. The maximum water level in the sub-surface water management system below all the plots was set to 50 mm by means of passive overflow.
Each of the four research plots (Figure 5) was equipped with sensors to measure net radiation Rn, surface temperature Ts, air temperature Ta, black globe temperature Tg, actual evaporation Ea and drainage q. The net radiation was measured with net radiometers (NR-Lite2, Kip & Zonen B.V.) installed at a height of 25 cm above the surface, to limit the dominant field of view to the research plots. Surface temperatures were measured using downward facing infrared radiometers at 75 cm above the surface (SI-431-SS, Apogee Instruments). Air temperature and black globe temperature were measured with, respectively, CS 107 thermistors with radiation shield at 75 cm above the surface and Blackglobe_L sensors (Campbell Scientific Inc.).
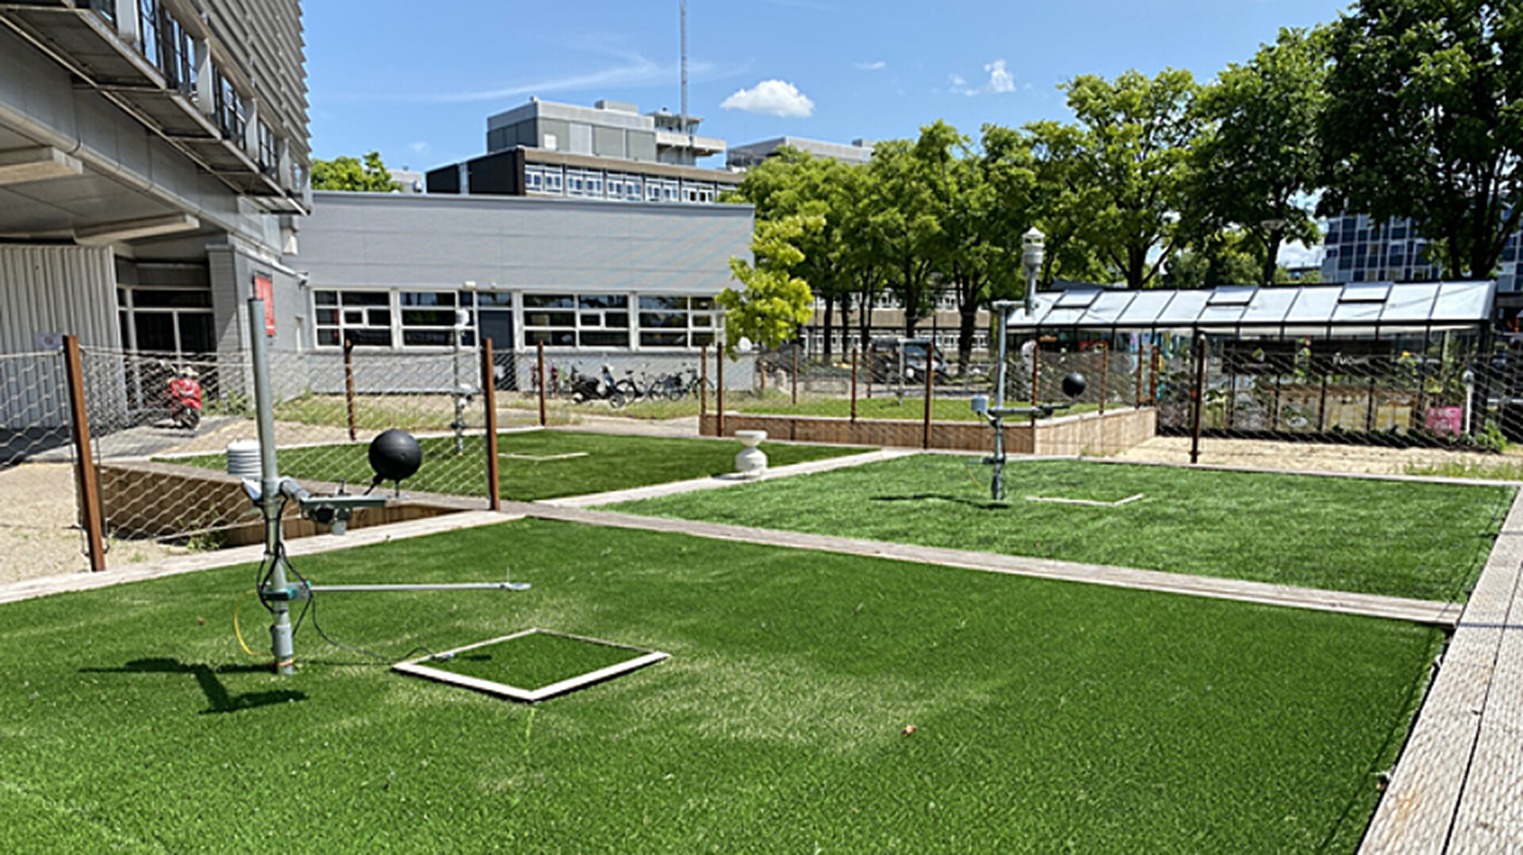
Figure 5. Field site with four research plots in Amsterdam. The plots were positioned to get similar sunshine/shading conditions on the plots.
Within each research plot a weighing lysimeter was installed sunken into the surface of the plots. The lysimeters (Figure 5) consisted of a square stainless-steel bucket of 58 by 58 cm placed on a weighing unit. The structure of the water storage and drainage layer, shockpad and artificial turf or natural grass inside the lysimeter buckets was identical to that of the surrounding plot. In line with this, drainage conditions and water storage in the buckets were kept identical to that of the surrounding plots. The rim of the lysimeter covering the gap between the lysimeter and the surrounding field was covered with a thin layer of cork to limit reflection of sunlight and downwelling longwave radiation onto the net radiometer. The lysimeters were weighed with temperature compensated single point load cells (Utilcell 190i). To increase measurement precision, digitizers (Flintec LDU 68.1) were installed to process and digitize the load cell signals without interference of the datalogger. In this setup, a measurement resolution of 12 g was achieved, i.e., 0.04 mm equivalent water depth, which is adequate for measuring Ea (Jarraud, 2008). Lysimeter data was processed with the Adaptive Window and Adaptive Threshold (AWAT) filter (Peters et al., 2014). Drainage from the lysimeters was measured by installing an ARG100 rain gauge below each lysimeter.
Other meteorological variables such as wind speed and wind direction, relative humidity, ambient air temperature Tam, air pressure and incoming shortwave radiation Rs were measured with an all in one weather station (WS501-UMB, LUFFT), positioned at one central location 150 cm above the field surface. Precipitation P was measured with an on-site rain gauge (ARG100, Campbell Scientific Inc.). Measurements were collected at a 30 s interval, aggregated to 5-min values and logged on a datalogger (CR1000, Campbell Scientific Inc.). Potential evaporation (ET0) was calculated with the Penman-Montheith equation (Allen et al., 1998) using local field data:
Where Rn is net radiation, G is soil heat flux density, T is mean daily air temperature, u2 is wind speed at 2 m height, es is saturation vapour pressure, ea is actual vapour pressure, Δ is slope vapour pressure curve and γ is psychrometric constant. Details of the calculation can be found in Allen et al. (1998).
3 Results
3.1 Lab experiment
Results from the lab experiment with artificial turf in the climate controlled room demonstrated that evaporation from the artificial turf occurred (Figure 6). Mean evaporation for the coarse sand, fine sand and mixed sand infill was similar with, respectively, 2.7, 2.8, and 2.8 mm d−1. These values were close to the mean evaporation from the reference units (2.2 mm d−1). Mean evaporation from the sand infill with EPDM was much lower at 1.0 mm d−1. The layer of EPDM strongly reduced evaporation from the infill and artificial turf (Figure 6). No significant differences were found between the artificial turf types.
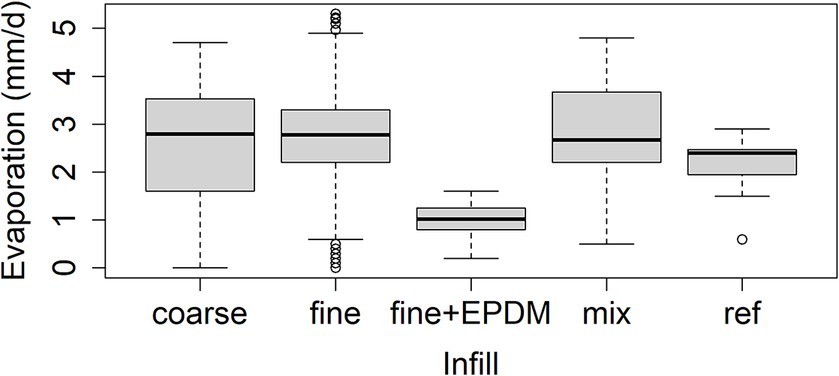
Figure 6. Evaporation from the different infill materials and texture combinations measured in the lab experiment.
3.2 Field experiment
Measurements were conducted during the summer of 2020. Two relatively warm and dry periods that occurred during the measurement period 23–6 till 30–6 and 5–8 till 17–8, will be described in detail (Figure 7). The latter was classified as a heatwave in the Netherlands by the Royal Netherlands Meteorological Institute.
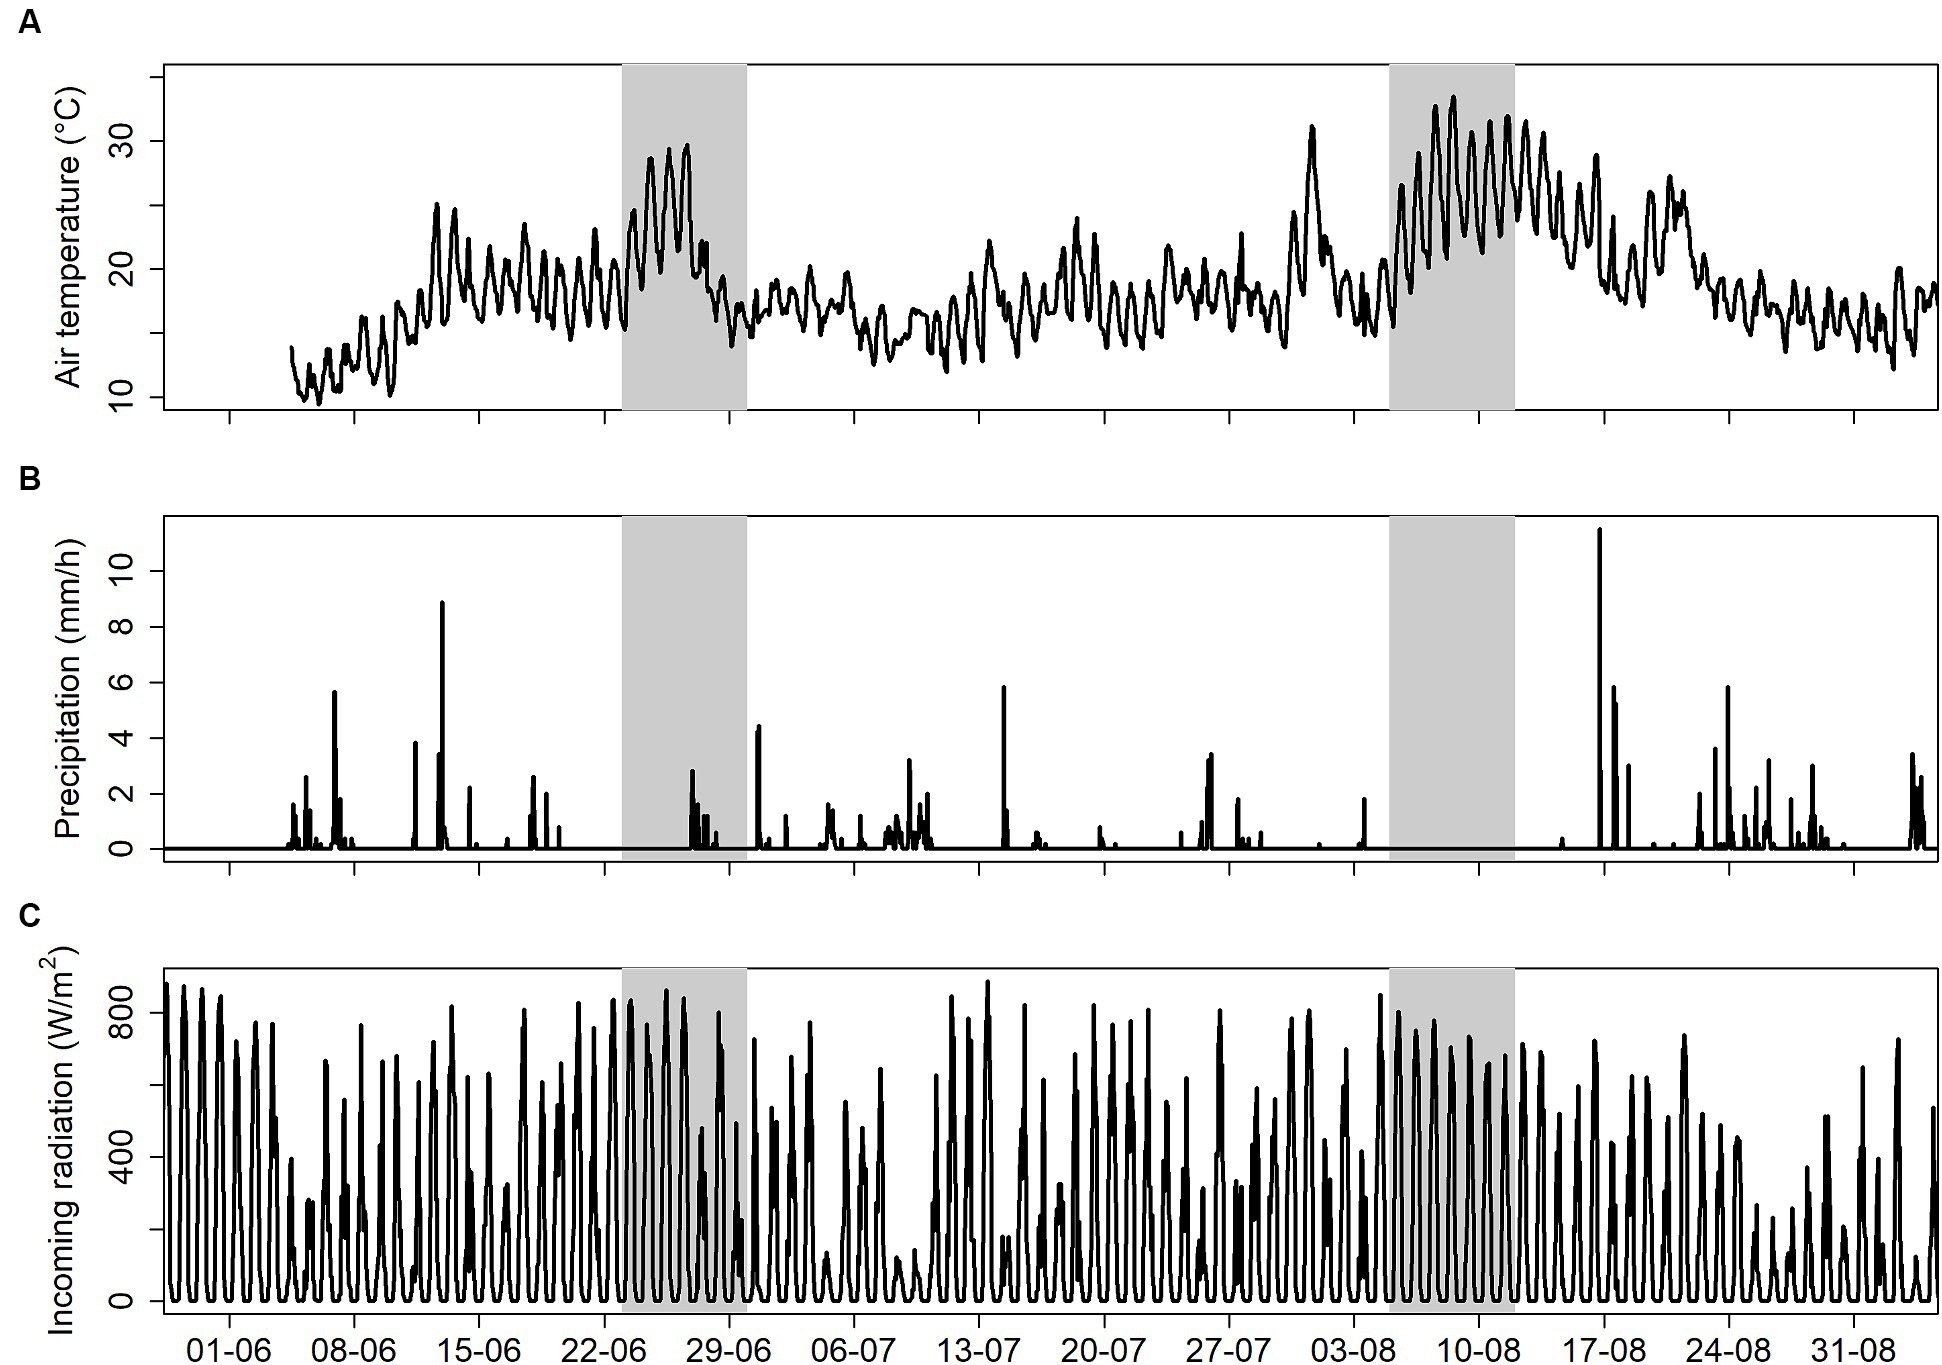
Figure 7. Ambient air temperature (A), precipitation (B) and incoming radiation (C) measured at the field site during summer 2020. The two specific warmer periods are indicated in grey.
Large differences in surface temperature were found during these periods between the measurement plots (Figure 8). The conventional artificial turf with SBR-infill reached the highest surface temperatures up to 67.7°C. There were multiple days on which the surface temperature was higher than 50°C, potentially leading to health problems (Williams and Pulley, 2003). The natural grass had the lowest maximum surface temperature of 46.8°C. The cooled artificial turf plots had higher surface temperatures than the natural grass, but much lower surface temperatures than the conventional artificial turf. Unfortunately, there were technical issues with the surface temperature sensor at the cooled standard infill plot during the August heatwave, causing it to register erroneous temperature values much lower than that of natural grass. These measurements were discarded from the dataset and the sensor was replaced. However, based on all measured temperatures during the summer, it could be assumed that the surface temperature of the cooled standard infill plot turf was always between the temperature of the cooled non-infill turf and that of natural grass.
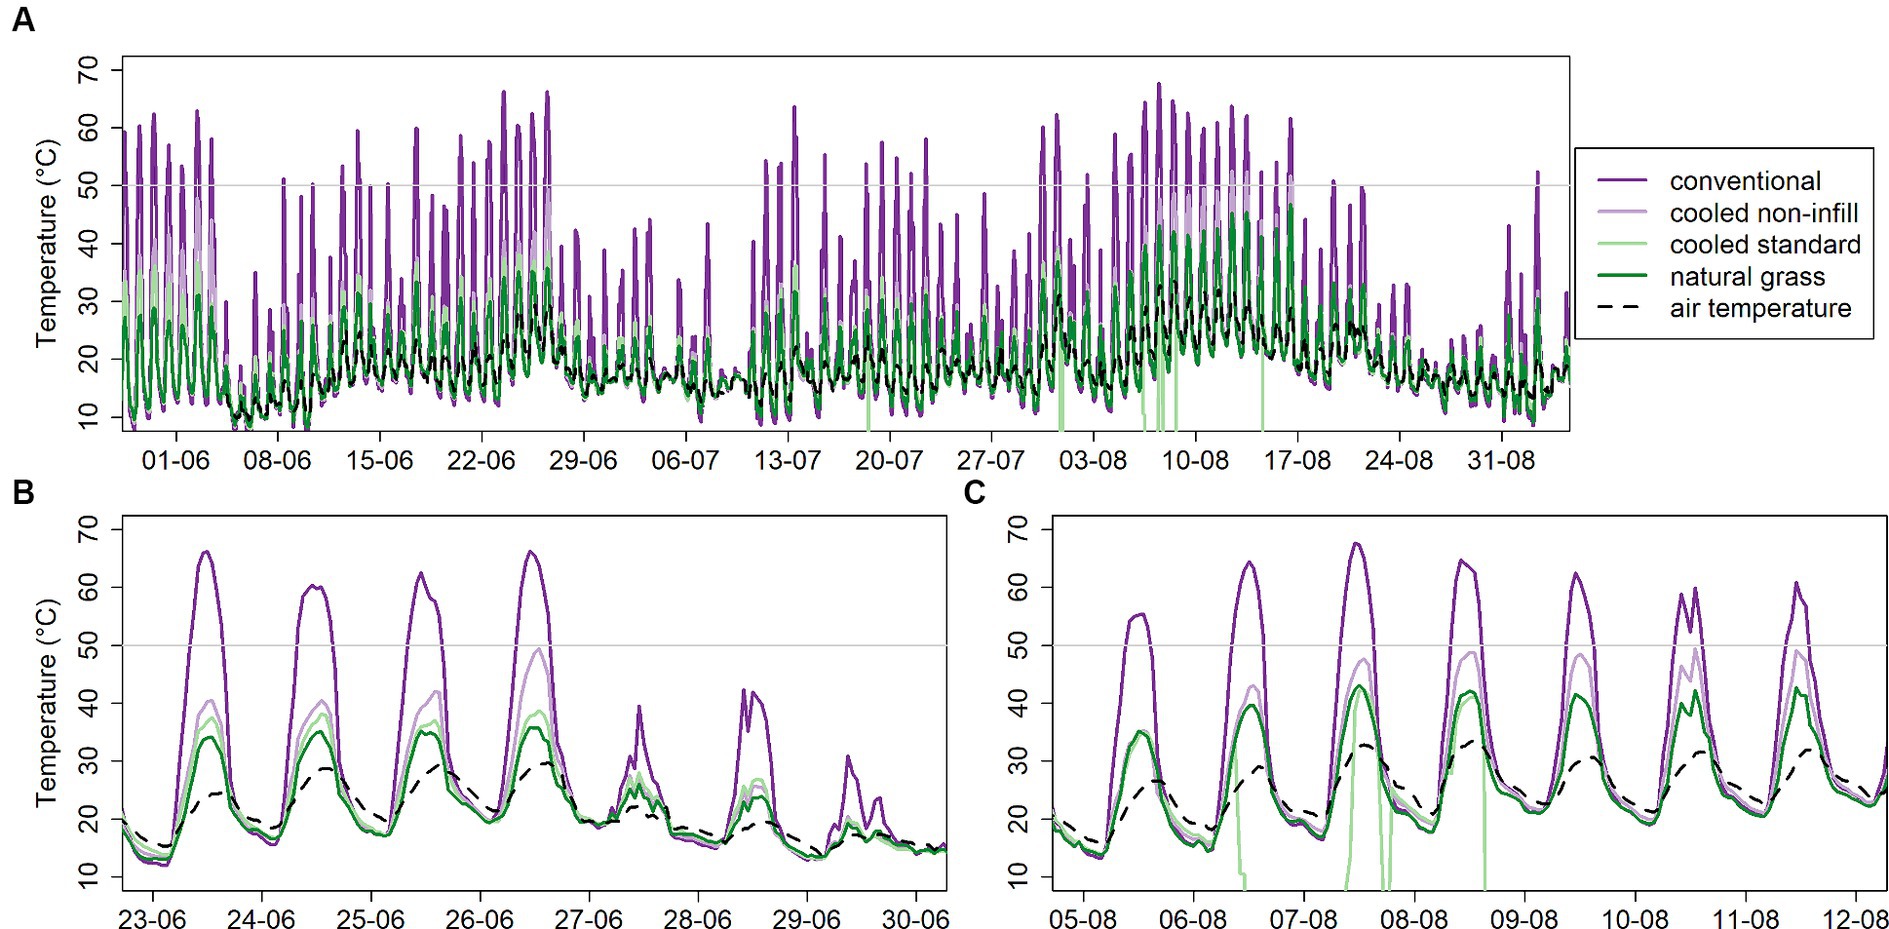
Figure 8. Air temperature and surface temperature at the four plots during the summer of 2020 (A) and two specific warmer periods (B,C).
On the 25th of June, roughly the middle of the June heatwave, the cooled standard artificial turf reached a temperature of 37°C, whereas the conventional artificial turf reached 62.5°C, meaning there was a difference of more than 25°C. The surface temperature at the cooled artificial turf was only 1.7°C higher than at the natural grass (35.3°C).
Surface temperature is strongly related with incoming radiation. Days when the maximum surface temperature of the conventional artificial turf exceeded 25°C were selected and a linear regression model was fitted to surface temperature and incoming radiation. Note that the dataset with surface temperatures from the cooled standard plot had less datapoints due to issues with the sensor during part of the summer (no data between August 6 and August 18) as mentioned earlier. Significant differences between the temperature of the conventional artificial turf and the temperature of the cooled artificial turf and natural grass were found (Figure 9). When incoming radiation exceeded 500 W m−2, the surface temperature of cooled non infill artificial turf became significantly higher than that of natural grass (Figure 9). The surface temperature of cooled standard artificial turf only significantly differed from natural grass for radiation values above 750 W m−2. Please note that this regression missed 12 datapoints from the August heatwave as mentioned earlier. As a result, the gradient of the regression line might be slightly underestimated.
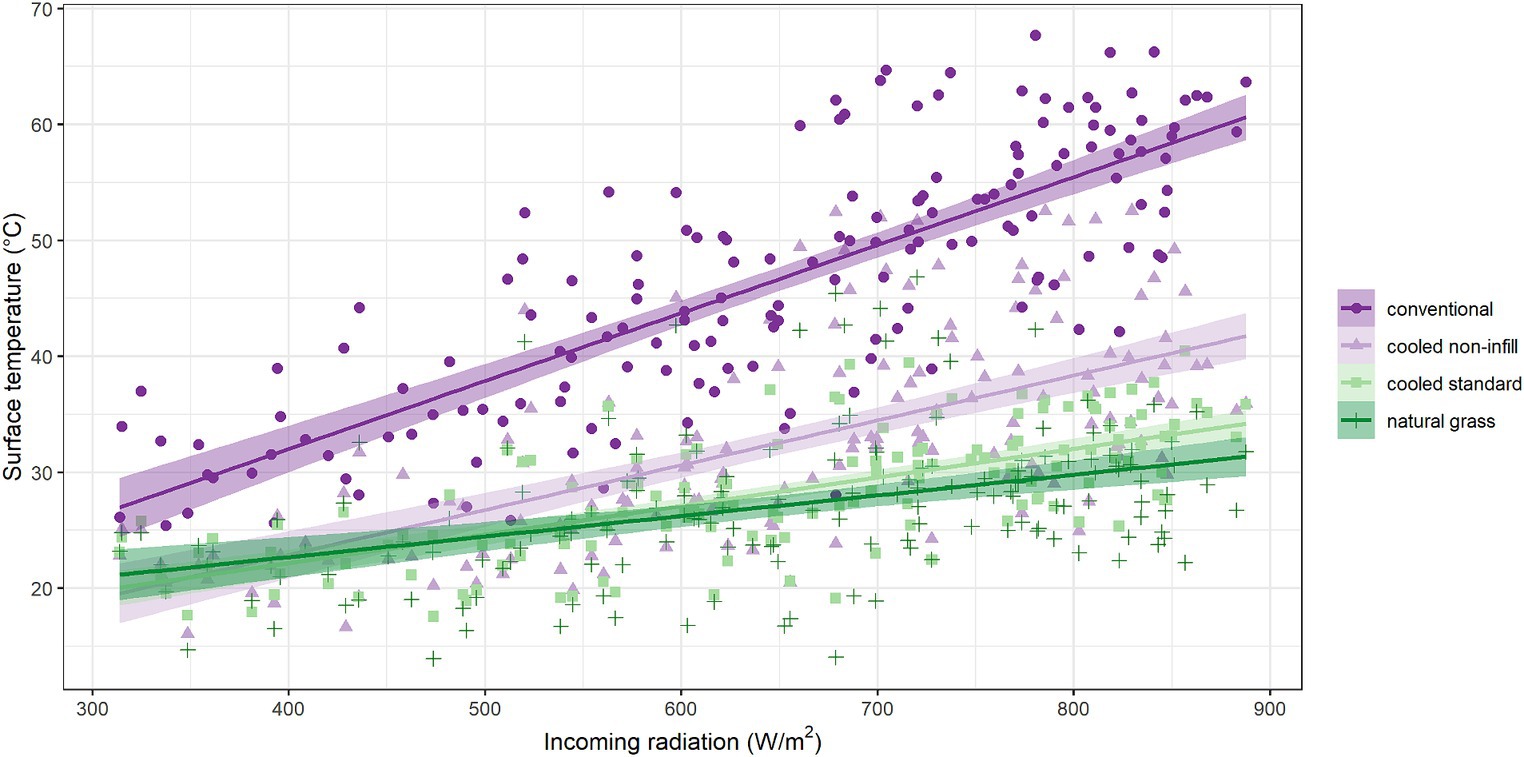
Figure 9. Relation between surface temperature and incoming radiation for the different plots. Individual daily measurements and fitted linear regression models with 95% confidence intervals.
The difference in surface temperature was linked to differences in evaporation (Figure 10). Evaporation from the conventional artificial turf was very low during the entire summer period (1-6-2020 till 1-9-2020). Evaporation from cooled artificial turf was very similar for the two plots and reached a maximum of 4 mm d−1 at the non-infill plot. Evaporation from the natural grass reached potential evaporation or even exceeded the estimated potential evaporation. The measured actual evaporation reached a maximum of 7.3 mm d−1 on a high incoming radiation and low humidity day. The exceedance of the potential evaporation might be attributed to uncertainties in the measurements and uncertainty in the estimation of the potential evaporation itself. However, these deviations can also be attributed to the inflow of warm air from the surrounding paved urban area. This warm air can be regarded as an additional energy source for evaporation, resulting in a process similar to advective edge effects and oasis effects (Spronken-Smith et al., 2000; Vivoni et al., 2020).
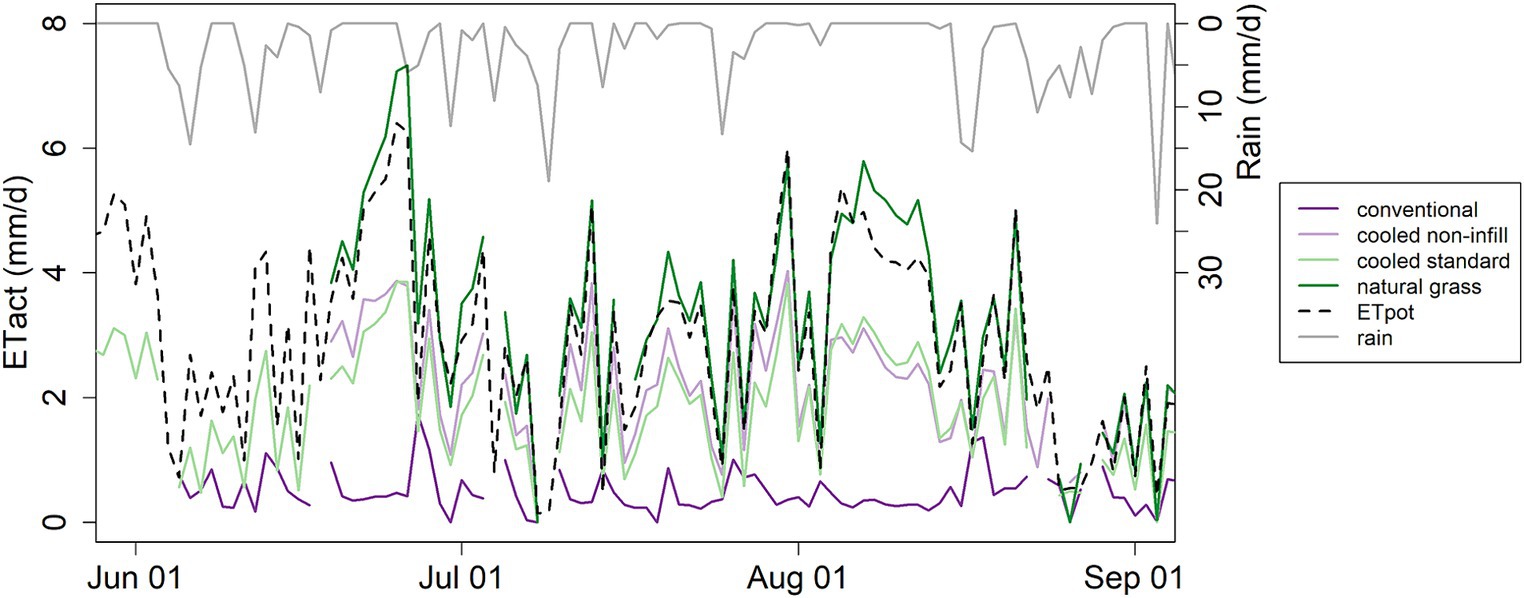
Figure 10. Rain, potential and actual evaporation for the four plots during the summer of 2020.
Evaporation from the conventional plot reached a maximum of only 1.7 mm d−1. During the heatwave in August, evaporation from the natural grass was on average 4.3 mm d−1, whereas evaporation from the cooled artificial turf was on average 2.2 mm d−1 (non-infill) and 2.4 mm d−1 (standard). Even with the lower amount of evaporation, the surface temperature at the cooled non-infill artificial turf plot was only 6.6°C higher than at the natural grass plot and 16°C lower than the conventional plot on August 8, which implicates less water is needed to reach a similar temperature for the artificial turf than for natural grass.
To estimate the impact of capillary irrigation and evaporation on the air temperature above the plot, air temperatures were measured at a height of 75 cm. These temperatures were compared with air temperature measured at the central location at 150 cm height which is considered to reflect the ambient temperature. The difference reached a maximum of 2.5°C at the conventional artificial turf and a maximum of 1.3°C for the cooled artificial turf plots (Figure 11). Overall, temperature differences were found to be highest at the conventional artificial turf plot. Above the natural grass plot air temperatures also reached higher values compared to ambient air temperature with a maximum difference of 2°C, but during the August heatwave there were also several days on which the temperature above the natural grass was lower than the general air temperature. To alleviate the negative effects of the urban heat island, reducing nighttime temperatures is of the upmost importance. The conventional artificial turf showed consistent higher temperatures during day and night, where the cooled artificial turf systems cooled back down to the level of natural grass. Even though differences were small, this can be seen as a first indication of reduced urban heat island contribution during the night by cooled artificial turf systems.
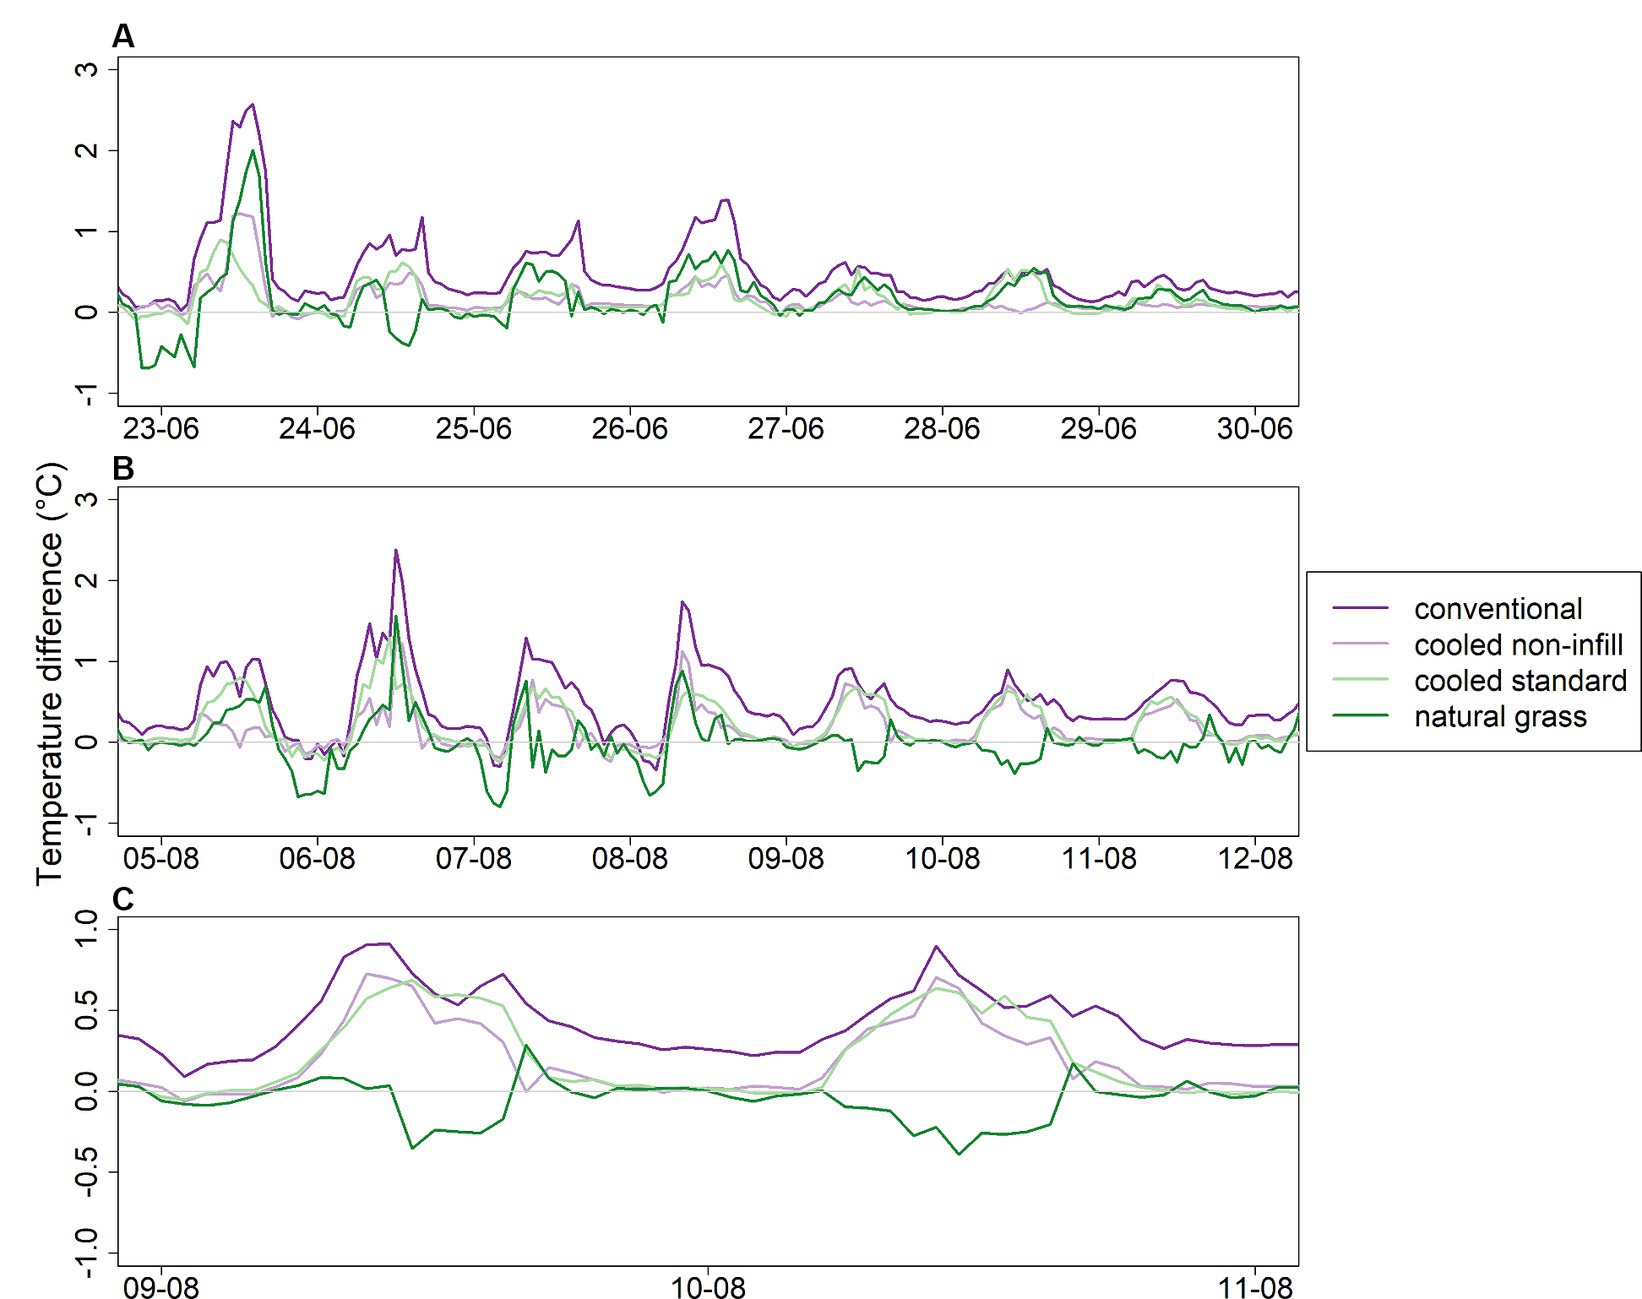
Figure 11. Differences in air temperature between the four plots measured at 0.75 m height and the ambient air temperature measured at 1.5 m during the two specific warmer periods (A,B) and in detail for 9–10 August (C).
The water storage units underneath the field also played an important role in managing water availability. By storing rainwater, off-site drainage was reduced and water remained available for evaporative cooling. During the summer (1-6-2020 to 31-8-2020), the total precipitation at the field sites was 262.8 mm. In this period 96.5% of the precipitation was stored and reused by the natural grass (Figure 12). Irrigation of the natural grass plot did not take place during this period. From the conventional artificial turf most precipitation was drained, as only 13.8% of the water was stored and evaporated (Figure 12). The cooled non-infill artificial turf stored 83.8% of the precipitation, which was used for the evaporative cooling. The plot with the standard infill artificial turf stored and evaporated slightly less water (69.6%). This difference was also visible in the measured actual evaporation with the exception of a period in August where evaporation was higher at the cooled standard plot. Refilling of the used sub-surface water storage system was not needed.
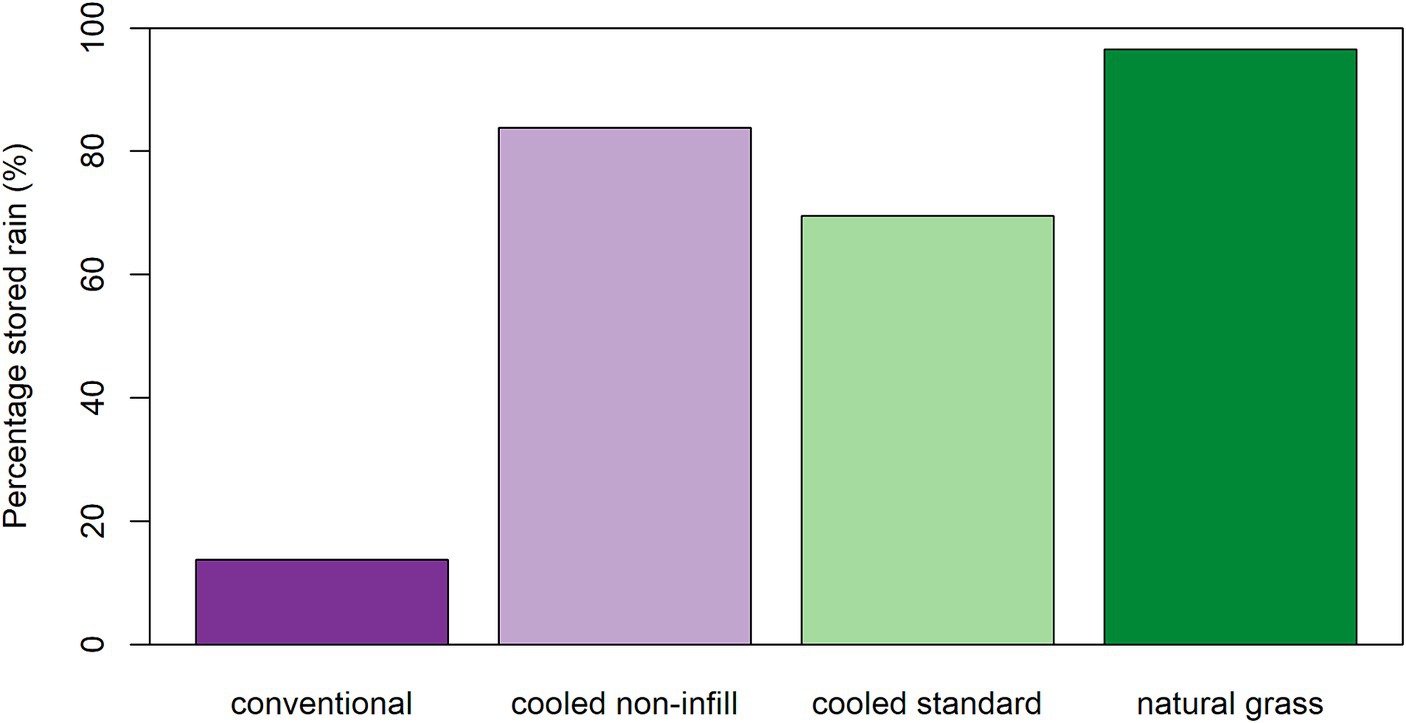
Figure 12. Percentage of rain stored in the system between 1-6-2020 and 31-8-2020 for the four plots.
4 Discussion
Temperature differences between the plots correspond well to findings in other studies that have found significantly higher surface temperatures for artificial turf than for natural grass (e.g., Kandelin et al., 1976; Jim, 2017). The very high surface temperature of the conventional artificial turf can be explained by the build-up of the conventional plot, a foundation of 10 cm lava granulate on a sand bed, a tufted artificial turf rug with latex backing and an infill of 10 mm sand and 20 mm black crumb rubber. Studies have indicated that type of infill has a significant effect on surface temperature and that black rubber granulate infill reaches the highest temperatures (Petrass et al., 2014; Villacañas et al., 2017). The results of the conventional artificial turf should therefore be considered as a worst-case. Penn State’s Center for Sports Surface Research concluded that, although differences between infills were found, none of the combinations led to a substantial reduction in surface temperature compared to the black crumb rubber infill (Penn State’s Center for Sports Surface Research, 2012). So, differences between the cooled artificial turf and other types of conventional turf are likely to be smaller, but capillary fed surface evaporation will still result in a substantial reduction of surface temperature.
Besides the differences in surface temperature, there were also effects on the air temperature above each plot. The air temperature at 75 cm above natural grass was close to or even lower than the ambient temperature measured during several days. During these days solar energy is predominantly used for evapotranspiration and not for warming up the surface or the air layer above it. At the conventional artificial turf plot, however, the temperature of the air layer above the plot is warmer than ambient temperature. This finding is in line with observations at sports fields of the university of Hong Kong (Jim, 2017). Interestingly, the air layer above the conventional artificial turf stayed warmer during night-time too, whilst above both natural grass and cooled artificial turf the temperature of the air layer became equal to the ambient temperature. It was, however, difficult to determine how significant these differences in air temperature are given the small scale of the plots (5x5m) and the close proximity of the plots to paved areas and buildings. When implementing the cooled artificial turf on actual sport fields, effects are likely to be larger. This remains an area for further research.
To achieve lower surface temperatures in artificial turf sports systems, the system needs enough water to evaporate. During the summer of 2020 at the location of our field experiment there was enough precipitation (262.8 mm) to maintain the required evaporation without irrigation. In drier climates this might not be the case, which means irrigation would be required. However, this is also the case for natural grass and conventional artificial turf that needs to be irrigated to cool down. Our results showed that surface temperatures of capillary irrigated artificial turf can be controlled using less water than natural grass, but these results are very climate dependent. Which type of field and design is most water sensitive in other situations cannot be quantified based on this study. There are many developments in the production of artificial turf systems that can help optimize the capillary water use of the cooled fields by using different heights of the system, different jarns and backing materials, or other infills. More research is needed to find to best combinations for each climate and desired playing conditions.
The investment needed for a cooled standard field is higher than for a conventional field. This investment, however, allows the pitch to become part of the on-site water management regime and forms a cooler and safer pitch for the athletes, based on natural evaporation of retained (instead of drained) rainwater. The longevity and maintenance regime of the pitch itself is expected to be comparable to that of other sand infill artificial turf pitches. It is up to the owner of the pitch to determine how much monitoring and control infrastructure is required. This can range from basic water level monitoring and, when required, automated refill during drought, to fully algorithm controlled on-line sensoring and reporting. Regular check-ups and maintenance (in this project once a year) of these systems is advisable to ensure proper operation year-round.
5 Conclusions and outlook
The results show that the water storage and capillary fed artificial turf system is successful in providing ample water for cooling by surface evaporation. Through evaporation the surface temperature of the fields was significant lowered when compared to the conventional artificial turf and approached the values of natural grass. This reduction in surface temperature is important to safeguard the athlete’s health and maintain playable conditions. During the summer of 2020 the surface temperature of the cooled artificial fields only sporadically exceeded the 50°C threshold above which health damage can occur. The conventional plot on the other hand exceeded the threshold multiple days. In addition, the water storage below the cooled artificial turf fields was capable of detaining up to 4 times more rainwater for later evaporative cooling when compared with conventional artificial turf. The system also showed potential to decrease the urban heat island effect by lowering air temperatures (day and night) when compared with the conventional plot, however, given the small scale of the field plots, the significance of the urban heat island reduction potential is hard to quantify. By combining stormwater management and evaporative cooling, the cooled artificial turf creates favourable and healthy playing conditions and offers cities the opportunity to use sports pitches as a multifunctional tool to become climate adaptive and water circular.
In the field of product development and sustainability, it is necessary to further develop artificial turf systems aimed at facilitating water transport through the backing and which are easier to recycle. Currently approved sport-technical testing methods to assess artificial turf safety and playability need to be adjusted to encompass capillary cooled systems as well, because they respond differently than conventional systems due to their water content and can possibly show different responses with differing volumetric water content rates.
To improve the incorporation of climate adaptation in urban artificial turf sport systems, further research is required. When sports fields are seen as an integral part in water management of sport parks, it becomes necessary to further assess the water balance of whole sport parks, including other (types of) fields and the buildings present, in light of rainwater harvesting for other uses and finding other sources of safe and usable water to supplement the field during drought, aiming at minimizing the park’s discharge of rainwater and usage of drinking water by further closing the on-site water cycle. Future research could also focus on decreasing the vulnerability of natural grass pitches by improvement of grass strength by sustainable reinforcement methods and of grass growth through improved drainage and irrigation.
Data availability statement
The datasets presented in this study can be found in online repositories. The names of the repository/repositories and accession number(s) can be found below: 10.4121/0009e400-e620-45fb-8d7e-3b72a7be88bb.
Author contributions
MH: Writing – original draft, Visualization, Investigation, Formal analysis, Data curation. DC: Writing – original draft, Methodology, Investigation, Formal analysis, Conceptualization. JV: Writing – review & editing, Methodology, Conceptualization.
Funding
The author(s) declare financial support was received for the research, authorship, and/or publication of this article. This research was financed with PPS-funding from the Topconsortia for Knowledge & Innovation (TKI’s) of the Ministry of Economic Affairs and Climate (The Netherlands).
Acknowledgments
We thank our project partners the City of Amsterdam, Waternet, Veolia, Drain Products Europe, DutchBlue and Marineterrein Amsterdam for establishing the research site and collaboration in the project.
Conflict of interest
The authors declare that the research was conducted in the absence of any commercial or financial relationships that could be construed as a potential conflict of interest.
Publisher's note
All claims expressed in this article are solely those of the authors and do not necessarily represent those of their affiliated organizations, or those of the publisher, the editors and the reviewers. Any product that may be evaluated in this article, or claim that may be made by its manufacturer, is not guaranteed or endorsed by the publisher.
References
Allen, R. G., Pereira, L. S., Raes, D., and Smith, M. (1998). Crop evapotranspiration-guidelines for computing crop water requirements-FAO irrigation and drainage paper 56. FAO, Rome 300, D05109.
Carvalho, H. D. R., Chang, B., McInnes, K. J., Heilman, J. L., Wherley, B., and Aitkenhead-Peterson, J. A. (2021). Energy balance and temperature regime of different materials used in urban landscaping. Urban Clim. 37:100854. doi: 10.1016/j.uclim.2021.100854
Cheng, H., Hu, Y., and Reinhard, M. (2014). Environmental and health impacts of artificial turf: a review. Environ. Sci. Technol. 48, 2114–2129. doi: 10.1021/es4044193
Cirkel, D. G., Voortman, B. R., Van Veen, T., and Bartholomeus, R. P. (2018). Evaporation from (blue-)green roofs: assessing the benefits of a storage and capillary irrigation system based on measurements and modeling. Water 10:1253. doi: 10.3390/w10091253
Devitt, D., Young, M., Baghzouz, M., and Bird, B. (2007). Surface temperature, heat loading and spectral reflectance of artificial turfgrass. J. Turfgrass Sports Surf. Sci 83, 68–82.
Fleming, P. (2011). Artificial turf systems for sport surfaces: current knowledge and research needs. Proc. Inst. Mech. Eng. Part P 225, 43–63. doi: 10.1177/1754337111401688
Howe, A. S., and Boden, B. P. (2007). Heat-related illness in athletes. Am. J. Sports Med. 35, 1384–1395. doi: 10.1177/0363546507305013
Hylkema, C. (2018). Amsterdam in cijfers 2018. Amsterdam: Onderzoek, Informatie en Statistiek Amsterdam.
Jarraud, M. (2008). Guide to meteorological instruments and methods of observation (WMO-no. 8). Geneva, Switzerland 29: World Meteorological Organisation.
Jim, C. Y. (2017). Intense summer heat fluxes in artificial turf harm people and environment. Landsc. Urban Plan. 157, 561–576. doi: 10.1016/j.landurbplan.2016.09.012
Kanaan, A., Sevostianova, E., Leinauer, B., and Sevostianov, I. (2020). Water requirements for cooling artificial turf. J. Irrig. Drain. Eng. 146:05020004. doi: 10.1061/(ASCE)IR.1943-4774.0001506
Kandelin, W. W., Krahenbuhl, G. S., and Schacht, C. A. (1976). Athletic field microclimates and heat stress. J. Saf. Res. 8, 106–111.
Klein, B., Alberts, R., Van Kranendonk, N., Jelies, R., Penninx, N., and Krieger, K. (2019). Kunstgrasnota concept, over de toepassing van kunstgras op de Amsterdamse sportparken (artificial turf note, about the implementation of artificial turf on sportfields in Amsterdam). Amsterdam: Directie Sport en Bos gemeente Amsterdam.
Lim, L., and Walker, R. (2009). An assessment of chemical leaching: Releases to air and temperature at crumb-rubber infilled synthetic turf fields : New York State Department of Environmental Conservation.
Liu, Z., and Jim, C. Y. (2021). Playing on natural or artificial turf sports field? Assessing heat stress of children, young athletes, and adults in Hong Kong. Sustain. Cities Soc. 75:103271. doi: 10.1016/j.scs.2021.103271
Makkink, G. F. (1957). Testing the penman formula by means of lysimeters. J. Inst. Water Eng. 11, 277–288.
McNitt, A. S. (2005). Synthetic turf in the USA–trends and issues. Int. Turfgrass Soc. Res. J. 10, 27–33.
McNitt, A. S., and Petrunak, D. M. (2007). Evaluation of playing surface characteristics of various in-filled systems. Available at: http://plantscience.psu.edu/research/centers/turf/extension/factsheets/playing-surfaces
McNitt, A. S., Petrunak, D. M., and Serensits, T. J. (2008). Temperature amelioration of synthetic turf surfaces through irrigation. ActaHortic 783, 573–582. doi: 10.17660/ActaHortic.2008.783.59
Penn State’s Center for Sports Surface Research (2015). "The Effect of irrigation on synthetic turf—surface temperature, soccer ball roll, traction — progress report".).
Penn State’s Center for Sports Surface Research (2012). "Synthetic Turf Heat Evaluation – Progress Report".).
Peters, A., Nehls, T., Schonsky, H., and Wessolek, G. (2014). Separating precipitation and evapotranspiration from noise – a new filter routine for high-resolution lysimeter data. Hydrol. Earth Syst. Sci. 18, 1189–1198. doi: 10.5194/hess-18-1189-2014
Petrass, L. A., Twomey, D. M., and Harvey, J. T. (2014). Understanding how the components of a synthetic turf system contribute to increased surface temperature. Procedia Eng. 72, 943–948. doi: 10.1016/j.proeng.2014.06.159
Petrass, L. A., Twomey, D. M., Harvey, J. T., Otago, L., and LeRossignol, P. (2015). Comparison of surface temperatures of different synthetic turf systems and natural grass: have advances in synthetic turf technology made a difference. Proc. Inst. Mech. Eng. Part P 229, 10–16. doi: 10.1177/1754337114553692
Pfautsch, S., Wujeska-Klause, A., and Walters, J. (2022). Outdoor playgrounds and climate change: importance of surface materials and shade to extend play time and prevent burn injuries. Build. Environ. 223:109500. doi: 10.1016/j.buildenv.2022.109500
Philip, S. Y., Kew, S. F., Van der Wiel, K., Wanders, N., and Van Oldenborgh, G. J. (2020). Regional differentiation in climate change induced drought trends in the Netherlands. Environ. Res. Lett. 15:094081. doi: 10.1088/1748-9326/ab97ca
Spronken-Smith, R. A., Oke, T. R., and Lowry, W. P. (2000). Advection and the surface energy balance across an irrigated urban park. Int. J. Climatol. 20, 1033–1047. doi: 10.1002/1097-0088(200007)20:9<1033::AID-JOC508>3.0.CO;2-U
Villacañas, V., Sánchez-Sánchez, J., García-Unanue, J., López, J., and Gallardo, L. (2017). The influence of various types of artificial turfs on football fields and their effects on the thermal profile of surfaces. Proc. Inst. Mech. Eng. Part P 231, 21–32. doi: 10.1177/1754337115624819
Vivoni, E. R., Kindler, M., Wang, Z., and Pérez-Ruiz, E. R. (2020). Abiotic mechanisms drive enhanced evaporative losses under urban oasis conditions. Geophys. Res. Lett. 47:e2020GL090123. doi: 10.1029/2020GL090123
Voeten, J., Van de Werken, L., and Newman, A. P. (2016). “Demonstrating the use of below-substrate water storage as a means of maintaining green roofs-performance data and a novel approach to achieving public understanding” in World environmental and water resources congress. Eds. C. S. Pathak and D. Reinhart (FL, USA: ASCE library: West Palm Beach), 12–21. doi: 10.1061/9780784479841.002
Williams, F. C., and Pulley, G. E. (2003). Synthetic surface heat studies [online]. Brigham Young University. Available at: http://cahe.nmsu.edu/programs/turf/documents/brigham-young-study.pdf (Accessed 2-3-2023).
Keywords: climate adaptation, artificial turf, surface temperature, evaporation, urban heat island effect, sport fields
Citation: van Huijgevoort MHJ, Cirkel DG and Voeten JGWF (2024) Climate adaptive solution for artificial turf in cities: integrated rainwater storage and evaporative cooling. Front. Sustain. Cities. 6:1399858. doi: 10.3389/frsc.2024.1399858
Edited by:
Md Maruf Mortula, American University of Sharjah, United Arab EmiratesReviewed by:
Peiman Kianmehr, American University in Dubai, United Arab EmiratesHusnain Haider, Qassim University, Saudi Arabia
Copyright © 2024 van Huijgevoort, Cirkel and Voeten. This is an open-access article distributed under the terms of the Creative Commons Attribution License (CC BY). The use, distribution or reproduction in other forums is permitted, provided the original author(s) and the copyright owner(s) are credited and that the original publication in this journal is cited, in accordance with accepted academic practice. No use, distribution or reproduction is permitted which does not comply with these terms.
*Correspondence: Marjolein H. J. van Huijgevoort, TWFyam9sZWluLnZhbi5odWlqZ2V2b29ydEBrd3J3YXRlci5ubA==