 Niall Byrne
 Susan Pierce
- Integrated Environmental Solutions R&D Limited, Dublin, Ireland
The European Green Deal (EGD) represents the response of the European Union (EU) to the climate crisis and a strategy to mitigate against climate change and the associated environmental degradation. European Climate Law supports the EGD by setting the legally binding target of climate neutrality for the EU on a time horizon of 2050 and mandates that member states develop and implement their own Climate Action Plans (CAP), which are strategic roadmaps outlining steps to reduce greenhouse gas (GHG) emissions and adapt to the impacts of climate change. Within the Irish context, the CAP focuses on six specific sectors, three of which, namely the energy grid, the built environment and transportation are considered in this research. This policy proposes the retrofitting of all residential buildings in the country to a B2 energy performance certificate (EPC), all public transport and 60% of private vehicles electrified and the full decarbonisation of the electrical grid by 2050. This study aims to implement the targets and goals outlined within CAP 2021 in an urban area of Ireland, specifically a historical city centre. The research leverages digital twin technology developed by IES to model the carbon emissions associated with the built environment, while also incorporating GHG emissions associated with transportation and the grid. Furthermore, CAP scenarios are applied systematically and strategically, prioritising building retrofits based on buildings with similar characteristics, typologies and performance. This study has assessed the performance of CAP about two future grid scenarios (1) business as usual and (2) a decarbonised grid. In both scenarios, CAP was not sufficient to achieve the targets set out, resulting in a shortfall of between 25 and 33%. Based on this outcome it may be concluded that any decarbonisation targets specified should be tested and validated before their implementation in policy. Moreover, current state-of-the-art digital twin technologies can facilitate the rapid holistic appraisal of complex multi-sectoral policy at the urban scale, which, depending on data availability, could prove useful in future iterations of CAP at both national and international levels.
1 Introduction
Anthropogenic climate change is having a significant impact on Earth, driving environmental and social challenges that are being manifested through rising global average temperatures, melting ice and rising sea levels, increased frequency and severity of extreme weather events and changes in ecosystems that lead to biodiversity loss (Intergovernmental Panel on Climate Change, 2021). In order to mitigate the impact of changing climate, it is essential that immediate and far-reaching interventions are taken to reduce greenhouse gas emissions (GHG), particularly those arising from the use of fossil-fuels, to limit global warming to below 2°C and ideally below 1.5°C compared to pre-industrialisation levels.
The Intergovernmental Panel on Climate Change (IPCC) reports that the energy sector is one of the largest sources of global GHG emissions, with much of the world’s electricity still generated through the burning of fossil fuels such as coal, oil and natural gas. A transition to clean, renewable energy sources should be prioritised and implemented, coupled with additional measures such as energy efficiency improvements and the investigation of carbon capture and storage technologies as a means of providing a clean electrical grid. In order to address the manner in which the built environment contributes to climate change, embodied and operational emissions must be considered. Embodied emissions refer to those associated with the manufacturing and transport of building materials as well as the construction process itself and can be mitigated through the mindful specification of sustainable, low-carbon building materials and construction techniques. Operational energy refers to that which is used for heating, cooling, lighting, appliances and processes within the building and can be improved through the implementation of energy efficiency projects (insulation, energy efficient appliances, smart building design, demand side management, etc.) and electrification with clean and renewable supply (use of a heat pump, installation of renewable generating devices, etc.). Similarly, the IPCC (Jaramillo et al., 2022) have identified the transport sector as a major source of GHG emissions, accounting for approximately 15% of GHG emissions and approximately 23% of global energy-related CO2 emissions. Furthermore, transport emissions have been increasing at a faster rate than any other end-use sector in the last few decades, particularly in emerging economies, a trend that is anticipated to continue if no major transition occurs. In the developed world, a large-scale shift to electric vehicles (EVs) is currently ongoing, while governments and transportation authorities are actively promoting active travel or the use of public transportation. It is important to note the interconnectedness of sectors as the transition accelerates and the potential for knock-on impacts occurring in one sector based on a change in another. The move to EVs for example will impact the demand profiles for the electricity grid, and requiring an accelerated adaptation of renewable grid assets.
In response to the recommendations made by the IPCC above, the European Green Deal (EGD) was launched in 2019 as a means to transform the European Union into a climate-neutral and sustainable economy by 2050 (Director-General for Communication, 2021), thus addressing climate change and environmental degradation. In addition to the IPCC report, additional recommendations have been made within the EGD to accelerate the transition to carbon neutrality. One such policy measure is the European Commission (2020), which is a key initiative of the EGD and aims to significantly accelerate the renovation rates of buildings across the EU. European buildings contribute approximately 40% of the total carbon emissions generated within the EU (European Commission and European Climate, Infrastructure and Environment Executive Agency, 2022) and considering that more than 70% of the buildings that will be in operation in 2030 are already in operation (International Energy Agency, 2023) the case for deep building retrofitting in support of climate goals is clear.
The plan itself intends to double the annual energy renovation rate of buildings by 2030 compared to the previous decade, reducing GHG emissions through improved energy performance and reducing energy poverty while supporting and contributing towards the EU’s climate neutrality goals. A secondary impact of the plan is the creation of jobs and boosting of the bloc’s economic growth through investment in the construction and renovation sectors as well as creating healthier, more comfortable and affordable homes, thus improving the living standards and well-being of citizens. The plan focuses on both residential and non-residential buildings but is weighted towards deep renovations, prioritising the most-energy consuming buildings while adopting a holistic approach to emphasize not only energy efficiency but also accessibility, health and digitization in the renovation process.
In support of the goals of the EGD, the European Climate Law sets the legally binding target of climate neutrality for the EU by 2050 and requires member states to develop National Energy and Climate Plans that align with this trajectory (Directorate-General for Communication, 2020). The “Fit for 55” policy package proposes key EU legislation in the energy, transport and climate sectors to align with the 2050 target, driving member states to develop and adjust national plans accordingly (European Commission, 2021b). In line with these ambitions, the Government of Ireland has committed to achieving a 51% reduction in Ireland’s overall GHG emissions between 2021 and 2030 and to achieve net zero by no later than 2050, establishing these goals in a legally binding manner through the Climate Action and Low Carbon Development (Amendment) Act 2021 (Office of the Attorney General, 2021). Under this act, Ireland has developed its Climate Action Plan (CAP) (Department of Environment, Climate and Communications, 2021), which will be updated annually to reflect progress towards the climate neutrality goals, while setting sectoral emissions ceilings to accelerate the transition, although these targets have not been tested or validated through the usage of digital tools before being proposed. In addition to the goals outlined within the national level CAP, each local authority in the country was required to create a Local Area Climate Action Plan (LACAP) that would place the national CAP in the local context, creating tailored, community-driven strategies that align with the broader goals of the CAP (Department of Environment, Climate and Communications, 2023b). At their core, LACAPs typically outline the baseline condition in the region, define targets for specific emission reductions, define mitigation and adaptation strategies, outline financing mechanisms and opportunities and track and evaluate the effectiveness of strategies through a detailed monitoring and evaluation plan. LACAPs are then updated periodically to make necessary adjustments based on the progress towards targets as well as the relative effectiveness of the current strategies.
For the purposes of the work presented within this paper, three sectors within the CAP have been considered, namely the electrical grid, the built environment and transportation. An urban building energy modelling approach has been adopted for the City of Limerick, leveraging the IES iCL toolkit to model energy demand and consumption trends for a large area of the city centre. The baseline energy demand for the city was modelled for the year 2020 and the renovation measures proposed within the CAP were then applied to the city in a systematic manner to evaluate the potential impact of implementing the recommendations of the CAP at city level for the purpose of testing the effectiveness of proposed measures in achieving total decarbonization of the city by 2050.
2 Literature review
2.1 Digital twins and their use in decarbonisation analysis
Digital Twins (DTs) are revolutionising the built environment while facilitating comprehensive investigations of the performance of individual buildings, communities and cities and their proliferation throughout the construction industry is a result of a broader trend towards digitalisation that is having a profound effect on business and society in general (Evans et al., 2017). The use of DT technology in the energy sector is gaining momentum as efforts to optimise energy efficiency and reduce carbon emissions continues to accelerate (Tahmasebinia et al., 2023). The Gemini Principles (Bolton et al., 2018) define a DT as a “realistic digital representation of assets, processes or systems in the built environment.” A true DT is differentiated from any other digital models by its connection to the physical twin. By leveraging data from the physical asset or system, a DT delivers value through enhanced functionalities that support improved decision-making and scenario testing by modelling how the asset is behaving currently and how it will perform in the future (Raj and Surianarayanan, 2020), creating informed feedback to the physical twin and allowing users to conduct “what-if” analyses of their physical assets to determine the impact (either intended or not) of performance related renovation projects on the actual performance before investing in such measures, managing financial and performance risk from the outset. Furthermore, such digital tools can be used to optimise the operation of existing buildings, providing functionality in support of predictive maintenance, enhancement of tenant comfort, optimisation of building design and renovation and enabling closed-loop design to transfer lessons learned from an existing project to a future one, particular when the DT platform is enriched with data recorded by integrated IoT (Khajavi et al., 2019). This integration of DT technology with evolving sensor data, as well as machine learning and AI, is increasing the resolution and applicability of such digital twins, creating use cases that can drive innovation and deliver applications to end users (Qi et al., 2021) Considering the definition and functionality of DTs outlined above, their role in the development of holistic and impactful decarbonisation strategies for the built environment is clear.
The development of a building level digital twin typically commences with the development of a building energy model (BEM) of the targeted building. BEM typically leverages a physics-based software package to simulate the energy performance of a building (US Department of Energy, 2016), using inputs such as the building geometry, materials, lighting, HVAC, refrigeration and other energy consumers, providing energy budgets and facilitating system design and optimisation at the design stage (Gao et al., 2019). Buckley et al. (2021) discussed the role of BEMs as a key facilitating technology in the development and management of energy policy. Such tools leverage physics-based models to accurately simulate energy demand for both generic building types and high-performance buildings, using general information related to the building envelope, systems, occupancy and usage patterns as well as prevailing local weather conditions. The output of these models can then be used to create Energy Performance Certificates, that quantify the energy use intensity of the subject building, facilitating the analysis of the performance of a given building under normal operating conditions. Although a core element of building design and in demonstrating code compliances, the applicability of such digital tools, especially those that enable dynamic simulation modelling is expanding from its traditional usage of optimising building design and validating code compliance into the realm of optimised building operations, portfolio analysis and large-scale urban energy modelling. Such modelling techniques typically involve the simulation of groups of buildings (individual BEMs) across a district or city and allows users to map energy intensity at scale, identifying poorly performing areas within the model and allowing policy makers to develop informed strategic plans to address such inefficiencies. Such models are typically defined as Urban Building Energy Models (UBEMs). According to Araújo et al. (2022), the primary objective of UBEM is to access the energy performance of buildings within an urban context at various spatio-temporal scales. Moreover, the major focus of conventional UBEM is cantered on physical system modelling and simulation to represent the heat transfer dynamics between built forms (Reinhart and Cerezo Davila, 2016), however, computational complexity has limited UBEM approaches in modelling detailed interventions into energy demand calculations with high-temporal granularity. The evolution of computing technology in recent times, has advanced the capabilities of BEM and DT technology to handle high-resolution, spatio-temporal data, providing increased flexibility to modelling methodologies (Chen et al., 2022).
Although BEM and DT technologies share similar functionalities, their usage and applications differ. BEM are typically used during the design phase of a building, where the building is yet to be constructed and, during the period of their use represent a notional asset that does not yet exist in the physical world. In contrast, DTs, by their very definition must connect to a physical twin that actually exists in the real world (Wright and Davidson, 2020). Although there are many different applications and interpretations of DT (including asset based DT, information based DT, ML/AI driven DT, etc.). Wright and Davidson (2020) further argue that the model used in a digital twin need not be a data-driven or AI based model but should produce results that are directly equivalent to a measured quantity, such as energy consumption. The key strength of the DT approach is that it provides an accurate description of how objects and systems change over time, providing a snapshot of system performance at a given moment in time based on the boundaries and constraints based on the system at that moment in time. Although Ramu et al. (2022) note that there is currently no universal framework and technology for the provision of DTs, such assets should be characterised by different design levels and development types required to satisfy various applications across a range of domains. Although their study focuses primarily on AI based DTs, they effectively outline the different level of details that categorise current DT approaches, namely descriptive twins, informative twins, predictive twins, comprehensive twins and autonomous twins. In the application of DT technology at urban scale, sophistication levels are currently bound by the technological capabilities and computing power of existing technology, meaning that urban scale DTs typically adopt the descriptive or informative twin approaches, involving the replication of assets, facilities and systems where the nature of data acquisition is closely specified, while also incorporating sensory data where appropriate and applicable.
An application of urban scale DTs was demonstrated by Zaidi and Haw (2023), who leveraged the iCL DT technology to examine the potential to decarbonise Bertam city in Malaysia, testing the potential to achieve a 33% reduction in carbon by 2030, in line with their government’s environmental goals. Four scenarios were considered, representing the baseline condition, improvements to the building envelope, upgrades of the mechanical systems and finally the integration of solar PV within the city, realising potential energy reductions of approximately 49% and a corresponding carbon reduction of 33% by 2030. The study focused solely on the built environment. Bocullo et al. (2023), leveraged DT technology at the district level to evaluate the potential for deep renovation, energy generation and supply in buildings within an urban block through the integration of RES technologies. Their study concluded that the application of a DT of a city block allowed for more accurate analysis of solutions to provide electricity and heat to the built environment using RES technologies, while also accounting for the impact of shadows by proximity as well as enabling more accurate calculation of available roof area for PV installation.
The modelling of the urban environment can be achieved either through a “top-down” or “bottom-up” approach, facilitating the analysis of energy demand and consumption at scale, with the choice of approach generally being driven by the intended use of the model output as well as the availability and quality of the source data available to develop the DT (Buckley et al., 2021). Top-down approaches seek to disaggregate energy usage data measured at scale (neighbourhood, district or city scale) to individual buildings based on factors such as building type, form, age and occupancy factors (Swan and Ugursal, 2009). The bottom-up approach requires the modelling of each building individually and, as a result, demands a higher resolution and quality of data as well as computational capacity to be completed (Kavgic et al., 2010), however, depending on the source data it can present higher resolution output including Time-series representations of energy demand, consumption and renewable generation where applicable. The acquisition of data process can be greatly expedited through the use of regional and nationally defined templates and archetypes (Reinhart and Cerezo Davila, 2016) that categorize buildings into defined typologies that share similar properties according to their age, construction type and material properties. Although this can reduce the resolution of data at the individual building level, when conducted at scale the overarching trends in energy demand and consumption associated with the building typology and associated stochastic usage of the building generally maintains regional demand and consumption trends at the urban scale.
2.2 Building archetypes and their role in modelling the urban environment
The aforementioned DTs at the urban scale have limited efficacy with respect to standalone buildings. Currently, a bottom-up approach to modelling energy demand and consumption at an urban scale is technologically prohibitive owing to the computational requirements associated with detailed modelling of each individual building within a district. One method of overcoming such a computationally demanding and time-intensive approach is to leverage building archetypes to assign building envelope and HVAC system properties as well as occupancy and behavioral patterns at scale. Archetypes are essentially reference buildings that are representative of a group of buildings which share similar characteristics (Dahlström, 2023). They can be developed using three primary approaches, namely deterministic classification, which involves manually classifying buildings based on known building features (such as building use, year of construction, construction type, etc.), probabilistic classification which divides the building stock using probability distributions of building features, capturing the variations between buildings in a more accurate manner and finally cluster analysis which facilitates the analysis of factors impacting thermal performance of building in parallel and leads to more accurate and un-biased segmentation of the building stock compared to the other approaches (Tardioli et al., 2020).
The use of archetypes to develop complex, large-scale urban building energy models has been successfully demonstrated both in North America and European contexts to facilitate large-scale urban energy modelling. In the North American context, both Farahbakhsh et al. (1998) and Huang and Brodrick (2000) developed and implemented archetypes to simulate energy use in Canada and the United States. The application of archetypes in simulating urban energy consumption has been demonstrated by Heiple and Sailor (2008) and Cerezo Davila et al. (2016) who applied US Department of Energy developed archetypes to run an eQuest based BEM and UBEM for a case-study area in Houston and Boston, respectively. In both cases the simulated building energy use, aggregated across all buildings within the study compared well with the observed data.
The implementation of the Energy Performance of Buildings Directive (European Commission, 2021a) in the European Union was a catalyst for the completion of detailed surveys of the building stock across the member states. Gevorgian et al. (2022) undertook a detailed analysis of these surveys and developed a country by country characterisation of the energy consumption patterns of the entire European building stock, considering factors such as covered floor area, number and type of buildings, final energy consumption, construction materials and methodology for residential, service and other non-residential buildings within the Horizon 2020 funded Hotmaps project As a result of such studies and surveys, the data gathered could be leveraged for the creation of building archetypes for each country in Europe, which could subsequently be used to estimate annual energy demands for heating and cooling while also enabling evaluation of energy conservation measures based on technology and policy instruments being applied to the aggregate building stock as demonstrated by Tardioli et al. (2018), Heeren et al. (2013), and Kavgic et al. (2010). Heeren et al. (2013) leverage Swiss Federal Office of Energy created building archetypes to evaluate a number of energy conservation measures (ECMs) based on existing and future energy savings plans. Similarly, Mata et al. (2013a,b) examined the effectiveness of ECMs at the national scale in Sweden through the use of BEMs and actual weather conditions. This study involved the analysis of 1,400 sample buildings and 12 specific ECMs that were applied to the entire Swedish residential sector through simulations, with an overall reduction in residential energy demand of 53% potentially being realised. The methodology demonstrated in Sweden was subsequently applied to create building archetypes and estimate final energy use for residential and non-residential buildings in Germany, Spain, France and the UK (Mata et al., 2014).
In an Irish context, Famuyibo et al. (2012) and Ali et al. (2018) both leveraged building energy performance certificates from the dwelling energy assessment procedure (DEAP) and clustering techniques to develop building archetypes that were subsequently used to simulate energy use and evaluate energy conservation measures at scale. Similarly, Buckley et al. (2021) leveraged geographic information related to urban layouts and building archetypes from Tabula (Badurek et al., 2012) to create a near complete simulation of a neighbourhood within Dublin. The study concluded that archetypes are of sufficient detail and quality to provide accurate assessment of energy usage at a neighbourhood scale for the purpose of evaluating district-level energy policies, an outcome that is consistent with the findings of Tardioli et al. (2020).
2.3 The Limerick context
The City of Limerick straddles the River Shannon on the west coast of Ireland and is the third most populated city in the Republic of Ireland with a 2022 population of 102,287 (Central Statistics office, 2023), although this is expected to grow to 127,055 by 2028. Limerick City and County Council are the authority responsible for local government in the city, a particular focus of the council’s development plan, and the related activities to promote decarbonisation efforts in the city are cantered around the Georgian Quarter, which was constructed in the late 18th and early 19th centuries and accounts for a relatively large area of the city centre (Reeves, 2023). Despite an economic decline in the district resulting from a lack of investment, the area is currently experiencing a rejuvenation and has been designated a Decarbonization Zone within the council’s Local Authority Climate Action Plan (LACAP). It is this area specifically that has been the primary focus of the research presented within this paper, where the recommendations outlined within the CAP will be modelled and tested through the use of DT technology over a baseline emission level to determine their effectiveness in pursuit of the goal of decarbonisation of the city by 2050.
3 Materials and methods
3.1 An outline of the modelling approach
The analysis conducted in this research was facilitated through the use of DT technology, which was developed using a combination of tools that comprise the Intelligent Communities Lifecycle (ICL), created by Integrated Environmental Solutions (IES) (2023a). At its core, the platform leverages the Virtual Environment (VE), which utilizes its physics-based engine to undertake dynamic simulation models, facilitating the initial development of a baseline model of the Georgian Quarter within Limerick City, and subsequently the testing and validation of the impact of strategies and measures intended to contribute towards the council’s decarbonisation efforts, driven by both the national and local authority Climate Action Plans. Primarily, the analysis leveraged the Intelligent Community Design (iCD) platform, enabling the easy creation and simulation of energy and resource consumption from buildings at the city scale. A detailed network-level analysis was then completed using the Intelligent Virtual network platform, allowing for the simulation of electricity and natural gas demand within a nodal-based model to assess the impact of future decarbonisation interventions on the network infrastructure within the city [Integrated Environmental Solutions (IES), 2023b]. In addition, the potential impact of renewable energy integrations within the city and in particular its generation potential over time was modelled and analysed. The Intelligent City Information Model (iCIM) was subsequently leveraged as a visualization and communication tool to disseminate the final roadmap amongst stakeholders of the project. The final output of this tool was informed through consultation with research consultants, project partners and a number of key stakeholders who had been engaged throughout the process, thus facilitating a collaborative approach to development and ensuring that impact of the final tool could be maximised by the local authority through the communication of their plans to a wider audience, both within the city and at a national and European scale.
3.2 Building modelling and data collection
Development of Digital Twins, particularly at the district scale, involves the collection of a disparate and extensive catalogue of data from numerous publicly accessible and confidential databases and resources. In this case, the core data required for development of the model was identified within two scales, namely district level and building level. At the district scale, which comprised an area amounting to approximately 30 city blocks, a collection of materials was provided to IES by LCCC, and this was coupled with data extracted from public databases, including those provided by SEAI (2019) and Gevorgian et al. (2022), which provided the modelling team with a strong foundation upon which the initial physics-based models could be created, leveraging published information and reasonable, informed assumptions where relevant data is not included. Key amongst this data was a Shapefile (Figure 1) of the City centre that contained building locations, geometries and end uses.
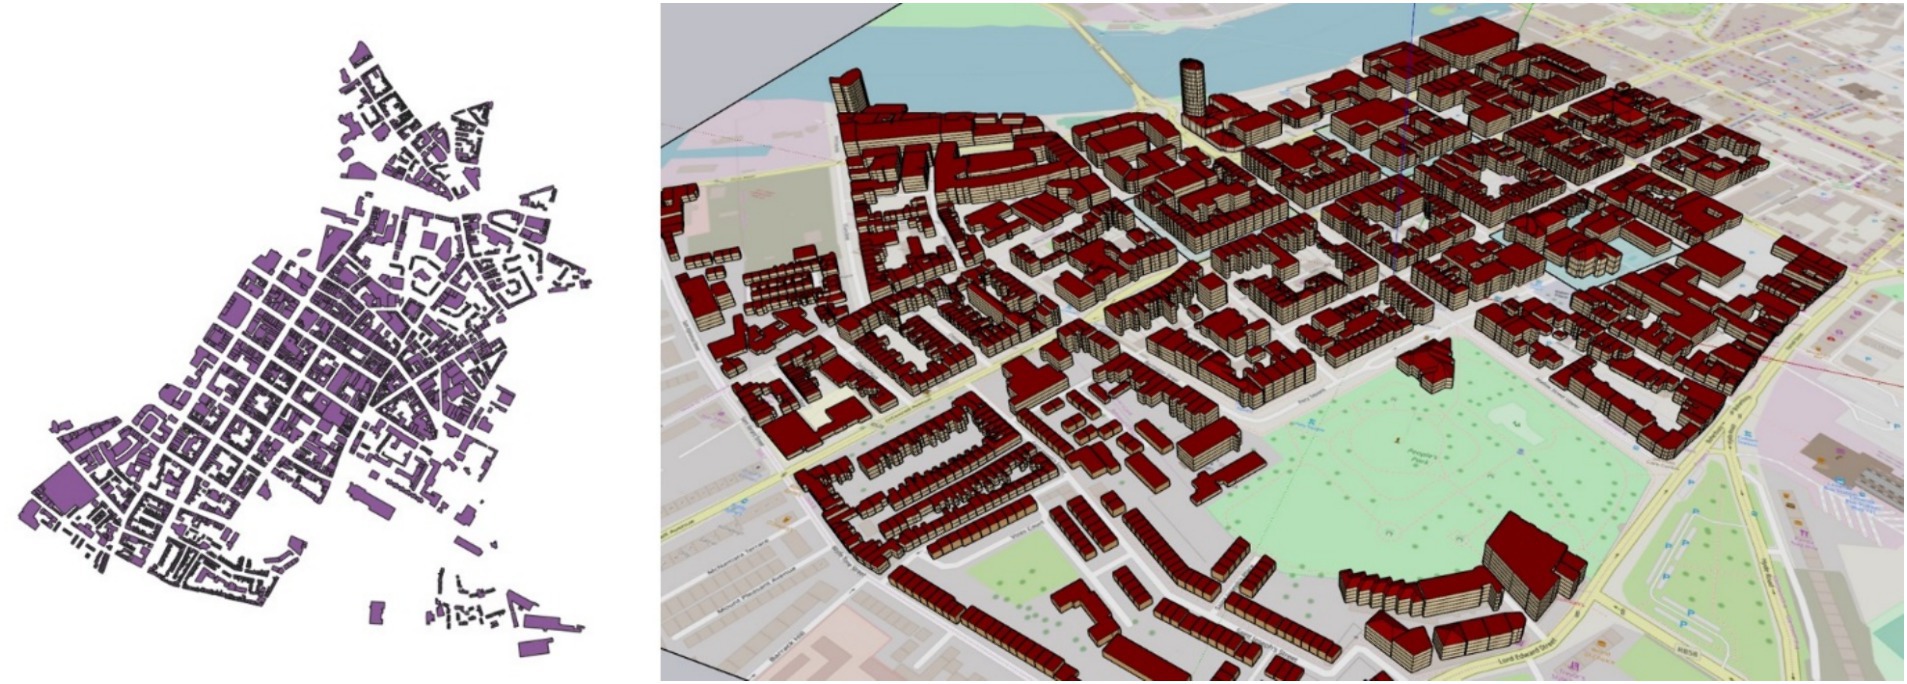
Figure 1. Shapefile of the Georgian Quarter (left) as well as its representation within the IES iCD platform (right).
The shapefile provided in support of the development of the digital twin, while valuable, was limited in the amount of information that it provided. For example, information related to the material properties of the building enclosure was not presented within the file, necessitating the use of information discerned from national databases to estimate reasonable values of thermal transmittance for the various building envelope components of the buildings. These were obtained through the use of the building’s construction year as a reference to obtain the information through the use of building regulations and construction typologies of the respective construction period, particularly within the Georgian historical period. A similar exercise was conducted to determine the heating systems within the buildings within the model. This data, combined with a local weather file from Shannon Airport, located approximately 26 km from the Georgian Quarter, was used to model the baseline and associated carbon emissions for the district, also leveraging emission factors for each fuel type used in the model (SEAI, 2021).
3.3 Transport
In addition to examining the impact of buildings on Limerick’s carbon emissions and contribution towards decarbonisation planning, the study also considered the electric vehicle (EV) transition that is currently being realised in the western world and being driven by multiple factors including technology improvements, changing customer preferences (Forsythe et al., 2023) as well as improved charging infrastructure (Department of Environment, Climate and Communications, 2023b) and policy implements aimed to electrify mobility (European Commission, 2020).
As the resolution of published transport emission data is limited to national figures, it was necessary to adjust these to form an estimate of the current baseline for Limerick. Annual transport emissions for the country were accessed using an SEAI maintained database (SEAI, 2021), from which relevant modes of transport were extracted. This data was subsequently interpolated to city-level through the use of CSO data (Central Statistics office, 2023) on the city’s population compared to the national figure. This baseline figure is limited to transport emissions only emitted directly during vehicle uses, carbon lifecycle analyses for each mode of transport over the duration of the decarbonisation roadmap has not been completed.
Despite this, the analysis and quantification of the transportation carbon baseline for Limerick has tracked the increase in vehicles within the city to 2050, incorporating the upward trajectory associated with a “do-nothing” approach to transportation emission. The current EV charging infrastructure has been modelled and simulated, with emission data associated with the electricity consumption of the chargers being considered within the transport baseline and related back to the electrical emission factors discussed previously.
3.4 Total modelled baseline
For this study, the baseline carbon emissions of Limerick City are provided through both the emissions arising from the operation of the built environment as well as the normalised transport emissions, which leveraged a proportional interpolation based on population size. As discussed previously, the building baseline was realized through the dynamic simulation of the Georgian Quarters current building typology, leveraging published and confidential data. Based on the district’s prevailing building type and operation, a baseline of 64.03ktCO2/year was simulated, while the normalised transport carbon emissions were calculated as 111.60ktCO2/year, yielding a total carbon baseline for Limerick City of 175.63ktCO2/year. This will form the basis for the implementation of the LACAP in the Georgian Quarter, as well as evaluating the potential for full decarbonisation of the city through the implementation of such a strategy. Figure 2 presents a screenshot of the baseline model for the city as created within the iCIM platform and filtered by building type (Residential, Commercial or Public).
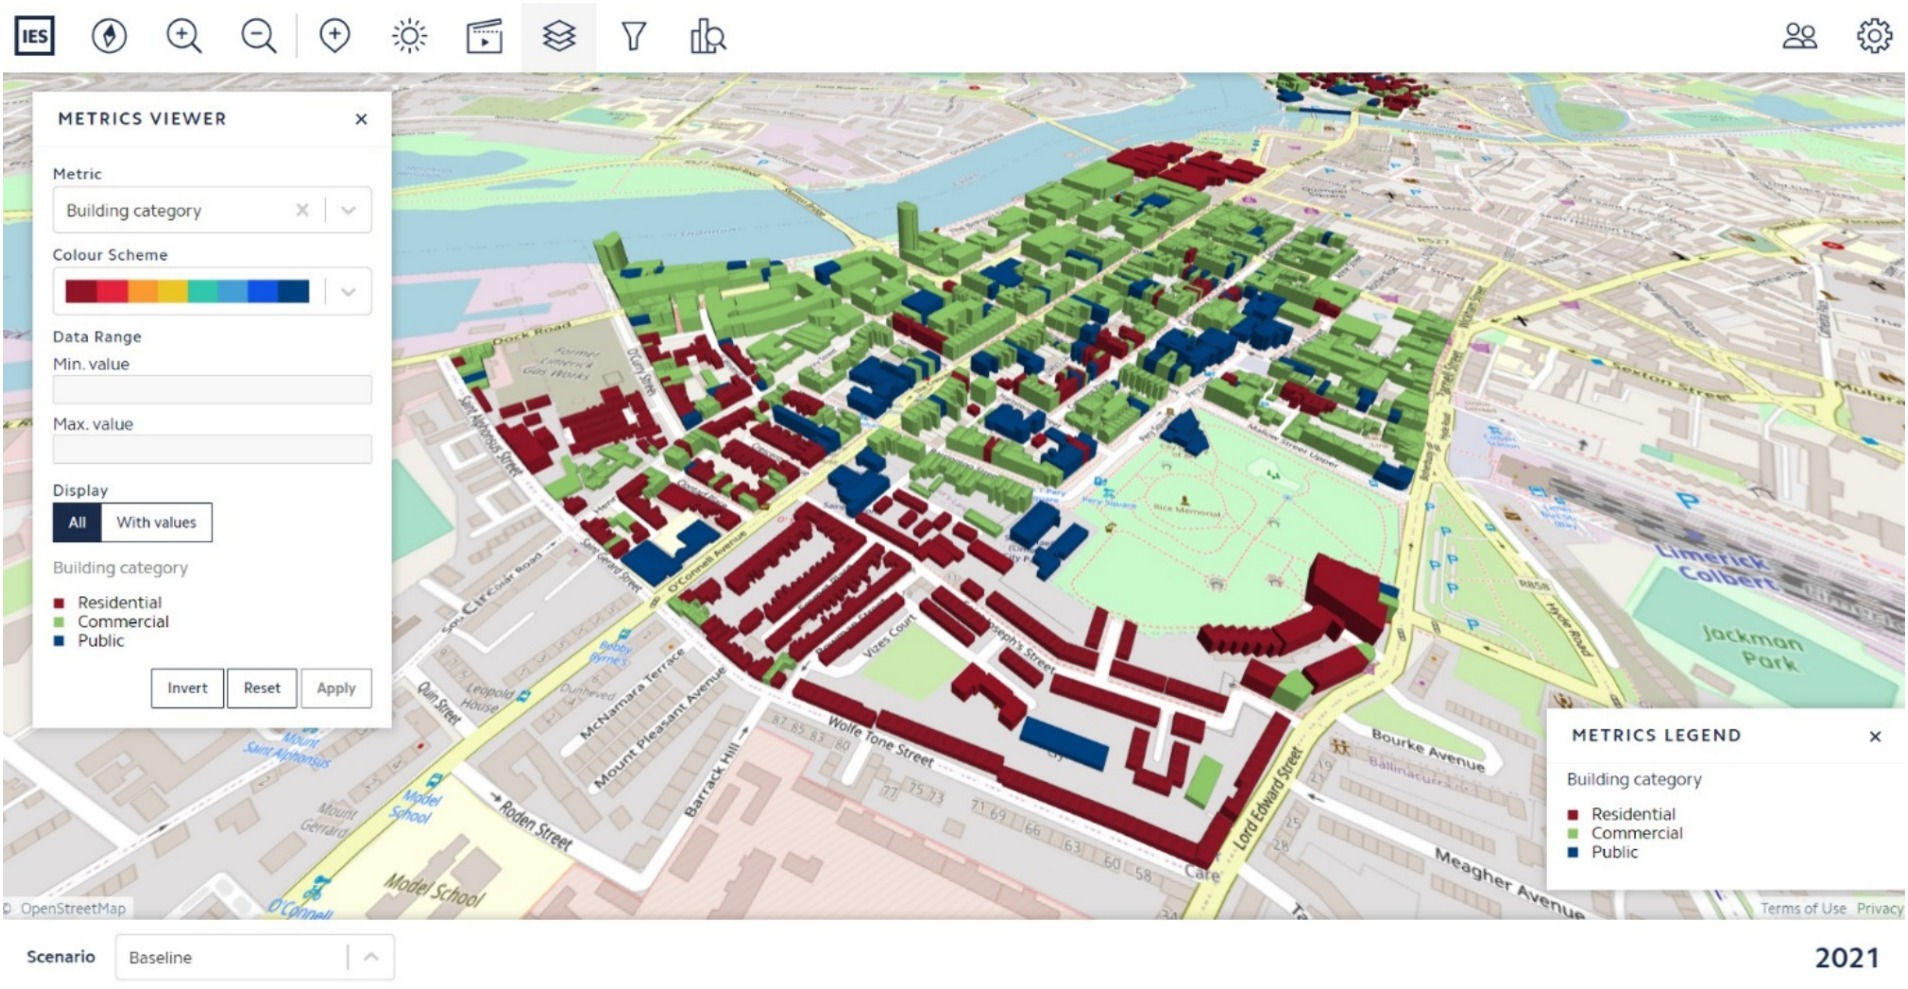
Figure 2. Baseline model of the Georgian district filtered by building category.
3.5 Applications of scenarios
3.5.1 Building level decarbonisation interventions
The application of decarbonisation at scale within this study has been identified through a detailed review of policy and guidance measures that were developed by the Government of Ireland (Office of the Attorney General, 2021). Each of the measures will be described in turn in the following section, as well as the rationale for their selection and the modelling or calculation methodology employed to quantify their impact on the city’s carbon baseline over the duration of the roadmap period (up to 2050).
The 2021 Climate Action Plan (CAP) identifies buildings and the improvement in their energy performance through a formal retrofit program as a fundamental contributor to the decarbonisation efforts being undertaken at the national and regional scale (Department of Environment, Climate and Communications, 2021). In pursuit of the implementation of this program, the Irish government has targeted the retrofitting of 500,000 properties to a B2 Building Energy Rating (BER) standard by 2030. This target is consistent with the IEA’s current estimate that cities in developed countries will retrofit their residential building stock at a rate of 2.5% per annum to 2050 (International Energy Agency, 2021). The government targets have also prioritised the upgrading of publicly owned buildings, with the entirety of such buildings identified for renovation by 2030. The strategy towards the renovation of commercial buildings has been less clearly defined and, as a result, the analysis completed in this study has assumed a best-case scenario of the retrofitting of the entire commercial building stock to a B2 by 2050. Applying this to the Limerick Digital Twin, approximately 1,000 buildings have been incorporated within the model, of which 45% are residential, 9% public and 46% commercial, as recorded within the shapefile provided by Limerick City and County Council.
The individual retrofit interventions considered during this study was informed by the CAP and their impact on the city’s carbon footprint modelled using the Limerick Digital Twins. Building retrofit was implemented and modelled on a phased basis, with buildings being selected and grouped for retrofit in line with the government’s delivery model of upgrading large groups of similar buildings concurrently to realise economies of scale and lower the cost. The upgrades selected have been informed by renovation brochures that were distributed to residents of the city that were tailored for typical building types in the city, with additional, more detailed energy analysis modelling completed to more accurately quantify the impact of the retrofit scenarios.
The scenarios considered for Limerick were characterised as deep renovation measures, targeting all factors related to the building’s energy balance through targeting passive loads, optimising active systems and integrating renewable energy sources. Six individual measures were specified in order to achieve the B2 BER rating for each renovated building as follows:
• 500 mm of external wall insulation
• 100 mm of roof insulation
• Upgrading of building fenestration to a minimum standard of double glazing with a U-value of 1.6 W/m2K
• Upgrading of the air tightness of the buildings
• Upgrading of all lighting to LED fixtures
• Air Source Heat Pump for heating and domestic hot water heating.
In addition to retrofitting buildings to reduce their energy consumption, the research also explored the potential for the incorporation of local renewable energy systems in Limerick. Guidance and policies are currently in development within Ireland with the intention of promoting the installation of RES and particularly solar PV systems, with a newly introduced scheme facilitating the sale of excess solar PV to the grid making the installation of such systems more attractive to building owners. In order to quantify the potential impact of RES installations at building level in the city, a single city block comprising 5 buildings was taken and modelled in detail, including an assessment of the available roof space on these buildings as well as a solar analysis to identify solar generation potential as well as shading from adjacent buildings. The resultant PV configurations were then modelled within the iVN platform, using manufacturers specified properties and the closest available weather file. Based on this, a predicted timeseries PV generation profile was generated, which could then be compared to the block’s stochastic demand profile provided through the detailed digital twin. This facilitated the evaluation of excess generation that could be either exported back to the grid or stored for time periods with higher electrical demand. This analysis was then used as the basis to estimate the potential for solar PV generation at city scale. The installation of the solar PV assets was then incorporated within the decarbonisation pathways, with the assumption that the solar PV arrays will be installed on a building within three years of the completion of its retrofit.
Finally, in line with the national rollout of smart energy meters across all buildings in Ireland to be completed by 2024, the model also considered the energy consumption reduction associated with the behavioral aspects arising form smart meter installation. Although the research indicates energy savings between 5–15% as a result of building owners being informed about their energy consumption following the installation of such meters (Mogles et al., 2017), this study estimates, through the use of a digital twin, that in the best case scenario a building occupant can expect 10% savings in their energy consumption compared to the baseline. This saving was then applied across the city.
3.5.2 Decarbonisation of the transport sector
In addition to the upgrading of the existing building stock, the decarbonisation of transportation across the country is a key area of focus for the Government of Ireland. Electrification of mobility and transport is expected to play a key role in the country’s approach to achieving its decarbonisation targets, with the transition of 60% of private vehicles to EVs by 2050 (SEAI, 2021). Although there are currently no national targets related to the electrification of other modes of transport, namely buses, taxis and light goods vehicles, for the purposes of this study the best-case scenario of full transition away from internal combustion engine power vehicles is considered. Based on current charging infrastructure in Limerick, the analysis has modelled the addition of ten additional public chargers within the city limits every five years to support the transition. The emissions associated with their electricity consumption as it relates to the grid emission factors have been considered throughout the roadmap development. While electrification of the mobility sector is the government’s primary focus in cutting transport emissions, plans have been developed to support a shift in transport modes, moving away from private vehicle journeys while promoting the extent and reliability of the public transport network. As a result, citizens will be encouraged to undertake more public and active transport journeys, including cycling and walking, through the use of incentive schemes and improvements to supporting infrastructure and networks. An estimate of the impact of such behavioral shifts has been estimated for Limerick.
3.6 Network and grid decarbonisation
At the network level, projected data relating to the future electricity emission factors for Ireland was obtained from the Department of Public Expenditure and Reform published Public Spending Code (Department of Public Expenditure and Reform, 2019), which estimates the carbon intensity of grid electricity, on an annual basis to 2050. This resource predicts that the Irish national electricity grid will have achieved full decarbonisation by the year 2050, falling from its current grid intensity of 228.7gCO2/kWh at a rate of 56.8gCO2/kWh between 2021 and 2030 and subsequently by 43gCO2/kWh every 5 years to 2050. As a result, it is expected that the carbon intensity arising from electricity generation within the Republic of Ireland will be reduced to zero by the year 2050.
This published data has also been supplemented through the analysis by expanding the, previously discussed, local solar PV installations from building level to community or city level installations, providing the opportunity to investigate the impact of energy trading and community led projects on carbon emissions in Limerick. As solar PV installations increase and accelerate, it is likely that an excess of locally generated electricity will become available for exportation to the grid or traded to adjacent buildings which may or may not have been renovated to date, or buildings with differing demand profiles to where the power was generated initially. Furthermore, as information is shared throughout the city, community projects will play an increasingly significant role in changing the attitudes and behaviors of residents with respect to their energy usage and consumption, likely promoting the uptake of community renewable projects. While the impact of such measures is difficult to quantify at this scale, it has been estimated that a 15% reduction in carbon emissions can be realised to 2050.
4 Results and discussion
4.1 Analysis of the potential impact of CAP 2021
The implementation of the measures outlined in the CAP 2021 and discussed above were modelled using the iCL tools in a sequential and reasonable manner to assess the potential for decarbonisation of the city in the time period to 2050. This process was implemented in two distinct phases, namely without the decarbonisation of the electricity grid and subsequently with the projected decarbonisation of the grid (according to the planned timeline) included in the analysis.
The decarbonisation roadmap for both scenarios is presented in Figures 3, 4, combining each of the individual decarbonisation measures described previously and evaluating the overall projected carbon emissions in Limerick following the implementation of the measures. Carbon emissions arising from the operation of the built environment are presented with the blue line and include energy end uses such as space conditioning, domestic hot water generation, lighting and appliance and equipment usage. The orange line on the charts represent the carbon output associated with transportation and mobility in the city, while also including the carbon emissions associated with implementing the charging infrastructure within Limerick. Combined emissions for both the built environment and transportation are represented by the green lines, with the upper line assuming no change in the emission factor of the grid electricity supplied to the city. The lower green line incorporates the impact of grid decarbonisation and the associated reduction in carbon intensity of imported electricity as additional renewable sources are added to the national grid before achieving a fully decarbonised grid by 2050.
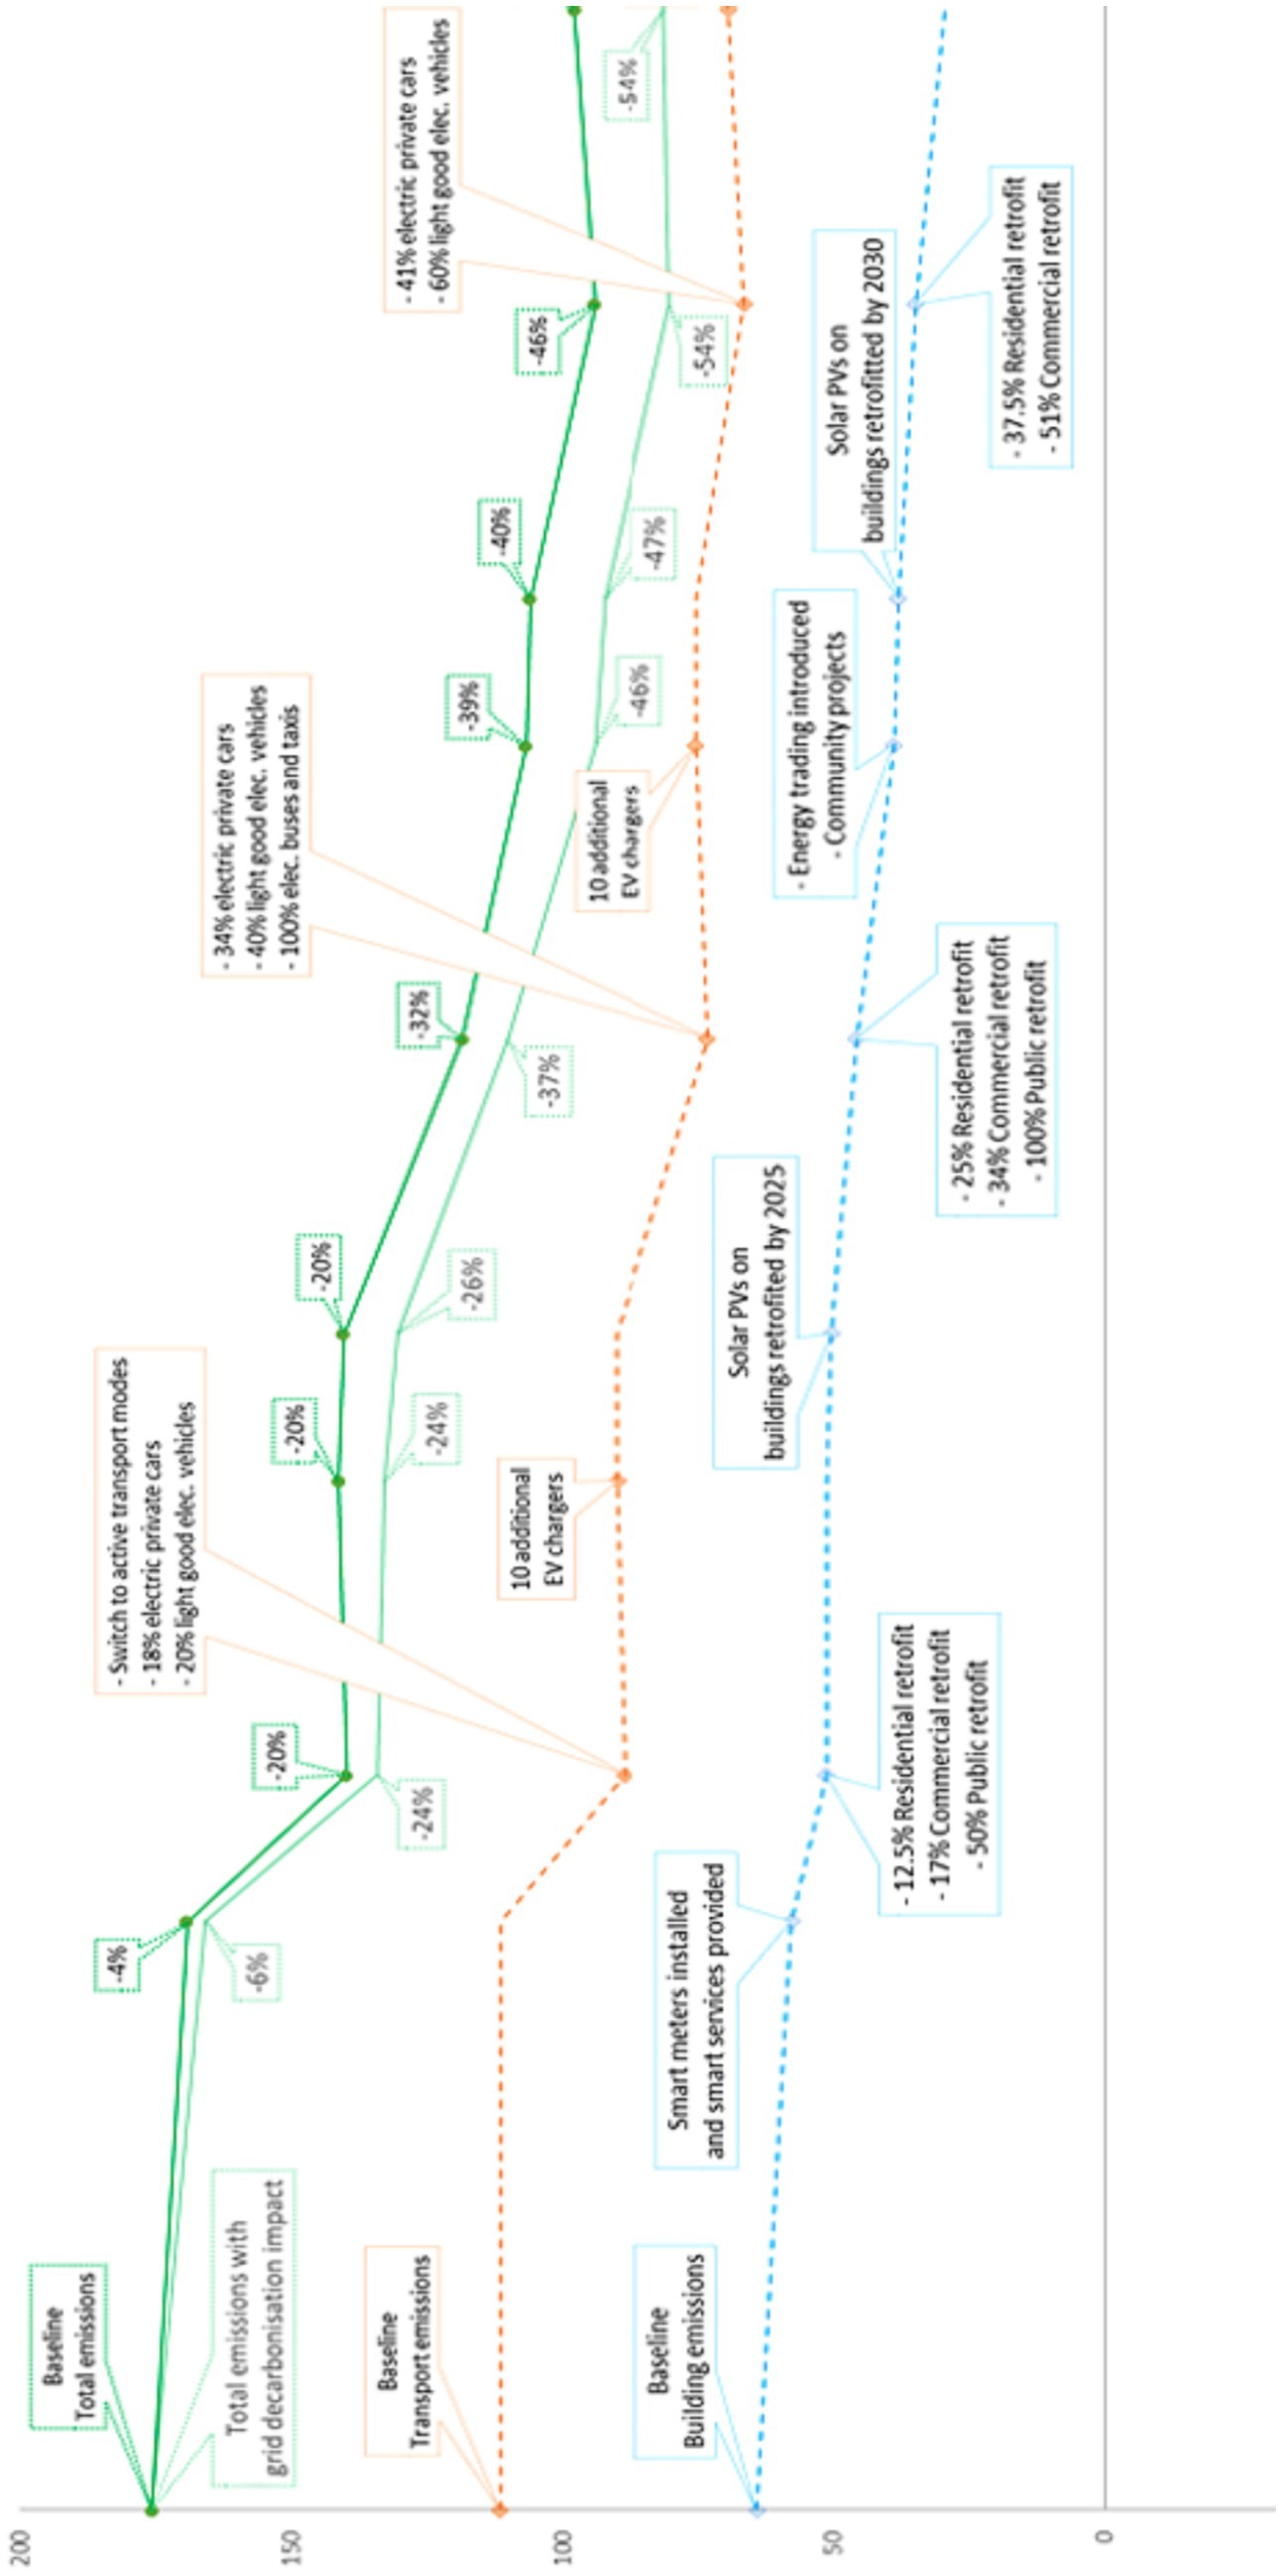
Figure 3. Decarbonisation roadmap for Limerick 2020–2035.
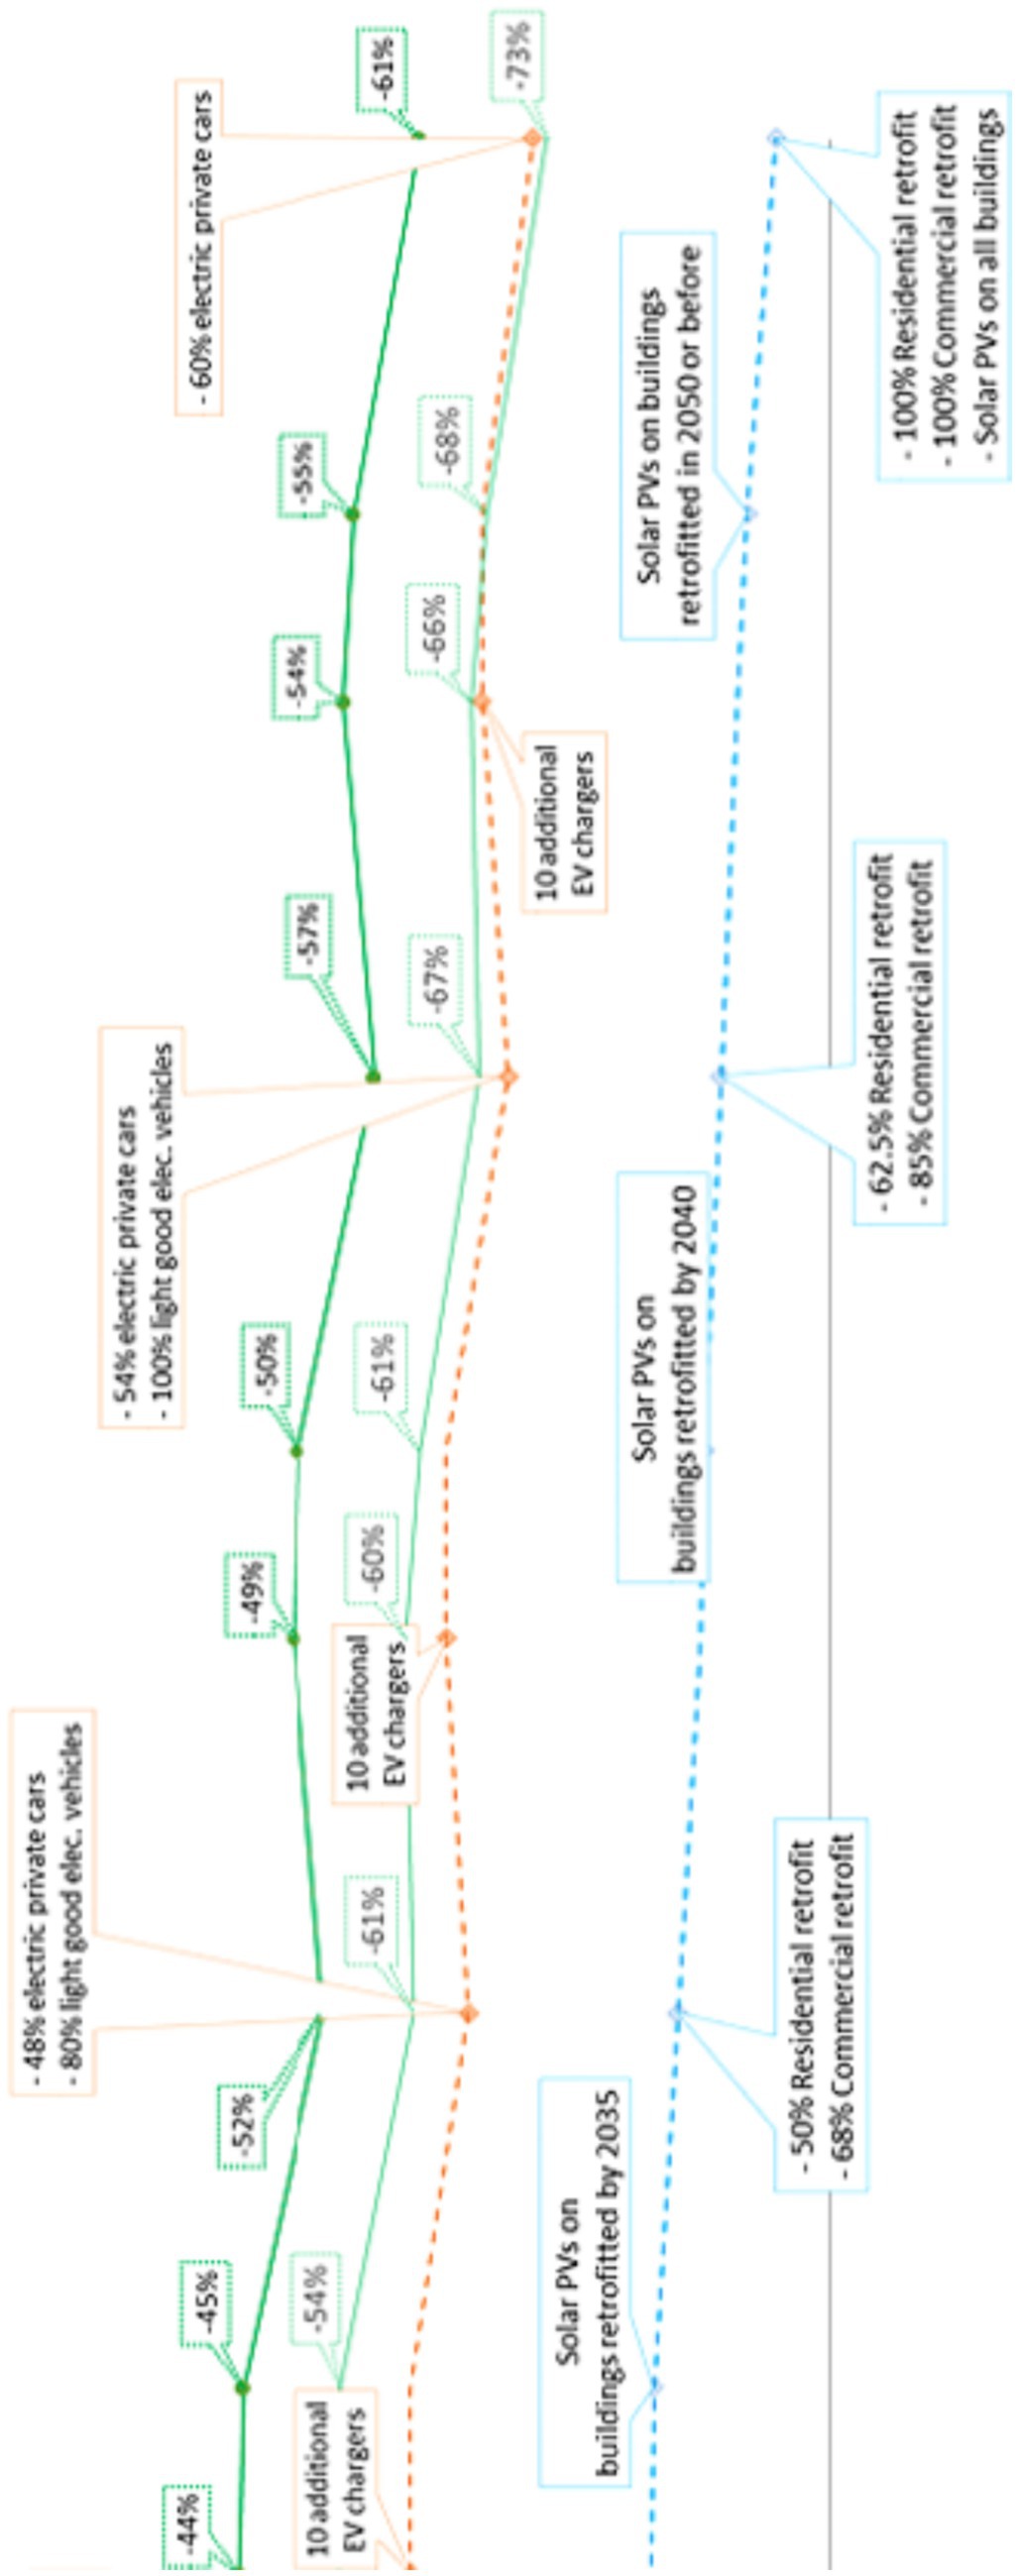
Figure 4. Decarbonisation roadmap for Limerick 2035–2050.
The development and implementation of digital twin technology to represent the current carbon emission behavior of Limerick is a key enabler to evaluating the impact of decarbonisation strategies on the city. Based on the interventions outlined previously, the associated carbon emission reductions arising from the implementations of such measures was evaluated on a five-yearly basis, in the first case with the exclusion of the impact of grid decarbonisation. Based on the retrofit strategy implemented, the average energy use intensity of the built environment is observed to decrease from a baseline value of 350kWh/m2 to 140kWh/m2 by 2050, with an associated reduction in the buildings carbon emissions of 86%, correlating to a carbon saving of 55 kilotons of CO2 per annum.
In the case of transport, a 56% reduction in carbon emissions compared to the baseline value is realised, resulting in 63 kilotons of CO2 emissions being avoided per annum. When combined, Limerick would achieve a net carbon emission reduction of 67% over the baseline, accounting for a 33% shortfall between the current baseline and the net zero goal outlined in the CAP. The carbon emissions to 2050 for the built environment, transport and combined are presented in Table 1.
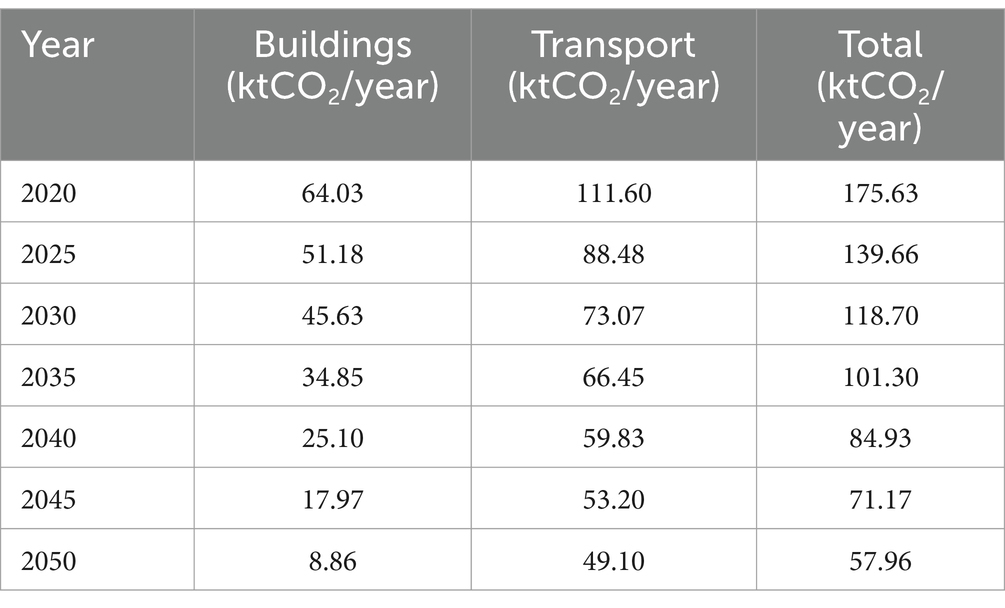
Table 1. Carbon emissions in Limerick to 2050 without grid decarbonisation.
Given that the majority of the city’s transition to carbon neutrality involves the electrification of buildings and mobility, however, it is important to consider the carbon emission factor of Ireland’s electrical grid when evaluating the impact of measures on the city. As such, the analysis also considered the predicted grid carbon performance to 2050 when it is expected that the grid will be entirely carbon neutral. The impact of grid decarbonisation is presented in Table 2. Since building energy consumption becomes solely dependent on electricity, the installation and use of local RES assets, coupled with the complete decarbonisation of the grid facilitates the complete decarbonisation of the built environment by 2050 since the building operational carbon emissions are eliminated.

Table 2. Carbon emissions to 2050 with grid decarbonisation for Limerick.
Within the mobility sector, however, the reduction in grid carbon emissions has a more muted impact, since 40% of private transportation journeys are completed in a vehicle that uses fossil fuels. Although the charging infrastructure required by EVs benefits from the zero-carbon electrical supply, the decarbonisation in the grid accounts for a further 4% reduction in carbon emissions in the transport sector over the baseline condition when compared to the no grid decarbonisation scenario. Based on this analysis, the decarbonisation efforts, combined with the decarbonisation of the grid results in a 75% reduction in emissions compared to the baseline, avoiding the emission 130 kilotons of CO2 per annum, a 25% shortfall from the governmental net-zero commitments outlined in the CAP and mandated by the European Commission.
4.2 Updates in CAP 2023
The work presented in this paper has been carried out using the decarbonisation targets and strategies for Ireland defined within the Climate Action Plan (CAP), 2021 (Department of Environment, Climate and Communications, 2021). This document is dynamic in nature and is iterated on an annual basis with subsequent versions of the plan published in 2023 (Department of Environment, Climate and Communications, 2023a) and, at the time of publication the 2024 edition of CAP (Department of Environment, Climate and Communications, 2024) is undergoing the public consultation process. Considering the scope of this paper, the relevant sections of the CAP are Grid (Section 3), Buildings (Section 4) and Transport (Section 5). A high-level summary of the evolution of the CAP from 2021 to 2024 within the three primary sectors for which this paper is concerned is presented in Table 3. Specific decarbonisation efforts within these sections as outlined within CAP 2021 corresponding to the measures simulated during this study are as follows:
• Grid
Focus on renewable energy: The plan aims for 70% renewable electricity by 2030, achieved through increased deployment of wind, solar and other renewables
Improving grid infrastructure: Investments in grid upgrades and smart technologies were planned to enable efficient integration of renewables and manage demand
Carbon pricing: Expanding the carbon tax and considering an Emissions Trading System were included to incentivise low-carbon generation
• Buildings
Deep retrofitting: A national deep retrofit program aimed to upgrade 500,000 homes to B2 energy standards by 2030, reducing heat and energy demand
Improved building regulations: Stricter building regulations for new and renovated buildings were planned to ensure high energy efficiency standards
Supporting renewable heating: Measures included grants for heat pumps, biomass boilers and solar thermal systems.
• Transport
Electrification of public and private transport: Significant investment in electric vehicles, charging infrastructure and public electrification was outlined with up to 500,000 EVs on Irish roads by 2030
Sustainable travel: Promotion of walking, cycling and public transport to reduce car dependence
Fuel efficiency standards: Implementing stricter fuel efficiency standards for new vehicles was planned.

Table 3. High level evolution of the CAP over the last three iterations.
Given the shortfall between the carbon emission targets outlined by CAP and by the EU (Director-General for Communication, 2021) outlined through this study, with Ireland projected to miss its zero-carbon target of 2050 by 25–33% respectively, a desk review of the subsequent CAP targets was conducted in order to assess whether the goals and targets of the plan have been readjusted. An initial review of CAP 2023 found that more aggressive targets, stronger regulatory measures and increased investment to accelerate the decarbonisation of the grid, buildings and transport sectors have been implemented. At the grid level, CAP 2023 aims for 80% renewable electricity by 2030 with a focus on large-scale offshore wind development to contribute 7GW of capacity as well as placing an emphasis on grid flexibility solutions such as storage and demand-side management. For the buildings sector, more ambition retrofitting targets have been specified with upgrades of 500,000 homes to a BER B2-rating specified, coupled with a focus on the installation of heat pumps and expanding the retrofit financial support model to facilitate deep retrofits in commercial and public buildings. Finally, within the transport sector, CAP 2023 doubles the targeted rollout of EVs to 1 million vehicles on the road by 2030, while mandating zero-emission public transport within the same time horizon and strengthens the focus on active travel through increased investment in walking and cycling infrastructure. In addition, CAP 2023 introduces legally binding carbon budgets for each sector, places individual government ministers solely responsible for achieving emission reductions in their sectors and commits €120 billion in investment between 2022 and 2030 to support decarbonisation efforts. These targets are likely to be readjusted when the upcoming CAP 2024 is officially published in Spring 2024.
As the analysis presented in this paper considered the less stringent targets for decarbonisation as mandated within CAP 2021 and found that the plan fell 25–33% short of realising these targets, it is recommended that the analysis be completed again using the recommendations and mandates within CAP 2023. Furthermore, based on this shortcoming identified through the analysis, it is recommended that digital twin technology is leveraged by the Government and the DECC to develop and validate their CAP targets based on evidence-based scientific approach. The benefit of this would be in assisting policy makers in identifying key areas which may be underperforming in achieving their emissions goals and allow for a more dynamic and proactive approach to sectoral emission reduction strategies. Table 3 provides a high-level indication of the evolution of targets in Ireland’s CAP over the last three iterations.
5 Conclusion
The European response to the climate emergency arising from anthropogenic climate change and the burning of fossil fuels has led to the development and enactment of the EGD, the European Climate Law and the Fit for 55 policies. These policy instruments commit member states to a 51% reduction in GHG emissions by 2030 and full decarbonisation by 2050. The Climate Law also enforced the requirement amongst member states to develop and implement a CAP at national level, which was completed in its first iteration by the Government of Ireland in 2021, with subsequent releases in 2023 and an upcoming iteration in 2024, with regional LACAPs developed by all local authorities.
The research presented in this paper considers the application of the CAP and its measures for the grid, built environment and transportation sectors based on the 2021 iteration of the plan, using the, IES developed, iCL digital twin software tools to develop a baseline model and simulate the impact of the plan’s measures for the City of Limerick. The modelled area was centred around the historic Georgian district in the city centre and comprised approximately 1,000 buildings, 45% of which are residential, 9% public and the other 46% commercial. The initial carbon baseline for Limerick was found to total 175.63ktCO2/yr., with 64.03ktCO2/yr. associated with the built environment and the outstanding 111.60ktCO2/yr. arising from transportation.
The baseline model was then altered to represent the systematic implementation of a deep retrofit strategy for each of the buildings in the district, increasing their energy rating to B2 levels through the implementation of additional insulation to the external envelope, upgrades of fenestration to a minimum U-Value of 1.6 W/m2K, increasing the air tightness of the buildings, upgrading all lighting to LED fixtures and the installation of an air-source heat pump for heating and domestic hot water heating. In addition to these measures, integration of renewable energy sources at the building level was also implemented, while the potential impact of smart meter installation and peer-to-peer trading mechanisms was investigated through the study. The application of these measures was completed in a phased manner, with groups of similar buildings with comparable properties being grouped together and renovated over a timespan to 2050, in line with the ambition of the CAP.
From the transportation perspective, in the absence of defined targets for the electrification of mobility at a national level, the study assumed a transition of 60% of private vehicles to EVs by 2050 as per published targets presented by SEAI (2021). For public transportation vehicles, full electrification of the fleet was assumed with a time horizon to 2050. The study also assessed the decarbonisation of the Georgian district in two different scenarios, one without the decarbonisation of the grid and the other with full decarbonisation of the grid by 2050.
Based on the analysis conducted through this study, it was found that the ambitions and recommendations contained within CAP 2021 are not far reaching enough within the grid, built environment and transportation sectors to realise decarbonisation be 2050 as required by the European Climate Law. In the case of no change to the carbon emissions of the grid, the application of the plan resulted in a 67% reduction in carbon emissions associated with the three targeted sectors, while grid decarbonisation achieved a 75% decrease by 2050, resulting in a shortfall of 33 and 25%, respectively. Based on this, Ireland, through the application of CAP 2021 will not be on course to achieve its decarbonisation targets by 2050. Furthermore, it appears that the targets are not evidence-based or validated through the use of science-based model and as such, they may not be sufficient to achieve the requirements of the European Climate Action Law as demonstrated through this research.
It should be noted, however, that CAP 2023 has increased the ambition of its targets towards the decarbonisation of the grid, built environment and transportation. Specifically, the revised plan increases the goal for renewable integration into the grid to 80%, sets a target of 500,000 A-rated renovations and 1 million EVs on the roads by 2030. Although the more ambitious targets are welcome, dynamic simulation modelling technology should be leveraged to validate the targets and ensure that their implementation will result in the intended GHG emission reductions while also scenario testing whether there may be any unintended consequences arising from the implementation of the plan, such as disruption to the grid due to altered demand profiles for example. In addition, such targets should also be pragmatic when considering other related constraints, such as competing policy instruments, labour market conditions, supply chains and access to financing to ensure that the implementation of these targets is achievable in practice. It is recommended that the research on the application of CAP 2021 should be revised through the viewpoint of the recommendations outlined within CAP 2023 to determine whether the updated targets are of sufficient ambition to achieve a 51% reduction in GHG emissions by 2030 with full decarbonisation by 2050. Furthermore, the zone of interest of the model should be extended to a larger region in Limerick, or to other urban zones across Ireland to determine the regionalities that may impact the current and future CAP, while also providing policy makers with an invaluable resource in target setting, monitoring, and learning towards regional and national decarbonisation efforts.
The use of digital models and DTs is generally perceived as a niche market and its use limited in industry, due in part to the technical nature of their use and requirement for skilled user, the complexity of their development as well as the computing requirements associated with their use at scale. Although this perception is changing slowly, such tools can provide policy makers with detailed and important information that can inform decision making and policy setting moving forward. As has been demonstrated through this research, unvalidated and untested targets can result in shortfalls between the intended outcome and the results achieved following implementation. By leveraging DT technology, interventions can be modelled and tested to ensure their applicability and effectiveness, as well as any unintended consequences arising from their implementation, while also evaluating the anticipated and actual impact of measures on GHG emissions.
Data availability statement
The original contributions presented in the study are included in the article/supplementary material, further inquiries can be directed to the corresponding author.
Author contributions
NBy: Formal analysis, Project administration, Writing – original draft. SP: Conceptualization, Formal analysis, Investigation, Methodology, Validation, Visualization, Writing – review & editing. LD: Conceptualization, Formal analysis, Investigation, Methodology, Validation, Visualization, Writing – review & editing. RK: Conceptualization, Funding acquisition, Methodology, Project administration, Supervision, Validation, Writing – review & editing. NBu: Resources, Writing – review & editing.
Funding
The author(s) declare financial support was received for the research, authorship, and/or publication of this article. This research has been performed within the +CityxChange (Positive City ExChange, https://cityxchange.eu/) project under the Smart Cities and Communities topic within the European Union’s Horizon 2020 research and innovation programme under grant agreement no. 824260.
Acknowledgments
The authors would like to acknowledge colleagues in IES and Limerick City and County Council (LCCC) for their contributions and support in the development of this paper. For IES, Nick Pursehouse for his contributions in defining and validating the methodology as well as coordinating communication pathways. For LCCC, particular thanks to Rosie Webb and Kieran Reeves for their assistance in data gathering, facilitation and methodological review and analysis.
Conflict of interest
NBy, SP, LD, RK, and NBu were employed by Integrated Environmental Solutions R&D Limited.
Publisher’s note
All claims expressed in this article are solely those of the authors and do not necessarily represent those of their affiliated organizations, or those of the publisher, the editors and the reviewers. Any product that may be evaluated in this article, or claim that may be made by its manufacturer, is not guaranteed or endorsed by the publisher.
References
Ali, U., Shamsi, M. H., O’Donnell, J., Alshehri, F., and Mangina, E. (2018). Comparative analysis of machine learning algorithms for building archetypes development in urban energy modeling. (Chicago IL: ASHRAE and IBPSA-USA).
Araújo, G., Santos, L., Leitão, A., and Gomes, R. (2022). AD-Based Surrogate Models for Simulation and Optimization of Large Urban Areas, in The Association for Computer-Aided Architectural Design Research in Asia (CAADRIA), (Sydney, Australia: The Association for Computer-Aided Architectural Design Research in Asia (CAADRIA)), 689–698. doi: 10.52842/conf.caadria.2022.2.689
Badurek, M., Hanratty, M., and Sheldrick, W. (2012). TABULA scientific report. Dublin: Energy Action Limited.
Bocullo, V., Martišauskas, L., Gatautis, R., Vonžudaitė, O., Bakas, R., Milčius, D., et al. (2023). A digital twin approach to City block renovation using RES technologies. Sustain. For. 15:9307. doi: 10.3390/su15129307
Bolton, A., Butler, L., Dabson, I., Enzer, M., Evans, M., Fenemore, T., et al. (2018). Gemini Principles. CDBB. doi: 10.17863/CAM.32260
Buckley, N., Mills, G., Reinhart, C., and Berzolla, Z. M. (2021). Using urban building energy modelling (UBEM) to support the new European Union’s green Deal: case study of Dublin Ireland. Energ. Buildings 247:111115. doi: 10.1016/j.enbuild.2021.111115
Central Statistics office (2023). Press Statement Census of Population 2022 - Summary Results Limerick - CSO - Central Statistics Office. Available at: https://www.cso.ie/en/csolatestnews/pressreleases/2023pressreleases/pressstatementcensusofpopulation2022-summaryresultslimerick/ (Accessed February 7, 2024).
Cerezo Davila, C., Reinhart, C. F., and Bemis, J. L. (2016). Modeling Boston: a workflow for the efficient generation and maintenance of urban building energy models from existing geospatial datasets. Energy 117, 237–250. doi: 10.1016/j.energy.2016.10.057
Chen, Y., Guo, M., Chen, Z., Chen, Z., and Ji, Y. (2022). Physical energy and data-driven models in building energy prediction: a review. Energy Rep. 8, 2656–2671. doi: 10.1016/j.egyr.2022.01.162
Dahlström, L. (2023). Archetype identification in urban building energy modeling. Uppsala. Available at: https://www.diva-portal.org/smash/get/diva2:1754574/FULLTEXT01.pdf (Accessed February 26, 2024).
Department of Environment, Climate and Communications (2021). Climate action plan 2021. Available at: https://www.gov.ie/pdf/?file=https://assets.gov.ie/224574/be2fecb2-2fb7-450e-9f5f-24204c9c9fbf.pdf#page=null (Accessed February 22, 2024).
Department of Environment, Climate and Communications. (2023a). Climate Action Plan 2023. Available at: https://www.gov.ie/pdf/?file=https://assets.gov.ie/244355/1c421172-2901-4f9e-baa5-6e4445b342f4.pdf#page=null (Accessed February 1, 2024).
Department of Environment, Climate and Communications (2023b). Local authority climate action plan guidelines. Available at: https://www.gov.ie/pdf/?file=https://assets.gov.ie/250048/e508312c-39c4-4a78-a7ad-c855afc501e6.pdf#page=null (Accessed February 27, 2024).
Department of Environment, Climate and Communications. (2024). Climate Action Plan 2024. Available at: https://www.gov.ie/pdf/?file=https://assets.gov.ie/284675/70922dc5-1480-4c2e-830e-295afd0b5356.pdf#page=null (Accessed February 22, 2024).
Department of Public Expenditure and Reform (2019). Public spending code. Supplementary guidance – Measuring & valuing changes in greenhouse gas emissions in economic appraisal. Available at: https://www.gov.ie/en/publication/public-spending-code/ (Accessed February 15, 2024).
Directorate-General for Communication (2020). The European climate law. Available at: https://data.europa.eu/doi/10.2775/790913 (Accessed February 27, 2024).
Director-General for Communication (2021). The European green Deal—delivering on our targets. Available at: https://data.europa.eu/doi/10.2775/373022 (Accessed February 1, 2024).
European Commission (2020). Renovation wave. Available at: https://energy.ec.europa.eu/topics/energy-efficiency/energy-efficient-buildings/renovation-wave_en (Accessed February 1, 2024).
European Commission (2021a). Energy performance of buildings directive (EPBD). Available at: http://data.europa.eu/eli/dir/2010/31/2021-01-01/eng (Accessed February 26, 2024).
European Commission (2021b). “Fit for 55”: delivering the EU’s 2030 climate target on the way to climate neutrality. Available at: https://eur-lex.europa.eu/legal-content/EN/TXT/HTML/?uri=CELEX%3A52021DC0550 (Accessed February 27, 2024).
European Commission and European Climate, Infrastructure and Environment Executive Agency. (2022). Digitalization in urban energy systems: Outlook 2025, 2030 and 2040. LU: Publications Office. Available at: https://data.europa.eu/doi/10.2926/070630 (Accessed February 26, 2024).
Evans, S., Savian, C., Burns, A., and Cooper, C. (2017). Digital twins for the built environment. An introduction to the opportunities, benefits, challenges and risks. Institute of Engineering and Technology. Available at: https://www.theiet.org/media/8762/digital-twins-for-the-built-environment.pdf (Accessed February 20, 2024).
Famuyibo, A. A., Duffy, A., and Strachan, P. (2012). Developing archetypes for domestic dwellings—an Irish case study. Energ. Buildings 50, 150–157. doi: 10.1016/j.enbuild.2012.03.033
Farahbakhsh, H., Ugursal, V. I., and Fung, A. S. (1998). A residential end-use energy consumption model for Canada. Int. J. Energy Res. 22, 1133–1143. doi: 10.1002/(SICI)1099-114X(19981025)22:13<1133::AID-ER434>3.0.CO;2-E
Forsythe, C. R., Gillingham, K. T., Michalek, J. J., and Whitefoot, K. S. (2023). Technology advancement is driving electric vehicle adoption. Proc. Natl. Acad. Sci. U. S. A. 120, e2219396120. doi: 10.1073/pnas.2219396120
Gao, H., Koch, C., and Wu, Y. (2019). Building information modelling based building energy modelling: a review. Appl. Energy 238, 320–343. doi: 10.1016/j.apenergy.2019.01.032
Gevorgian, A., Pezzutto, S., Zambotti, S., Croce, S., Filippi Oberegger, U., Lollini, R., et al. (2022). European building stock analysis – a country by country descriptive and comparative analysis of the energy performance of buildings. Bolzano, Italy: EURAC Research.
Heeren, N., Jakob, M., Martius, G., Gross, N., and Wallbaum, H. (2013). A component based bottom-up building stock model for comprehensive environmental impact assessment and target control. Renew. Sust. Energ. Rev. 20, 45–56. doi: 10.1016/j.rser.2012.11.064
Heiple, S., and Sailor, D. J. (2008). Using building energy simulation and geospatial modeling techniques to determine high resolution building sector energy consumption profiles. Energ. Buildings 40, 1426–1436. doi: 10.1016/j.enbuild.2008.01.005
Huang, Y. J., and Brodrick, J. (2000). A bottom-up engineering estimate of the aggregate heating and cooling loads of the entire U.S. building stock. Available at: https://escholarship.org/uc/item/5hv2t661 (Accessed February 26, 2024).
Integrated Environmental Solutions (IES) (2023a). Digital twins for the built environment | IES. Available at: https://www.iesve.com/digital-twins (Accessed February 21, 2024).
Integrated Environmental Solutions (IES) (2023b). iVN local energy Decarbonisation | products | IES. Available at: https://www.iesve.com/products/ivn (Accessed February 21, 2024).
Intergovernmental Panel on Climate Change (2021). “Climate change 2021 – The physical science basis” in Working group I contribution to the sixth assessment report of the intergovernmental panel on climate change. 1st ed (New York, NY: Cambridge University Press).
International Energy Agency (2021). Net zero by 2050—a roadmap for the global energy sector. Paris: IEA.
International Energy Agency (2023). Buildings—energy system. IEA. Available at: https://www.iea.org/energy-system/buildings (Accessed February 29, 2024).
Jaramillo, P., Kahn Ribeiro, S., Newman, P., Dhar, S., Diemuodeke, O. E., Kajino, T., et al. (2022). In IPCC, 2022: climate change 2022: mitigation of climate change. Contribution of working group III to the sixth assessment report of the intergovernmental panel on climate change. Available at: https://www.ipcc.ch/report/ar6/wg3/chapter/chapter-10/ (Accessed February 28, 2024).
Kavgic, M., Mavrogianni, A., Mumovic, D., Summerfield, A., Stevanovic, Z., and Djurovic-Petrovic, M. (2010). A review of bottom-up building stock models for energy consumption in the residential sector. Build. Environ. 45, 1683–1697. doi: 10.1016/j.buildenv.2010.01.021
Khajavi, S. H., Motlagh, N. H., Jaribion, A., Werner, L. C., and Holmström, J. (2019). Digital twin: vision, benefits, boundaries, and creation for buildings. IEEE Access 7, 147406–147419. doi: 10.1109/ACCESS.2019.2946515
Mata, É., Kalagasidis, A. S., and Johnsson, F. (2013a). A modelling strategy for energy, carbon, and cost assessments of building stocks. Energ. Buildings 56, 100–108. doi: 10.1016/j.enbuild.2012.09.037
Mata, É., Sasic Kalagasidis, A., and Johnsson, F. (2013b). Energy usage and technical potential for energy saving measures in the Swedish residential building stock. Energy Policy 55, 404–414. doi: 10.1016/j.enpol.2012.12.023
Mata, É., Sasic Kalagasidis, A., and Johnsson, F. (2014). Building-stock aggregation through archetype buildings: France, Germany, Spain and the UK. Build. Environ. 81, 270–282. doi: 10.1016/j.buildenv.2014.06.013
Mogles, N., Walker, I., Ramallo-González, A. P., Lee, J., Natarajan, S., Padget, J., et al. (2017). How smart do smart meters need to be? Build. Environ. 125, 439–450. doi: 10.1016/j.buildenv.2017.09.008
Office of the Attorney General (2021). Climate action and low carbon development (amendment) act 2021. Office of the Attorney General. Available at: https://www.irishstatutebook.ie/eli/2021/act/32/section/15/enacted/en/html (Accessed February 27, 2024).
Qi, Q., Tao, F., Hu, T., Anwer, N., Liu, A., Wei, Y., et al. (2021). Enabling technologies and tools for digital twin. J. Manuf. Syst. 58, 3–21. doi: 10.1016/j.jmsy.2019.10.001
Raj, P., and Surianarayanan, C. (2020). Chapter Twelve - Digital twin: the industry use cases. Adv. Comput. 117, 285–320. doi: 10.1016/bs.adcom.2019.09.006
Ramu, S. P., Boopalan, P., Pham, Q.-V., Maddikunta, P. K. R., Huynh-The, T., Alazab, M., et al. (2022). Federated learning enabled digital twins for smart cities: concepts, recent advances, and future directions. Sustain. Cities Soc. 79:103663. doi: 10.1016/j.scs.2021.103663
Reeves, K. (2023). Limerick City and County Council Summary Report for the Preparation of the Local Authority Climate Action Plan. Limerick: Limerick City and County council. Available at: https://www.limerick.ie/sites/default/files/media/documents/2024-03/local-authority-climate-action-plan-2024-2029.pdf
Reinhart, C. F., and Cerezo Davila, C. (2016). Urban building energy modeling – a review of a nascent field. Build. Environ. 97, 196–202. doi: 10.1016/j.buildenv.2015.12.001
SEAI (2019). SEAI BER Public Search. Available at: https://ndber.seai.ie/BERResearchTool/ber/search.aspx (Accessed February 21, 2024).
SEAI (2021). Energy in Ireland. Sustain. Energy Auth. Irel. Available at: https://www.seai.ie/data-and-insights/seai-statistics/key-publications/energy-in-ireland/ (Accessed February 21, 2024).
Swan, L. G., and Ugursal, V. I. (2009). Modeling of end-use energy consumption in the residential sector: A review of modeling techniques. Renew. Sustain. Energy Rev. 13, 1819–1835. doi: 10.1016/j.rser.2008.09.033
Tahmasebinia, F., Lin, L., Wu, S., Kang, Y., and Sepasgozar, S. (2023). Exploring the benefits and limitations of digital twin Technology in Building Energy. Appl. Sci. 13:8814. doi: 10.3390/app13158814
Tardioli, G., Kerrigan, R., Oates, M., O’Donnell, J., and Finn, D. P. (2018). Identification of representative buildings and building groups in urban datasets using a novel pre-processing, classification, clustering and predictive modelling approach. Build. Environ. 140, 90–106. doi: 10.1016/j.buildenv.2018.05.035
Tardioli, G., Narayan, A., Kerrigan, R., Oates, M., O’Donnell, J., and Finn, D. P. (2020). A methodology for calibration of building energy models at district scale using clustering and surrogate techniques. Energ. Buildings 226:110309. doi: 10.1016/j.enbuild.2020.110309
US Department of Energy (2016). About Building Energy Modeling. Available at: https://www.energy.gov/eere/buildings/about-building-energy-modeling (Accessed February 18, 2024).
Wright, L., and Davidson, S. (2020). How to tell the difference between a model and a digital twin. Adv. Model. Simul. Eng. Sci. 7:13. doi: 10.1186/s40323-020-00147-4
Keywords: digital twin, decarbonisation, climate action plan, baseline, built environment, energy, carbon emissions
Citation: Byrne N, Pierce S, De Donatis L, Kerrigan R and Buckley N (2024) Validating decarbonisation strategies of climate action plans via digital twins: a Limerick case study. Front. Sustain. Cities. 6:1393798. doi: 10.3389/frsc.2024.1393798
Edited by:
Xiangfei Kong, Hebei University of Technology, ChinaReviewed by:
Carmelina Cosmi, National Research Council (CNR), ItalyDiana D’Agostino, University of Naples Federico II, Italy
Copyright © 2024 Byrne, Pierce, De Donatis, Kerrigan and Buckley. This is an open-access article distributed under the terms of the Creative Commons Attribution License (CC BY). The use, distribution or reproduction in other forums is permitted, provided the original author(s) and the copyright owner(s) are credited and that the original publication in this journal is cited, in accordance with accepted academic practice. No use, distribution or reproduction is permitted which does not comply with these terms.
*Correspondence: Niall Byrne, bmlhbGwuYnlybmVAaWVzdmUuY29t