 Pedro Pierucci1*
 Feni Agostinho1
 Cecília M. V. B. Almeida1Fernando J. C. Demétrio2
 Biagio F. Giannetti1
- 1Post-Graduation Program in Production Engineering, Paulista University, São Paulo, Brazil
- 2Universidade Estadual do Maranhão, São Luís, Brazil
To face the growing challenges of urbanization, urban management models grounded in the principles of sustainability and smart cities are being proposed. Despite their acknowledged importance, these models are often misunderstood or improperly applied due to a lack of thorough conceptualization, and they are frequently viewed as interchangeable. The aim of this study is to verify whether a correlation exists between indicators of sustainability and smartness in cities. For a sample of 130 Brazilian cities, their Sustainability Synthetic Indicator of System (SSIS) was computed using the Five-Sector Sustainability Model (5SenSu) and data sourced from the ‘Mandala ODS’ framework. Data concerning smart city were directly sourced from the ‘Connected Smart Cities’ framework. Results show that the 5SenSu model emerges as an alternative multicriteria method, epistemologically grounded in a conceptual model capable of quantifying the sustainability of cities. This approach enables quantitative diagnostics, rankings, and benchmarks, providing information to support decision-making processes. Moreover, the correlation analyses employed reveal a moderate linear correlation (Pearson coefficient of −0.61) and a moderate rank-order correlation (Spearman coefficient of −0.59) between sustainability and smartness. Hence, it would be premature to assume that a city deemed smart would automatically be sustainable, or vice versa. Acknowledging the existing limitations, this study contributes to discussions on the conceptual understanding and quantification through indicators of sustainable and smart cities, providing information for shaping effective public policies aimed at fostering more sustainable urban environments.
1 Introduction
According to the United Nations (UN Habitat, 2022), population growth projected for the first half of the 21st century suggests that 70% of the world’s population will reside in urban areas. This demographic shift will exert pressure on urban infrastructure and economies (Cohen and Munhoz, 2016), intensifying the demand for healthcare products and services, transportation, housing, sanitation, waste management, and employment opportunities (OECD, 2012). While the needs of the population are largely similar across cities worldwide, diverse governance approaches emerge due to differing priorities set by representative institutions and local administrations responsible for planning and implementing resource investments (Yigitcanlar et al., 2019). Public management strategies shaped by distinct economic, social, and environmental priorities significantly influence the planning and development trajectories of individual cities (Nevado Gil et al., 2020), leading to varying levels of effectiveness in infrastructure and service provision for citizens.
The ECO 92 event gave rise to Agenda 21, an action plan outlining policies to advance sustainable development. This initiative is recognized as a landmark for urban monitoring grounded in sustainability principles (UN, 2020). Movements in the 1990s were strongly influenced by the Aalborg Charter (1994), which provided recommendations on best sustainability practices for European Union public managers, drawing from the experiences of Aalborg, Denmark. The charter emphasizes the importance of community participation, urban economy, social equity, spatial planning, urban mobility, global climate, and nature conservation as fundamental aspects for achieving sustainability in cities. These ideas spurred the development of various sustainability assessment and certification tools, including the Leadership in Energy and Environmental Design (LEED), the Building Research Establishment Environmental Assessment Method (BREEAM), and the Comprehensive Assessment System for Built Environmental Efficiency (CASBEE; Ahvenniemi et al., 2017). With the climate crisis at the forefront, UNDESA (2014a,b) underscored in 2014 the imperative for cities to enhance the efficiency and effectiveness of their operations. This urgency was further emphasized in the Paris Agreement (2015), which centered on mitigating greenhouse gas emissions. Subsequently, there has been a surge in initiatives aimed at transforming cities into smarter entities, leveraging innovative solutions and tools to address pressing challenges.
In recent decades, urban governance worldwide has been shaped by the principles of sustainability and smartness. Analytical tools and quantitative indicators are utilized to evaluate whether a city can be deemed sustainable and/or smart. According to Sharifi (2019), there is a proliferation of smart city assessment frameworks – numbering at least 38 – developed by consultancies, universities, institutions, and regulatory bodies. However, this proliferation underscores the significance of the topic and highlights the need for standardization in this field. Traditionally, sustainability has been associated with social and environmental considerations, whereas the concept of a smart city has been more aligned with economic aspects, technological advancements, and the efficiency of urban services. However, following the publication of the 2030 Agenda (UN, 2015), which outlines a global action plan for sustainable development, the terms “sustainable” and “smart” for cities have increasingly been used in an integrated manner, often perceived as overlapping and complementary, assessed through various indicators and interpreted differently (Huovila et al., 2019; Sharifi, 2020). Among numerous examples in the literature, Ahvenniemi et al. (2017) examined commonalities between sustainable and smart cities using 958 indicators from different frameworks. Authors found that the smart city concept focuses on education, culture, science, innovation, and information and communication technologies, while sustainability encompasses the natural and built environment, water and waste management, and transportation. The authors emphasized that both concepts acknowledge the importance of social aspects and that smart cities ultimately aim to become more sustainable. Huovila et al. (2019) compared 413 indicators from seven international frameworks for smart and sustainable cities, observing differences in the types and distribution of indicators across various city sectors. They concluded that the choice of indicators influences the outcomes, but underscored that smart cities strive to adopt technology to expedite their journey toward sustainability. In another study, Macke et al. (2019) conducted qualitative research in southern Brazil to identify strategies for achieving smart and sustainable cities, concluding that public services, infrastructure, environmental well-being, and the utilization of smart technologies are crucial factors for sustainable urban development. Machado et al. (2018) found that Brazilian city managers prioritize positioning cities as smart rather than sustainable. Yigitcanlar and Kamruzzaman (2018) analyze through panel data analysis the causal relationship between smartness and sustainability in 15 cities in the United Kingdom. The results revealed that the connection between city smartness and carbon dioxide emissions is not linear, meaning that the implementation of technologies from the studied smart city cases did not succeed in reducing CO2 emissions in the short term. Although only carbon dioxide emissions were considered to represent sustainability, which may be considered a narrow perspective of sustainability, the results indicate that smartness does not necessarily lead to sustainability. Similarly, Stamopoulos et al. (2024) found that applying the concept of the smart city industry on Greek economy can lead to economic growth. However, this comes with the cost of increased environmental burden associated with greenhouse gas emissions, suggesting that smartness and sustainability may be antagonistic. Despite a consensus in the literature that the ultimate goal is city sustainability, and the recognition of quantitative assessment frameworks for sustainability and smartness by institutions, public bodies, and universities (De Marco and Mangano, 2021), questions remain regarding the relationship between sustainable and smart cities (Martin et al., 2018; Su and Fan, 2023), whether they are synonymous, dependent, or independent concepts.
To contribute to the ongoing debate on smart and sustainable cities, this study seeks to deepen the understanding of these concepts, facilitating nuanced discussions about their similarities and distinctions. Central to this exploration is the research question: Can a smart city also be considered sustainable? Given the absence of a comprehensive international database containing a large sample of quantitative information on sustainability and smartness indicators for cities, this study focuses solely on Brazilian cities. Brazil’s cities are nationally assessed and monitored by two distinct frameworks: (i) the ‘Mandala ODS’ proposed by the National Confederation of Municipalities (CNM, 2021), which evaluates the sustainability of cities; and (ii) the ranking of Connected Smart Cities (2021), which provides a comparative assessment of a city’s level of smartness (Mello Torres et al., 2019).
The ‘Mandala ODS’ is an online framework that incorporates 30 indicators to assess city sustainability. Despite its aim to aid urban managers in promoting sustainability, it lacks a single aggregate indicator that captures a city’s overall performance, thus hindering the development of a comprehensive ranking between cities. Consequently, in this study, the multi-criteria alternative chosen to aggregate the ‘Mandala ODS’ indicators into a single measure is the conceptual model of sustainability known as the 5 Sector Sustainability Model (5SenSu; Giannetti et al., 2019), coupled with the application of goal programming philosophy. The 5SenSu model is rooted in the concept of input-state-output sustainability (Pulselli et al., 2015), which conceptualizes sustainability as a systemic relationship among social, economic, and environmental aspects. It enables the assessment of sustainability by analyzing the interplay of performance indicators from five interconnected sectors, encompassing the environment, society, and the production sector. Regarding smart city assessment, this study utilizes the annual Connected Smart Cities (2021) report, which identifies the most technologically advanced cities in Brazil. The primary objective of this report is to pinpoint cities with the highest development potential in Brazil by comparing a smart city index calculated for each city. The framework comprises 70 quantitative indicators organized into 11 thematic topics.
This study contributes to the theoretical discourse surrounding the interpretation of the terms ‘sustainable’ and ‘smartness’, which are often ascribed to cities without a comprehensive understanding of their definitions and implications. Furthermore, the study endeavors to foster deeper discussions and inform decision-making processes related to urban management in pursuit of sustainability. By quantitatively comparing the sustainability levels of cities and offering a benchmarking tool for improvement, this research provides valuable insights and support for enhancing the sustainability of urban environments.
2 Theoretical background
Before delving into the methodology employed in this study, it is crucial to outline some fundamental definitions and concepts that underpin the notions of sustainability and smartness in cities. This review aims to provide an overview of the latest scientific advancements pertaining to both concepts, encompassing their definitions, conceptual models, and methods of quantification.
2.1 Sustainable cities
The evolution of the concept of sustainable cities can be traced back to Agenda 21 (Marsal-Llacuna et al., 2015), which laid the foundation for monitoring indicators through collaborative efforts involving three types of organizations: environmental organizations, entities promoting green citizenship and more sustainable capitalism, and consultancy organizations focused on quality of life and the environment (McManus, 2012). According to Ahvenniemi et al. (2017), the scientific literature offers numerous definitions of sustainable cities. For instance, Castells (2000) posited that sustainable cities are characterized by conditions of production that do not undermine their ability to regenerate over time. Hiremath et al. (2013), on the other hand, emphasized the importance of achieving a balance between development and environmental protection, with a focus on equity in various domains such as income, employment, housing, basic services, social infrastructure, and transportation. While conceptual definitions are foundational, operationalization and quantification through indicators play an equally crucial role in supporting public policies and monitoring progress.
Methodologies for quantifying the sustainability of cities generally exhibit similarities in their evaluation indicators, often aligned with the concept of the triple bottom line discussed by Elkington (1999), which advocates for actions that address social, economic, and environmental dimensions. However, cities are complex systems, each unique in terms of climate, geography, history, wealth, culture, and other factors. These variations preclude the adoption of a one-size-fits-all approach to quantifying sustainability (Nilon et al., 2003; Chastenet et al., 2016; Gardner, 2016). Consequently, evaluation frameworks differ in the indicators considered, as well as in the weighting assigned to these indicators. Numerous frameworks utilize indicators to quantify and discuss the sustainability of cities, facilitating comparisons and the identification of effective solutions to common challenges. Examples include The Arcadis Sustainable Cities Index (Arcadis, 2022), the Annual Cities Report (UN Habitat, 2022), and The Green City Index (Siemens, 2022). However, Huang et al. (2009) noted that existing frameworks often fail to capture systemic interactions or offer normative guidance on the direction cities should take to enhance sustainability. This aspect is also considered fundamental by Cai et al. (2023), who emphasized the need for more systemic approaches, models, and/or methods to quantify city sustainability.
Studies have addressed the evaluation of indicators commonly used to assess sustainable and smart cities. Mattoni et al. (2020) proposed the Quantitative Incident Matrix Method (QIMM) as a means to quantify smartness in cities, applying the model in two cases in Italy. The results proved consistent with the Hybrid Analytical Hierarchy Process (AHP) method, considered a comparative reference in the study to verify the inherent subjectivities in both methods when quantifying smartness. Ahvenniemi et al. (2017) employed impact categories and sector classifications to conduct a two-tailed t-test, with the aim of discerning disparities between sustainability and smartness assessment frameworks for cities, based on an initial sample of 958 indicators. They found that urban sustainability frameworks tend to prioritize environmental indicators, while smart city frameworks emphasize economic and social aspects; authors suggested that ‘smart sustainable cities’ should be the ultimate goal for urban management. Huovila et al.'s (2019) study, a taxonomy was developed to classify 413 indicators based on conceptual urban focuses, city sectors and indicator types. The goal was to ascertain whether differences exist between indicators commonly associated with smart and sustainable cities. The authors concluded that smart city standards primarily focus on technology-driven solutions to achieve their objectives, whereas sustainability standards prioritize environmental considerations. Additionally, the authors highlight that while standardizing indicators is beneficial, differences in agendas, contexts, and city needs must be taken into account. In the study of Cheng et al. (2022), smart cities policies implemented in 285 cities in China improved urban green and low-carbon development projects, particularly focusing on infrastructure and services. The authors emphasized that urban scientific and technological innovation serves as the foundation, acting as a bridge between smart cities and increased sustainability. Overall, the literature indicates that related studies assess the synergy between smartness and sustainability indicators in the pursuit of sustainable development. It was observed that the adoption of smart city standards by urban management aims to accelerate sustainable development through technology. Additionally, while there are various frameworks for quantifying sustainable and smart cities, they are all, to some extent, based on indicators representing social, economic, and environmental capital.
In the Brazilian context, the ‘Mandala ODS’ (CNM, 2021) stands as a federal government initiative established by the National Confederation of Municipalities of Brazil. This project aims to diagnose, monitor, and evaluate the performance of Brazilian cities concerning their level of achievement relative to the sustainable development objectives outlined in the 2030 Agenda. The ‘Mandala ODS’ framework is accessible online free of charge and encompasses 30 indicators categorized into four domains: economic, social, environmental, and institutional. While considered an alternative for benchmarking among Brazilian cities, its usability is constrained by the absence of a multi-criteria approach to derive a single sustainability indicator. Instead, the indicators are normalized and presented in the format of a radar graph.
To achieve the objectives of this study, the five-sector sustainability model (5SenSu; Figure 1), rooted in the goal programming philosophy, is employed as a multi-criteria method for quantifying sustainability (Giannetti et al., 2019). The use of this type of model to quantify sustainability from a holistic perspective is recognized as important by Cai et al. (2023). This model is deemed suitable for analyzing any city’s characteristics due to its systemic approach, which is considered crucial for such analyses. The 5SenSu model facilitates the creation of a comparative ranking of cities’ sustainability performance while accounting for natural, social, and economic capital, which serve as suppliers and/or recipients of energy, materials, labor, or information. In the model represented by Figure 1, the environment, symbolized by Sector #1, fulfills the function of providing resources to support the production functions of Sector #3, while also serving as the recipient for byproducts, waste, and emissions for dilution. Similarly, social capital represented by Sector #4 supplies socioeconomic resources to the production unit, such as labor, knowledge, and know-how, and receives monetary compensation in return (illustrated by the dashed line). Sector #5 depicts society, which consumes the products and services generated by the productive unit in Sector #3 and compensates for these services. Additionally, Sector #5 may absorb elements that impact human well-being, such as toxic emissions or workplace accidents (negative examples), or contribute positively to indicators like Human Development Index (HDI) and GINI index (positive examples). In Figure 1, monetary circulation is depicted solely on the right side, reflecting activities conducted by humans. Resources provided by the environment are typically considered free, and no monetary exchange occurs for them. Similarly, the environment does not receive monetary compensation for diluting concentrated waste generated by human activities.
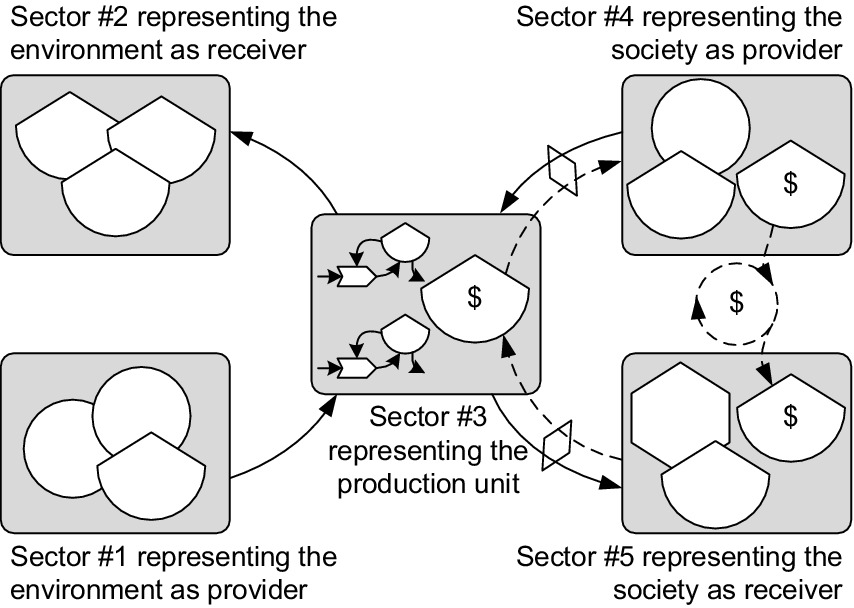
Figure 1. The five sector sustainability model (5SenSu).
It is important to emphasize that the 5SenSu model serves as a theoretical framework for selecting indicators that will feed the multi-criteria approach of the goal programming philosophy. This framework ultimately yields sustainability indicators such as the Sector Sustainability Indicator (SSI) and the Sustainability Synthetic Indicator of System (SSIS). As is customary in any multi-criteria approach, the calculation of SSI and SSIS involves establishing the importance weights and penalties for each selected indicator, which are determined based on the expertise of a group of experts. It is not the intention here to provide a comprehensive description of the model or explain its usage in detail. For a more in-depth understanding, we recommend consulting the work of Giannetti et al. (2019).
The 5SenSu model has been used in various scientific works that evaluated the sustainability of different systems, establishing itself as a mature tool for generating a comparative hierarchy of sustainability indexes. Several noteworthy studies that have employed this model include: Agostinho et al. (2019), who evaluated the sustainability of different modes of soy transport in Brazil for export; Moreno Garcia et al. (2021), who discussed the sustainability of rice production between Brazil and Cuba; Terra dos Santos et al. (2022), who examined the relationship between sustainability and circularity within global commercial blocs; Agostinho et al. (2023), who assessed the temporal sustainability performance of the expanding agribusiness region in the Brazilian northeast, known as MATOPIBA; Agostinho et al. (2022), who investigated the potential factors contributing to differences in sustainability between cities; Giannetti et al. (2022), who sought to characterize poverty traps in underdeveloped countries. These studies collectively demonstrate the versatility and applicability of the 5SenSu model in evaluating sustainability across various contexts and systems.
2.2 Smart cities
A smart city might utilize internet of things (IoT) devices, data analytics, and automation to efficiently manage resources, alleviate traffic congestion, and enhance public services. According to Dameri and Cocchia (2013), the concept of smart cities was first introduced in 1994 and has since evolved to encompass cities that effectively address the specific needs of their citizens as outlined by Agenda 2030. Smart cities represent a progression from earlier concepts such as information cities or digital cities and have gained significant traction, surpassing even the citations of terms like sustainable city (Jong et al., 2015). For Yigitcanlar et al. (2019), the technologies employed in city planning and management have become foundational elements of an extensive urban infrastructure network, aligning with the principles of sustainability. The concept of smart cities has garnered widespread attention among scholars, urban administrators, public resource planners, and particularly information technology and real estate companies (Komninos, 2008).
The scientific literature offers various definitions of a smart city, reflecting different perspectives on its essential characteristics. For instance, Vanolo (2016) defined a smart city as one that is efficient, technologically advanced, environmentally friendly, and socially inclusive. Nam and Pardo (2011) conceptualized smart cities as encompassing a combination of technological solutions along with social, technical, and environmental factors that work synergistically. Lombardi et al. (2012) noted that several definitions of smart cities emphasize the integration of modern technologies into urban life, leading to efficient and innovative transportation, infrastructure, logistics, and green energy systems. Conversely, Anthopoulos (2017) argued that the prevailing concept of smart cities tends to be technocratic, focusing predominantly on the implementation of information technology software and communication without necessarily addressing complex urban challenges comprehensively. While there is no universally accepted definition, there is a broad consensus that a smart city utilizes solutions enabled by information and communication technology across institutional, social, economic, and environmental domains. This approach is believed to enhance quality of life, promote sustainability, and bolster resilience, thereby increasing a city’s competitiveness within an interconnected network of cities (Giffinger and Gudrun, 2010; Manville et al., 2014; Monzon, 2015).
In the Brazilian context, the consultancy firm Urban Systems1 has dedicated itself to fostering discussions and promoting the concept of smart cities among government entities, institutions, and companies. Its mission is centered on advancing the development of Brazilian cities by integrating global smart city models. To achieve this goal, the consultancy has devised a ranking known as Connected Smart Cities (2021), which incorporates 70 indicators distributed across 11 thematic topics. These topics encompass technology, environment, economy, health, education, investments, and connectivity among urban sectors. The ranking aims to assess local and regional potential while highlighting areas for improvement within each thematic axis. The Connected Smart Cities (2021) framework draws upon information gleaned from international literature on smart cities, as well as from widely used frameworks in Brazil and around the world. These frameworks include but are not limited to the Sustainable Cities Brazilian Program, Brazilian Competitiveness Profile, IESE Cities in Motion, Innovation Cities Program, Mapping Smart Cities in the European Union, ARCADIS Sustainable Cities Index, and the World Council on City Data.
As previously stated, the objective of this study is not to establish a standardized definition of smart cities but rather to investigate the potential correlations between smart and sustainable cities. Consequently, it is assumed that the frameworks referenced in this study, along with their respective data, are inherently valid representations of frameworks characterizing a city as smart and/or sustainable.
3 Methods
Primary data on sustainable cities are acquired from the annual report of ‘Mandala ODS’ (CNM, 2021) and data on smart cities from the annual Connected Smart Cities ranking (2021). It is important to emphasize that while there exist international sustainability and smartness assessment frameworks, these datasets were not utilized in this study due to their incomplete nature. These databases often feature only selected cities, with some exclusively appearing in one dataset (e.g., in the sustainability framework) and absent from the other (e.g., smart city), rendering the attainment of this study’s objectives unfeasible. Consequently, this study exclusively focuses on Brazilian cities, leveraging national frameworks for analysis.
The methodological steps developed in this study are outlined in Figure 2. The initial step involves defining the sample of cities to be studied, with the objective of ensuring comprehensive coverage of the entire Brazilian territory in a representative manner. The second stage entails acquiring quantitative sustainability indicators for the cities within the sample. In the third stage, quantitative indicators pertaining to smartness data are obtained from the cities within the sample. Moving forward, the fourth stage involves the application of goal programming philosophy based on the 5SenSu model to calculate the sustainability synthetic indicator of system (SSIS). Lastly, the fifth step encompasses Pearson and Spearman correlation analyses between sustainability data (as represented by SSIS) and smart city data derived from the sample of cities under consideration. A detailed description of each of these steps is provided in the subsequent sections.
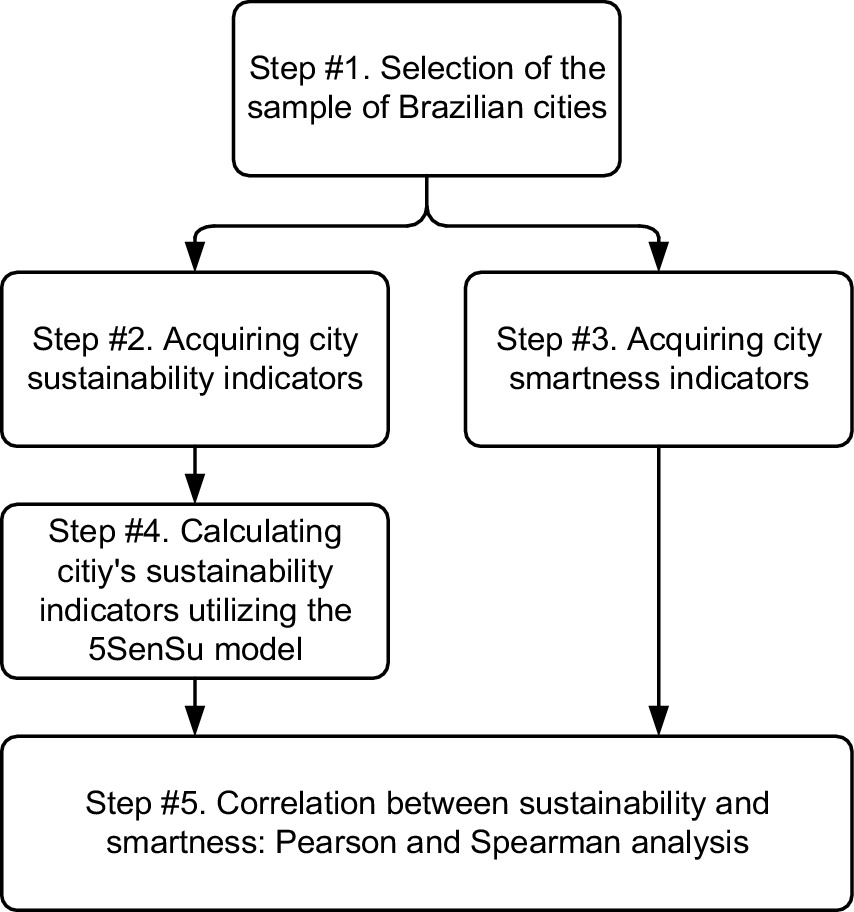
Figure 2. Methodological steps of this study.
3.1 Selection of the sample of Brazilian cities
Of the total 5,565 cities in Brazil, the sample considered in this study comprised 130 cities, all with populations exceeding 50,000 inhabitants, in accordance with the criterion utilized by the Connected Smart Cities (2021) ranking for classifying smart cities. The selection process adhered to the characteristics delineated by the seven groups specified by the ‘Mandala ODS’ framework, as delineated in Table 1. The ‘Mandala ODS’ groups presented in Table 1 were originally formulated through a cluster analysis based on indicators such as the Human Development Index, average population, mean total income, and the average proportion of individuals residing in extreme poverty. The characteristics of these groups were obtained ipsis literis from CNM (2021).
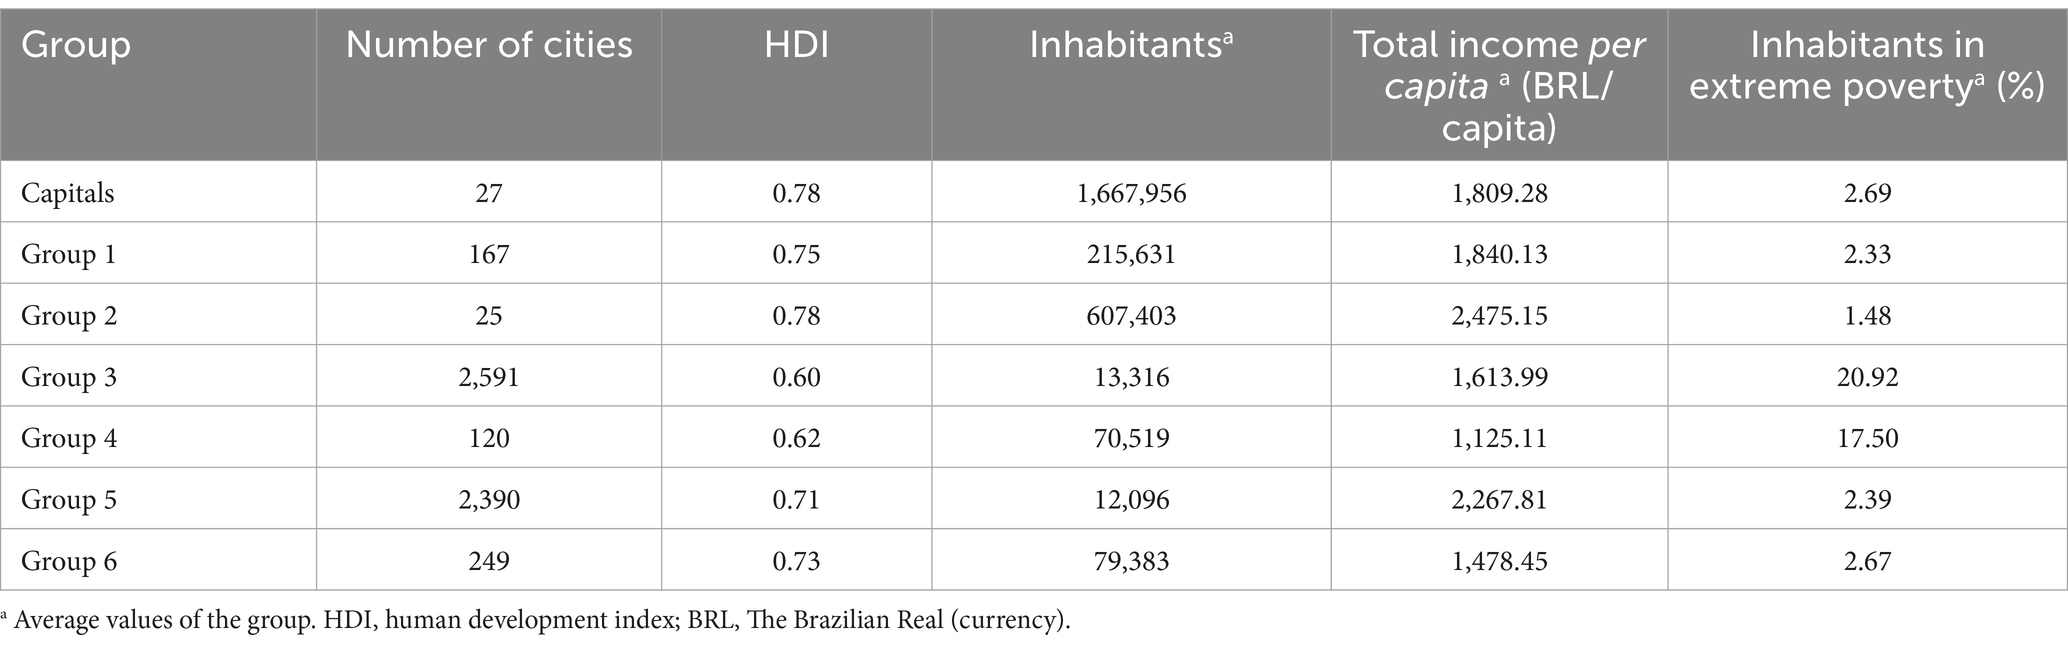
Table 1. City groups used in ‘Mandala ODS’ (CNM, 2021).
To compose the sample for this investigation, five cities – number of five for their statistical representativeness – were selected from each of the 26 Brazilian states in an effort to encompass and represent the entirety of Brazil. It’s worth noting that cities with populations exceeding 50,000 inhabitants served as the limiting factor. Notably, within each state, one city was invariably the capital due to its significance in urban socioeconomic development. The remaining four cities for each state were randomly selected by the authors using the Excel random function (=RAND()). Subsequently, the selected cities were assigned to their respective groups within the ‘Mandala ODS’, as illustrated in Table 1. This facilitated focused discussions on both the entire sample and intra-group disparities, given that certain groups may exhibit distinct statistical profiles compared to others and the aggregate sample. The ultimate sample of 130 cities analyzed in this study encompasses 26 capital cities, 31 from group 1, 7 from group 2, 9 from group 3, 21 from group 4, 8 from group 5, and 28 from group 6.
3.2 Acquiring city sustainability indicators
All 30 indicators delineated within the ‘Mandala ODS’ framework (Table 2) were extracted ipsis literis from the CNM (2021), referencing the base year 2020, and organized into tabular format for each of the 130 cities within the sample. It is important to emphasize that these indicators are originally standardized on a scale of 0–1 relative to the entirety of 5,565 cities in Brazil. Furthermore, it should be noted that all indicators are calibrated to reflect a performance of ‘the bigger the better’; essentially, a value of 1 signifies optimal performance for each indicator. Table 2 not only presents the sustainability indicators categorized under their respective topics but also delineates whether each indicator is incorporated within the smart cities framework and its association with the United Nations SDGs. This contextual information is important in facilitating discussions concerning the outcomes.
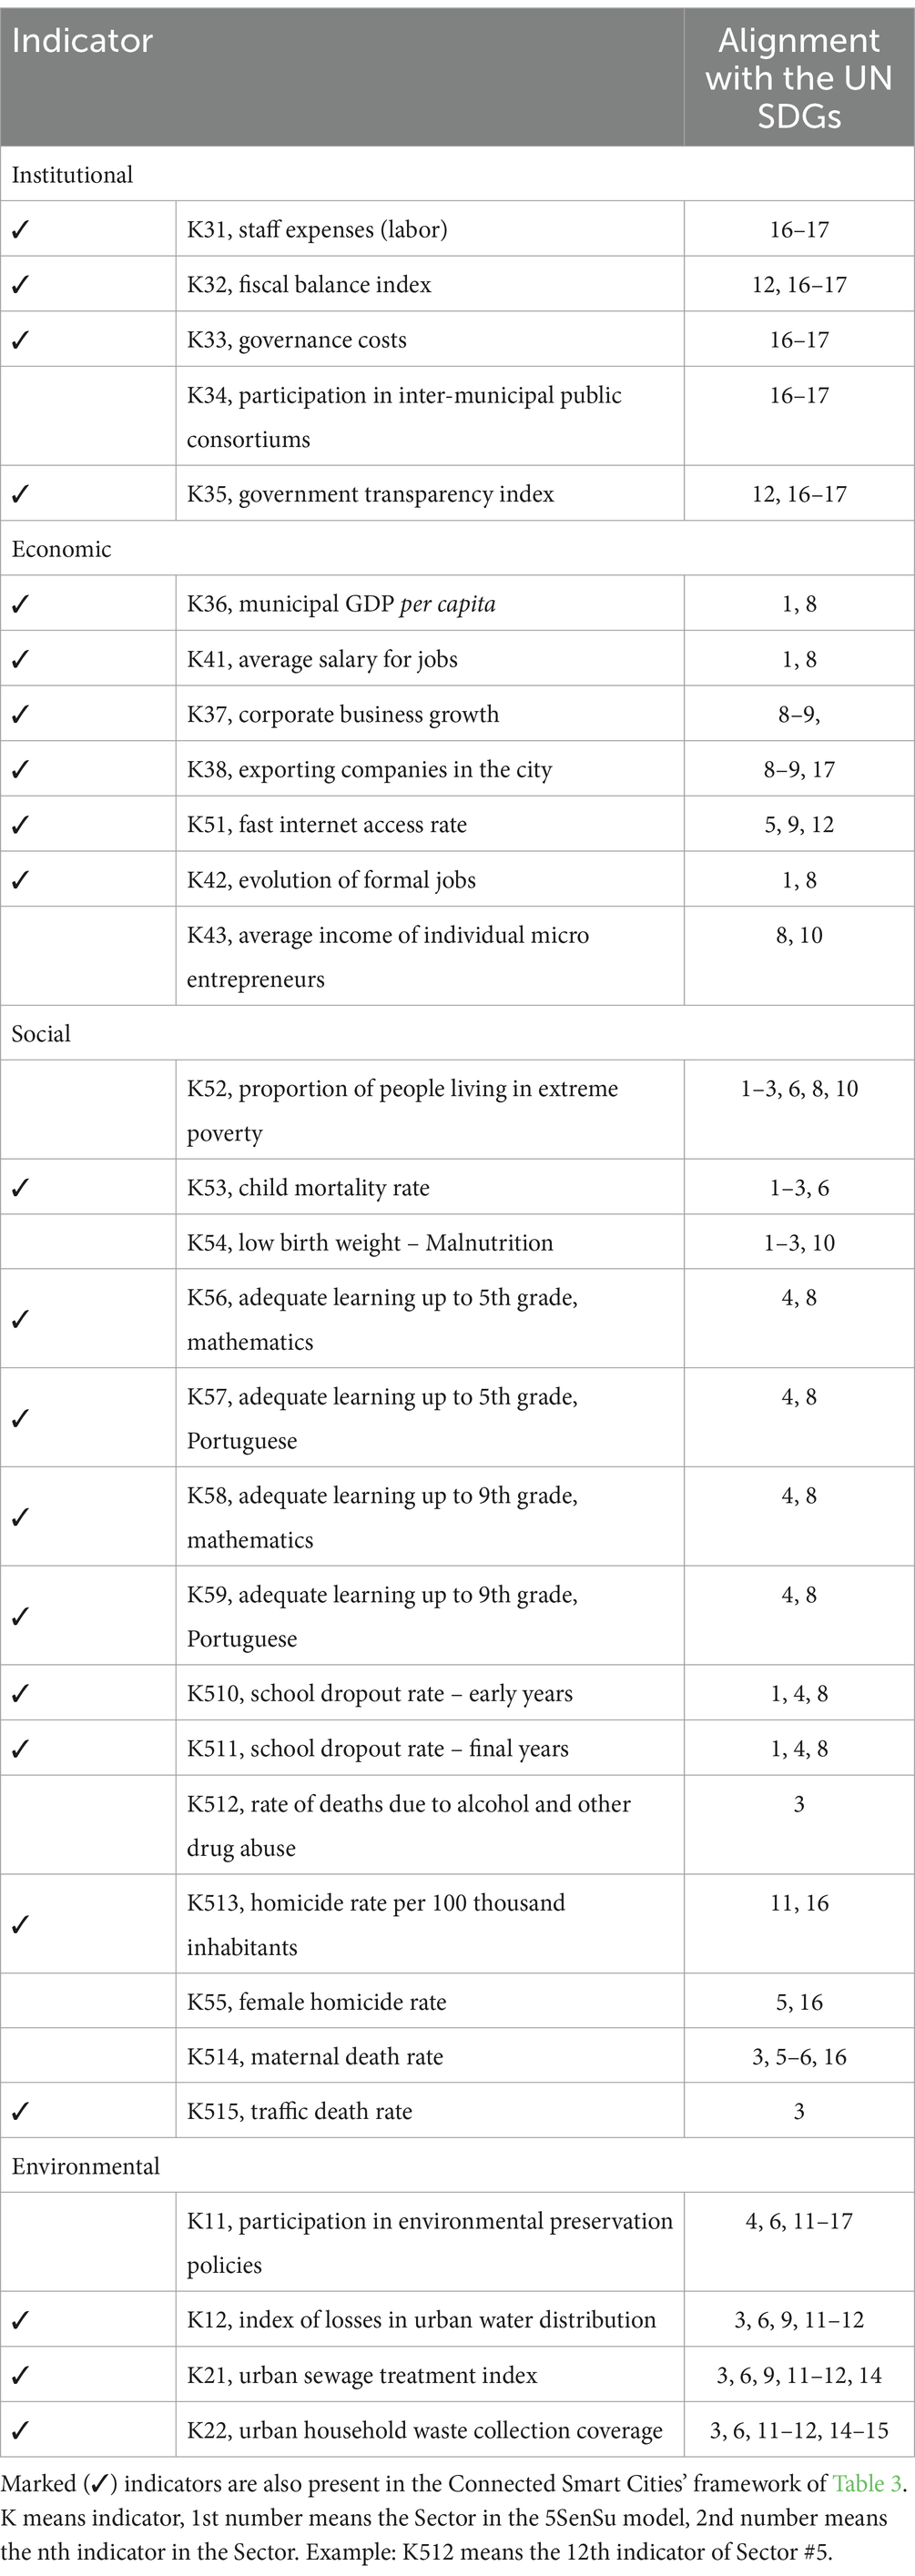
Table 2. Sustainability indicators considered by the ‘Mandala ODS’ (CNM, 2021) framework.
3.3 Acquiring city smartness indicators
The quantitative data for the seventy smart city indicators pertaining to the 130 cities considered in this study were sourced directly from the Connected Smart Cities (2021) ranking report, referencing the base year 2020. The report is compiled and revised on a yearly basis, encompassing 673 Brazilian cities. Among these, 48 cities have populations exceeding 500,000 inhabitants, 276 fall within the range of 100,000 to 500,000 inhabitants, and 349 have populations ranging from 50,000 to 100,000 inhabitants. It serves as a comparative analytical platform, incorporating 70 smart city indicators categorized into 10 distinct topics (Table 3). The data utilized in this report originates from a consolidated framework spanning multiple years, supported by a prominent consultancy firm with a portfolio of over 900 projects executed in Brazil, all adhering to international standards.
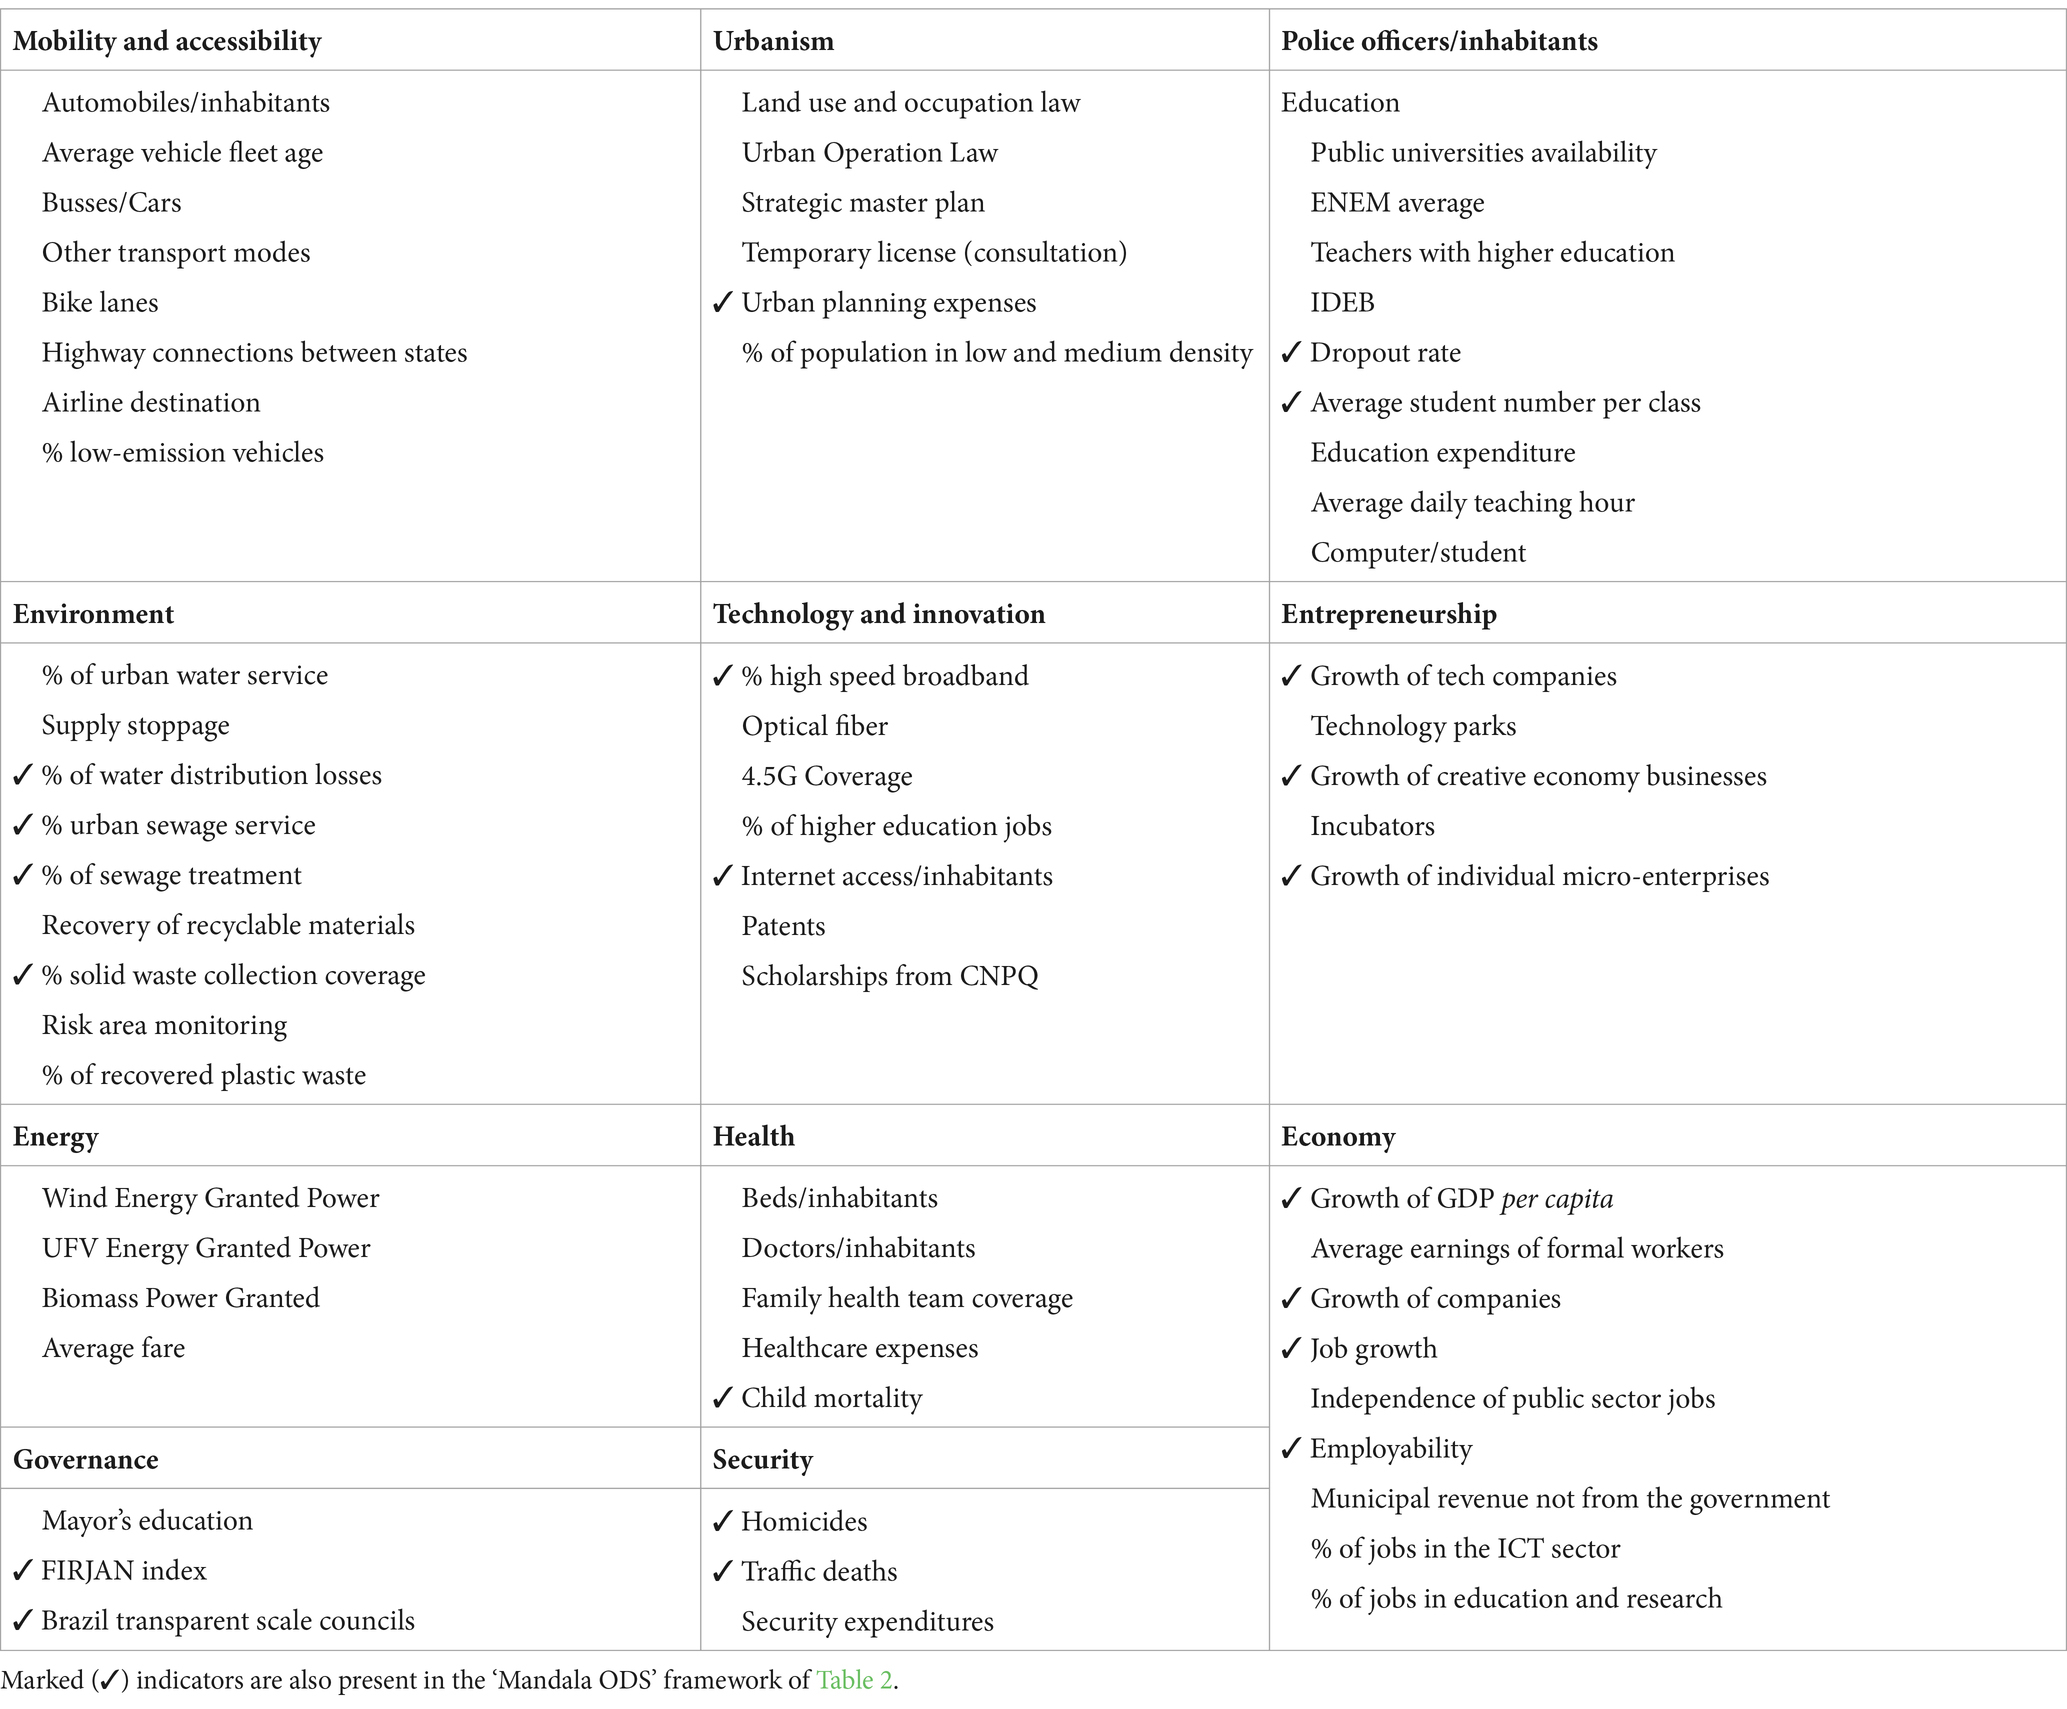
Table 3. Smart City indicators according to the Connected Smart Cities (2021) framework.
The smart city indicators are computed utilizing proprietary algebraic methodologies devised by the Urban Systems consultancy. These indicators are primarily derived from the ISO 37122 (2019) standard titled ‘Sustainable cities and communities: Indicators for smart cities,’ which was published in 2019 and encompasses eighty distinct indicators. Table 3 not only presents the smart city indicators categorized across the 10 designated topics but also delineates those indicators utilized by the ‘Mandala ODS’ framework.
3.4 Calculating city’s sustainability indicators utilizing the 5SenSu model
The ‘Mandala ODS’ framework illustrates the outcomes of its 30 indicators via a radar diagram, without employing a multi-criteria methodology to join them and derive a singular performance indicator. While this graphical representation offers certain advantages, the objectives of this study necessitate the application of a multi-criteria approach to ascertain a unified sustainability indicator. Hence, the 5SenSu model and the principles of goal programming philosophy are employed to compute the Sustainability Synthetic Indicator of System (SSIS), which represents the overall performance across all 30 ‘Mandala ODS’ indicators for each evaluated city.
Initially, the allocation of the 30 ‘Mandala ODS’ indicators to the 5 Sectors of the 5SenSu model was undertaken. This allocation process involved the collaboration of 8 students (comprising Ph.D. and M.Sc. candidates) and 4 professors from the Cleaner Production Research Group at Paulista University, Brazil. It was conducted through participatory meetings held during seminars in the autumn of 2021. Building upon an initial proposal presented to the research group, participants individually assigned the 30 ‘Mandala ODS’ indicators to the Sectors of the 5SenSu model based on their own beliefs and comprehension. An online questionnaire facilitated this activity, utilizing Microsoft® Forms. The final allocation of indicators was determined through a simple majority consensus among participants’ opinions, resulting in the distribution depicted in Figure 3. Specifically, Table 2 delineates which ‘Mandala ODS’ indicators were assigned to each 5SenSu Sector, including K1 indicators for Sector #1, K2 for Sector #2, and so forth.
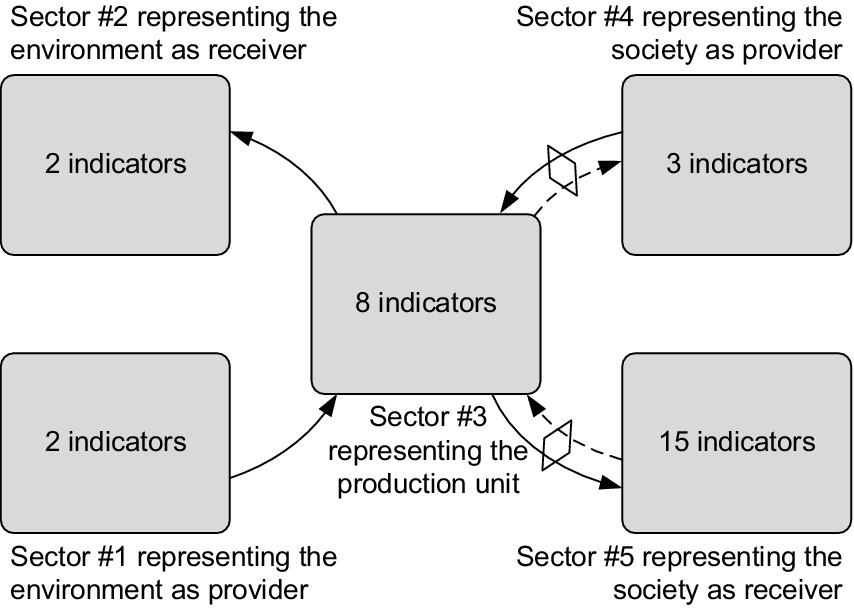
Figure 3. Distribution of ‘Mandala ODS’ indicators in the 5SenSu model.
After the indicator allocation stage, the sustainability synthetic indicator of the system (SSIS) is calculated for each of the 130 cities evaluated. To achieve this, objectives, targets, importance weights, and penalties are utilized as required by the goal programming philosophy approach, automated in an Excel® spreadsheet and provided as Supplementary material A. The original mathematical modeling of the goal programming philosophy can be observed in Giannetti et al. (2019) and Agostinho et al. (2019). The SSIS indicator is calculated by summing the sector sustainability indicator (SSI) of each of the five sectors, which are derived from the arithmetic mean of the index of sustainability goal (ISG). The ISG represents the deviation of the indicator from its target, determined subsequent to the application of a penalty when the indicator deviates above or below the specified target. Concerning penalties, an egalitarian psychological profile of the analyst was adopted, wherein the social, environmental, and economic sectors incur penalties of 2.7, 4.5, and 1.8, respectively, as elaborated in Agostinho et al. (2019). As all the ‘Mandala ODS’ indicators are originally oriented to reflect ‘bigger is better,’ the objective for all of them is maximization. An importance weight of 1 was assumed for all 30 indicators. Concerning the targets, the following criteria were considered: (i) For the Boolean indicators K11 and K34 (Table 2), which assume values of 0 or 1, the target selected is the value of 1, indicating compliance with that specific indicator by the municipality; (ii) For indicators K12, K21, K22, K31, K34, K35, K36, K37, and K38, the chosen target is the maximum value of the indicator within the sample of cities belonging to the group. It is understood that if a city in the group can achieve a certain performance for these specific indicators, other cities within the group have the same potential to attain similar performance; (iii) For all other indicators not fitting criteria (i) or (ii), the selected target is the average value of the indicator plus its standard deviation within the group. Unlike (ii), it is understood that achieving the best performance identified in the group for these types of indicators would be more challenging for all cities. It is important to emphasize that a lower SSIS value corresponds to greater sustainability of the system, indicating minimal deviation from the established target. The optimal performance for SSIS is a value of zero, signifying that the system achieves indicators precisely equal to the chosen goals.
3.5 Correlation between sustainability and smartness: Pearson and Spearman analysis
After obtaining the sustainability (SSIS) and smartness indicators for the 130 cities in the sample considered, a correlation analysis was conducted to address the main objective of this study. The well-established linear correlation concepts of Pearson and Spearman rank-order correlation were employed to assess the relationship between SSIS indicators and smartness indicators. The Pearson correlation coefficient (r) or product–moment correlation coefficient quantifies the degree of linear correlation between two quantitative variables. It is a dimensionless measure ranging from −1 to 1, indicating the strength of a linear relationship between two datasets. A value of r = 1 indicates a perfect positive correlation between the two variables, r = −1 signifies a perfect negative correlation, and r = 0 suggests no linear dependence between the variables. For values falling between 0 and 1, the conventional interpretation of correlations as recommended by Schober et al. (2018) is considered: 0.00–0.10 denotes negligible correlation; 0.10–0.39 implies weak correlation; 0.40–0.69 suggests moderate correlation; 0.70–0.89 indicates strong correlation; and 0.90–1.00 represents very strong correlation.
The Spearman rank-order correlation is a non-parametric measure of correlation. Unlike Pearson’s correlation coefficient, Spearman’s coefficient does not assume that the relationship between variables is linear, nor does it require the variables to be quantitative. Instead, it evaluates the monotonic relationships between variables, focusing on the order or ranking of variable values. The coefficient ranges from +1, indicating a high correlation when observations have similar ranks, to −1, indicating a high correlation that is completely opposite; a value of 0 indicates dissimilar ranks. For intermediate values, the same interpretation as for Pearson correlation is used to evaluate the strength of the correlation. Assessment of Pearson and Spearman correlations is conducted using Excel® software.
After calculating the correlation coefficients, the assessment of the results’ acceptance or rejection was conducted by applying the linear regression significance test to the correlation coefficients. The significance test is a statistical method that examines whether there is a functional relationship between values, where the function explains a significant portion of the variation among these values. In this study, the significance test (at a 95% confidence level) was performed using Excel® software on the obtained series of coefficients. p-values greater than 0.05 indicate that the correlations are not statistically significant and should be rejected. Conversely, p-values less than 0.05 indicate statistical significance, suggesting that the correlation results obtained should not be rejected.
4 Results and discussion
4.1 Cities’ sustainability indicators according to the 5SenSu model
The allocation of the ‘Mandala ODS’ indicators into the Sectors of the 5SenSu model (Figure 3) revealed that 15 out of the 30 indicators are assigned to social Sector #5, depicting society as a recipient of products, services, and social policies. This highlights an imbalanced distribution of ‘Mandala ODS’ indicators within 5SEnSU, with the social Sector notably emphasized at the expense of other Sectors. It is important to note that the configuration of indicators within the UN’s SDGs has faced criticism due to the existing imbalance in representing social, economic, and environmental capital. For instance, Wackernagel et al. (2017) identified that only 13.6% of the 169 indicators across the 17 SDGs pertain to environmental aspects as providers of energy, materials, and as receivers of concentrated by-products for natural dilution. Similarly, Giannetti et al. (2019) assessed the allocation of the 17 SDGs in the 5SenSu model and discovered that social capital (Sectors #4 and #5) and economic capital (Sector #3) are accorded greater significance than environmental capital (Sectors #1 and #2). The findings depicted in Figure 3 align with those of both aforementioned studies, as natural capital is represented by merely 4 (23%) out of the 17 SDGs. While social aspects are acknowledged as fundamental to sustainability in a world characterized by escalating social inequalities, it is imperative to recognize that environmental aspects should receive equitable attention, as the environment is fundamental in ensuring the biophysical security of the Planet.
As a result of applying the 5SenSu model and goal programming philosophy, Table 4 presents the top ten most sustainable cities among the 130 evaluated in this study, based on the values of the sustainability synthetic indicator of system (SSIS) from the total sample of cities available in Supplementary material B. The cities are ranked based on their respective SSIS values, with the objective of reducing SSIS to zero, as lower SSIS values signify greater sustainability for a city. The SSIS value comprises the sector sustainability indicator (SSI) values of the five Sectors, with the ranking serving two primary purposes: (i) Firstly, it identifies the city with the highest sustainability level, both in the overall ranking and within its group, serving as a benchmark for other cities. For instance, Table 4 reveals that the top five cities deemed most sustainable by the SSIS indicator are Curitiba, Londrina, Jaguariúna, Pato Branco, and Itajaí, which could serve as references in urban planning for sustainability. (ii) Secondly, it indicates which Sector requires attention to enhance its performance, thereby influencing the overall SSIS. Despite Sorriso ranking the lowest in Table 4, it demonstrates better performance in Sector #3 with an SSI of 0.27 compared to top-ranked cities like Curitiba (Sector #3 with an SSI of 0.31). However, the SSIS, which is a result of the city’s performance across all five Sectors, indicates greater overall sustainability for Curitiba. This example illustrates how city managers could utilize such information to focus efforts on specific public policies and project financing to improve the city’s underperforming Sectors. For instance, Curitiba could examine Sorriso’s strategies to achieve better performance in Sector #3.
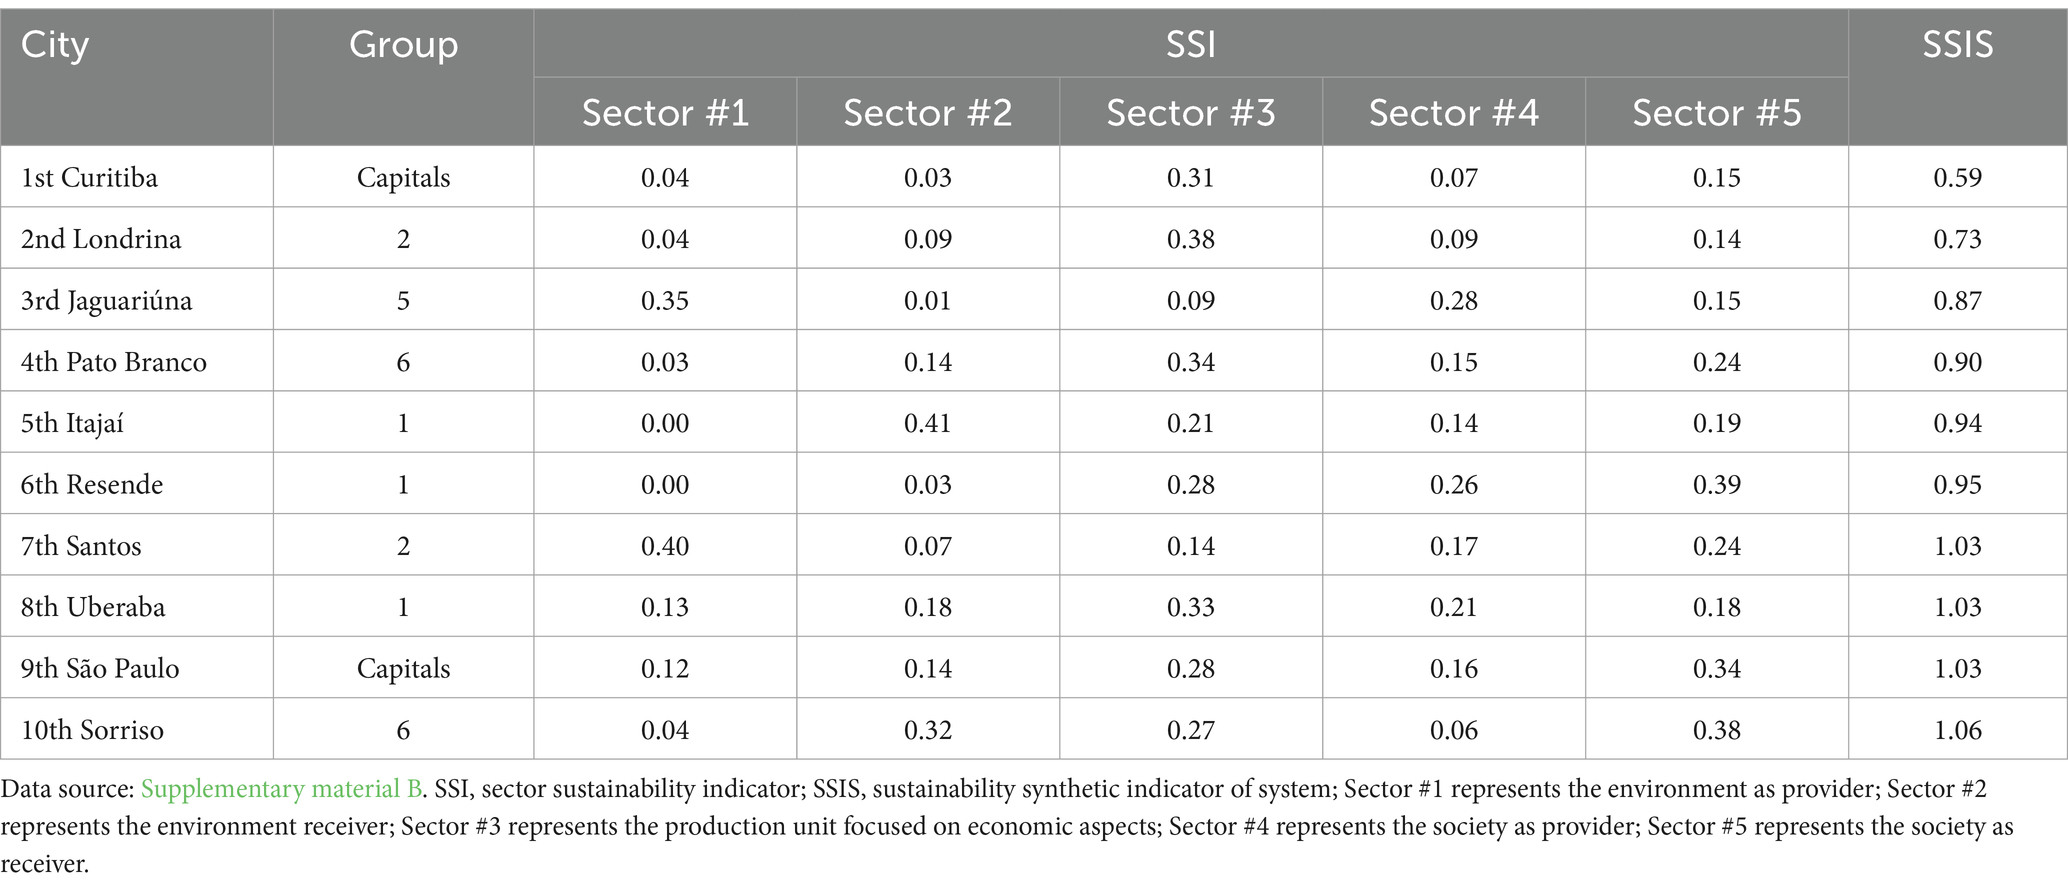
Table 4. Top-ten most sustainable cities of the sample of 130 cities evaluated in this study.
It’s noteworthy that both Curitiba and São Paulo ranked among the top ten most sustainable cities according to the methodologies employed in this study, corroborating their reputation for good development with a focus on sustainability across various frameworks, such as The Arcadis Sustainable Cities Index (Arcadis, 2022), the annual cities report by UN Habitat (2022), and The Green City Index by Siemens (2022). Nevertheless, Table 4 underscores that there is still room for improvement, particularly in Sector #3 for the city of Curitiba and in Sectors #3 and #5 for São Paulo. A similar analysis to identify areas where efforts should be concentrated to enhance the SSIS can be conducted for each of the 130 cities evaluated, with their data available in Supplementary material B. This approach enables cities to pinpoint specific Sectors requiring attention and prioritize initiatives to bolster overall sustainability performance.
4.2 Cities’ smartness indicator according to the connected smart system ranking
Table 5 presents the top 10 smartest cities evaluated by Connected Smart Cities (2021), where the cities with the highest positions may not necessarily have the best performance in all. The overall smart city index consists of 10 topics, and the general index does not correspond to the sum of individual performances. Cities ranked highly by the general index may exhibit lower performance in certain topics compared to others. For instance, Recife, with a score of 4.33, demonstrated superior performance in the Health topic compared to São Paulo, which scored 3.73. Notably, most of the smartest cities are capitals, with the exception of Santos. This is likely attributed to their access to a greater number of economic resources, as well as having a more developed economy, mobility infrastructure, and technology and innovation projects. Of particular interest, the city of Curitiba was recently recognized as the smartest city in the world according to the World Smart City Awards 2023.
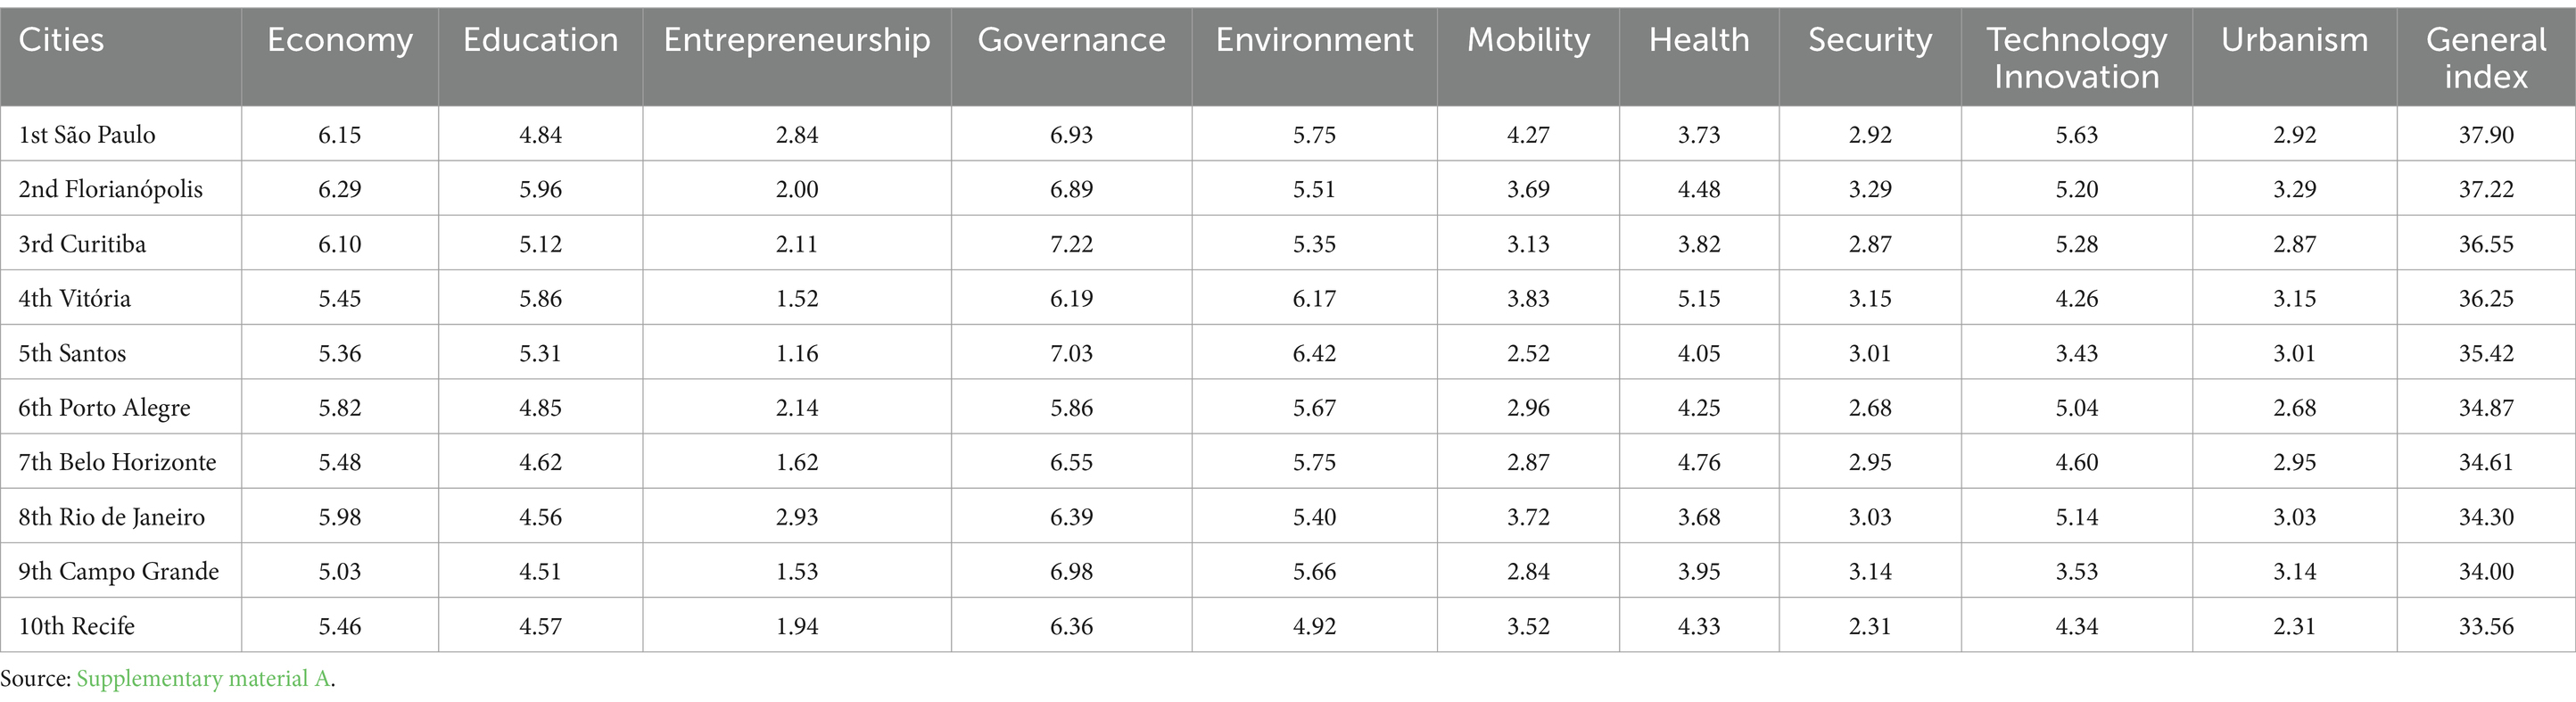
Table 5. Top-ten smartest cities of the sample of 130 cities evaluated in this study.
For the correlation analyses, the smartness indicators of the 130 cities studied (Supplementary material A) provided by Connected Smart Cities (2021) were utilized. These indicators were calculated using the method’s own algebra. Unfortunately, access to this algebra within the framework was not possible, as the method is not publicly available. Consequently, more detailed discussions regarding the performance of cities by specific topics are currently limited. The annual report explains that the weighted value of each indicator analyzed for each city is determined based on its direct relationship with the values observed in other cities, with the magnitude of these values relative to the set of observed values. In short, as previously described in the methods section, smart city data provided by Connected Smart Cities (2021) were used ipsis literis in this study, assuming that they accurately reflect the degree of smartness of the cities evaluated.
4.3 Correlation analysis
Table 6 presents the results of the Pearson and Spearman correlation coefficients, along with the outcomes of the significance tests (p-value). The results are presented in two contexts: between groups and considering the total of 130 cities. It is notable that all correlation coefficients are negative, generally suggesting an inverse correlation between the indicators of sustainable cities (represented by SSIS) and smart cities. This implies that as one indicator increases, the other decreases, and vice versa. However, it’s crucial to remind that unlike the smartness indicator, the SSIS sustainability indicator should be interpreted as ‘lower is better’. This means that a lower SSIS value indicates greater sustainability of the system as it aligns more closely with the established goals. In essence, Table 6 suggests that, a priori, smarter cities tend to also be more sustainable.
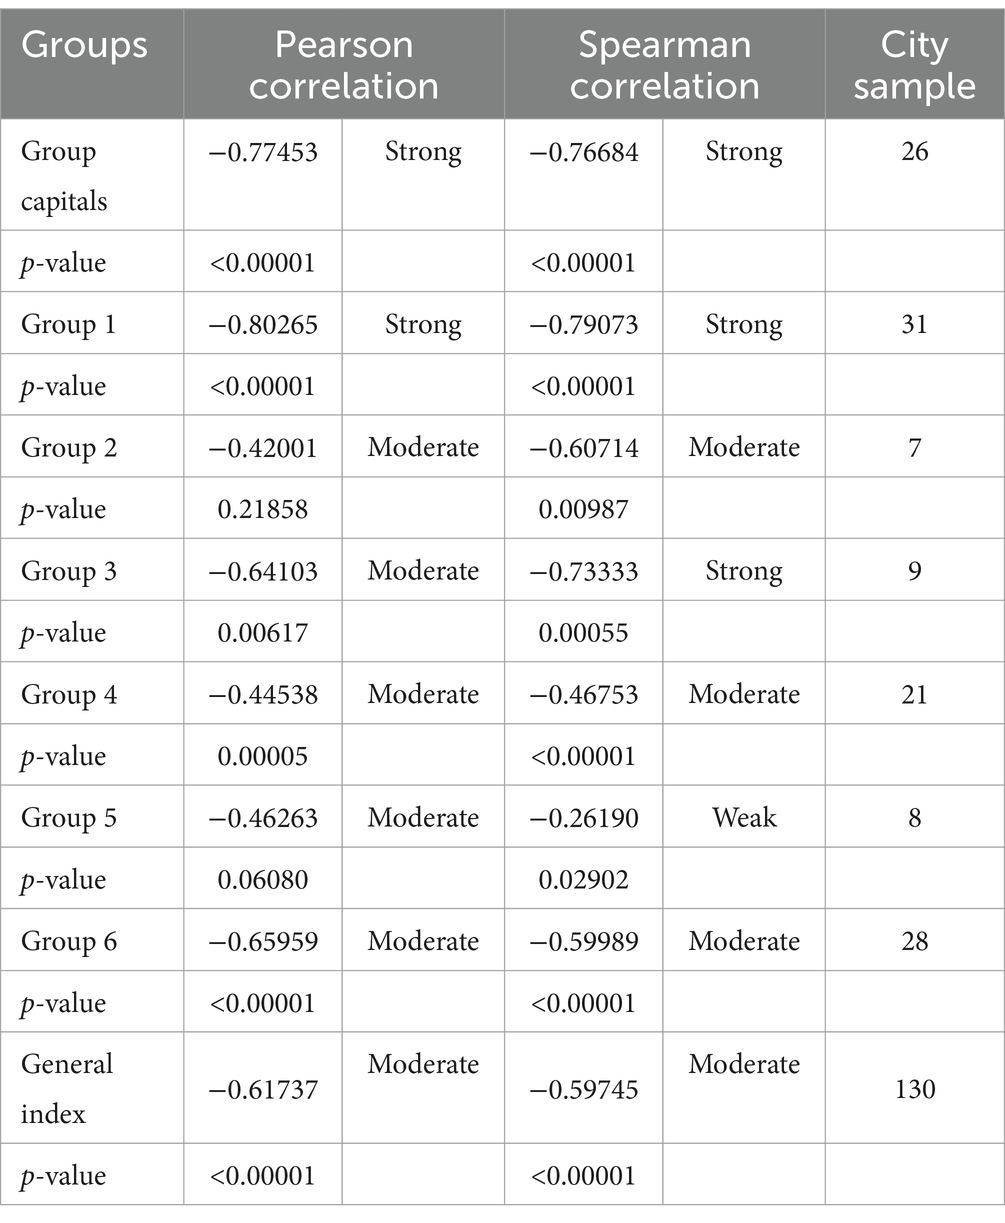
Table 6. Correlation coefficients between the SSIS sustainability index and the general smart city index.
Focusing on the analysis of the groups, the Pearson and Spearman coefficients obtained for the capital and group 1 indicate a ‘strong’ linear correlation (Pearson) and ‘strong’ rank-order correlation (Spearman) between sustainability and smartness. For groups 2, 4, and 6, the results indicate a ‘moderate’ linear correlation. For groups 3 and 5, the linear correlation coefficient is ‘moderate’, but while the rank-order correlation is ‘weak’ for group 5, group 3 exhibits a ‘strong’ correlation. Except for groups 2 and 5, the significance tests applied demonstrate that the linear and rank-order correlation coefficients are significant for all other groups, supporting the non-rejection of existing correlations. Groups 2 and 5 did not achieve statistical significance for their correlation results, either due to the small sample size (n < 9) or due to disparities between the sustainability and smartness of the cities within the group; therefore, both correlations must be rejected.
To discuss the correlation results obtained, it is important to consider the characteristics of the ‘Mandala ODS’ groups to ascertain whether a relationship exists between the group characterization items and the correlation coefficients obtained. For instance, the groups capital, 1, 2, 5, and 6 are characterized by the ‘Mandala ODS’ as having an average HDI above 0.71 and an average poverty rate below 2.69%, indicative of cities with good socioeconomic development. On the other hand, groups 3 and 4 exhibit an HDI below 0.70 and an average poverty rate above 17.50%, traits typical of cities with low socioeconomic development. Additionally, groups 3 and 5 differ from the others in that they include cities with populations below 12,000 inhabitants. Considering these characteristics, the correlation results in Table 6 suggest the existence of two groups of cities with similar performances: (i) Capitals and group 1; (ii) Groups 3, 4, and 6. Groups 2 and 5 do not exhibit statistical significance (p-value <0.05), and thus they are not discussed. It was expected that cities with similar socioeconomic performance would demonstrate similar correlations between smart city and sustainability indicators. However, an exception occurred for group 6. Despite comprising more developed cities with good performance for socioeconomic indicators as presented in Table 1, it obtained only a ‘moderate’ correlation instead of the expected ‘strong’ correlation seen in group Capitals and group 1, which also have high socioeconomic indicators like group 6. Among the correlations obtained, group 1 followed the results of the group capitals, indicating strong correlations, despite being characterized by an average HDI lower than 0.75, an average population of 215,000 inhabitants, and an average poverty rate of 2.33%. Future studies are suggested to better comprehend the potential reasons for the disparities between smartness, sustainability, socioeconomic performance, and population among the studied groups. An effort in this direction was the study conducted by Agostinho et al. (2022), which evaluated the potential influence of cultural factors such as population density, academic background of mayors, their political ideology, and gender on the sustainability degree of cities.
Focusing on the analysis of the general performance considering the 130 cities, Table 6 revealed that the SSIS indicators and the general smart city index exhibited a ‘moderate’ linear correlation of −0.61 and a ‘moderate’ rank-order correlation of −0.59, both of which were statistically significant (p-value<0.0001). These results support the claim that there exists a correlation between sustainability and smartness, albeit to a moderate degree. The spatial distribution of the relationship between sustainability and smart city is depicted in Figure 4. Visually, there appears to be a trend of improvement for sustainability as smartness also improves. Although a cluster analysis was not conducted, cities in the group Capitals tended to exhibit higher levels of smartness and sustainability, while cities in groups 3, 4, and 6 tended to display lower performance for both smartness and sustainability indicators. The trend line proposed in Figure 4 aims to facilitate the visualization of the data’s behavior. However, it’s important to note that the corresponding equation of this model can only explain 38% of the data.
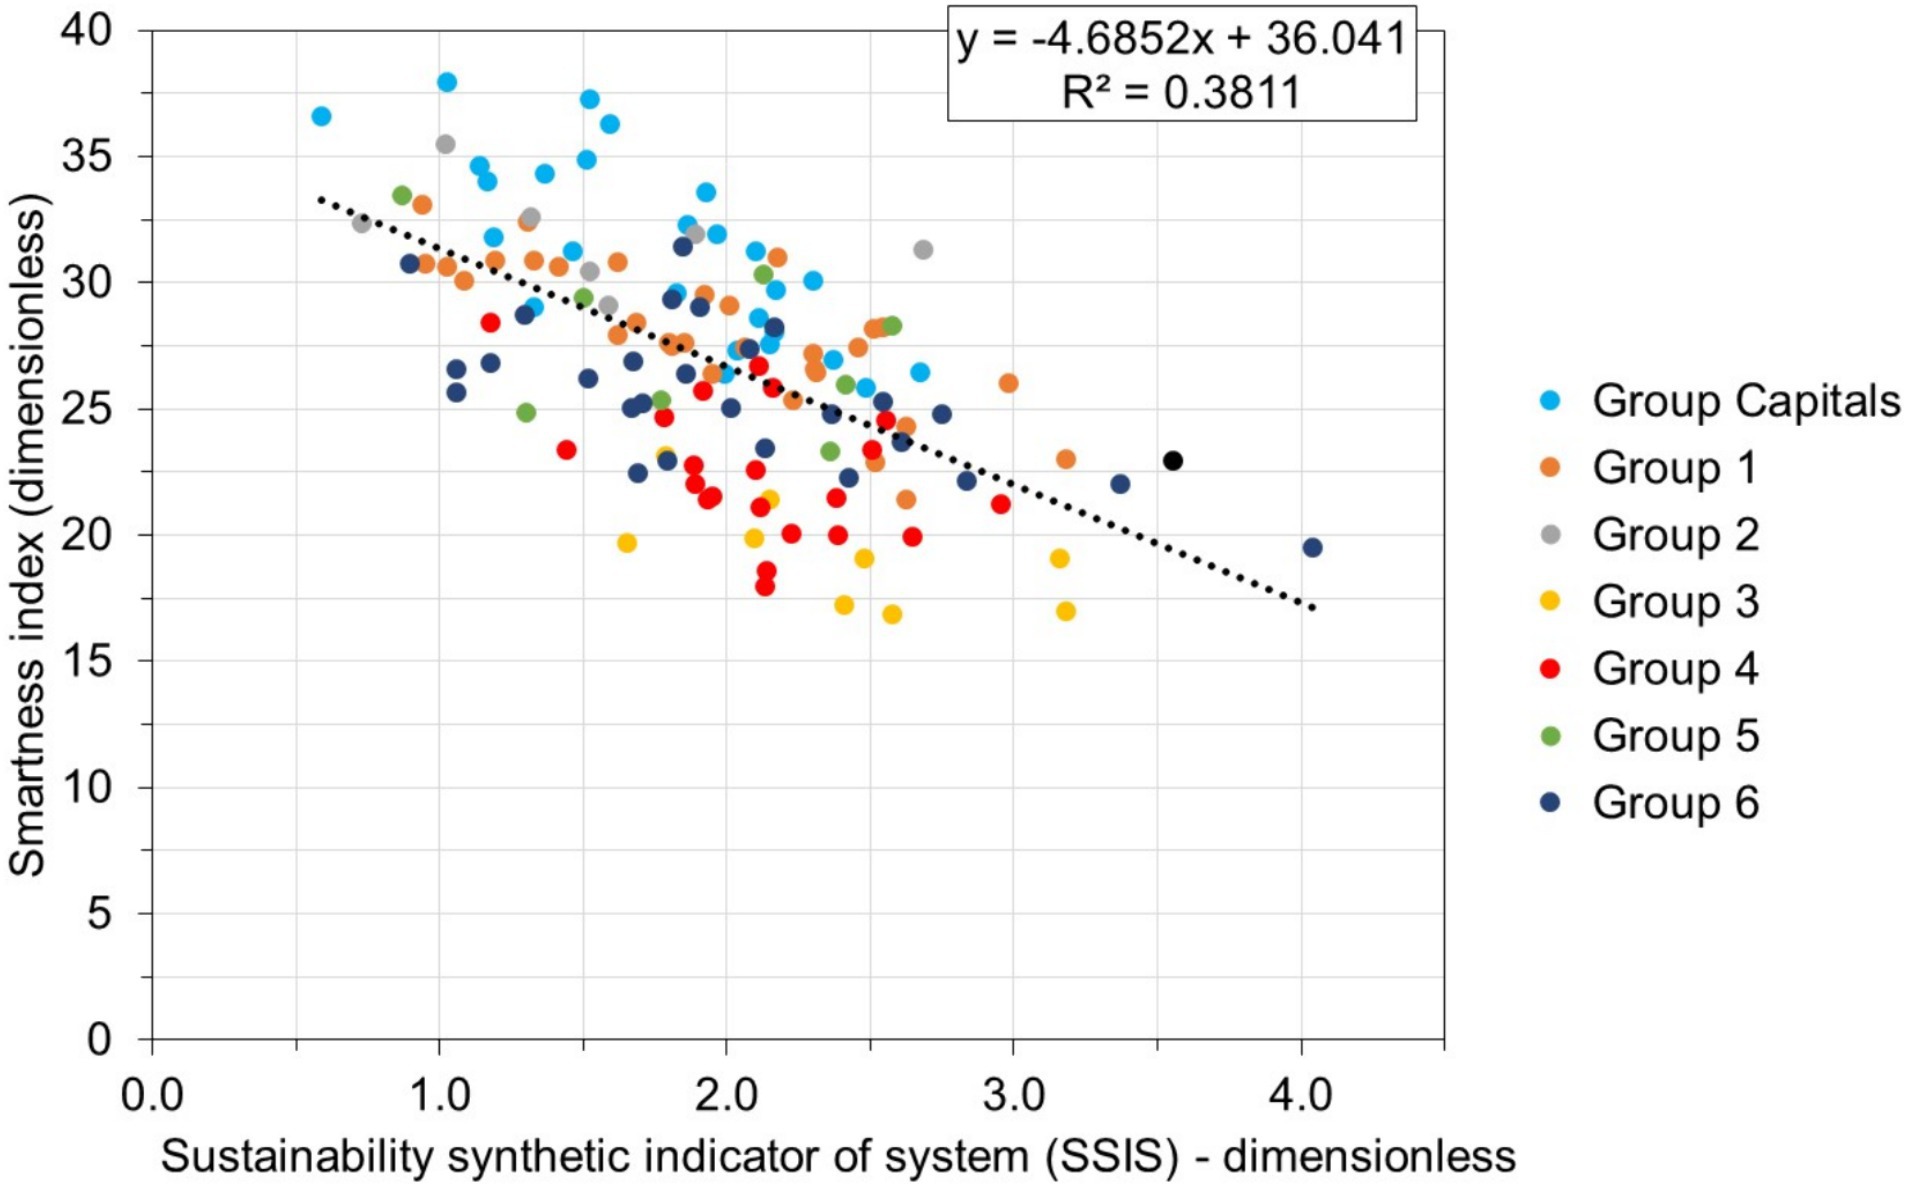
Figure 4. Scatter plot between sustainability and smartness index for the sample of 130 cities evaluated.
Despite not exhibiting a strong linear correlation, the moderate linear correlation (−0.61) observed between sustainability and smart cities aligns with findings from Ahvenniemi et al. (2017). These authors argued that the primary objective of a smart city is to enhance its sustainability through the utilization of modern equipment and technologies. This viewpoint is further supported by the European Commission (2012), Habitat III (2016), and Sharifi (2019), which emphasized the development of systems and technologies to address the socioeconomic and environmental challenges faced by cities, thereby striving for greater efficiency and effectiveness in achieving the UN’s SDGs. Machado et al. (2018) also suggested that in the case of Brazilian cities, there is a tendency for cities to initially prioritize becoming smarter over achieving sustainability in the short term. This notion is in line with Baum et al. (2004), who proposed that smart cities leverage technology to attain environmental benefits and ultimately achieve sustainability. However, contrary to these perspectives, Yigitcanlar et al. (2019) proposed that current practices in smart cities may not effectively support the attainment of progressive and genuine sustainable goals. They argued for the need for a post-anthropocentric approach to truly foster smart and sustainable cities, which is also claimed by Cai et al. (2023) regarding the need of more holistic models and methods to evaluate city sustainability. Focusing on CO2 emissions, Yigitcanlar and Kamruzzaman (2018) and Stamopoulos et al. (2024) found that implementing smart city concepts does not lead to a reduction in emissions. The results obtained in this study suggest a moderate correlation between smartness and sustainability for cities, indicating that evaluated cities would be still in the process of developing their smartness to pursue sustainability. This may imply that smartness and sustainability are not strongly correlated, or that cities prioritize smartness before pursuing sustainability. The ongoing debate surrounding this topic underscores the need for further scientific discussions and investigations.
In attempting to discuss why a moderate linear correlation rather than a very strong one was observed between a city’s smartness and sustainability indicators, it is understood that this is probably due to the quantity of different indicators utilized by the frameworks. It can be observed in Table 7 that the two frameworks have indicators in common. Connected Smart Cities (2021) is made up of 70 indicators, 22 of which are common to those used by ‘Mandala ODS’ (CNM, 2021). These 22 common indicators are categorized into 7 smartness topics, while the other 3 topics have no common indicators. To analyze the impact that the mutual indicators have on the performance of correlations, we initially considered the total of 100 indicators formed by the sum of the 30 indicators from the ‘Mandala ODS’ and the 70 indicators from Connected Smart Cities. Excluding the 22 mutual indicators in the two frameworks that are duplicates in this sum, we obtained 78 indicators in which the share of the 22 mutual indicators is approximately 28%, while the share of non-mutual indicators is 72%. Thus, indicators not common to both frameworks have a weight 2.55 greater than indicators in common, which could be influencing the linear correlation between sustainability and smart cities in the overall sample, moving from a strong to a moderate degree. It is important to remember that we did not have access to the algebraic calculation of the smartness indicators for each of its ten thematic topics; we only had access to the final value of the indicator for each topic and the overall smartness indicator. The obtained result does not indicate weakness or strength of the frameworks, but it is an inherent characteristic of them. Due to the limitations of this current study, at this point we can only hypothesize that: (i) As different indicators carry 2.55 times more weight than common indicators between the frameworks, as shown in Table 7, this may shift the correlation away from a strong degree; (ii) The Connected Smart Cities framework may be assigning different weights to the 22 indicators similar to the ‘Mandala ODS’ than to the 56 dissimilar indicators, which also may impede the attainment of a strong correlation. Both hypotheses could be tested in future work.
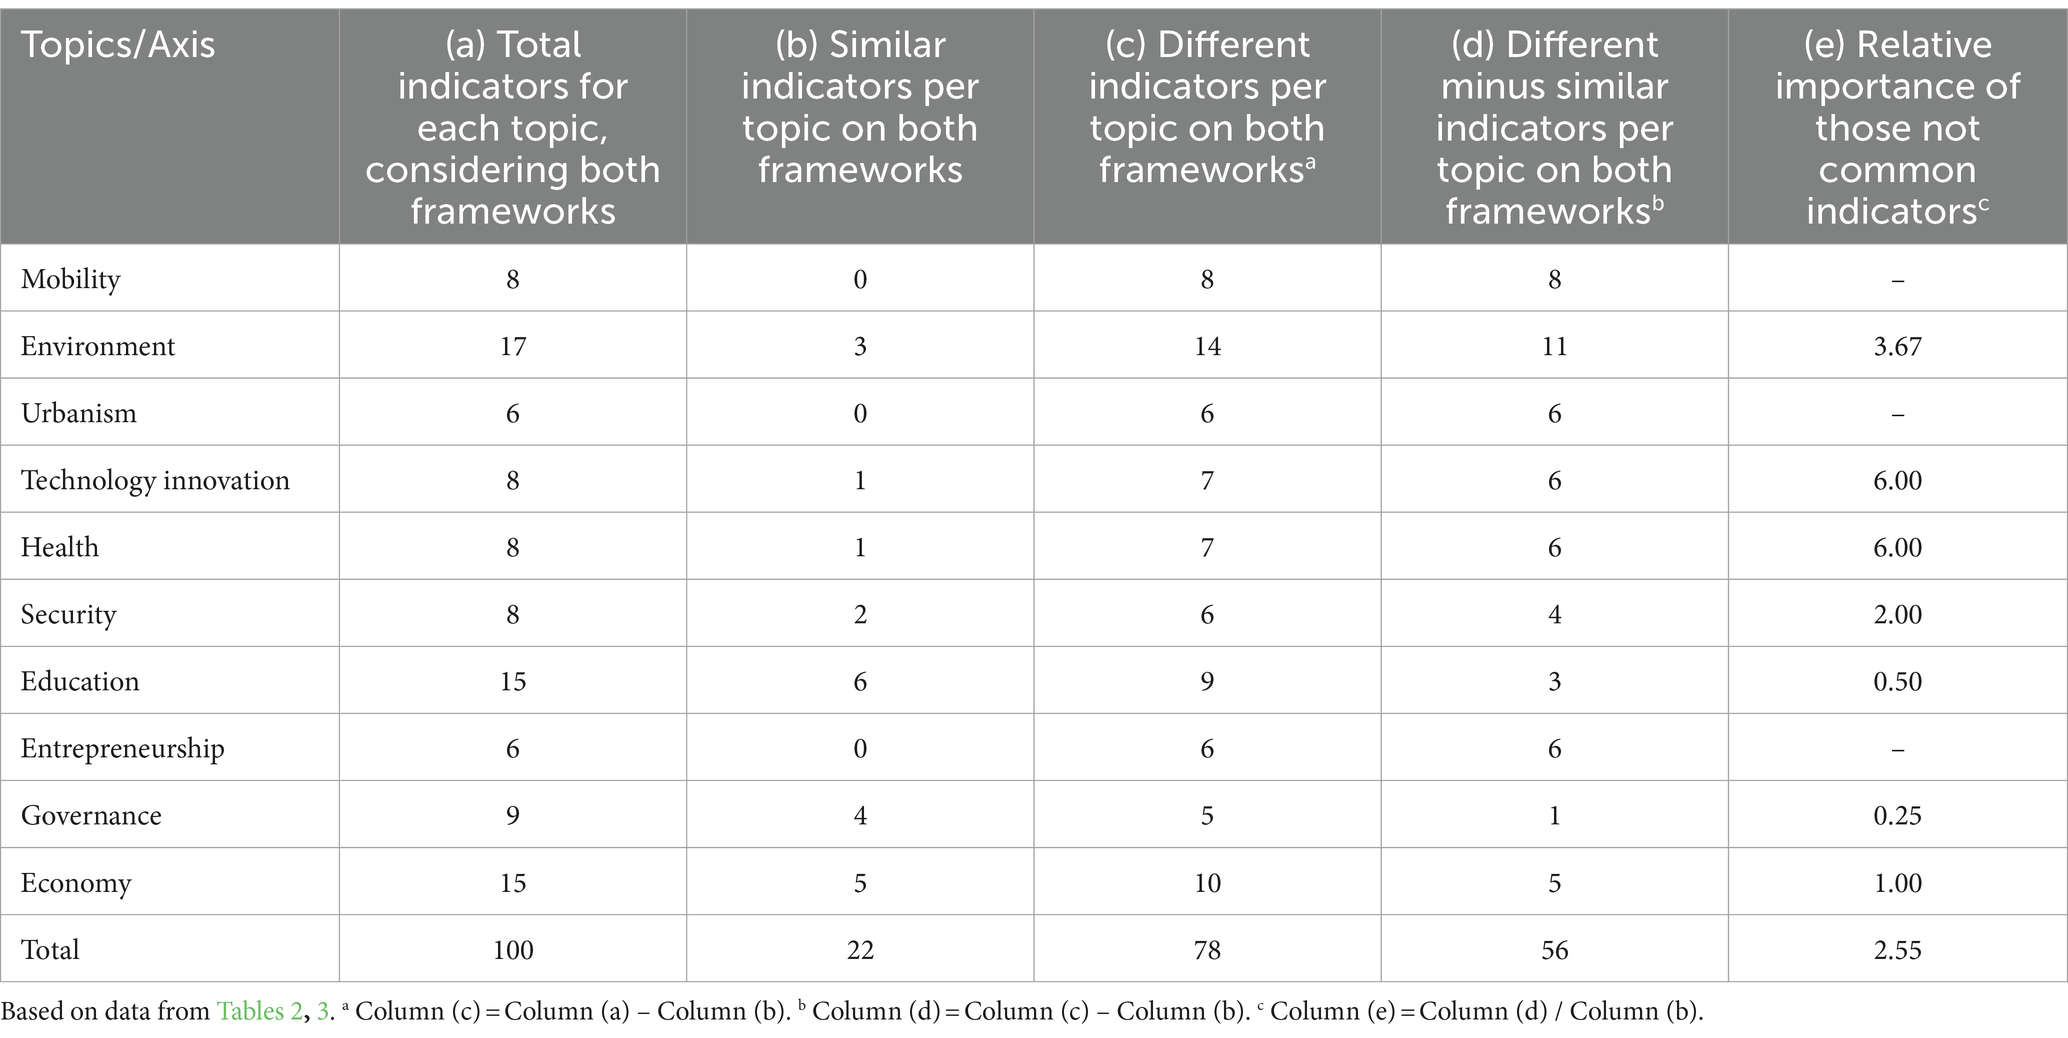
Table 7. Common indicators for the sustainability (Mandala ODS) and smartness (Connected Smart Cities) frameworks.
This study does not intend to discuss about the advantages or disadvantages of one framework over another, but rather to verify whether there is a linear correlation between sustainability and smartness. This study is limited to a sample of 130 Brazilian cities due to the lack of a complete and current database with quantitative indicators of sustainability and smartness for cities around the world. It is suggested to carry out the same study for other cities, with an increase in the sample size and heterogeneity. Another limitation is the use of the ‘Mandala ODS’ frameworks (CNM, 2021) and the Connected Smart Cities ranking (2021), as they are frameworks used only in Brazil, which limits the conclusions of this paper to these frameworks and the Brazilian context. It is suggested to use other international rankings when databases become available to conduct similar studies and verify whether the conclusions found in this study can be generalized.
5 Conclusion
The application of the five-sector sustainability model (5SenSu) has proven capable of quantifying the sustainability of cities into a single indicator using scattered data made available by the ‘Mandala ODS.’ The results facilitate the establishment of rankings and benchmarks, considered fundamental to support municipal decision-makers in the pursuit of more sustainable cities.
Regarding the research question that guided the development of this study (“Can a smart city also be considered sustainable?”), it was identified that there is a moderate degree of linear correlation and also a moderate rank-order correlation between the cities’ overall smartness indicator and the sustainability synthetic indicator of system (SSIS). Although the scientific literature suggests that becoming a smart city can facilitate the transition to a sustainable city, assuming that a smart city would ipso facto be sustainable (and vice versa) should be approached with caution. This caution is warranted as the moderate degree of linear correlation falls short of the very strong degree required to unequivocally support this claim.
Data availability statement
The original contributions presented in the study are included in the article/Supplementary material, further inquiries can be directed to the corresponding author.
Author contributions
PP: Data curation, Formal analysis, Investigation, Validation, Writing – original draft. FA: Conceptualization, Funding acquisition, Investigation, Methodology, Project administration, Supervision, Validation, Writing – review & editing. CA: Visualization, Writing – review & editing. FD: Visualization, Writing – review & editing. BG: Visualization, Writing – review & editing.
Funding
The author(s) declare financial support was received for the research, authorship, and/or publication of this article. This work was supported by Coordenação de Aperfeiçoamento de Pessoal de Nível Superior, Brasil (CAPES – Finance Code 001) and Conselho Nacional de Desenvolvimento Científico e Tecnológico (proc. 305593/2023-4).
Acknowledgments
The authors are grateful for the financial support of the Vice-Reitoria de Pós-Graduação da Universidade Paulista (UNIP). PP acknowledges the scholarship provided by the Coordenação de Aperfeiçoamento de Pessoal de Nível Superior, Brasil (CAPES – Finance Code 001). FA is grateful to the financial support provided CNPq Brasil (proc. 305593/2023-4).
Conflict of interest
The authors declare that the research was conducted in the absence of any commercial or financial relationships that could be construed as a potential conflict of interest.
The author(s) declared that they were an editorial board member of Frontiers, at the time of submission. This had no impact on the peer review process and the final decision.
Publisher’s note
All claims expressed in this article are solely those of the authors and do not necessarily represent those of their affiliated organizations, or those of the publisher, the editors and the reviewers. Any product that may be evaluated in this article, or claim that may be made by its manufacturer, is not guaranteed or endorsed by the publisher.
Supplementary material
The Supplementary material for this article can be found online at: https://www.frontiersin.org/articles/10.3389/frsc.2024.1390735/full#supplementary-material
Footnotes
References
Aalborg Charter (1994). European conference on sustainable cities & towns in Aalborg, Denmark. Available at: https://sustainablecities.eu/the-aalborg-charter/ (Accessed January 22, 2024).
Agostinho, F., Costa, M., Almeida, C. M. V. B., Maceno, M. M. C., and Giannetti, B. F. (2023). Sustainability dynamics of the Brazilian MATOPIBA region between 1990 and 2018: impacts of agribusiness expansion. Appl. Geogr. 159:103080. doi: 10.1016/j.apgeog.2023.103080
Agostinho, F., Pierucci, P., Fonseca, T., Almeida, C. M. V. B., and Giannetti, B. F. (2022). What makes cities sustainable? Empirical evidence from a Brazilian context. Front. Sustain. Cities 4, 1–7. doi: 10.3389/frsc.2022.862956
Agostinho, F., Richard Silva, T., Almeida, C. M. V. B., Liu, G., and Giannetti, B. F. (2019). Sustainability assessment procedure for operations and production processes (SUAPRO). Sci. Total Environ. 685, 1006–1018. doi: 10.1016/j.scitotenv.2019.06.261
Ahvenniemi, H., Huovila, A., Pinto-Seppa, I., and Airaksinen, M. (2017). What are the differences between sustainable and smart cities? Cities 60, 234–245. doi: 10.1016/j.cities.2016.09.009
Anthopoulos, L. G. (2017). “The rise of the smart city” in Understanding smart cities: a tool for smart government or an industrial trick? Public administration and information technology, Ed. Reddick C. G. vol. 22: (Cham, Switzerland: Springer).
Arcadis (2022). The Arcadis sustainable cities index. Available at: https://connect.arcadis.com/Sustainable-Cities-Index-download-confirm (Accessed January 25, 2024).
Baum, S., Van Gellecum, Y., and Yigitcanlar, T. (2004). Wired communities in the city: Sydney, Australia. Geogr. Res. 42, 175–192. doi: 10.1111/j.1467-8470.2004.00274.x
Cai, M., Kassens-Noor, E., Zhao, Z., and Colbry, D. (2023). Are smart cities more sustainable? An exploratory study of 103 US cities. J. Clean. Prod. 416:137986. doi: 10.1016/j.jclepro.2023.137986
Castells, M. (2000). Urban sustainability in information age. City 4, 118–122. doi: 10.1080/713656995
Chastenet, C. A., Belziti, D., Bessis, B., Faucheux, F., Le Sceller, T., Monaco, F. X., et al. (2016). The French eco-neighbourhood evaluation model: contributions to sustainable city making and to the evolution of urban practices. J. Environ. Manag. 176, 69–78. doi: 10.1016/j.jenvman.2016.03.036
Cheng, Z., Wang, L., and Zhang, Y. (2022). Does smart city policy promote urban green and low-carbon development? J. Clean. Prod. 379:134780. doi: 10.1016/j.jclepro.2022.134780
CNM (2021). Brazilian National Confederation of Municipalities (Confederação Nacional de Municípios. Mandala ODS). Available at: https://ods.cnm.org.br/mandala-municipal (Accessed March 10, 2023).
Cohen, B., and Munhoz, P. (2016). The emergence of the urban entrepreneur: how the growth of cities and the sharing economy are driving a new breed of innovators. Westport, Connecticut: Praeger Publisher, 192.
Connected Smart Cities (2021). Ranking connected smart cities. In Portuguese. Available at: https://www.urbansystems.com.br/rankingconnectedsmartcities (Accessed October 10, 2023).
Dameri, R.P., and Cocchia, A. (2013). Smart city and digital city: twenty years of terminology evolution. Available at: https://www.itais.org/proceedings/itais2013/pdf/119.pdf (Accessed January 20, 2024).
De Marco, A., and Mangano, G. (2021). Evolutionary trends in smart city initiatives. Sustain. Fut. 3:100052. doi: 10.1016/j.sftr.2021.100052
Elkington, J. (1999). Cannibals with forks: the triple bottom line of 21st century business, vol. 8: Hoboken, New Jersey, U.S: Wiley Publisher, 37–51.
European Commission (2012). Communication from the commission. Smart cities and communities. European innovation partnership. Brussels. Available at: https://digital-strategy.ec.europa.eu/en/library/smart-cities-and-communities-european-innovation-partnership-communication-commission-c2012-4701 (Accessed December 15, 2023).
Gardner, G. (2016). “Imagining a Sustainable City” in State of the world 2016: can a city be sustainable? (Washington, DC: Island Press).
Giannetti, B. F., Sevegnani, F., Almeida, C. M. V. B., Agostinho, F., Moreno, R. R., and Liu, G. (2019). Five sector sustainability model: a proposal for assessing sustainability of production systems. Ecol. Model. 406, 98–108. doi: 10.1016/j.ecolmodel.2019.06.004
Giannetti, B. F., Souza, R. R., Alves-Pinto, M. J., Almeida, C. M. V. B., Agostinho, F., and Coscieme, L. (2022). The ecological footprint of happiness: a case study of a low-income community in the city of São Paulo, Brazil. Sustainability 14:12056. doi: 10.3390/su141912056
Giffinger, R., and Gudrun, H. (2010). Smart cities ranking: an effective instrument for the positioning of the cities. Arquitecture City Environ. 4, 7–26. doi: 10.5821/ace.v4i12.2483
Habitat III (2016). Habitat III issue papers, 21 smart cities. United Nations conference on housing and sustainable urban development. Quito, October 2016. Available at: https://habitat3.org/wp-content/uploads/Habitat-III-Issue-Paper-21_Smart-Cities-2.0.pdf (Accessed November 23, 2023).
Hiremath, R. B., Balachandra, P., Kumar, B., Bansode, S. S., and Murali, J. (2013). Indicator based urban sustainability – a review. Energy Sustain. Dev. 17, 555–563. doi: 10.1016/j.esd.2013.08.004
Huang, S. L., Yeh, C. T., Budd, W. W., and Chen, L. L. (2009). A sensitivity model (SM) ap proach to analyze urban development in Taiwan based on sustainability indicators. Environ. Impact Assess. Rev. 29, 116–125. doi: 10.1016/j.eiar.2008.03.003
Huovila, A., Bosch, P., and Airaksinen, M. (2019). Comparative analysis of standardized indicators for smart sustainable cities. What indicators and standards to use and when? Cities 89, 141–153. doi: 10.1016/j.cities.2019.01.029
ISO 37122 (2019). Sustainable cities and communities. Indicators for smart cities. Available at: https://www.iso.org/standard/69050.html (Accessed November 12, 2023).
Jong, M., Joss, S., Scraven, D., Zhan, C., and Weijnen, M. (2015). Sustainable–smart–resilient–low carbon–eco–knowledge cities; making sense of a multitude of concepts promoting sustainable urbanization. J. Clean. Prod. 109, 25–38. doi: 10.1016/j.jclepro.2015.02.004
Komninos, N. (2008). Intelligent cities: towards interactive and global innovation environments. Int. J. Innov. Regional Dev. 1, 337–355. doi: 10.1504/IJIRD.2009.022726
Lombardi, P., Giordano, S., Farouh, H., and Yousef, W. (2012). Modelling the smart city performance. Innovation Eur. J. Soc. Sci. Res. 25, 137–149. doi: 10.1080/13511610.2012.660325
Machado, J., Ribeiro, D. N., Pereira, R. S., and Bazanini, R. (2018). Do Brazilian cities want to become smart or sustainable? J. Clean. Prod. 199, 214–221. doi: 10.1016/j.jclepro.2018.07.072
Macke, J., Sarate, J. A. R., and Moschen, S. A. (2019). Smart sustainable cities evaluation and sense of community. J. Clean. Prod. 239:118103. doi: 10.1016/j.jclepro.2019.118103
Manville, C., Cochrane, G., Cave, J., Millard, J., Pederson, J.K., Thaarup, R.K., et al. (2014). Mapping smart cities in the EU. Directorate-general for internal policies. Available at: https://www.europarl.europa.eu/RegData/etudes/etudes/join/2014/507480/IPOL-ITRE_ET(2014)507480_EN.pdf (Accessed January 9, 2024).
Marsal-Llacuna, M. L., Colomer-Llinàs, J., and Meléndez-Frigola, J. (2015). Lessons in urban monitoring taken from sustainable and livable cities to better address the smart cities initiative. Technol. Forecast. Soc. Chang. 90, 611–622. doi: 10.1016/j.techfore.2014.01.012
Martin, C. J., Evans, J., and Karvonen, A. (2018). Smart and sustainable? Five tensions in the visions and practices of the smart-sustainable city in Europe and North America. Technol. Forecast. Soc. Chang. 133, 269–278. doi: 10.1016/j.techfore.2018.01.005
Mattoni, B., Pompei, L., Losilla, J. C., and Bisegna, F. (2020). Planning smart cities: comparison of two quantitative multicriteria methods applied to real case studies. Sustain. Cities Soc. 60:102249. doi: 10.1016/j.scs.2020.102249
McManus, P. (2012). Measuring urban sustainability: the potential and pitfalls of city rankings. Aust. Geogr. 43, 411–424. doi: 10.1080/00049182.2012.731301
Mello Torres, J. G., Andrade, N. M., and Costa Neto, P. L. O. (2019). Analysis of the European and Brazilian rankings of smart cities: a case study of São José dos Campos and Toulouse. Int. J. Adv. Eng. Res. Sci. 6, 91–115. doi: 10.22161/ijaers.68.14
Monzon, A. (2015). “Smart cities concept and challenges: bases for the assessment of smart city projects” in Smart cities, green technologies, and intelligent transport systems. Smartgreens Vehits 2015. Communications in Computer and Information Science 579. eds. M. Helfert, K. H. Krempels, C. Klein, B. Donellan, and O. Guiskhin (Cham, Switzerland: Springer).
Moreno Garcia, R. R., Giannetti, B. F., Agostinho, F., Almeida, C. M. B., Sevegnani, F., Parra Perez, K. M., et al. (2021). Assessing the sustainability of rice production in Brazil and Cuba. J. Agric. Food Res. 4:100152. doi: 10.1016/j.jafr.2021.100152
Nam, T., and Pardo, T.A. (2011). Conceptualizing smart city with dimensions of technology, people and institutions. Available at: https://www.ctg.albany.edu/media/pubs/pdfs/dgo_2011_smartcity.pdf (Accessed January 18, 2024).
Nevado Gil, M. T., Carvalho, L., and Paiva, I. (2020). Determining factors in becoming a sustainable smart city: an empirical study in Europe. Econ. Soc. 13, 24–39. doi: 10.14254/2071-789X.2020/13-1/2
Nilon, C. H., Berkowitz, A. R., and Hollweg, K. S. (2003). “Introduction: ecosystem understanding is a key to understanding cities” in Understanding urban ecosystems. ed. A. Berkowitz (New nYork, NY: Springer).
OECD (2012). OECD environmental outlook to 2050. The consequences of inaction. Paris: OECD Publishing.
Paris Agreement (2015). United Nations framework convention on climate change UNFCCC. Available at: https://unfccc.int/process-and-meetings/the-paris-agreement (Accessed December 14, 2024).
Pulselli, F. M., Coscieme, L., Neri, L., Regoli, A., Sutton, P. C., Lemmi, A., et al. (2015). The world economy in a cube: a more rational structural representation of sustainability. Glob. Environ. Chang. 35, 41–51. doi: 10.1016/j.gloenvcha.2015.08.002
Schober, P., Boer, C., and Schwarte, L. A. (2018). Correlation coefficients: appropriate use and interpretation. Anesth. Analg. 126, 1763–1768. doi: 10.1213/ANE.0000000000002864
Sharifi, A. (2019). A critical review of selected smart city assessment tools and indicator sets. J. Clean. Prod. 233, 1269–1283. doi: 10.1016/j.jclepro.2019.06.172
Sharifi, A. (2020). A typology of smart city assessment tools and indicator sets. Sustain. Cities Soc. 53:101936. doi: 10.1016/j.scs.2019.101936
Siemens (2022). The Green City index. Available at https://assets.new.siemens.com/siemens/assets/api/uuid:cf26889b-3254-4dcb-bc50-fef7e99cb3c7/gci-report-summary.pdf (Accessed January 25, 2024).
Stamopoulos, D., Dimas, P., Siokas, G., and Siokas, E. (2024). Getting smart or going green? Quantifying the Smart City Industry’s economic impact and potential for sustainable growth. Cities 144:104612. doi: 10.1016/j.cities.2023.104612
Su, Y., and Fan, D. (2023). Smart cities and sustainable development. Reg. Stud. 57, 722–738. doi: 10.1080/00343404.2022.2106360
Terra dos Santos, L. C., Giannetti, B. F., Agostinho, F., and Almeida, C. M. V. B. (2022). Using the five sectors sustainability model to verify the relationship between circularity and sustainability. J. Clean. Prod. 366:132890. doi: 10.1016/j.jclepro.2022.132890
UN (2015). Transforming our world: the 2030 agenda for sustainable development. Available at: https://sdgs.un.org/2030agenda (Accessed January 25, 2024).
UN (2020). The UN and the environment. Available at: https://brasil.un.org/pt-br/91223-onu-e-o-meio-ambiente (Accessed January 28, 2024).
UN Habitat (2022). Annual report on cities. In Portuguese. Available at: https://relatorio-anual-2022.netlify.app (Accessed January 25, 2024).
UNDESA (2014a). Cities for a sustainable future. Department of Economic and Social Affairs. Economic Analysis. United Nations. Available at: https://www.un.org/en/development/desa/news/ecosoc/cities-for-a-sustainable-future.html (Accessed February 1, 2024).
UNDESA (2014b). Transforming public administration for sustainable development. Department of Economic and Social Affairs. Economic analysis. United Nations. Available at: https://www.un.org/en/development/desa/news/administration/cepa2014.html (Accessed February 1, 2024).
Vanolo, A. (2016). Is there anybody out there? The place and role of citizens in tomorrow’s smart cities. Futures 82, 26–36. doi: 10.1016/j.futures.2016.05.010
Wackernagel, M., Hanscom, L., and Lin, D. (2017). Making the sustainable development goals consistent with sustainability. Front. Energy Res. 5:18. doi: 10.3389/fenrg.2017.00018
Yigitcanlar, T., and Kamruzzaman, M. (2018). Does smart city policy lead to sustainability of cities? Land Use Policy 73, 49–58. doi: 10.1016/j.landusepol.2018.01.034
Keywords: city indicator, multi-criteria decision analysis, municipal governance, smart cities, sustainable cities
Citation: Pierucci P, Agostinho F, Almeida CMVB, Demétrio FJC and Giannetti BF (2024) Correlation between sustainability and smartness indicators in Brazilian cities: insights from the 5SenSu model. Front. Sustain. Cities. 6:1390735. doi: 10.3389/frsc.2024.1390735
Edited by:
Gabriella Maselli, University of Salerno, ItalyReviewed by:
Aapo Matias Huovila, VTT Technical Research Centre of Finland Ltd, FinlandGiuliana Ansanelli, Italian National Agency for New Technologies, Energy and Sustainable Economic Development (ENEA), Italy
Copyright © 2024 Pierucci, Agostinho, Almeida, Demétrio and Giannetti. This is an open-access article distributed under the terms of the Creative Commons Attribution License (CC BY). The use, distribution or reproduction in other forums is permitted, provided the original author(s) and the copyright owner(s) are credited and that the original publication in this journal is cited, in accordance with accepted academic practice. No use, distribution or reproduction is permitted which does not comply with these terms.
*Correspondence: Pedro Pierucci, cGxjcGllcnVjY2lAZ21haWwuY29t