 Dina Passman
 Sabine O’Hara
 Meike Levin-Keitel2†
94% of researchers rate our articles as excellent or good
Learn more about the work of our research integrity team to safeguard the quality of each article we publish.
Find out more
ORIGINAL RESEARCH article
Front. Sustain. Cities , 19 June 2024
Sec. Social Inclusion in Cities
Volume 6 - 2024 | https://doi.org/10.3389/frsc.2024.1379958
This article is part of the Research Topic International Women's Day: Building Equity through smarter, more resilient cities of the future View all 7 articles
Introduction: Infrastructure regularly supports male pursuits more than women’s. Recent transportation scholarship focuses on this inequity by quantifying the daily travel of women and men for everyday care provision, often termed “the mobility of care.” Care trips include dropping off and picking up family members, accompanying young children and old adults to medical appointments, and acquiring household goods. This study analyzes gendered travel behavior in the National Capital Region of the United States, including Washington, D.C.
Methods: The basis of this study’s analysis is data from the 2017/2018 Regional Travel Survey conducted by the National Capital Region Transportation Planning Board. The survey included records from approximately 16,000 households, 2,000 in Washington, D.C. Our study sample contained 19,274 unique people who made 49,215 trips. Many of these trips were made using the local bus and subway systems. Following an established methodology, the researchers recoded trip purpose data into five broad categories: care, work, shopping, leisure, school, and all other purposes. We then ran descriptive and statistical analyses of travelers aged 18 through 65 to measure the frequencies of household demographic characteristics and person-level trips for all purposes made by five travel modes: walk, bike, car, bus, and subway.
Results: Based on our analysis, trips for work represent the majority of trips (34.7%), followed by shopping (28.2%), care (22.3%), leisure (8.5%), other (4.1%), and school trips (2.3%). Our findings indicate that women make more care-related trips during the day than men (25.1% vs. 18.8%). They also make fewer work-related trips than men (30.3% vs. 40.2%). Regression analyses revealed correlations between care-related travel by all modes and public transportation by age, race, location of residence, and income.
Discussion: The mobility of care, done mostly by women, is one of the primary reasons that people travel in and around Washington, D.C., and its suburbs. However, D.C.’s bus and subway systems are primarily designed to support the mobility of work done mostly by men. As a result, our study identifies the need for improvements in gender-responsive infrastructure, including public transportation policies and programs that explicitly address the mobility of care, improve access to care, and reduce the environmental impact of cars.
A substantial body of literature documents the diversity of human travel needs and uses throughout the world. Women and men, for example, have distinctly different travel patterns. Women travel closer to home than men and for a wider variety of purposes. They are the primary users of public transport systems, make more multimodal trips than men, are more sensitive to safety concerns, have smaller bodies on average, and are less represented in positions of responsibility in the transport sector (Sánchez de Madariaga, 2013). In the Global North, women also commute shorter distances, make more trips often in succession—a phenomenon called “trip chaining”—and accompany others in travel more than men do (Loukaitou-Sideris, 2016). The mobility of care (MOC) is an umbrella concept developed by Sánchez de Madariaga (2013). It includes all travel resulting from everyday caregiving responsibilities in the home and elsewhere, such as escorting children and other family members to daycare, school, and medical appointments, dropping off and picking up family members, and shopping for food and other necessities. These trips are distinctly different from those made to get to work, leisure activities, and education. Intersectional differences related to age, race, ethnicity, income, sexual orientation, and disability status create additional nuances to travel patterns. Still, researchers find that transit organizations neglect to plan and operate transportation systems that support women’s mobility, restricting their focus mainly to jobs, health, and education access (Criado-Perez, 2020).
However, limiting transportation access opportunities for women has more significant social implications. It forms a barrier to productivity and economic development. The Nobel economist Sen (2013) wrote about the need to focus on women’s agency (rather than well-being) to empower women and improve economic productivity. Women’s empowerment also improves social sustainability in urban environments since women frequently contribute to social networks and less tangible subsistence activities than men (Brody et al., 2017; Connors et al., 2023).
There has been a recent flurry of research focusing specifically on the mobility of care and gendered travel in different cities and countries across the globe. In a recent paper on mobility in Montréal, Canada, researchers estimated that among adults between 25 and 60 years old traveling by public transportation, car, walking, and cycling, caregiving accounted for 28% of trips in the region. In contrast, work accounted for 48% of trips (Ravensbergen et al., 2023). In Los Angeles, USA, LA Metro (2019), women account for more than half of city bus and train riders. Moreover, women in Los Angeles use mass transit for 80% of work trips, 42% of household errand trips, and 32% of accompanied trips. Using data from a municipal mobility survey in Bogotá, Colombia, Murillo-Munar et al. (2023) estimated that care trips represented 11.8% of trips and work trips comprised 32.3% of trips in the data. Moreover, they found that women from the lowest social strata traveled more for care than those from the highest. In Detroit, USA, researchers explored trip purpose, frequency, and distance by gender, revealing that women traveled less often and over shorter distances than men for work and that women also walked and used public transit modes more frequently than men (Lee et al., 2018). In contrast, women drove more often and over longer distances for household-related trips than men. Shuman (2023), who leveraged automated bus passenger origin, destination, and transfer data in their study, concluded that women were more likely to travel to and from daycare centers, schools, and grocery stores than men. Finally, in Ireland, Cahill et al. (2023) found that mothers made more trips to drop off and pick up household members (21.4% vs. 14%) and comparatively fewer work trips (20.5% vs. 26.4%) than fathers.
Each of the above-referenced studies found that women are the primary users of transit to perform care-related tasks. As such, these studies lay the groundwork for increasing gender equity in mobility, whether by walking, cycling, driving, or riding public transportation. However, these studies remain in the realm of research, and their impact on policy and transportation planning is limited to date. The Los Angeles County Metropolitan Transportation Authority (LA Metro) is the only urban transit agency in the United States dedicated significant resources to identifying the characteristics and needs of their riders making care-related trips. They also established a Women & Girls Governing Council (LA Metro, 2021) and developed a Gender Action Plan (LA Metro, 2022).
This paper analyzes the pre-COVID mobility of care in the public transportation system of the Washington DC metropolitan area, comprising the capital of the United States and surrounding counties referred to as the National Capitol Region or NCR. It, therefore, fills a gap in the foundational knowledge of gendered travel patterns in the capital region of the U.S. Using household-level data from the 2017/2018 Regional Travel Survey (RTS) from the NCR, the paper used a tested methodology to determine the trip frequencies and statistical significance of differences in trips by reported gender. The trips were taken on public buses and the subway and were analyzed by mode and purpose of transportation and by demographic characteristics of the households and persons captured in the survey (i.e., household size and income, gender, age, race/ethnicity). The analysis of these publicly available data illustrates the disproportionate burdens born by those who carry out care-related trips within the Washington DC public transportation infrastructure and lays bare the rider characteristics associated with care-related trips. The paper concludes by identifying strategies that lend themselves to targeted improvements in the public transportation infrastructure of Washington, D.C., to ensure more careful considerations of care-related transportation needs when planning local transit systems in the NCR and, by extension, other cities.
All households and families require labor to maintain their functions, from working to buying groceries, caring for household members, going to school, and so much more. Many of these functions are not remunerated, and women carry out many of them. Society has long devalued the contributions of women’s labor in households and communities, regardless of their participation in the paid workforce. Scholars have characterized this home-based labor as the working woman’s second, third, and fourth shifts (Power, 2020). The COVID-19 pandemic precipitated many changes in the lives of working mothers, including the loss of employment and the need to provide childcare and educational support for their children when daycares and schools closed. As a result, the pandemic made clear what many feminist scholars had long pointed out: that women’s unpaid labor plays a critical role in supporting the productive capacity of their family members and, thus, the economy more broadly (Hartmann, 1976; Nelson, 1995).
Households require significant physical, cognitive, and emotional effort to thrive. The unpaid care work carrying out these efforts comprises all unremunerated services within a household, including caring for household members, doing housework, and volunteering in schools and local communities (Elson, 2010). An international Household Care Survey (HCS) methodology developed by Oxfam seeks to assist users in quantitatively measuring household members’ unpaid care and domestic tasks (Rost et al., 2020). This includes the cognitive labor of mental and organizational effort required to anticipate needs, identify solutions, make decisions, and monitor progress. This cognitive work, too, is provided predominantly by women (Daminger, 2019).
Evidence from across the globe suggests that girls and women provide significantly more unpaid care work than boys and men. According to United Nations Women, the U.N. organization dedicated to gender equality and women’s empowerment, women average 10 years of unpaid care and domestic work in a lifetime (UN Women, 2022). For men, the average is 4 years. Among the 38 middle- and high-income member countries identified by the Organization for Economic Co-operation and Development (OECD), female-to-male ratios of time spent on unpaid care work present a similar picture. While the female-to-male ratios of time spent on unpaid work may vary from Sweden to South Africa and everywhere in between, the burden of unpaid care work consistently falls on women. The OECD concludes that this hinders not only gender equality goals but also social and economic sustainability goals (OECD, 2021).
While women and girls perform the bulk of care work globally, poor women and girls, especially those who experience discrimination based on race, ethnicity, nationality, sexuality, and caste, disproportionately perform the world’s unpaid care work. They also carry out the bulk of paid care work globally, typically within the lowest wage brackets (OECD, 2021).
Women’s work is also disproportionately impacted by the lack of infrastructure supporting their paid and unpaid work patterns. Therefore, they bear an outsized burden stemming from male-centered infrastructure investments (Siemiatycki et al., 2020). Low-income women who tend to be more dependent on public transportation and those who consciously decide to forego a private vehicle are significantly impacted. As a result of these gendered impacts across the globe, the United Nations Office for Project Services (UNOPS), an organization dedicated to supporting sustainable development through equitable infrastructure investments and projects, issued a report on the importance of incorporating gender into projects and procurements (UNOPS, 2020).
Many studies corroborate the biases toward women who provide the bulk of unpaid household and care work regardless of their participation in the paid workforce (Elson, 2017; Charmes, 2019; Coffey et al., 2020; Rost et al., 2020; Sarrasanti et al., 2020; UN Women, 2022). There is also ample evidence that this unpaid labor’s value is substantial and estimated at 16 billion hours daily (UN Women, 2022). Oxfam estimated the global value of this work to be at least US$10.8 trillion annually. This amount equaled 11% of the global GDP in 2021 (Coffey et al., 2020; World Bank, 2022). Using the replacement cost approach to estimating the value of care services in 27 OECD countries, Elson (2017) reported that the monetary value of unpaid work in the U.S. was 18% of the national GDP. In 2021, that was the equivalent of 4.14 trillion US$ (World Bank, 2022).
To address the persistent biases against the unpaid and generally invisible work of women, Folbre (2006) designed four categories to increase the understanding of women’s work as it relates to their measures of value: (1) unpaid services, (2) unpaid work that helps meet subsistence needs, (3) informal market work, and (4) paid employment. Elson (2017) proposed ways to compensate women for the first and second categories to close the gender gap. This includes (1) wages for housework, (2) the inclusion in national accounting systems, (3) cash payments, and (4) pension credits. Elson concludes that the path to equity must include making men’s working lives more like women’s, not vice versa. This requires a fundamental redistribution of work and corresponding changes to the support infrastructure of the U.S. These fundamental changes must, out of necessity, include infrastructure support such as public transportation. That infrastructure is often anything but supportive and is well-illustrated by the open stroller ban on D.C.’s Metrobuses, which prohibited rides from taking an open stroller on a bus or subway and expected them instead to fold up the stroller while juggling children, shopping bags, and fare cards. This open-stroller ban persisted for several decades and was only lifted in May 2023 (WMATA, 2023a; Passman et al., 2024).
“Infrastructure” refers to physical and organizational structures needed to operate a society and its enterprises (Jerome, 1999; Oxford University Press, 2010). There is a widely held misconception that infrastructure is gender-neutral. However, women and men do not benefit equally from public investments in infrastructure due to their social roles, economic status, and preferences that shape their infrastructure needs and uses (OECD, 2021). Gender-blind infrastructure fails to consider the different life circumstances and needs, which limits the ability of women and girls to access essential services, such as healthcare and education (UNOPS, 2020; European Institute for Gender Equality, 2024). For example, planner design transportation infrastructure to take a paid workforce from home to their place of work and back. However, the “trip-chaining” needs of care providers may require them to ride from home to the daycare, to work, to the grocery store, back to the daycare, and to home. Trip-chaining requires enormous ingenuity and time, which limits the agency of the care provider in improving their own lives and forms a barrier to productivity and economic development (Sen, 2013). Women also comprise only 18% of the American infrastructure workforce and less than 25% of the transportation and utilities workforce (George and Kane, 2021; U.S. Bureau of Labor Statistics, 2023), limiting the consideration of women’s perspectives. When men primarily plan, design, and implement infrastructure, women have little or no voice in investment decisions that affect their daily lives, economic opportunities, and future prosperity. Predictably, infrastructure decisions rarely reflect the spatial patterns needed to support women’s lives.
A notable exception is Vienna, Austria, where female city planners have, since the early 1990s, designed and implemented projects that benefit men and women equally, including strategies like extending crosswalk times to accommodate caregivers and others needing extra time to pass over city streets (Foran, 2013). The women planners also helped to establish the Frauen-Werk-Stadt (Women-Work-City), an apartment complex that aimed to reduce caregiving burdens through thoughtful design elements, such as on-site childcare, pharmacies, and medical offices, all near public transportation. International economic and development organizations agree that increasing women’s participation in infrastructure policy and decision-making is critical to expanding equity (UNOPS, 2020; OECD, 2021).
Infrastructure discussions frequently refer to two categories: hard (or physical) and soft (or social) infrastructure. Hard infrastructure refers to the large physical networks needed to support economic activity and maintain a functioning region and nation (Cantu, 2017). Scholars and practitioners divide infrastructure into five sectors: telecommunications, transportation, energy, water and sanitation, and solid waste (Cantu, 2017). Physical infrastructure is sometimes called economic infrastructure because many perceive it alone powers and sustains the economy. Soft infrastructure generally refers to services that support the supply of a skilled and healthy workforce to manage and operate economic and non-economic resources (Latham and Layton, 2019). Accordingly, soft infrastructure is more comprehensive and includes educational institutions, healthcare, childcare, social services, housing, and security. It can also include public amenities such as libraries, parks, playgrounds, sidewalks, and civic organizations where people can gather, play, pray, and hold markets—all of which build community and provide cohesiveness and support (Klinenberg, 2018). Moreover, social infrastructure enhances and supports economic and political activity. The result is improved social engagement, the alleviation of poverty, and the more effective and efficient use of resources (Cantu, 2017).
Soft and hard infrastructure categories such as (hard) transportation and (soft) care provision are not mutually exclusive but overlapping and complementary. However, policymakers often perceive them as binary, whereby hard infrastructure supports male-gendered work (or production) while soft infrastructure supports female-gendered care (or reproduction). Some scholars argue that, like Adam provided the means for Eve’s creation, hard infrastructure provides the means for social infrastructure service delivery (Wanmali and Islam, 1997). Others argue that care, a type of social infrastructure, is the prerequisite for production; here, sustaining the workers (and future workers) required to produce physical infrastructure (O’Hara, 2014). There are corollaries in the study of gender and the sciences. Light et al. (2022) found that even the perception of women’s participation in science, technology, engineering, and math (STEM) disciplines increased the likelihood that it would be labeled “soft science” and that this label resulted in a perceived devaluing of the field. Conversely, their study found that respondents perceived “hard science” fields such as engineering and math as male domains requiring more rigor than the so-called soft sciences. For these reasons, the hard/soft, physical/social binary obscures the reality that infrastructure of all types serves multiple functions both socially and economically. If there is no care, there is no productivity. The persistence of gendered notions of care versus productivity is therefore both surprising and alarming.
An example of how the gender binary of infrastructure plays out is the urban transit system, where residents use buses and trains (hard infrastructure) to support employment, care, education, and leisure activities (soft infrastructure). Governments tend to invest more heavily in physical infrastructure than social infrastructure. However, searching for “infrastructure” on the World Bank Open Data website yields only indicators that measure physical infrastructure services (World Bank, 2023). These include air transport data, electric power consumption data (kWh per capita), and data about fixed telephone subscriptions (per 100 people).
Reporting country-level physical infrastructure spending as a percentage of GDP is common. For example, China, Sweden, and the United States make widely different investments per capita (Table 1) (US News, 2022). U.S. spending on physical infrastructure declined precipitously in the early 1970s (Fair, 2019). As a result, bridges, damns, roads, trains, and waterways, have not been well maintained, leading to serious concerns about human safety and losses in economic productivity (McBride and Siripurapu, 2021).
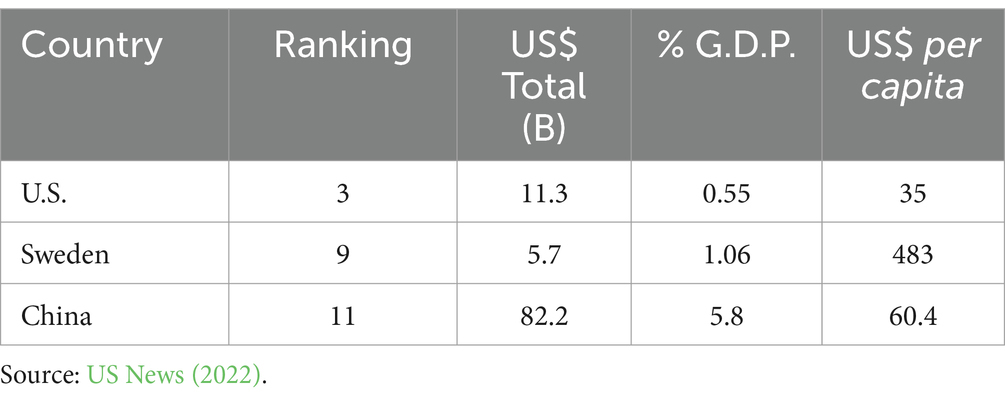
Table 1. Select country-level physical infrastructure investments in US$.
U.S. investments in social infrastructure rank even lower than those in physical infrastructure. In November 2021, the U.S. House of Representatives narrowly passed the US$1.85 trillion Build Back Better Act (BBBA), a 10-year budget reconciliation package serving as the cornerstone of the Biden Administration’s infrastructure policy. BBBA began as a US$1 trillion bipartisan infrastructure bill in March 2021, a year after the 2020 COVID-19 lockdowns began. The House Act contained substantial funding for social infrastructure, including universal, free preschool for all 3-and 4-year-olds, increased tax credits and paid leave for families, improved public home care coverage for the aging and people with disabilities, and health insurance subsidies (The White House, 2021a). The act also contained funding for affordable housing, tax credits for low-wage workers, and investments in higher education, rural communities, and the environment. The bill also had much-anticipated funding to strengthen, diversify, and expand the healthcare workforce. Health Profession Opportunity Grants, one of the named priorities, support education and training for low-income individuals in high-demand areas of the healthcare field. Since women experience higher levels of poverty than men in the U.S., the legislation would likely have been incredibly beneficial for women and their families (Semega, 2019). The bill’s emphasis on social infrastructure and the family was no coincidence. Though the COVID-19 pandemic did not create gender inequities in the U.S., it did exacerbate existing ones. For example, Sarrasanti et al. (2020) describe the increased childcare burden on women as formal and informal childcare providers became less available during the pandemic. The bill died after months of deliberation in the Senate.
Congress had more success finding common ground with the Infrastructure Investment and Jobs Act, which focused on physical infrastructure. The bill passed into law in November 2021 as BBBA negotiations continued, and US$550 billion over 5 years were allocated to fund roads, bridges, railroads, airports, high-speed internet (“broadband”), water, clean energy, and power grids (The White House, 2021b). The administration also boasted that it would create “good-paying, union jobs.” What went unsaid, however, was that those jobs would primarily be in construction and manufacturing, which are overwhelmingly men’s domain (Siemiatycki et al., 2020).
The infrastructure bill included US$89.9 billion over 5 years for public transit modernization, the most significant U.S. federal investment in public transit in history. More and better public transit options are good news for women, especially in communities of color, who rely on urban transit more than other groups (WMATA, 2020; Ramboll, 2021). However, there are no requirements for states to fund projects to make public transportation more responsive to the needs of caregivers. Furthermore, even if there was a commitment to improving care-related mobility decisions, a persistent lack of quality sex-disaggregated data makes it challenging to address current gender inequalities. A recent effort by the World Bank to develop a mobility and gender index (MGI) holds great promise as a tool for measuring gendered barriers to mobility (Kurshitashvili et al., 2024). Incorporating a tool like the MGI would have benefitted the Infrastructure Investment and Jobs Act.
Washington, D.C. is the United States’ capital and the U.S. government’s seat. It is a diverse city of 678,972 with world-class universities, museums, unique neighborhoods, and 7,800 acres of parkland (Land Use in the District of Columbia, 2024; US Census Bureau, 2024). It is also a tourist destination. In 2022, 21.9 million guests worldwide came to D.C. for leisure, business, conventions, and visiting friends and relatives (Washington DC, 2024) In Washington, D.C., as elsewhere, people use public transportation for much more than trips to and from the workplace. Students of all ages use it to access schools and other learning institutions. Caregivers use it for household-related shopping, accompanying their children to activities and appointments, and ferrying them to and from daycare.
Per the Annie E. Casey Foundation’s Kids Count Data Center, 41,552 children under five lived in Washington, DC in 2022 (Annie E. Casey Foundation, 2023). Of those, 24,253 were children under three who likely need strollers for traveling longer than a few blocks. The city itself comprises eight administrative areas or “wards.” Wards 7 and 8 have the lowest personal vehicle ownership rates in DC; 41 and 42%, respectively, have no vehicle; 40% have one (DC Health Matters, 2022). In the absence of Metrorail access, residents in these wards rely heavily on Metrobuses for their public transportation needs.
The Washington Metropolitan Area Transit Authority (WMATA) operates the Metrobus system, the most extensive bus system in the National Capital Region (DDOT, 2023). WMATA is unique in that its founding charter, the Metropolitan Area Transit Authority Compact (DC Government, 1973; WMATA, 2009), extends its service delivery zone (“Transit Zone”) beyond Washington, DC, and into neighboring counties and municipalities in Maryland and Virginia. As a result, the WMATA system experiences the push and pull of urban and suburban interests and those across state lines, extending beyond the budget to planning and operations. WMATA runs three services in the system: bus, rail, and paratransit. The Metrobus system consists of 1,557 buses running 245 routes on 159 lines. Metrobus services 10,687 bus stops (WMATA, 2021a). The Metrorail subway system runs six lines through 91 stations using 1,364 railcars configured as 6- and 8-car trains (WMATA, 2021b). MetroAccess is the system’s paratransit service, reserved for riders whose disabilities preclude them from using bus and rail options. In fiscal year 2023, Metro’s three services carried 199.7 million riders. 102.5 million (51%) rode Metrobus, whose current ridership exceeds pre-pandemic ridership levels (WMATA, 2023b).
Like most U.S. public transportation systems, WMATA operates its bus and subway to optimize work-related travel characterized by lengthy, linear, unaccompanied, and direct rush-hour trips. Also, like many other urban systems, WMATA emphasizes the need for an equitable approach to service provision (WMATA, 2022). However, equity plans tend to omit gender as a barrier to access. As countless scholars have argued, men, not women, typically follow those patterns (Sánchez de Madariaga, 2013; Loukaitou-Sideris, 2016; Lee et al., 2018; Gauvin et al., 2019; Hu, 2021; Murillo-Munar et al., 2023; Ravensbergen et al., 2023; Villafuerte-Diaz et al., 2023). This gender-biased approach results in a transportation system that seeks to minimize the time in transit from the home to the workplace in a spider-web-type fashion, with the most significant workplace locations near the hub. The hub-and-spoke design trope is evident on the D.C. Metro system map, where all the subway lines radiate from the center to the periphery without any circular routes connecting them all, as can be found in Moscow, Russia, for example (Figure 1).
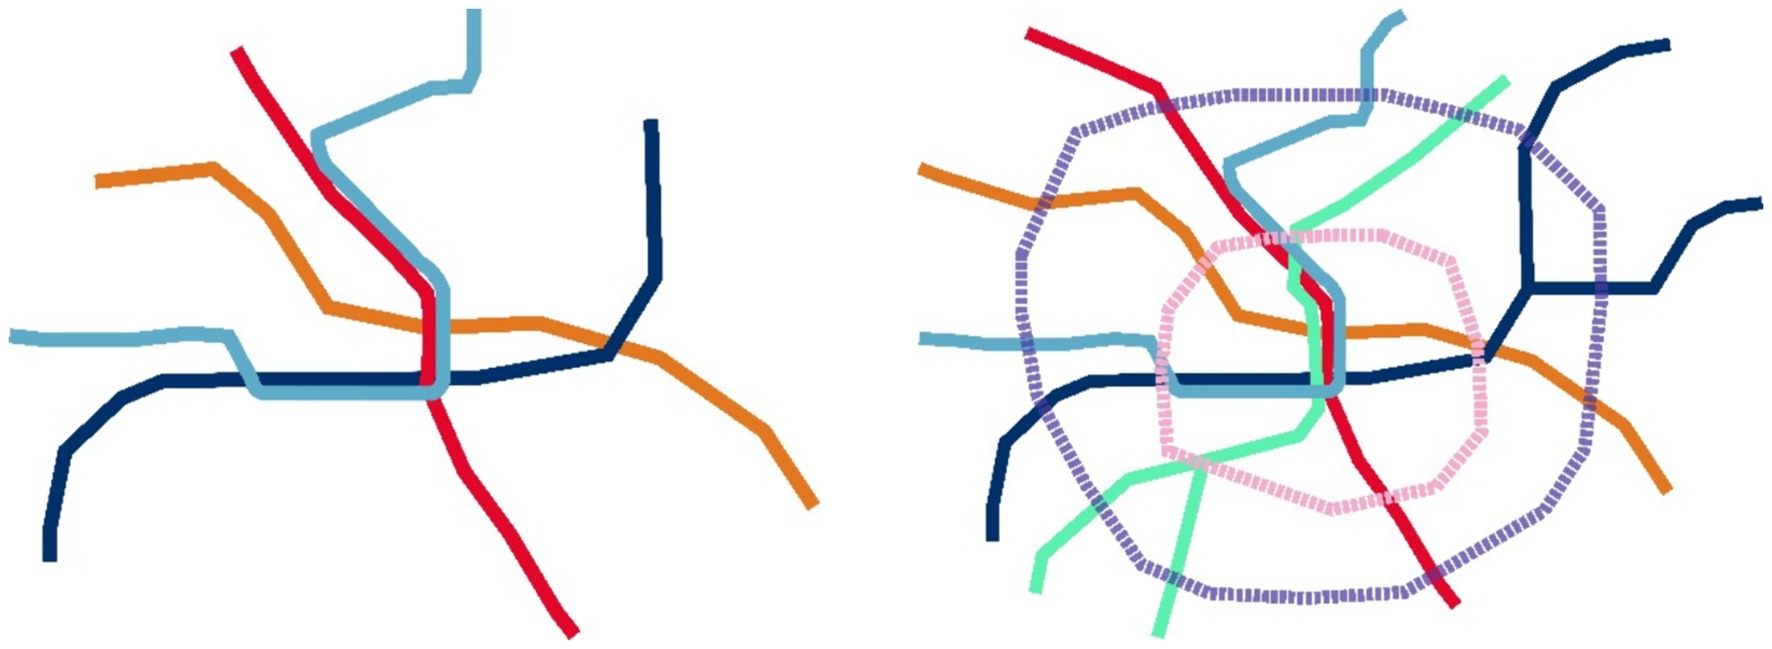
Figure 1. Hub-and-spoke system and starfish transportations system designs.
The ubiquitous hub-and-spoke design neglects the unpaid care-related trips done primarily by women that are often brief, polygonal, accompanied by children or older adults, and often take place during off-peak outside of rush hour. Sánchez de Madariaga (2013) and Sánchez de Madariaga and Roberts (2016) posits that “compulsory mobility,” the pervasive concept in urban transit research, fails to consider the “mobility of care”—travel done mostly by women to support home and caring responsibilities. The concept also includes mobility on foot or walking Loukaitou-Sideris (2016) provides further insights into what the mobility of care looks like in her history of women’s physical mobility. She describes how care work travel leads to the use of transit systems in distinctly different ways than those who use it for employment purposes.
The mobility of care concept has generated a robust body of work worldwide. These studies often require recoding trip data generated for purposes other than gender analysis. To date, a single study addresses the mobility of care in Washington, DC. Rather than using survey data, the study leveraged electronic fare card travel data to infer rider origins, destinations, and transfers on D.C. buses (Shuman, 2023). This unique approach demonstrates the promise that everyday data feeds (“big data”) processed through automated algorithms may enable transit agencies to better understand ridership patterns in real time, including the mobility of care. While costly to implement, the more traditional large-scale household surveys provide rich person- and household-level data that is indispensable for increasing our understanding of care-related travel patterns. However, the availability of such detailed data is often delayed, and its use may encounter other policy pressures and objectives. The RTS survey data used in this study is the most recent comprehensive database in the NCR that disaggregates transit-related data by gender.
This study focused on areas that form the Washington Metropolitan Area Transit Zone (Zone) comprised of Washington, D.C. (the capital of the United States), Montgomery and Prince George’s counties in Maryland, Arlington, Fairfax, and Loudon counties in Virginia, as well as the cities of Alexandria, Falls Church, and Fairfax, also in Virginia (Figure 2).
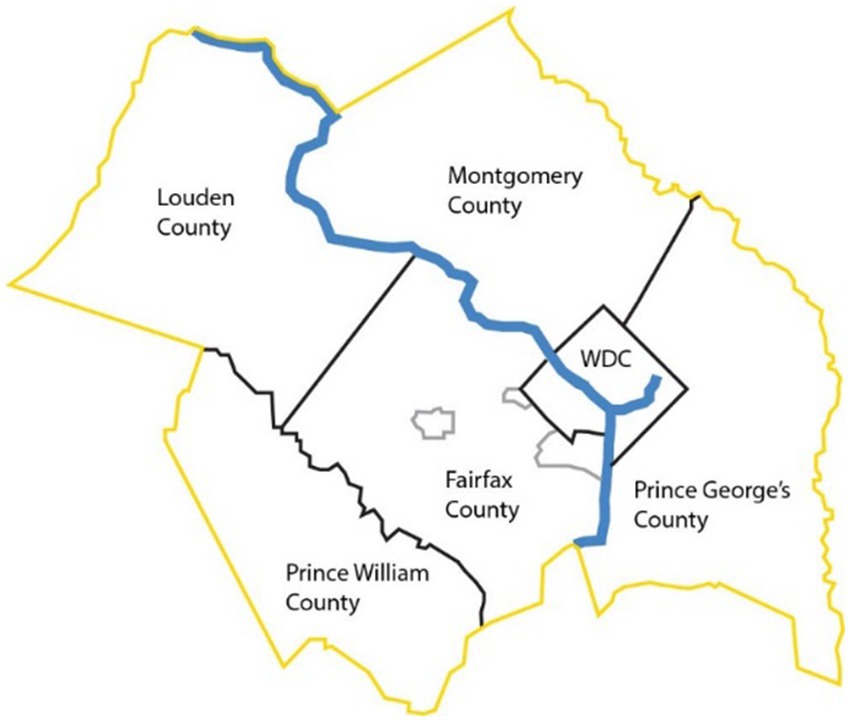
Figure 2. Washington Metropolitan Area Transit Zone jurisdictions, USA.
Lawmakers defined the Zone within an interstate compact between D.C., Maryland, and Virginia. It has been in effect since 1967 and has been amended seven times, most recently in 2009 (DC Government, 1973; WMATA, 2009). WMATA provides transit services throughout the Zone, which comprises a total area of approximately 1,500 square miles (3,900 square kilometers) and approximately four million inhabitants.
The 2017–2018 Regional Travel Survey (RTS), conducted by the National Capital Region Transportation Planning Board (TPB) at the Metropolitan Washington Council of Governments (MWCOG), surveyed approximately 16,000 households across all 23 TPB member jurisdictions and neighboring jurisdictions. The address-based survey consisted of two parts. Part one collected household demographic characteristics. Part two collected one-day (24 h) surveys of household travel covering trip durations across many modes of transportation, including walking and cycling. The survey instructed the responding household member to record trips for up to eight household members and, where applicable, participating non-household members. Survey materials were available in English and Spanish, with telephonic support available to respondents upon request. The public RTS dataset contains separate files for households, people, trips, and vehicles. The survey comprises 126,874 trips made by household members of all ages. For our study, we matched the person and trip files using assigned household identification numbers.
The RTS has several advantages over more extensive nationwide surveys, such as the National Household Travel Survey (NHTS), which is popular with transportation researchers. First, the RTS has a higher household sampling rate in its target area. The 16,000 RTS households surveyed constituted 0.7% of the regional population, while the 7,900 NHTS households surveyed in 2022 constituted only 0.006% of the national population. This gives the RTS data considerably greater fidelity (Metropolitan Washington Council of Governments, 2019; U.S. Department of Transportation, 2022). Furthermore, the RTS does not exclude household members based on age and includes all age brackets of riders. In contrast, the NHTS data only includes trip information for riders 5 years old and older. This is a significant drawback given that mobility of care research findings suggest that there are a number of riders under the age of five accompanied by a care giver who is most frequently female. This information is critical for exploring care-related travel trends. The RTS data, therefore, provides a more reliable basis for our analysis.
Finally, the National Capital Region Transportation Planning Board (TPB), the federally designated metropolitan planning organization (MPO) in the National Capitol Region, is part of the regional governmental coordinating body, the Metropolitan Washington Council of Governments (MWCOG). Both organizations play a pivotal role in developing, fielding, and analyzing the RTS and leveraging its data to develop regional travel models and forecasts to inform regional transportation policy. The localized nature of the survey allows for significant flexibility in designing the survey to meet regional needs. Finally, the RTS sample is representative of the NCR population in each of the covered jurisdictions (Metropolitan Washington Council of Governments, 2019).
In the first stage of the study, we selected all nine Zone jurisdictions in the trip data file as they formed the basis of the study objectives. This geographic selection reduced the sample to 77,859 trips. Next, a subset of data was created to include only those transportation modes of interest to the study (e.g., trips by car, bus, Metrorail, walking, and biking) and ruling out trips made by other modes (e.g., commuter rail, express commuter bus, shuttle bus, and ride-hailing, among others). The exclusion of these modes of transportation aligns with previously published research on the topic (Ravensbergen et al., 2023). This step reduced the dataset to 74,334 trips. Finally, we included 27 destination activities, filtering out those data that reported “at home” as the destination activity. The all-ages dataset included 49,392 trips. To ensure the quality of the data, we ran analyses to detect trip data anomalies. The analysis revealed trips made by household members under 10 years of age whom adults did not accompany. Anecdotal evidence and personal observations on the DC public transportation system indicate that such trips are possible, though rare. We identified 177 records meeting this definition, thus reducing the dataset to 49,215 trips.
To perform analyses of trips based on age group, we considered those made by people aged 18 to 65 as reflected in the household travel diary (36,237 trips). We chose this age range to reflect the mobility of working-age respondents who are more likely to care for others, including children and grandchildren. This age range differs from other studies on the mobility of care. For example, Sánchez de Madariaga and Zucchini (2019), in their groundbreaking analysis of the mobility of care in Madrid, Spain, restricted their results to respondents ages 30 through 45. Their rationale for choosing this age range was that it highlighted a portion of the population heavily involved in gender-relevant caregiving activities and aided in the feasibility of their study (Sánchez de Madariaga and Zucchini, 2019). On that note, Ravensbergen et al. (2023) recently published a study on the mobility of care in Montréal, Canada, which focused their analysis on travelers aged 25 to 60 years old, arguing that it covered people who were more likely to provide caregiving than receive it. All analyses are weighted using the person-weight to account for trips analyzed at the person level.
Based on our selected data, we recoded several of the variables included in the original RTS study using destination activity rather than destination purpose to describe each trip. For example, the survey offered 14 choices for destination purposes. However, the destination activity variable contained 28 choices. Unlike other mobility of care studies, we used the destination activity variable for this analysis because it provided greater detail regarding the reasons for the reported trips. By making this change, we could populate the categories with greater confidence. Using Sánchez de Madariaga and Zucchini’s (2019) mobility of care framework, we recoded the 28 destination activities into six final trip purpose categories: care, work, shopping, school, leisure, and other. We refer to this variable as “trip purpose” in our analyses (Table 2).
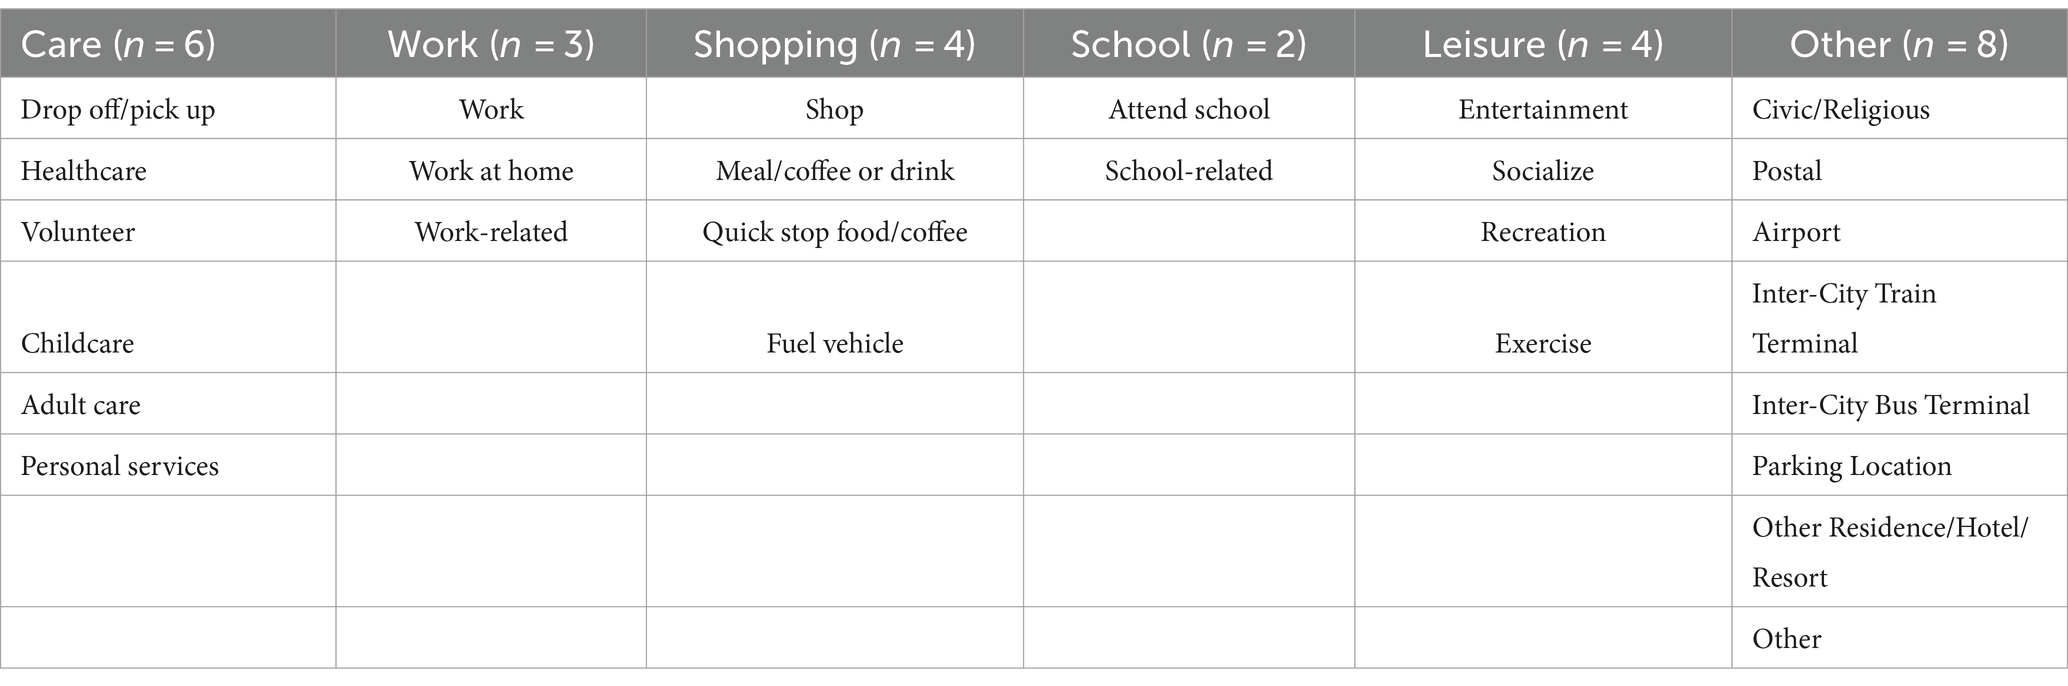
Table 2. Trip purpose recoding scheme.
Our definition of care trips includes all those made with or by people for the caring and well-being of others and those supporting the functioning of the household.
The analyses of the data set entail several steps, including (1) a descriptive analysis to understand the distribution of care trips versus trips conducted for other purposes; (2) an analysis to explore the role that gender plays in travel mode choices; and (3) logistic regressions to understand the odds of making a care trip by various travel modes, including by public transportation (Metrorail and bus). We utilized R 4.2.3 (2023) for all data analyses.
We present our study results in five subsections. Subsection one provides descriptive statistics of the study sample. Subsection two provides descriptive analyses of care trips in the Washington Metropolitan Area Transit Zone. Subsection three analyzes and identifies statistically significant differences between trips made by all modes and genders. The fourth subsection explores care-related trips through three logistic regression models to understand the likelihood of different trip scenarios by household- and individual-level demographic and socioeconomic variables.
Our study sample contained 19,274 unique people who made 49,215 trips for all purposes and by all modes in the National Capital Region between October 2017 and June 2019. Table 3 summarizes the study population’s demographic and socioeconomic characteristics and trip frequencies by gender, age, race/ethnicity, number of household vehicles, household size, number of people living with a disability, employment status, household location, household income, travel mode, and trip purpose. The values highlighted in grey represent the characteristics with the highest values. 52.7% of respondents in our sample were women, 29.1% of whom were between the ages of 30 and 45. 65.5% of the subjects were white, 16% were African American or Black, 9.8% were Asian, and 5.6% were Hispanic.1 92.2% of surveyed households owned at least one vehicle, 82% lived in households with two or more residents, and 93.9% reported not living with a disability. 64.3% of the surveyed population were employed, and 83.7% lived outside of the District of Columbia. 38.4% had an annual household income of more than US$150,000, while 11.6% had a household income of less than US$50,000, the 2023 Federal Poverty Level for families of eight people (U.S. Department of Health and Human Services, 2024). Although most of our analyses focus on people aged 18–64, the sample also contains trip records for 2,835 travelers aged 0–18.
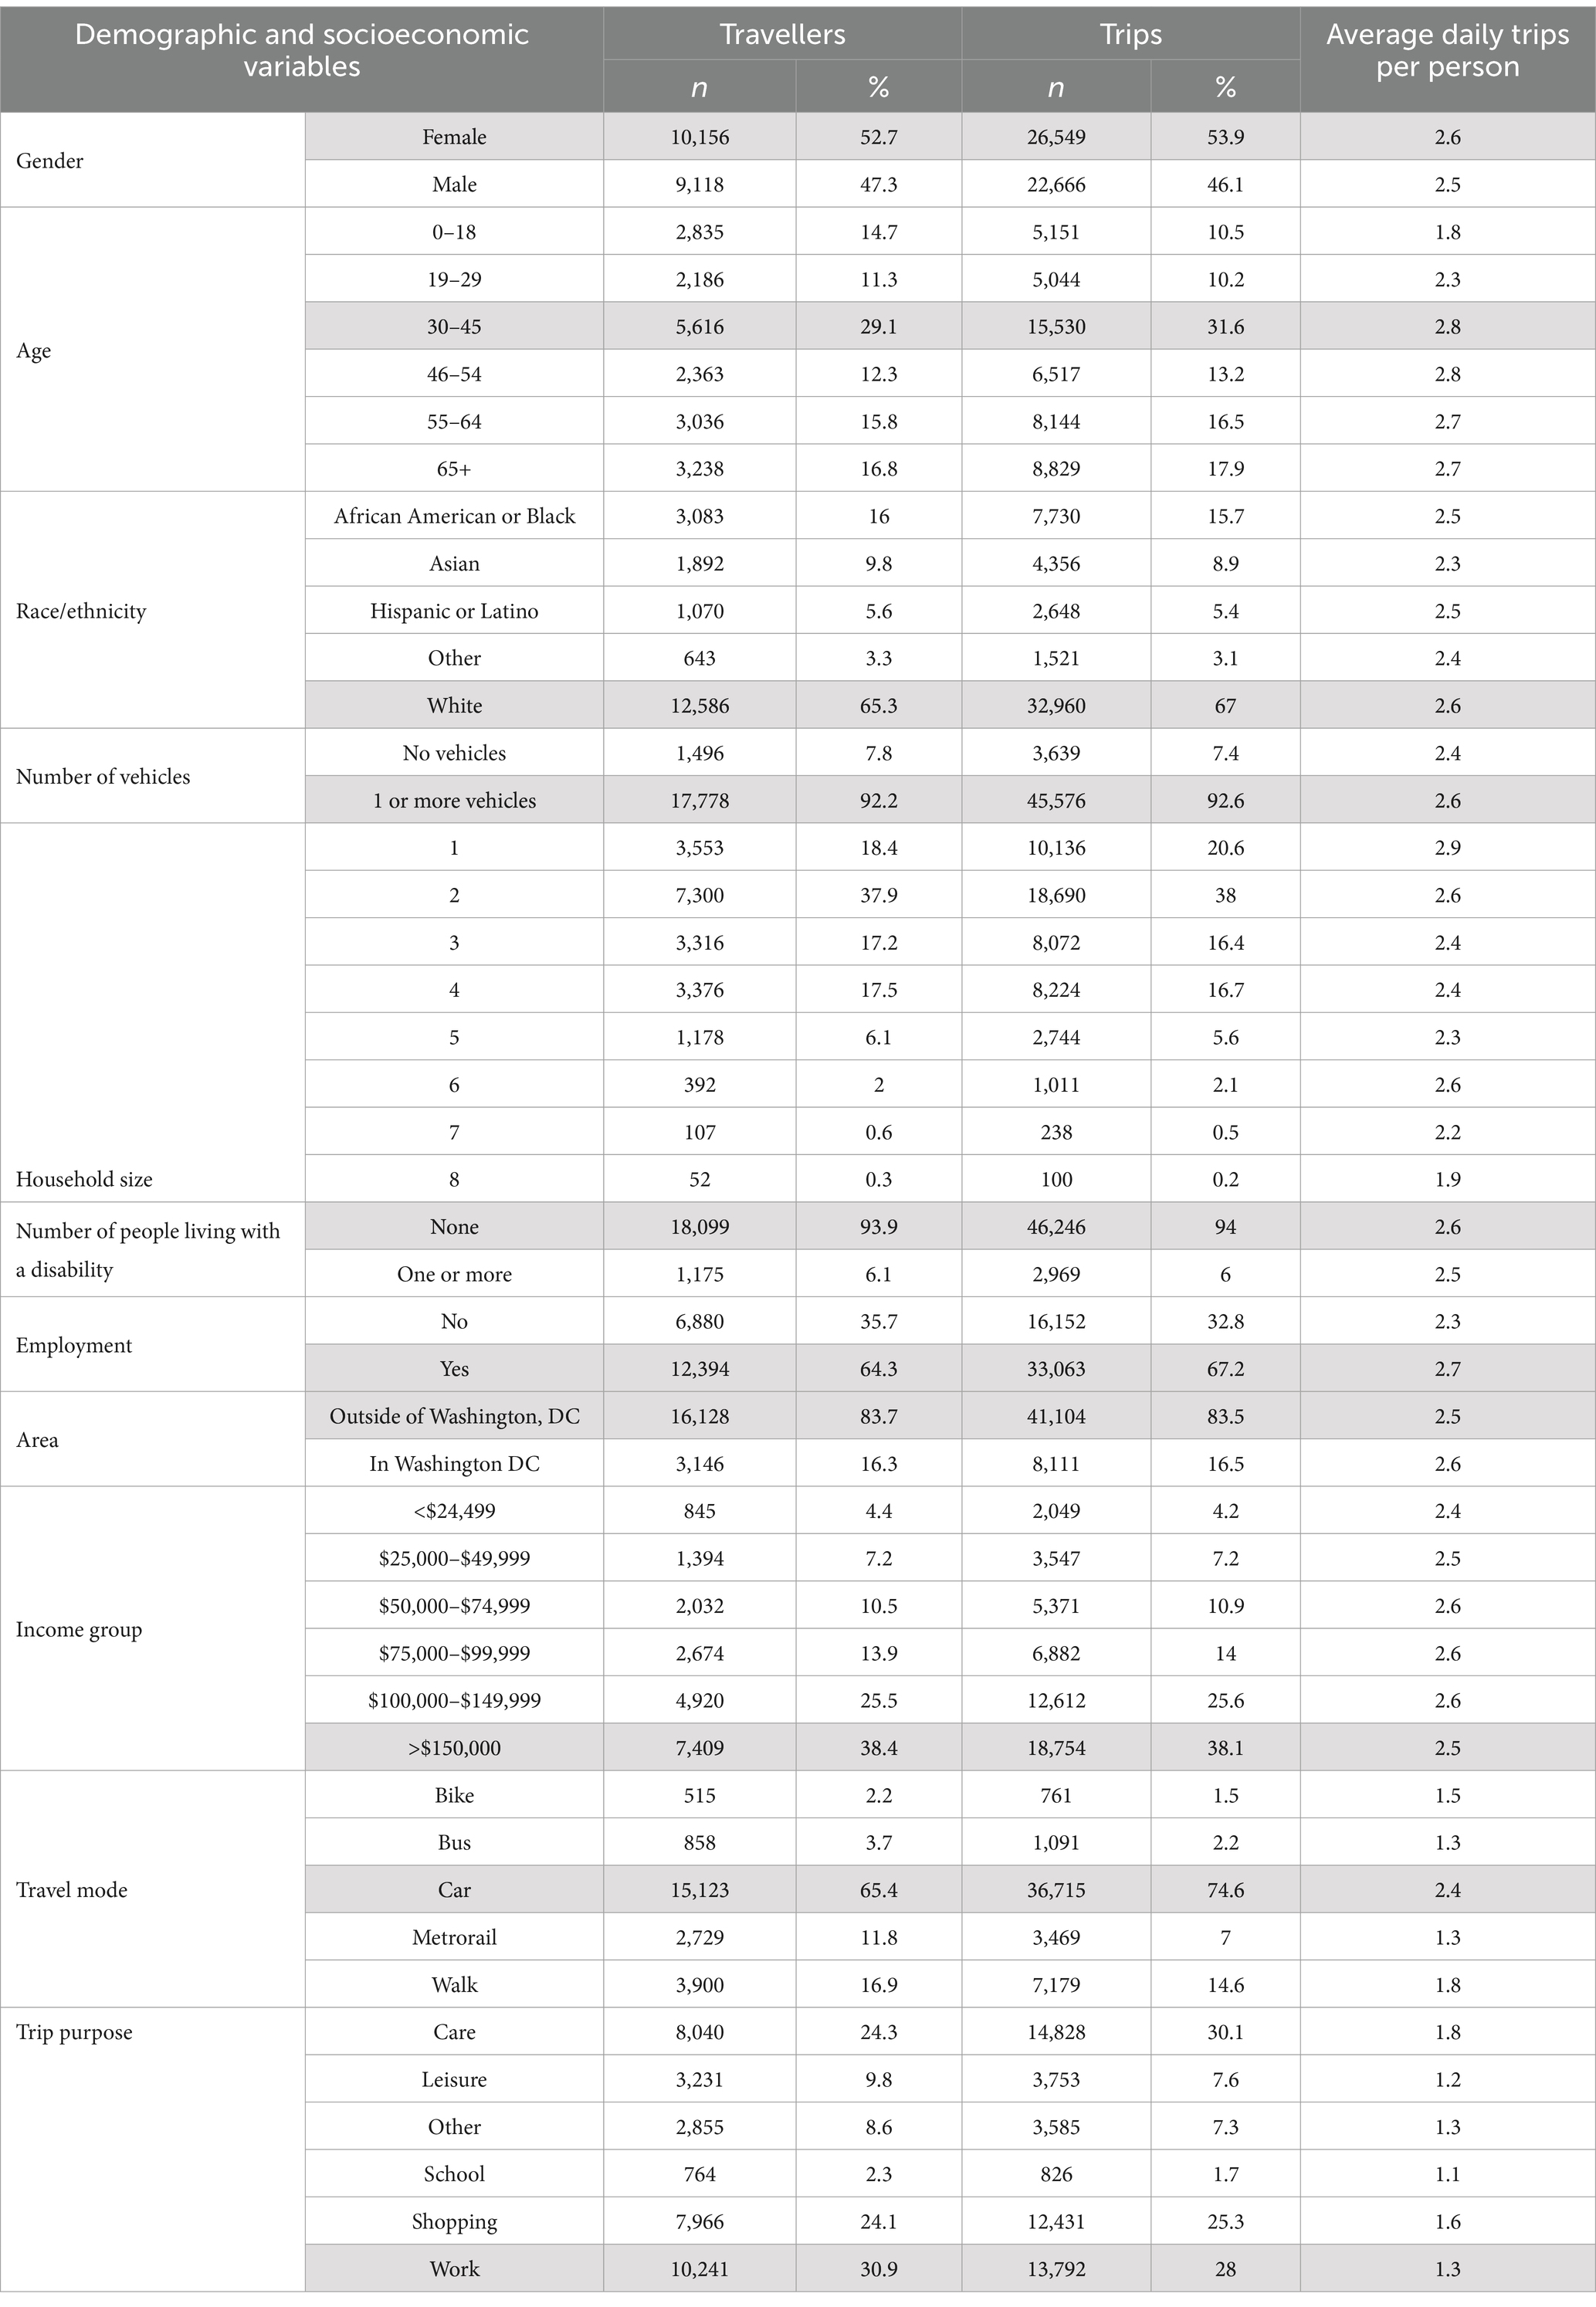
Table 3. Study sample characteristics (highest values highlighted in grey).
Based on our analysis, trips for work (35%) represent the highest percentage of any trip category in our sample, followed by shopping (28%), care (22%), leisure (8.5%), other (4%), and school trips (2%) (Figure 3). The RTS data reveals a difference of almost 13% between work and care trips (35% vs. 22%) and an almost 14% difference between care and leisure trips (22% vs. 8.5%). In other words, riders of all ages took 2.6 times more care trips than leisure trips.
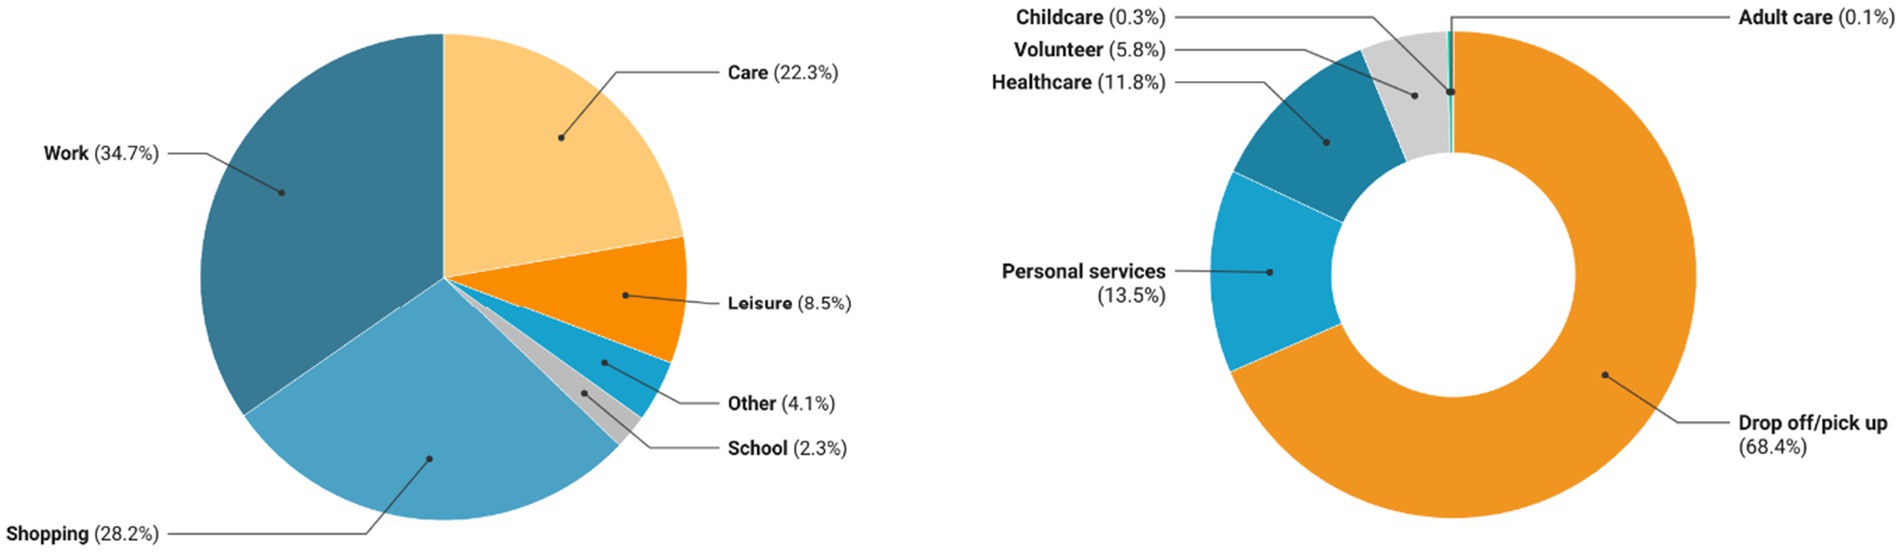
Figure 3. Trip purpose for all modes (18–64 years old).
Next, we explored the proportional relationships between gender and trip purpose (Figure 4). Using chi-square tests (p < 0.05), we found statistically significant differences between women and men for each trip purpose. Women made 13% more trips for care than men (42% vs. 29%). For all other categories, men make more trips proportionally than women in all modes.
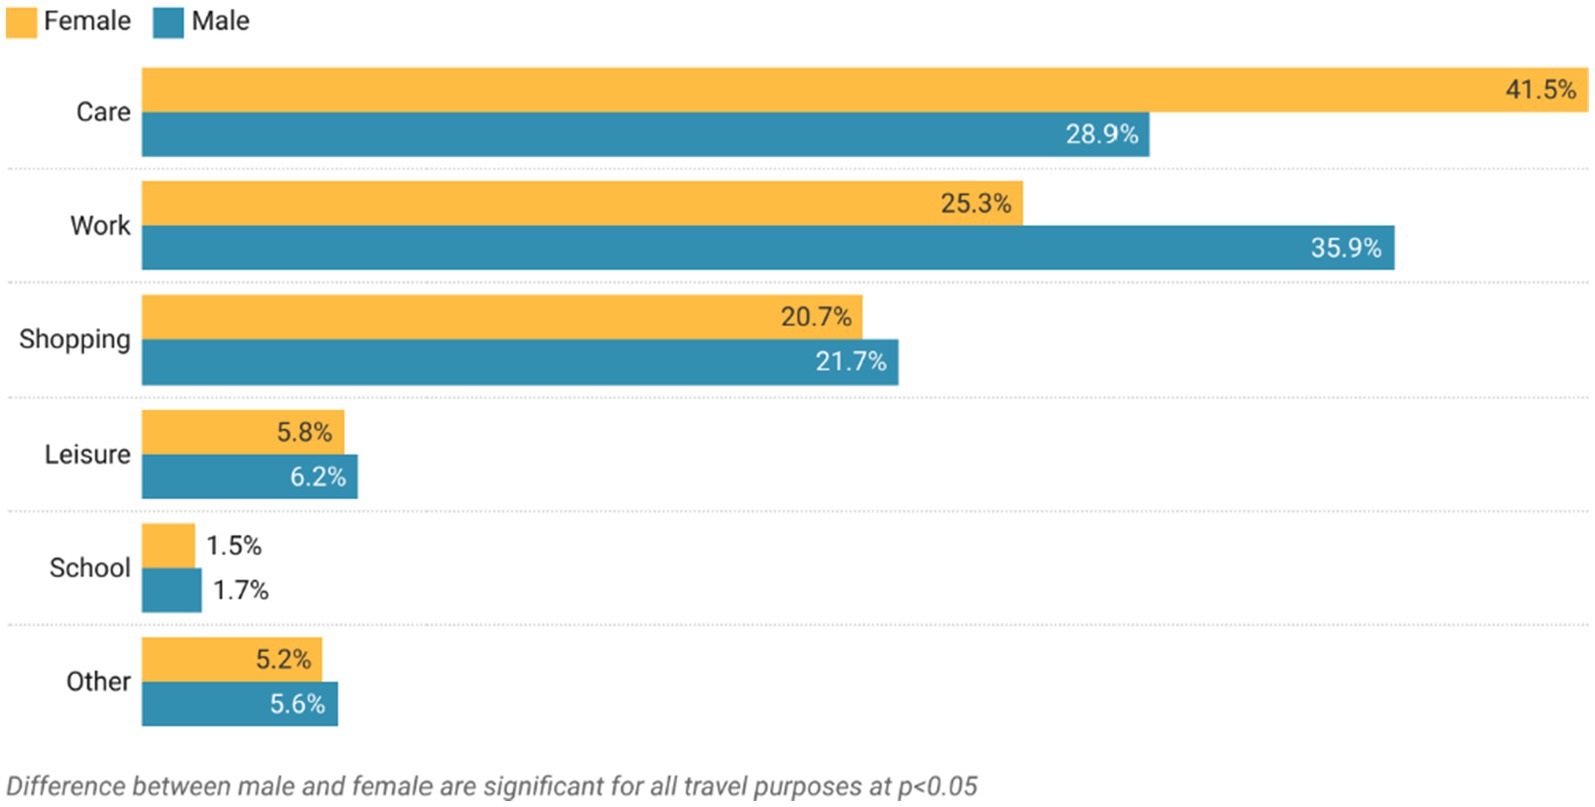
Figure 4. Trip purpose by gender for all modes (18–64 years old).
A more in-depth analysis of care trip purpose reveals differences between women and men at a statistically significant level as indicated by a chi-square test (p < 0.05). Results are summarized in Figure 5 and show that women’s travel for drop-off/pick-up and childcare exceeds men’s by 24 and 87.2% (61.9% vs. 38.1 and 93.6% vs. 6.4%). However, men made most adult care trips (92%) compared to women (8.4%).
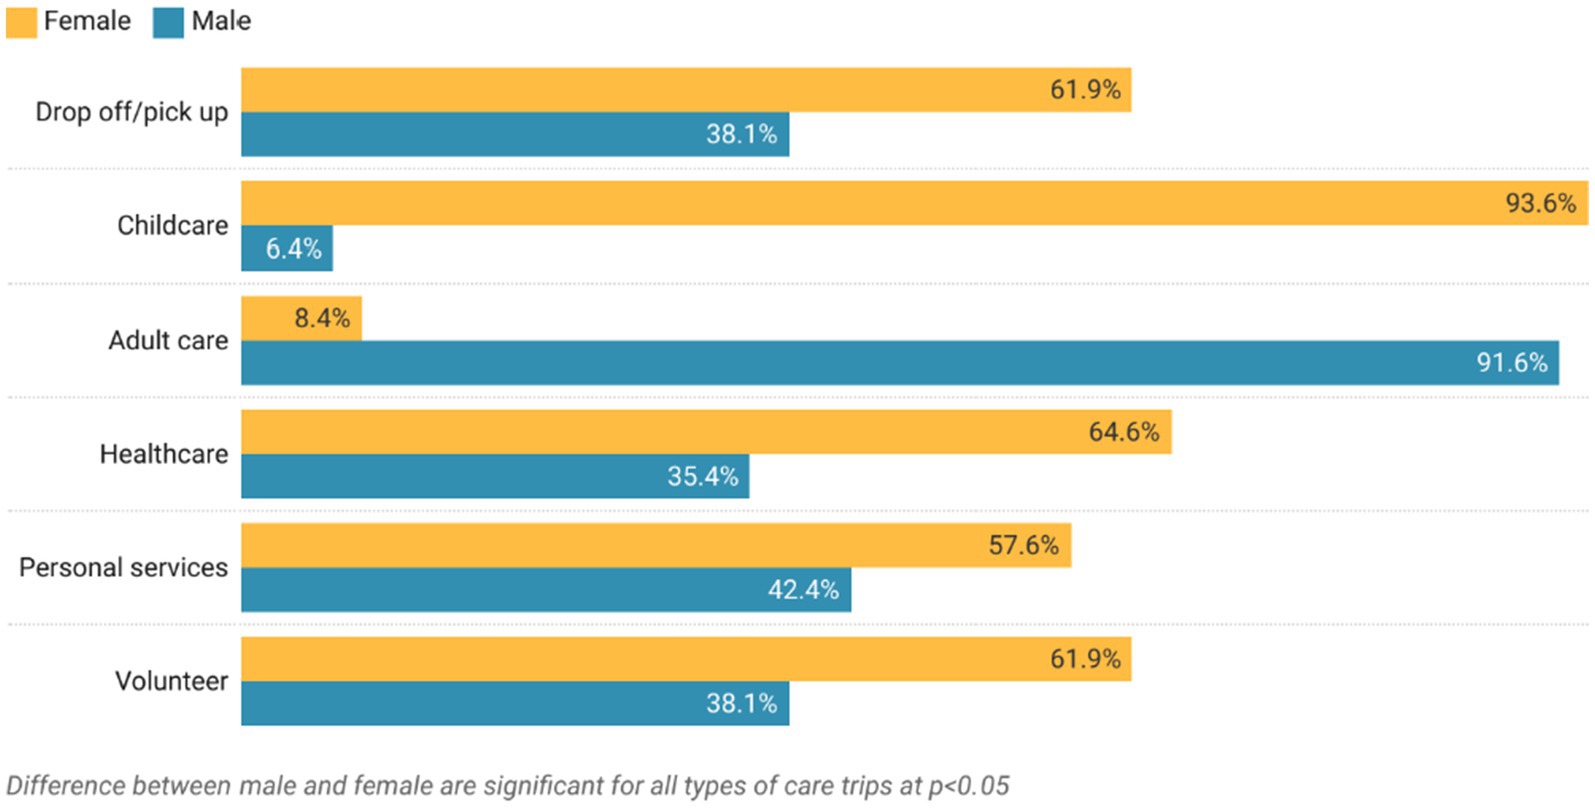
Figure 5. Care trip purpose by gender for all modes (18–64 years old).
The analysis of care and work trips by travel mode for women and men exposed statistically significant differences (p < 0.001) (Table 4). Women and men made most trips by car. However, men used cars more frequently than women for care and work trips.
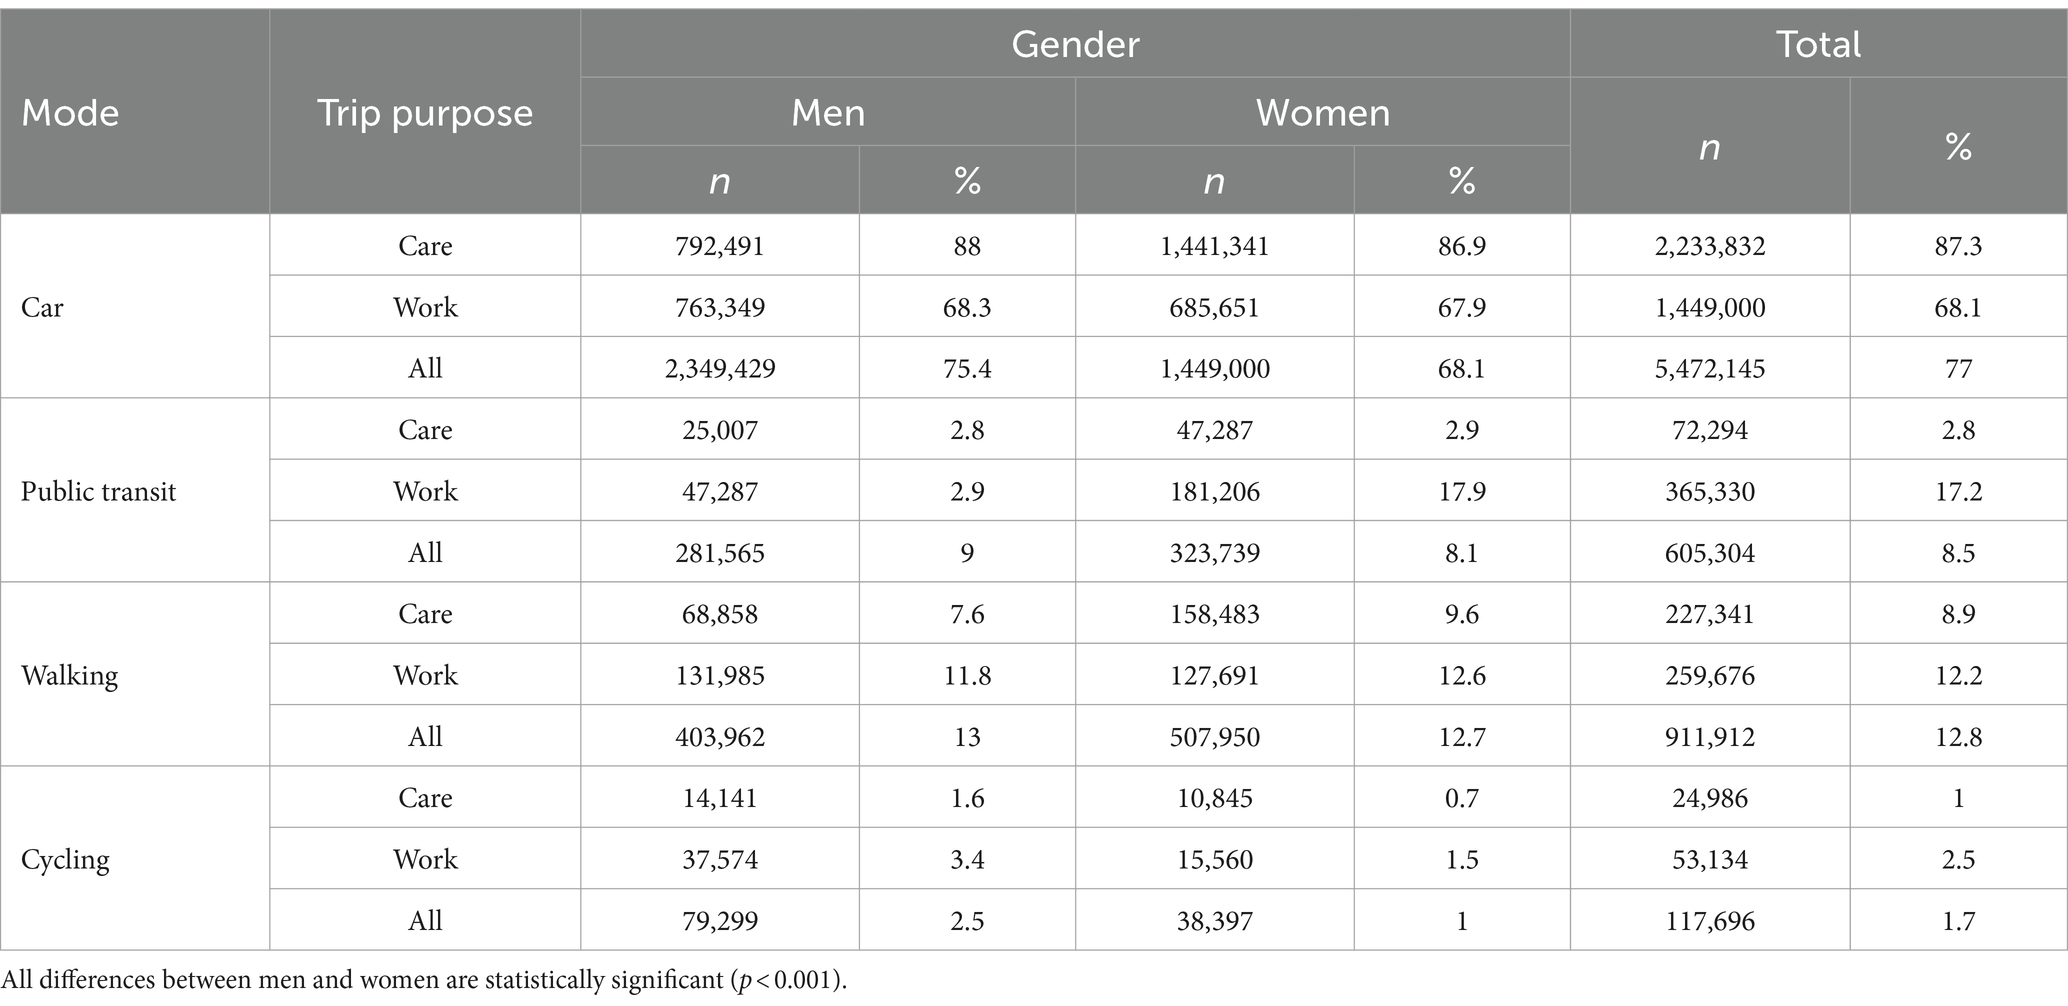
Table 4. Care and work trips by gender and mode (18–64 years old).
Our analysis of care trip purposes by gender and mode suggests that women are more likely than men to travel by bus for their care-related trips (38% vs. 24%), whereas men are more likely to use Metrorail (subway) (62% women vs. 76% men). Work travel for both men and women differs slightly (2%). Both men and women prefer Metrorail over bus rides for work and care-related travel. The differences are summarized in Table 5 and are statistically significant at p < 0.001.
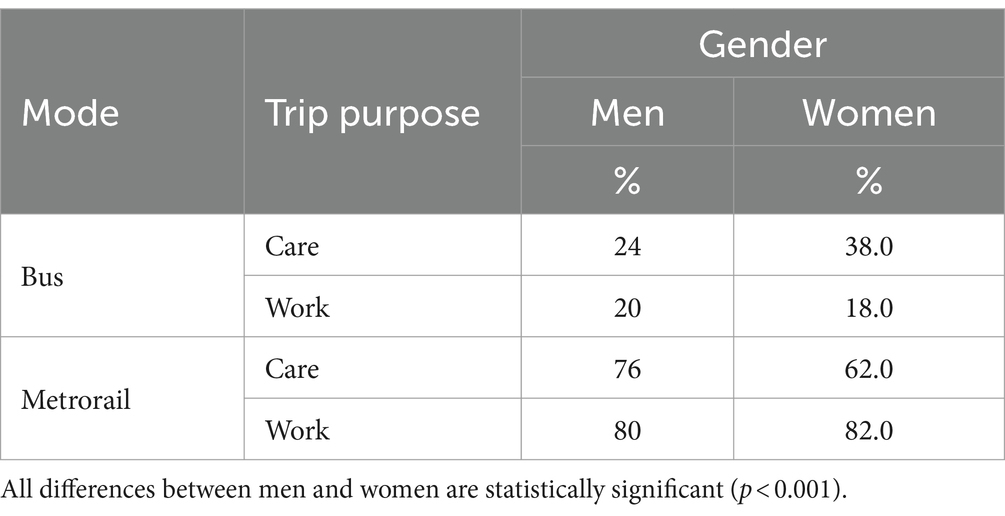
Table 5. Care and work trips by gender and by public transportation mode (18–64 years old).
The final analysis of our data uses regression analysis to explore correlations between travel scenarios, traveler demographics, and household socioeconomic factors (Table 6).
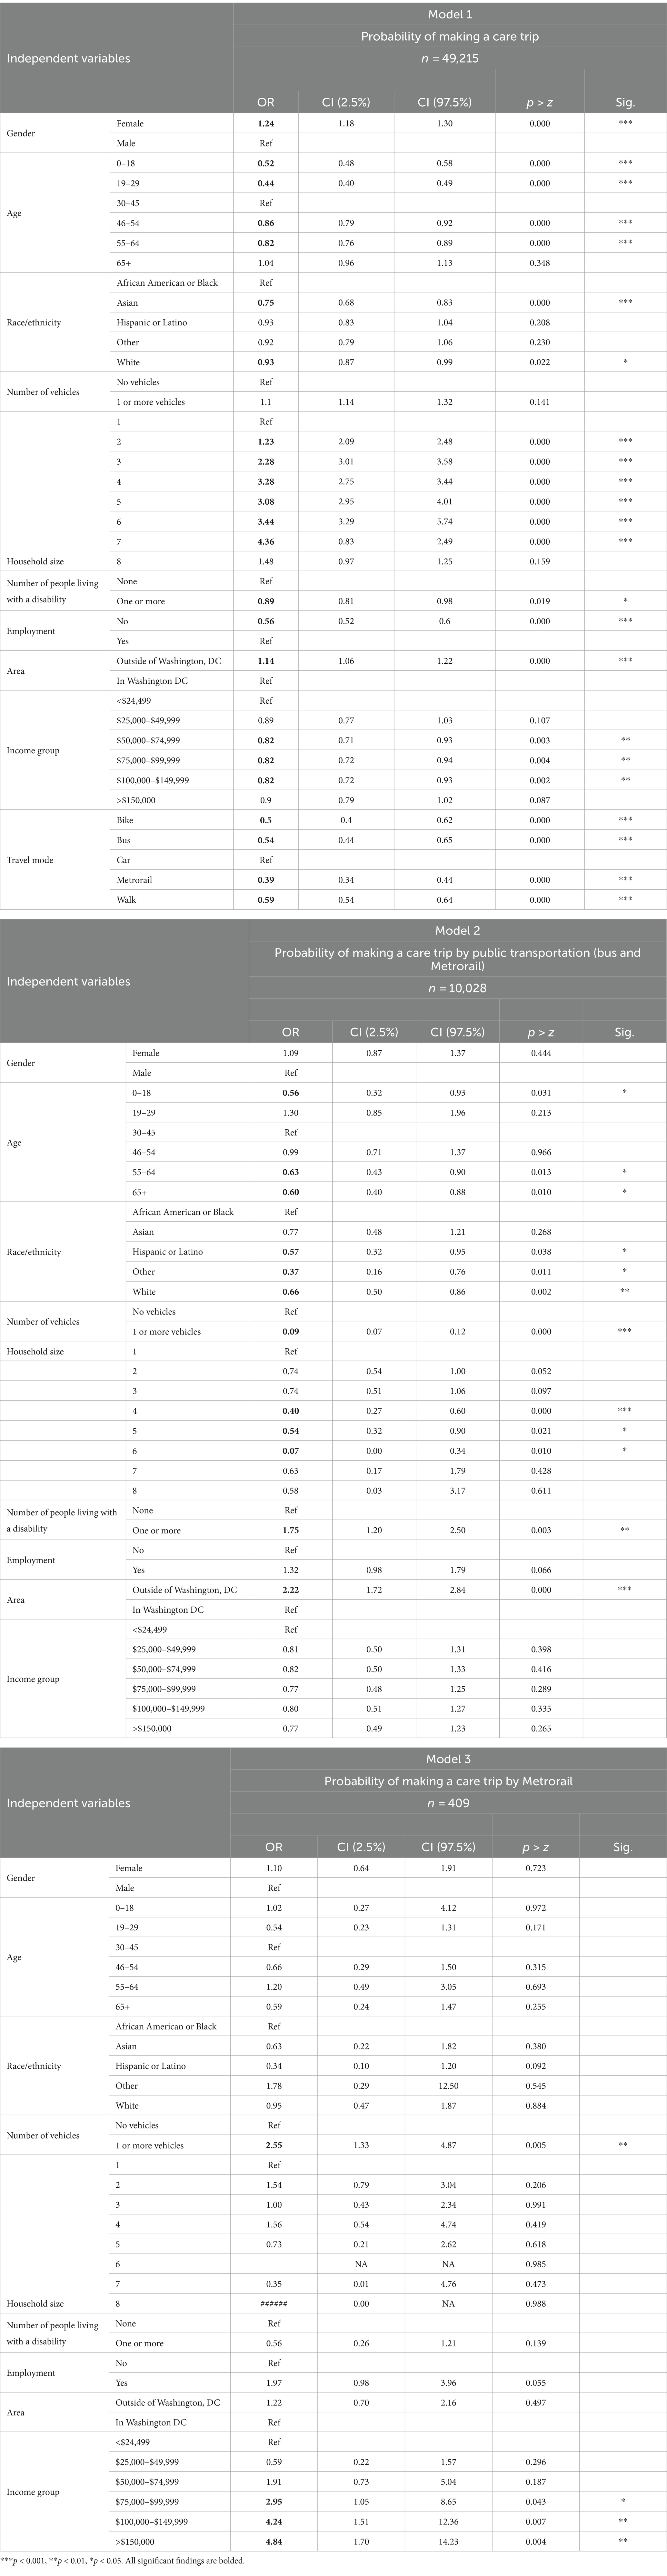
Table 6. Relationships between demographic and socioeconomic variables and the mobility of care (18–64 years old).
Using regression analysis, our first model tests the probability of making a care trip versus any other trip (e.g., work, shopping, leisure, school, and others). Our analysis considers several demographic and household characteristics, including gender, age group, race/ethnicity, household size, possession of a household vehicle, number of household members with disabilities, employment status, residence location, income, and travel mode. To assess the fit and explanatory power of our regression model, we ran the Pearson chi-square, pseudo-R-square, and Hosmer–Lemshow tests. Before running our regression model, we checked for multicollinearity using the variance inflation factor (VIF) statistics. VIF statistics for all exploratory variables reveal values lower than 2, the cutoff point indicating any presence of multicollinearity. This result implies that our regression does not suffer from multicollinearity among the exploratory variables. Our chi-square test indicates a good fit of our model. In addition, we conducted the Hosmer–Lemshow test to check whether the goodness of fit remained even with a large sample size. The corresponding p-value test suggests that the model exhibits a strong fit.
Many of the independent variables in our model have statistically significant odds ratios (OR). Our results suggest that women were more likely than men to make a care trip (OR = 1.24, p < 0.001). Travelers aged 0–18 (OR = 0.52, p < 0.001), 19–29 (OR = 0.44, p < 0.001), 45–54 (OR = 0.86, p < 0.001), and 55–64 (OR = 0.82, p < 0.001) were less likely to make care trips than travelers aged 30–45 and 65 or older. Respondents self-reporting Asian race/ethnicity (OR = 0.75, p < 0.001) and White race/ethnicity (OR = 0.93, p < 0.05) were less likely than African-American/Black respondents to make a care trip. Results for households with two to seven members were highly significant at p < 0.001. Households with at least one disabled member were less likely to make a care trip (OR = 0.89, p < 0.05), as were households where a household member was unemployed (OR = 0.56, p < 0.001). District Columbia residents were likelier than those residing elsewhere in the transport Zone to make a care trip (OR = 1.14, p < 0.001). Households with incomes between $50,000 and $149,999 all showed a low likelihood of making care trips (OR = 0.82, p < 0.01). Finally, trips made by bike (OR = 0.5, p < 0.001), bus (OR = 0.54, p < 0.001), Metrorail (OR = 0.39, p < 0.001), and walking (OR = 0.5, p < 0.001) were less likely than those made by car to be care trips. These findings apply to the entire sample of households regardless of the residence location.
Our second model explored the probability of making a care trip using public transportation versus any other mode of transportation (e.g., bike, bus, car, and walking) using the same demographic and household characteristics used in each logistic regression model. For our second model, we included only those trips coded as care-related (=10,028). As with model 1, we ran several tests to assess goodness of fit. Our chi-square test for goodness of fit indicates a good fit of the model. However, the Hosmer–Lemshow test does not show significance.
In model 2, many independent variables have statistically significant odds ratios (OR). Travelers aged 0–18 (OR = 0.56, p < 0.05), 55–64 (OR = 0.63, p < 0.001), and 65 and older (OR = 0.60, p < 0.05) were less likely to make care trips by public transportation modes than travelers aged 19–54. Respondents self-reporting Hispanic/Latino (OR = 0.57, p < 0.05), Other (OR = 0.37, p < 0.05), and White race/ethnicity (OR = 0.66, p < 0.01) were less likely than African-American/Black respondents to make a care trip using public bus or rail. Where a household possed one or more vehicles, they were less likely to make a care trip by public transportation (OR = 0.09, p < 0.001). Households with four (OR = 0.4, p < 0.001), five (OR = 0.54, p < 0.05), and six (OR = 0.07, p < 0.05) household members were less likely to make care trips by public transportation. Households with at least one disabled member were more likely to make a care trip using public transportation (OR = 1.75, p < 0.01), as were households in the District of Columbia (OR = 2.22, p < 0.001). Gender, employment status, and income were statistically insignificant in this model.
Our third model explored the probability of making a care trip using the Metrorail versus the bus system. We used the same demographic and household characteristics as our previous two regression models. Changes to the inclusion criteria reduced our sample population to a relatively small number (n = 409). Again, we ran several tests to assess the goodness of fit. Our chi-square test indicates a good fit of the model. The Hosmer–Lemshow test did not indicate significance.
In model 3, few independent variables have statistically significant odds ratios (OR). Where a household possessed one or more vehicles, they were more likely to make a care trip by Metrorail rather than by bus (OR = 2.55, p < 0.01). Households with incomes between US$75,000–US$99,999 (OR = 2.95, p < 0.05), US$100,000–US$149,999 (OR = 4.24, p < 0.01), and US$150,000 more (OR = 4.84, p < 0.01) were also more likely to make care-related trips by Metrorail rather than by the bus. Gender, age, race/ethnicity, household size, disabled household members, employment status, and place of residence were all statistically insignificant in this model.
Our study provides insights into the mobility of care in the Washington, D.C. region. According to previous research, women are more likely to make care-related trips than men, as are travelers between the ages of 30 and 45, considered at prime child-rearing age (Sánchez de Madariaga and Zucchini, 2019). Young children require adult accompaniment for many trip destinations, including daycare centers, schools, medical clinics, and sports practices. Our findings corroborate the high care-related travel needs of this age group in the NCR, suggesting opportunities for reducing car travel and addressing the significant traffic congestion in Washington DC and its metro area.
The characteristics of our study sample are representative of the population in the Washington Metropolitan Area Transit Zone, which encompasses urban, suburban, and rural locations. Interestingly, the sample has slightly more females than males, and the highest percentage of households consists of two individuals. Most respondents reside outside of Washington, DC, which has a relatively small geographic area compared to the rest of the Zone (68 m2 vs. 1,432 m2). The relatively robust economic position of the households in our sample indicates Washington D.C. and its metro area. DC households earn an average income of US$101,722, substantially higher than the national average of US$75,149 (US Census Bureau, 2024). Over 65.4% reported taking trips by car, and 30.9% reported taking trips to work locations.
Our recoding and data analysis made it possible to calculate the number and percentage of trips made for work, care, shopping, leisure, and school in the RTS data. Work trips exceeded all other categories, but care trips comprised a sizeable proportion. Using chi-square tests (p < 0.05), we found statistically significant differences between women and men for each trip purpose. Women made 12.6% more trips for care than men (41.5% vs. 28.9%). For all other categories, men make more trips proportionally than women in all modes. One surprising finding is the degree to which men perform travel for adult care in comparison to women. According to the 2021–2022 American Time Use Survey, women comprise 59% of the civilian population’s unpaid labor force providing eldercare (US Census Bureau, 2023a). In the RTS data, however, men made 91.6% of adult care trips compared to 8.4% for women. One explanation for this difference is the small sample size for the adult care category (n = 495) versus the childcare category (n = 2,130), and adult care trips total a mere 0.1% of trips made regardless of mode. For cycling, once again, men used bicycles for care and work trips more than women. This finding is consistent with the literature on gendered urban bicycle use across the globe (Goodman and Cheshire, 2014; Wang and Akar, 2019; Battiston et al., 2023).
Our findings are consistent with studies on the mobility of care in other cities. For example, by recoding Spain’s national mobility survey of 2006–2007, researchers identified a difference of 5 percentage points between work and care trips (30% vs. 25%) and a difference of 14 percentage points between care and leisure (25% vs. 11%) (Sánchez de Madariaga, 2013). In Montréal, Canada, researchers found that travelers aged 25 to 60 made considerably more work trips than care trips (48% vs. 28%) and more than three times the percentage of care trips than leisure trips (28% vs. 9%) (Ravensbergen et al., 2023). In Bogotá, Colombia, researchers found a difference of more than 20 percentage points between care trips (32% vs. 11%) among travelers of all ages (Murillo-Munar et al., 2023). Our analysis indicates that 68% of respondents dropped off or picked up another traveler (Figure 4), which closely corresponds to findings from Montréal (Ravensbergen et al., 2023) and Bogotá (Murillo-Munar et al., 2023). Some research uses the term “escorting” for these care trips. However, the care designations depend on the available data sources and corresponding surveys.
Our findings indicate that women exceeded men in their use of public transportation and walking for both care and work trips. Men exceeded women in using cars and bicycles for care and work trips. Several factors contribute to these mode choices, including lack of car access, higher poverty rates among women, and shorter trip distances and durations than the trips made by men. Our data suggest that by addressing care-related accessibility gaps in WMATA services (buses in particular), the NCR public transportation system could better support the mobility of care. These findings mirror similar research (Sánchez de Madariaga, 2013; Sánchez de Madariaga and Zucchini, 2019).
Our study underscores the need to address care-related trips, which comprise approximately 25% of all trips in the District of Columbia, where public transportation use for the mobility of care is more prevalent than in the outlying regions. Our findings also emphasize the importance of providing robust route and trip frequency coverage in areas with high percentages of African American or Black households, especially in DC’s Wards 7 and 8, where non-Hispanic Black populations are the majority (American Community Survey, 2020). Regarding the types of care trips survey respondents undertook, our analysis shows that 68% of respondents dropped off or picked up another traveler (Figure 4).
Several key findings regarding care trips by Metrorail instead of the bus also emerged. For example, there are strong associations between Metrorail use in the region, vehicle access, and high household incomes. These results suggest that travelers with access to personal vehicles, though less likely to use public transportation than those without access, prefer to travel by rail rather than bus for their care-related trips. These findings are well-documented and supported by the literature (Clark, 2017; Portillo, 2021). The results also suggest an opportunity to grow the regional rail systems, including WMATA’s Metrorail and the much-anticipated Purple Line to increase public transit ridership in DC suburbs (Maryland Department of Transportation, 2024). Increasing rail service in and around Washington, D.C., can decrease carbon monoxide emissions, improve air quality, and increase road safety. Together, these actions could improve city dwellers’ health and quality of life. The growing concern for urban sustainability is evident in many places worldwide, with many using frequent car-free days to open pathways for better wellness and equity (Nederveen et al., 1999; Torres et al., 2013; Kalisa et al., 2021).
Our results are congruent with studies of the mobility of care in other cities. For example, using Spain’s national mobility survey of 2006–2007, researchers identified a 5% difference between work and care trips (30% vs. 25%) and a 14% difference between care and leisure trips (25% vs. 11%) (Sánchez de Madariaga, 2013). In Montréal, Canada, researchers found that travelers aged 25 to 60 made 20% more work trips than care trips (48% vs. 28%) and 29% more care trips than leisure trips (28% vs. 9%) than other age groups (Ravensbergen et al., 2023). In Bogotá, Colombia, researchers identified 20% more work than care trips (32% vs. 12%) among travelers of all ages (Murillo-Munar et al., 2023). The Montréal study also reported that travelers made 35% of their care trips to accompany another person and 25% to pick someone up (Ravensbergen et al., 2023). In Bogotá, 82% of care trips involved dropping off or picking up another person (Murillo-Munar et al., 2023). Researchers sometimes use the care category “escorting” to capture these particular care trips. However, the differences in each study’s data sources and methodology make it difficult to compare these results.
Several of our findings also warrant attention to the context-specific factors of mobility-related issues in Washington, DC. The DC metro area includes many commuters who live in the outlying counties but work in the city, which is the seat of the U.S. federal government and related. Our dataset includes observations from both the city and its surrounding jurisdictions. Nevertheless, while the survey’s sampling rates are representative of the population, only 16% of survey respondents lived in the region’s urban core. As a result, the analysis may underrepresent DC city dwellers.
Similarly, the dataset contains an abundance of households with high incomes (64% earn US$100,000 or more). According to the U.S. Census Bureau’s American Community Survey (US Census Bureau, 2023b), D.C.’s average annual household incomes are highly bifurcated across the city’s eight administrative wards. In 2019, the median income in the north and west of the city was US$257,000. In the east and south of the city, the median household income was US$45,000. Similarly, the median household income for white residents was US$149,734, three times higher than that of Black residents, whose median household income was US$49,652 (Council Office of Racial Equity and D.C. Policy Center, 2021). Household income is an essential determinant of mode choice. Higher-income populations have better vehicle access than less affluent populations and drive more miles (U.S. Department of Transportation, 2022). 92% of households in the Regional Travel Survey have one or more vehicles, which may not correspond to car ownership in other countries.
While our findings are robust and supported by those of numerous other care-mobility studies, we recognize several limitations. Our analysis is based on secondary data using a survey tool not designed to assess care-mobility. In addition, the survey respondents only reported weekday travel, which biases the data since most Americans’ weekdays are more likely to be work days (US Census Bureau, 2023a). Care-related travel happens on the weekends, including dropping off and picking up children from their activities, shopping for groceries and household items, and making other trips that support the household. While we cannot determine the degree to which our ridership data underrepresents care-related trips, we conclude that the work/care trip ratio would significantly change if it included weekend travel. Another limitation is that respondents completed their travel diaries between October 2017 and June 2019, 6 months before the first SARS-COV-2 infections were reported in the US (Holshue et al., 2020). The subsequent lockdowns and fears of infection reduced regional travel, especially on public transportation. Travel patterns may have changed since the pandemic, even as specific modes, such as the D.C. buses, have regained and surpassed pre-COVID ridership levels. The survey thus provides a historical baseline for understanding more recent travel patterns.
The basis for our analysis is determining which trips count as care trips due to their destination purpose. We determined this by aligning our categories as closely as possible with the methodology established in the literature on care mobility. However, the categories established to measure care trips are not always consistent and sometimes require the researcher’s discretion to capture the mobility of care trips. One significant difference between this study and studies conducted elsewhere is that, due to data limitations, we did not recode 2/3 of shopping trips as care trips as in some previous studies. If we had done so, the care trip category would have grown by 19 to 41%, eclipsing work-related travel by over 6%.
Other limitations relate to the question of how to categorize accompanied non-care-related trips. By definition, the mobility of care is travel resulting from home and caring responsibilities, including escorting others (Sánchez de Madariaga, 2013). Accordingly, any trip where an adult escorts a dependent should be a care trip regardless of the reported trip purpose. The data on which our analysis is contains records for each person in the reporting household taking a trip. As expected, there are many trips where one or multiple adults report traveling with one or more dependents. For example, a parent brings their sick child to work on the city bus. The researcher must then determine whether to retain both records in the sample as originally coded or to recode the child’s trip as a care trip without changing the parent’s trip purpose. Either way, the adult’s care-related trip is not counted while the person receiving the care, namely the child, is counted. Trips with two or more adult household members traveling with one or more dependents present similar challenges. This issue can skew trip counts in any category. We found almost 5,000 records indicating accompanying care-related trips in our sample. Adding them to the almost 15,000 trips in the care category would have resulted in a 32% increase in care trips, leading them to eclipse the number of work-related trips. As a result, our analysis may underestimate the prevalence of care-related trips.
Other care-related concepts like trip-chaining, a travel behavior where people make several linked trips, were not analyzed separately due to data limitations. In addition, personal safety concerns may result in distorting transport needs. Safety concerns are especially prevalent among cis-gender and trans women, as well as non-binary riders who may be reluctant to use public transportation (Lubitow et al., 2017; Weintrob et al., 2021). Bus stops are often poorly lit, subway cars minimally occupied, and subway stations filled with blind turns. Women are also more sensitive to unsafe cycling infrastructure, which is a barrier to access (AitBihiOuali and Klingen, 2022). Data on micro-mobility modes like electric scooters may reflect similar biases based on gender differences in safety concerns.
This study investigated the extent and drivers of care-related travel in the National Capital Region of the U.S. It provides the first in-depth gender-disaggregated travel data analysis of any American metropolitan area, in this case, Washington, DC, and surrounding regions. The first analysis set uses person, household, and trip data to estimate person-level travel by trip purpose. We used a methodology established by Sánchez de Madariaga (2013) and Sánchez de Madariaga and Zucchini (2019) and recently applied by several others (Murillo-Munar et al., 2023; Ravensbergen et al., 2023; Villafuerte-Diaz et al., 2023) to recode trip purposes, suggesting care-related travel as a new category. As a result, this study provides a critical first look into regional travel in the DC metro area using self-reported data about individual trip purposes to determine the relative frequencies of trips for care, work, shopping, leisure, and school. The study then explores associations between female, male, and care-specific travel purposes and uses multiple logistic regression analyses to uncover key factors associated with care mobility by all modes, including public transportation.
Based on our findings, actionable recommendations for public transit decision-makers can be identified, such as the regional Transportation Planning Board, WMATA’s Board of Directors, and the heads of sister agencies in the surrounding municipalities and counties. These include, at baseline, designing tools and methodologies that can measure gendered mobility patterns by mode, location, and timing. These enhancements will require the collection of gender-disaggregated data across the system. D.C. public transit organizations would benefit from forming equity advisory groups to keep care-related travel issues in clear view of policymakers and advocate for care-related policies and programs. For WMATA, an active equity-focused group would complement its current roster of advisory bodies (i.e., the Riders Advisory Council and the Accessibility Advisory Committee). Given the gender biases innate in care-related mobility issues, evidence-based gender action plans also promise to guide the mobility of care and related improvements. Our study results have the potential to inform transportation policy in the National Capital Region by assisting public transportation planners in improving system design and increasing access and ease of travel for care-related trips. As a result, D.C. could become an example of gender-related improvements to bus and rail service among other large transit systems.
Beyond its relevance for the Washington DC metro area, this study adds to the scholarship on the mobility of care in cities, and its methods apply to other urban environments, assuming the availability of data sources with similar characteristics. Research such as this quantifies the need and provides unambiguous evidence for developing gender-inclusive infrastructure in our urban environments. We cannot build sustainable cities without it.
Publicly available datasets were analyzed in this study. This data can be found at: https://www.mwcog.org/transportation/data-and-tools/household-travel-survey/.
Written informed consent was obtained from the individual(s) for the publication of any potentially identifiable images or data included in this article.
DP: Conceptualization, Data curation, Formal analysis, Investigation, Methodology, Resources, Visualization, Writing – original draft, Writing – review & editing. SO’H: Methodology, Writing – review & editing. ML-K: Writing – review & editing.
The author(s) declare that no financial support was received for the research, authorship, and/or publication of this article.
The authors would like to thank the Metropolitan Council of Governments National Capital Region Transportation Planning Board for providing the data that formed the basis of this research. Additionally, the authors thank Inés Sánchez De Madariaga and De-Graft Owusu-Manu for including this research in their International Women’s Day 2023 special edition of Frontiers Sustainable Cities and Adbullah Mamun for his excellent statistical support.
The authors declare that the research was conducted in the absence of any commercial or financial relationships that could be construed as a potential conflict of interest.
All claims expressed in this article are solely those of the authors and do not necessarily represent those of their affiliated organizations, or those of the publisher, the editors and the reviewers. Any product that may be evaluated in this article, or claim that may be made by its manufacturer, is not guaranteed or endorsed by the publisher.
1. ^The RTS contains only one question on race and ethnicity because respondents cannot select two or more races or ethnicities (i.e., both African American or Black AND Hispanic). As a result, we are unable to quantify who would select more than one option if presented with the opportunity.
AitBihiOuali, L., and Klingen, J. (2022). Inclusive roads in NYC: gender differences in responses to cycling infrastructure. Cities 127:103719. doi: 10.1016/j.cities.2022.103719
American Community Survey. (2020). US Census Bur. Available at: https://data.census.gov/cedsci/table?g=0400000US11_1400000US11001002701,11001002702_1600000US1150000&d=ACS%205-Year%20Estimates%20Data%20Profiles&tid=ACSDP5Y2018.DP02&hidePreview=false (Accessed September 28, 2020).
Annie E. Casey Foundation. (2023). Kids count data book: 2023 state trends in child well-being. Baltimore, MD. Available at: https://assets.aecf.org/m/resourcedoc/aecf-2023kidscountdatabook-2023.pdf
Battiston, A., Napoli, L., Bajardi, P., Panisson, A., Perotti, A., Szell, M., et al. (2023). Revealing the determinants of gender inequality in urban cycling with large-scale data. EPJ Data Sci. 12:9. doi: 10.1140/epjds/s13688-023-00385-7
Brody, C., Hoop, T. D., Vojtkova, M., Warnock, R., Dunbar, M., Murthy, P., et al. (2017). Can self-help group programs improve women’s empowerment? A systematic review. J. Dev. Eff. 9, 15–40. doi: 10.1080/19439342.2016.1206607
Cahill, R., Cuffe, S., Chau, R., Doody, L., McCartney, A., O’Halloran, O., et al. (2023). Travelling in a woman’s shoes. Dublin, Ireland: Transport Infrastructure Ireland.
Cantu, C. (2017). Defining infrastructure and its effect on economic growth. Equilibrio Econ. Rev. Econ. Polit. Soc. 13, 77–104.
Charmes, J. (2019). The unpaid care work and the labour market: an analysis of time use data based on the latest world compilation of time-use surveys. Geneva, Switzerland: International Labor Organization.
Clark, H. M. (2017). Who rides public transportation. Washington, DC: American Public Transportation Association.
Coffey, C., Espinoza Revollo, P., Harvey, R., Lawson, M., Parvez Butt, A., Piaget, K., et al. (2020). Time to care: unpaid and underpaid care work and the global inequality crisis. Nairobi, Kenya: Oxford Committee for Famine Relief.
Connors, K., Jaacks, L. M., Awasthi, A., Becker, K., Bezner Kerr, R., Fivian, E., et al. (2023). Women’s empowerment, production choices, and crop diversity in Burkina Faso, India, Malawi, and Tanzania: a secondary analysis of cross-sectional data. Lancet Planet. Health 7, e558–e569. doi: 10.1016/S2542-5196(23)00125-0
Council Office of Racial Equity and D.C. Policy Center, (2021). DC racial equity profile. Council Office of Racial Equity. Available at: https://www.dcracialequity.org/dc-racial-equity-profile. (Accessed April 20, 2022).
Criado-Perez, C. (2020). Invisible women: data bias in a world designed for men. New York, NY: Abrams.
Daminger, A. (2019). The cognitive dimension of household labor. Am. Sociol. Rev. 84, 609–633. doi: 10.1177/0003122419859007
DC Government, (1973). Washington Metropolitan Area Transit Authority compact, DC code. Washington, DC, USA: Council of the District of Columbia.
DC Health Matters, (2022). DC Health Matters—demographics. Available at: https://www.dchealthmatters.org/demographicdata. (Accessed February 20, 2022)
DDOT, (2023). Buses in the district. Available at: https://ddot.dc.gov/es/node/1494866. (Accessed May 11, 2023)
Elson, D. (2010). Gender and the global economic crisis in developing countries: a framework for analysis. Gend. Dev. 18, 201–212. doi: 10.1080/13552074.2010.491321
Elson, D. (2017). Recognize, reduce, and redistribute unpaid care work: how to close the gender gap. New Labor Forum 26, 52–61. doi: 10.1177/1095796017700135
European Institute for Gender Equality, (2024). Gender equality and urban mobility. Available at: https://eige.europa.eu/publications-resources/publications/gender-equality-and-urban-mobility?language_content_entity=en. (Accessed March 29, 2024)
Fair, R., (2019). U.S. Infrastructure: 1929–2017 Cowles Foundation Discussion Paper No. 2187. Available at SSRN: https://ssrn.com/abstract=3432670
Folbre, N. (2006). Measuring care: gender, empowerment, and the care economy. J. Hum. Dev. 7, 183–199. doi: 10.1080/14649880600768512
Foran, C., (2013). How to design a City for Women a fascinating experiment in “gender mainstreaming”. Available at: https://www.bloomberg.com/news/articles/2013-09-16/how-to-design-a-city-for-women. (Accessed October 23, 2022)
Gauvin, L., Tizzoni, M., Piaggesi, S., Young, A., Adler, N., Verhulst, S., et al. (2019). Gender gaps in urban mobility. Humanit. Soc. Sci. 7:11. doi: 10.1057/s41599-020-0500-x
George, C., and Kane, J. W.. (2021). Reversing America’s poor track record on inclusivity in infrastructure jobs. Brookings. Available at: https://www.brookings.edu/articles/reversing-americas-poor-track-record-on-inclusivity-in-infrastructure-jobs/. (Accessed November 25, 2023)
Goodman, A., and Cheshire, J. (2014). Inequalities in the London bicycle sharing system revisited: impacts of extending the scheme to poorer areas but then doubling prices. J. Transp. Geogr. 41, 272–279. doi: 10.1016/j.jtrangeo.2014.04.004
Hartmann, H. (1976). Capitalism, patriarchy, and job segregation by sex. Signs 1, 137–169. doi: 10.1086/493283
Holshue, M. L., DeBolt, C., Lindquist, S., Lofy, K. H., Wiesman, J., Bruce, H., et al. (2020). First case of 2019 novel coronavirus in the United States. N. Engl. J. Med. 382, 929–936. doi: 10.1056/NEJMoa2001191
Hu, L. (2021). Gender differences in commuting travel in the U.S.: interactive effects of race/ethnicity and household structure. Transportation 48, 909–929. doi: 10.1007/s11116-020-10085-0
Kalisa, E., Sudmant, A., Ruberambuga, R., and Bower, J. (2021). From car-free days to pollution-free cities: reflection on clean urban transport in Rwanda. London, England: International Growth Centre.
Klinenberg, E. (2018). Palaces for the people: how social infrastructure can help fight inequality, polarization, and the decline of civic life. New York: Crown.
Kurshitashvili, N., Humbert, A. L., and Ouali, L. A. B. (2024). Toward developing a mobility and gender index. Washington, D.C.: World Bank Group.
LA Metro, (2021). Women & Girls Governing Council LA Metro. Available at: https://www.metro.net/about/wggc/. (Accessed June 5, 2022)
Land Use in the District of Columbia (2024). Available at: https://doee.dc.gov/service/land-use. (Accessed January 31, 2024)
Latham, A., and Layton, J. (2019). Social infrastructure and the public life of cities: studying urban sociality and public spaces. Geogr. Compass 13:e12444. doi: 10.1111/gec3.12444
Lee, J., Vojnovic, I., and Grady, S. C. (2018). The ‘transportation disadvantaged’: urban form, gender and automobile versus non-automobile travel in the Detroit region. Urban Stud. 55, 2470–2498. doi: 10.1177/0042098017730521
Light, A. E., Benson-Greenwald, T. M., and Diekman, A. B. (2022). Gender representation cues labels of hard and soft sciences. J. Exp. Soc. Psychol. 98:104234. doi: 10.1016/j.jesp.2021.104234
Loukaitou-Sideris, A. (2016). A gendered view of mobility and transport: next steps and future directions. Town Plan. Rev. 87, 547–565. doi: 10.3828/tpr.2016.38
Lubitow, A., Carathers, J., Kelly, M., and Abelson, M. (2017). Transmobilities: mobility, harassment, and violence experienced by transgender and gender nonconforming public transit riders in Portland, Oregon. Gend. Place Cult. 24, 1398–1418. doi: 10.1080/0966369X.2017.1382451
Maryland Department of Transportation, (2024) Purple line. MDOT MTA purple line. Available at: https://www.purplelinemd.com/. (Accessed January 26, 2024)
McBride, J., and Siripurapu, A., (2021). The state of U.S. infrastructure. New York, NY, USA: Council on Foreign Relations.
Metropolitan Washington Council of Governments, (2019). Metropolitan Washington Council of Governments Regional Travel Survey Final Report. Available at: https://www.mwcog.org/file.aspx?D=DA%2FCfxpCXcJUhRkUrI3DPynn%2FZ8uLxVCAfst11g%2BC%2BE%3D&A=PHGXjIkym4vXMnWDx5ahtpNpaS%2Bv1aZ07pglynHOpTo%3D. (Accessed January 11, 2024)
Murillo-Munar, J., Gómez-Varo, I., and Marquet, O. (2023). Caregivers on the move: gender and socioeconomic status in the care mobility in Bogotá. Transp. Res. Interdiscip. Perspect. 21:100884. doi: 10.1016/j.trip.2023.100884
Nederveen, A. A. J., Sarkar, S., Molenkamp, L., and Van De Heijden, R. E. C. M. (1999). Importance of public involvement: a look at car-free city policy in the Netherlands. Transp. Res. Rec. 1685, 128–134. doi: 10.3141/1685-17
Nelson, J. A. (1995). Feminism and economics. J. Econ. Perspect. 9, 131–148. doi: 10.1257/jep.9.2.131
O’Hara, S. (2014). “Everything needs care” in Counting on Marilyn waring: new advances in feminist economics (Thousand Oaks, California, USA: Sage Journals).
OECD (2021). Women in infrastructure: selected stocktaking of good practices for inclusion of women in infrastructure. Paris: OECD.
Oxford University Press (2010). Oxford dictionary of English. 3rd Edn. Oxford, England: Oxford University Press.
Passman, D., O’Hara, S., and Plummer, Y. (2024). Understanding the role of public transportation in supporting the care economy in Washington, DC, USA. Sustainability 16:1288. doi: 10.3390/su16031288
Portillo, E. (2021). Overcoming the “stigma” of riding the bus. UNC Charlotte Urban Institute. Available at: https://ui.charlotte.edu/story/overcoming-stigma-riding-bus. (Accessed April 8, 2024)
Power, K. (2020). The COVID-19 pandemic has increased the care burden of women and families. Sustain.: Sci. Pract. Policy 16, 67–73. doi: 10.1080/15487733.2020.1776561
Ravensbergen, L., Fournier, J., and El-Geneidy, A. (2023). Exploratory analysis of mobility of Care in Montreal, Canada. Transp. Res. Rec. 2677, 1499–1509. doi: 10.1177/03611981221105070
Rost, L., Parkes, A., and Azevedo, A. (2020). Measuring and understanding unpaid care and domestic work: household care survey toolkit. Nairobi, Kenya: Oxford Committee for Famine Relief.
Sánchez de Madariaga, I. (2013). From women in transport to gender in transport: challenging conceptual frameworks for improved policymaking. J. Int. Aff. 67, 43–65.
Sánchez de Madariaga, I., and Roberts, M. (Eds.) (2016). Fair shared cities: the impact of gender planning in Europe. London: Routledge.
Sánchez de Madariaga, I., and Zucchini, E. (2019). “Measuring mobilities of care, a challenge for transport agendas” in Integrating gender into transport planning. eds. C. L. Scholten and T. Joelsson (Cham: Springer International Publishing).
Sarrasanti, N., Donkor, F. K., Santos, C., Tsagkari, M., and Wannous, C. (2020). Its about time we care about an equitable world: women’s unpaid care work and covid-19. IEEE Eng. Manag. Rev. 48, 37–45. doi: 10.1109/EMR.2020.3031313
Semega, J. (2019). Pay is up. Poverty is down: how women are making strides. Available at: https://www.census.gov/library/stories/2019/09/payday-poverty-and-women.html. (Accessed December 14, 2022)
Shuman, D., (2023). Inferring mobility of care travel behavior from transit origin-destination data. arXiv. Available at: https://doi.org/10.48550/arXiv.2211.04915. [Epub of ahead preprint]
Siemiatycki, M., Enright, T., and Valverde, M. (2020). The gendered production of infrastructure. Prog. Hum. Geogr. 44, 297–314. doi: 10.1177/0309132519828458
The White House, (2021a). The American Jobs Plan (fact sheet) Brief Room. Available at: https://www.whitehouse.gov/briefing-room/statements-releases/2021/03/31/fact-sheet-the-american-jobs-plan/. (Accessed May 12, 2021)
The White House, (2021b). Updated fact sheet: Bipartisan infrastructure investment and jobs act. White House. Available at: https://www.whitehouse.gov/briefing-room/statements-releases/2021/08/02/updated-fact-sheet-bipartisan-infrastructure-investment-and-jobs-act/. (Accessed October 23, 2022)
Torres, A., Sarmiento, O. L., Stauber, C., and Zarama, R. (2013). The Ciclovia and Cicloruta programs: promising interventions to promote physical activity and social capital in Bogotá, Colombia. Am. J. Public Health 103, e23–e30. doi: 10.2105/AJPH.2012.301142
U.S. Bureau of Labor Statistics, (2023). American time use survey—2022 results (Survey results No. USDL-23-1364). Washington, DC: U.S. Bureau of Labor Statistics.
U.S. Department of Health and Human Services (2024). Federal poverty level (FPL). Available at: https://www.healthcare.gov/glossary/federal-poverty-level-fpl. (Accessed January 29, 2024)
U.S. Department of Transportation (2022). National household travel survey. Federal Highway Administration. Available at: https://nhts.ornl.gov/. (Accessed January 11, 2024)
UN Women, (2022). Unpaid care work: your load and why it matters. Available at: https://interactive.unwomen.org/multimedia/explainer/unpaidcare/index.html. (Accessed November 19, 2022).
UNOPS, (2020). Infrastructure for gender equality and the empowerment of women. Copenhagen, Denmark: United Nations Office for Project Services.
US Census Bureau, (2023a). American time use survey summary—2022 results. Available at: https://www.bls.gov/news.release/atus.nr0.htm. (Accessed January 29, 2024).
US Census Bureau, (2023b). American community survey 5-year data (2009–2022). Available at: https://www.census.gov/data/developers/data-sets/acs-5year.html. (Accessed January 29, 2024)
US Census Bureau (2024). U.S. Census Bureau QuickFacts: District of Columbia; United States. Available at: https://www.census.gov/quickfacts/fact/table/DC,US/PST045223. (Accessed January 29, 2024)
US News, (2022). These countries have the most well-developed infrastructure. U.S. News & World Report Available at: https://www.usnews.com/news/best-countries/rankings/well-developed-infrastructure. (Accessed November 20, 2022)
Villafuerte-Diaz, J., Victoriano-Habit, R., Soliz, A., and El-Geneidy, A. (2023). Who does light rail serve? Examining gendered mobilities and light-rail transit in Montreal, Canada. Transp. Res. Rec. 2677, 104–115. doi: 10.1177/03611981231158318
Wang, K., and Akar, G. (2019). Gender gap generators for bike share ridership: evidence from Citi Bike system in New York City. J. Transp. Geogr. 76, 1–9. doi: 10.1016/j.jtrangeo.2019.02.003
Wanmali, S., and Islam, Y. (1997). Rural infrastructure and agricultural development in southern Africa: a Centre-periphery perspective. Geogr. J. 163:259. doi: 10.2307/3059722
Weintrob, A., Hansell, L., Zebracki, M., Barnard, Y., and Lucas, K. (2021). Queer mobilities: critical LGBTQ perspectives of public transport spaces. Mobilities 16, 775–791. doi: 10.1080/17450101.2021.1958249
WMATA, (2009). Washington Metropolitan Area Transit Authority (WMATA) compact. Washington, DC, USA: Washington Metropolitan Area Transit Authority.
WMATA, (2020). Framework for transit equity: customer outreach, communications and engagement (No. Information Item IV-B). Washington, DC, USA: Washington Metropolitan Area Transit Authority.
WMATA, (2021a). Metrobus Fleet Management Plan. Washington, DC, USA: Washington Metropolitan Area Transit Authority.
WMATA, (2021b). Metrorail Fleet Management Plan. Washington, DC, USA: Washington Metropolitan Area Transit Authority.
WMATA, (2022). Equity in transit. URL https://www.wmata.com/initiatives/equity-in-transit.cfm. (Accessed March 28, 2022).
WMATA, (2023a). Metro now welcomes open strollers on Metrobus. Washington, DC, USA: Washington Metropolitan Area Transit Authority. Available at: https://www.wmata.com/about/news/Open-Stroller-Policy.cfm. (Accessed March 7, 2023).
WMATA, (2023b). The Washington Metropolitan Area Transit Authority’s (Metro) Performance Report—FY23. Washington, DC, USA: Washington Metropolitan Area Transit Authority.
World Bank, (2023). World Bank open data. Available at: https://data.worldbank.org/. (Accessed December 1, 2023).
Keywords: mobility of care, caregiving, gender, women, public transportation, public transit
Citation: Passman D, O’Hara S and Levin-Keitel M (2024) For whom the wheels roll: examining the mobility of care in Washington, DC, USA. Front. Sustain. Cities. 6:1379958. doi: 10.3389/frsc.2024.1379958
Edited by:
Inés Novella Abril, Universitat Politècnica de València, SpainReviewed by:
Michał Czepkiewicz, University of Iceland, IcelandCopyright © 2024 Passman, O’Hara and Levin-Keitel. This is an open-access article distributed under the terms of the Creative Commons Attribution License (CC BY). The use, distribution or reproduction in other forums is permitted, provided the original author(s) and the copyright owner(s) are credited and that the original publication in this journal is cited, in accordance with accepted academic practice. No use, distribution or reproduction is permitted which does not comply with these terms.
*Correspondence: Dina Passman, ZGluYS5wYXNzbWFuQHVkYy5lZHU=
†ORCID: Meike Levin-Keitel, https://orcid.org/0000-0001-7943-4458
Disclaimer: All claims expressed in this article are solely those of the authors and do not necessarily represent those of their affiliated organizations, or those of the publisher, the editors and the reviewers. Any product that may be evaluated in this article or claim that may be made by its manufacturer is not guaranteed or endorsed by the publisher.
Research integrity at Frontiers
Learn more about the work of our research integrity team to safeguard the quality of each article we publish.