 Najmeh Satari1
 Malihe Erfani
 Fatemeh Jahanishakib
94% of researchers rate our articles as excellent or good
Learn more about the work of our research integrity team to safeguard the quality of each article we publish.
Find out more
ORIGINAL RESEARCH article
Front. Sustain. Cities, 26 April 2024
Sec. Cities in the Global South
Volume 6 - 2024 | https://doi.org/10.3389/frsc.2024.1357350
Introduction: Rapid uncontrolled growth of build-up areas has increasingly challenged the sustainable use of urban area simulating the growth patterns of fastest-growing cities is more necessary in dry climates, due to low ecological suitability for urban development and meeting the needs of citizens. Therefore, this research conducted aiming at predicting the expansion of urban land use in Zahedan City, Iran, which has a dry climate with an evenness landscape.
Methods: Urban Expansion in Zahedan Modeled using SLEUTH (slope, land use, exclusion, urban extent, transportation and hillshade) in two historical and environmental scenarios until 2050. The input data were extracted from processing on DEM and remote sensing data and the SLEUTH model was calibrated in four stages from 1990 to 2020.
Results and discussion: The results showed that the increase in Ahead extent in 2050 is more than twice as much as in 2020, and this increase was associated with a less dispersion of urban patches in the environmental scenario compared to the historical scenario. Also, the results clarified that the developable spaces are saturated in terms of slope in the east and there is the lack of urban green spaces. These results reveal the need for the attention of city managers in predicting the urban green space in the expected growth areas and compensating for the lack of vegetation cover in the former urban areas. Geographic extension of predicted urban land can be used in future environmental planning and urban developing strategies, as well as it is suggested to adopt this approach as a plan for urban planning in dry climates.
Changes in land cover and human-induced land use changes are the primary drivers of global environmental changes. Over the past two decades, the extent and impacts of human activities on earth have reached unprecedented levels, leading to intensified changes (Mallouk et al., 2019). Urbanization has become a widespread phenomenon in most countries around the world (Nadoushan, 2022). In 1970, 36.6% of the global population lived in urban areas, but today more than half of the world’s population resides in cities (Pathirana et al., 2014). It is predicted by 2050, the urban population will exceed 60% (Zhou et al., 2019), with Asia and Africa experiencing 90% of the increase in urbanization (UN, 2018). As the population increases, the demand for residential areas increases, leading to a distinct pattern of land use (Kuo and Tsou, 2017). This rapid urbanization is driven by various factors such as social and economic, political, technological, geographical, and global and local cultural factors (Kawiani et al., 2018). However, these factors also contribute to negative outcomes, including uneven urban growth, urban heat islands, increased energy consumption, air pollution, public health concerns, deforestation, biodiversity loss, and the encroachment on agricultural lands (Wang et al., 2012; Nadoushan, 2022). Effective land management becomes crucial in addressing the challenges posed by the expansion of cities and urbanization (Hoseini et al., 2016).
Managers and planners require a tool to anticipate the rate and scale of future urban growth in order to mitigate issues arising from rapid population growth (Soufi et al., 2018). Smart growth and simulation of urban development have emerged as prudent approaches in sustainable land use planning, aiming to address problems caused by inadequate planning, such as ecological destruction and pollution (Inouye et al., 2015). This approach serves as an effective tool to mitigate the ecological impacts resulting from urban expansion (Yu et al., 2019). Also enhancing our understanding of the processes and patterns of urban growth shaped by human-environment interactions (Yang et al., 2020). In recent years, with rapid advances in remote sensing (RS) and geographical information system (GIS) techniques, dynamic modeling has gained popularity as a primary research field in geographic information science science. This tool is widely used by geographers and urban planners for urban and landscape simulation (Triantakonstantis and Mountrakis, 2012; Mustak et al., 2022). To predict urban expansion, it is essential to have historical and current urban area data. This data can be acquired through the classification of satellite images using remote sensing techniques. Supervised pixel-based classifiers are the most commonly used methods for this type of classification. These methods include traditional approaches like Fisher’s linear discriminant analysis (LDA) and logistic regression (Hastie et al., 2009), as well as modern machine learning methods such as support vector machines (SVM) (Thamaga et al., 2022). The distinction between barren and built-up areas is one of the most important issues in arid and semi-arid climates. The efficiency of Local Climate Zoning (LCZ) algorithm, which utilizes microclimate changes to demonstrate the impact on urban areas and their adjacent regions, has been previously demonstrated (Satari et al., 2023).
The Geomod, SLEUTH, Land Use Scanner, Environment Explorer, Logistic Regression, SAMBA, LTM, CLUE-S, CLUE and markov chain model are some of the most popular peer-reviewed land change models (Pontius et al., 2008; Bose and Chowdhury, 2020; Salem et al., 2021). Among all the dynamic models, those based on cellular automata (CA) like SLEUTH model are probably the most impressive in terms of their technological evolution in relation to urban programs. Moreover, SLEUTH model is also considered a powerful tool for describing urban growth and density and spatial dynamics. In this model, using the Brute Force method, five growth coefficients can be got based on various methods, such as OSM index (Dietzel and Clarke, 2007; Li et al., 2018; Saeidi et al., 2018; Kumar and Agrawal, 2023), Lee-Salee index (Jahanishakib and Erfani, 2021) or other indices (Rafiee et al., 2009a,b).
The first simulation of urban growth in the United States of America was done by Clarke et al. (1997), and then it quickly attracted the attention of researchers in the United States of America (Clarke and Gaydos, 1998; Yang and Lo, 2003; Xian and Crane, 2005). In 2002, it was first done in Europe and Portugal by Silva and Clarke (2002, 2005). Aside from the United States, SLEUTH has the largest number of applications in China’s fast-growing cities (Huang et al., 2008; Liu et al., 2019). In Iran, with the intensification of the expansion of densely populated urban areas, the use of this model has started in the last two decades (Mahini and Gholamalifard, 2007; Khammar and Heydari, 2016; Rasouli, 2016; Jahanishakib and Erfani, 2021). The studies conducted with this model show the increase of the urban land use area and the conversion of surrounding land uses, especially agriculture and forest, into build-up lands (Bihamta et al., 2015; Rasouli, 2016; Bose and Chowdhury, 2020; Salem et al., 2021). Likewise, the conversion of the rural landscape into an urban one is predicted by Dadashpoor and Salarian (2020). The most important factors in the city’s expansion are mainly the effects of the slope (Bihamta et al., 2015; Khammar and Heydari, 2016), the main roads (Esfandeh et al., 2021; Salem et al., 2021), and the value of marginal lands (Hoseini et al., 2016; Khammar and Heydari, 2016). Therefore, cities in Iran are characterized by edge expansion and linear growth due to these factors (Bihamta et al., 2015; Esfandeh et al., 2021).
In SLEUTH modeling, the ability to define various urban growth scenarios is crucial. Scenarios allow us to make more precise predictions about land use changes by considering different economic, social, cultural, environmental conditions. These prediction results help create appropriate strategies for managing urban growth and effective planning for sustainable urban development (Jahanishakib and Erfani, 2021). Researchers like Sakieh et al. (2015) predicted two compact and extensive growth scenarios by changing the growth coefficients, and Bihamta et al. (2015) and Du (2016) considered historical growth and compact growth scenarios. Shi et al. (2017) investigated natural growth and growth with ecological priority scenarios. Liu et al. (2019) simulated three scenarios of historical growth, urban planning growth, and land suitability growth. Bajracharya et al. (2020) simulated two historical and developmental scenarios. Saeidi et al. (2018) also defined three scenarios for urban growth by changing the five growth coefficients in the SLEUTH model. Nadoushan (2022) also predicted urban growth in two scenarios according to historical growth and growth without changing agricultural to urban land use. Li et al. (2018) also defined a new scenario for urban growth by applying habitat quality so that valuable habitat areas do not change into urban uses.
Another noteworthy point is the applicability of the model besides metropolises (Bihamta et al., 2015; Sakieh et al., 2015; Du, 2016) for small cities (Saeidi et al., 2018; Ghamari et al., 2019) and even new cities (Khammar and Heydari, 2016), but with a strong expansion. However, in any case, this expansion is more intense in big cities (Jawarneh et al., 2015; Guan et al., 2020). The review of studies also revealed another point, and that is the studied area, which can include a city and its surroundings [such as the study of Jahanishakib and Erfani (2021)] to a province that includes different urban and rural areas (Dadashpoor et al., 2019; Clarke and Johnson, 2020; Guan et al., 2020). It is worth noting that Zhou et al. (2019) used the SLEUTH model for the urban growth of the entire world. Therefore, the application of the SLEUTH model is widely important for urban to global management, in which the pixel size varies from 30 meters in most studies (Bihamta et al., 2015; Sakieh et al., 2015; Du, 2016; Saeidi et al., 2018; Jahanishakib and Erfani, 2021; Kumar and Agrawal, 2023) to one kilometre (30 arc-seconds) on a global scale.
In developing countries, rural–urban migration and the growth of the service sector in cities have led to rapid urbanization. However, this development often lacks proper balance and coordination with the existing infrastructure. As a result, newly developed areas may not align well with the existing physical structure of the city (Hajibabaei and Zakerhaghighi, 2017). Therefore, accurate predictions of urban expansion are crucial for managing urbanization and understanding the dynamics of growth. However, studies on urban development in dry climates with even landscapes, lacking water resources, and a lack of proximity to agricultural areas are limited. These regions face challenges such as insufficient vegetation cover, rapid population growth, and the expansion of urban areas. More research is needed to address urban growth in these dry climate conditions. The main aim of the study is to implement the research process in Zahedan, Iran, which has a dry climate (Fathi Taperasht et al., 2022). The city of Zahedan is the largest city in the southeast of Iran, which has faced a strong expansion and increase in marginalization in the last three decades and has an unfavorable environmental conditions (Shahnavashi et al., 2021). This study attempts to predict the urban growth of Zahedan by the year 2050 and analyses the anticipated consequences and problems of regional design that are expected to worsen in the future. Two scenarios of historical and environmental development were considered for this purpose.
Zahedan has an area of 31,250 square kilometers, equivalent to 17% of the area of Sistan and Baluchestan Province. Zahedan, the capital of Sistan and Baluchestan Province, is located in the southeast of Iran and is in the south of the Sistan plain. The height of this city is 1,378 meters above sea level. The city of Zahedan is located at 60° 51′ 46.44″ E longitude and 29° 29′ 46.68” N Latitude (Figure 1). In terms of location, this region is limited to Nimrooz and Hamoon cities from the north, Lut desert and Kerman province from the west, Pakistan and Afghanistan from the east, Iranshahr and Khash cities from the south, and Mirjaveh city from the southeast (Satari et al., 2024). The geographical location of Zahedan city and its political-administrative centrality have given rise to the significant growth and development of the city in a short period. In fact, the city of Zahedan, as the major market of the province, performs many times beyond the borders of the province and even the country. On the other hand, Zahedan’s three-way location in terms of airlines, land roads, and railways is the reason for its importance of geographical location. Because of its proximity to dry and desert areas and being affected by them, Zahedan city has a hot and dry climate and has low relative humidity. The temperature data shows that in this region, the monthly and annual temperature values do not change significantly from year to year. The average annual maximum temperature is 42.5 degrees Celsius and the average minimum temperature is-11.6 degrees Celsius. The average annual rainfall is 72 mm (The I.R. of Iran Meteorological Organization, 2022), and according to the latest census, the population of Zahedan city was 672,589 until 2016 (The Iran Social Science Data Portal, 2024).
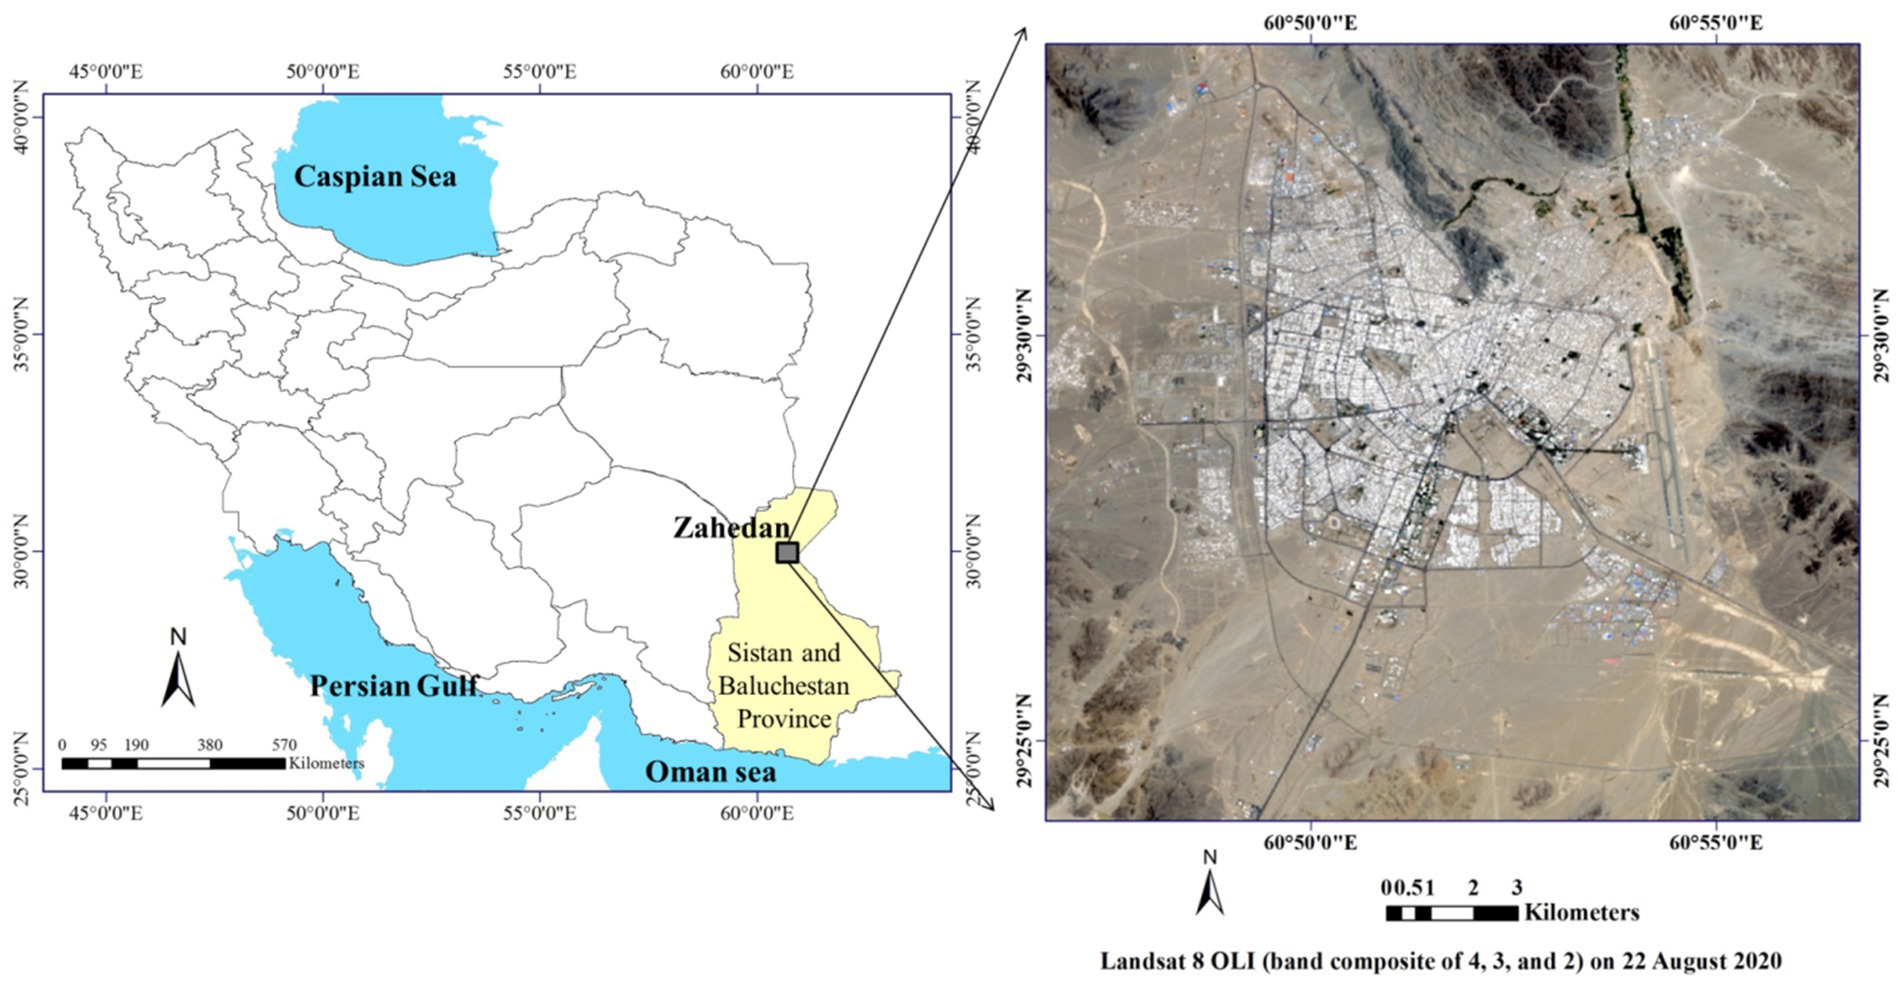
Figure 1. Location of Zahedan in Sistan and Baluchestan Province and Iran.
In this research, the SLEUTH model was used to analyze the physical expansion pattern of Zahedan during the years 2020 to 2050. This model employed widely accepted cellular automata, which are commonly used (Bose and Chowdhury, 2020).
To model urban growth, we prepared a slope layer, an exclusion layer, a hillshade, and four layers of the city, as well as four layers of the transportation network corresponding to four years within the ten-year time span from 1990 to 2020, all at a 30-meter resolution. All of these layers play a role in determining SLEUTH model behavior except the hillshade, that is used only for visualization purposes (Dietzel and Clarke, 2007). The slope layer is used to determine the slope-resistance weighting in the model (Clarke and Gaydos, 1998). The exclusion layer is used to place constraints on urban growth that provides an opportunity to define different urban growth scenarios. Critical data in this model are urban extent layers that act as control points for model calibration and determination of goodness of fit. Historical maps of the transportation network serve as a catalyst for the expansion of urban areas (Dietzel and Clarke, 2007). The digital elevation model (DEM) of the studied area was downloaded from the USGS site (DEM SRTM), and then the slope map and hillshade were prepared from the DEM using TerrSet software. The classification of Landsat images (Collection 2 and Level 1[m1]) was used to prepare maps of urban areas for the years 1990, 2000, 2010, and 2020 (Table 1). All the images were associated with the peak of the growing season and had the minimum percentage of dust and clouds. These images were downloaded from the USGS Earth Explorer site and were related to path and row of 157 and 40. The LCZ classification of images was conducted using SAGA GIS software (Bechtel et al., 2015) with training samples extracted from historical data in Google Earth. The method includes 17 classes, which are as follows: (1) compact high-rise, (2) compact midrise, (3) compact low-rise, (4) open high-rise, (5) open midrise, (6) open low-rise, (7) lightweight low-rise, (8) large low-rise, (9) sparsely built, (10) heavy industry, (11) dense trees, (12) scattered trees, (13) bush and scrub, (14) low plants, (15) bare rock or paved, (16) bare soil or sand, and (17) water. There are no classes 1, 4, 12, 13, 15, and 17 in the study area that was included in the classified maps. These maps were converted into binary layers, distinguishing between urban areas (including classes 2, 3, 5, 6, 7, 8, 9, and 10) and non-urban areas (all other classes). The Landsat satellite was also used as the fifth time point in 2023 to validate the simulation results (Table 1).
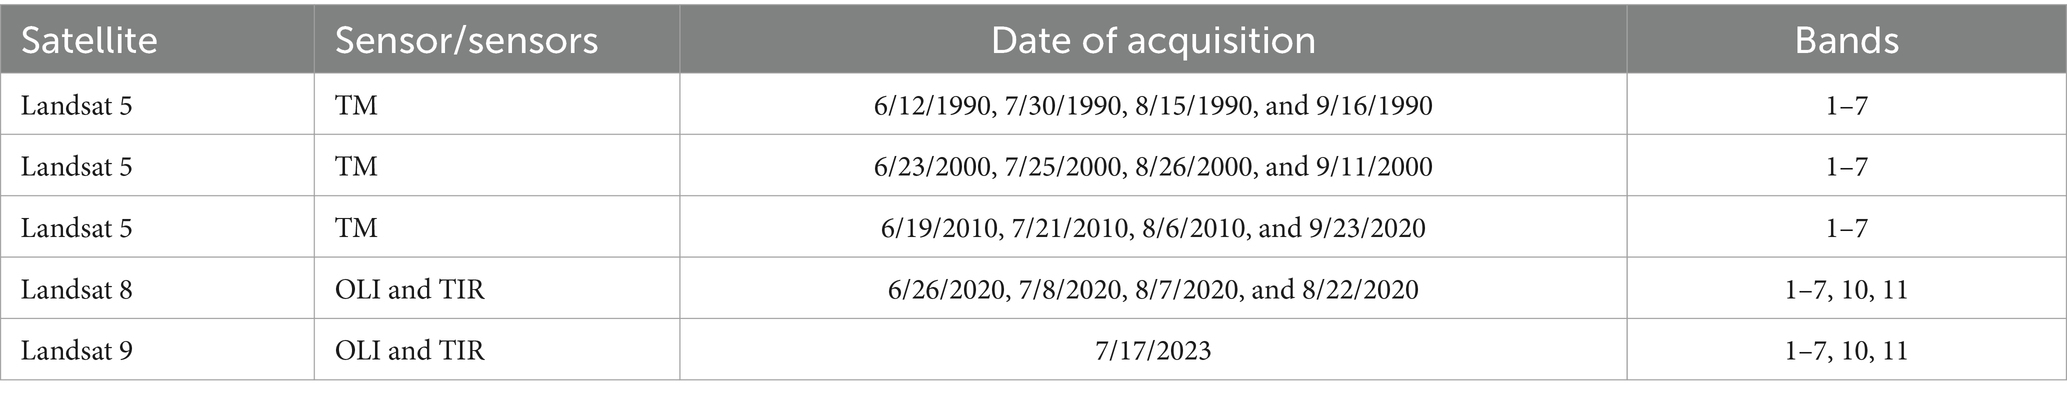
Table 1. Characteristics of used Landsat satellite data.
Accuracy assessment of classified images was evaluated using the producer’s accuracy, user’s accuracy, overall accuracy, and kappa coefficient. For this purpose, 218 random points were used to validate the classification results against Google Earth, which served as the reference map.
The transport layers for the years 2000, 2010, and 2020 were created by visually interpreting Google Earth’s historical images. The 1990 Transport Layer was developed using on-screen digitization of the 1990 Landsat satellite. The accuracy of these data was also ensured by backward and forward checking of the road layers of four years. The exclusion layer for the two scenarios of historical and environmental growth is different, as for the historical growth of the road, airport, and its buffer. For environmental growth, besides the road, airport, and its buffer, slopes above 30% and vegetation cover are also considered that prepared using TerrSet software. The reasons that the slopes above 30% were considered in exclusion layer of environmental scenario are as follows: In order to facilitate development, greater excavation and embankment are required, leading to increased manipulation of land. This, in turn, results in higher costs due to the need for ground leveling and the utilization of more intricate structures to ensure building stability. The occurrence of urban development within these areas heightens the vulnerability of slopes to landslides triggered by rainfall. In the city of Zahedan, the optimal land cover for areas with significant sloping is the implementation of green spaces. This is primarily due to the presence of vast expanses with low slope in the western part of the city for urban expansion, coupled with a scarcity of green spaces within the urban.
The SLEUTH model is based on cellular automata and is open source and comprises two connected CA models: Urban Growth Model (UGM) and land use change model called DLM. According to the purpose of the research in this study, the UGM model was used. SLEUTH stands for the input layers of the model, which includes the slope layer, land use, areas excluded from development, urban areas, transportation networks, and the hillshade layer. Model calibration plays a crucial role in achieving accuracy in simulation models, such as the SLEUTH model (Ayazli, 2020). Using historical maps, this model changes five effective coefficients, including dispersion, breed, spread, slope, road gravity, in the process of city development in the calibration stage and shows the effect of each factor as a coefficient between zero and one hundred. The transfer rules are determined under the influence of these coefficients during different calibration steps and used for the simulation step (Saxena and Jat, 2019).
To put it another way, according to SLEUTH, the urban areas act as though they are living organisms, instructed by transition rules that affect the state of changes inside the CA as a collection of nested loops. In the concept, there is a meta level of development regulations known as “self-modification” regulations that aid in preventing linear and exponential urban expansion (Silva and Clarke, 2002).
Diffusive growth, new spreading center, organic growth, and road-influenced development are the four growth patterns that affect a cell’s likelihood of being urbanized (Clarke and Gaydos, 1998). Urbanization on appropriate sloped ground away from already developed urban centers is known as spontaneous growth. When emerging urban areas convert the surrounding land from various uses to urban land cover, this is known as diffuse growth. At the periphery of urban regions and in places that may not have completely transitioned from another land use to urban, organic development occurs. Additionally, as transportation network draw on recent growth, it is important to consider how they affect urbanization and changes in land use through road influenced growth (Dietzel and Clarke, 2006). The modeling stages are described following and Figure 2 shows the flowchart of the modeling process.
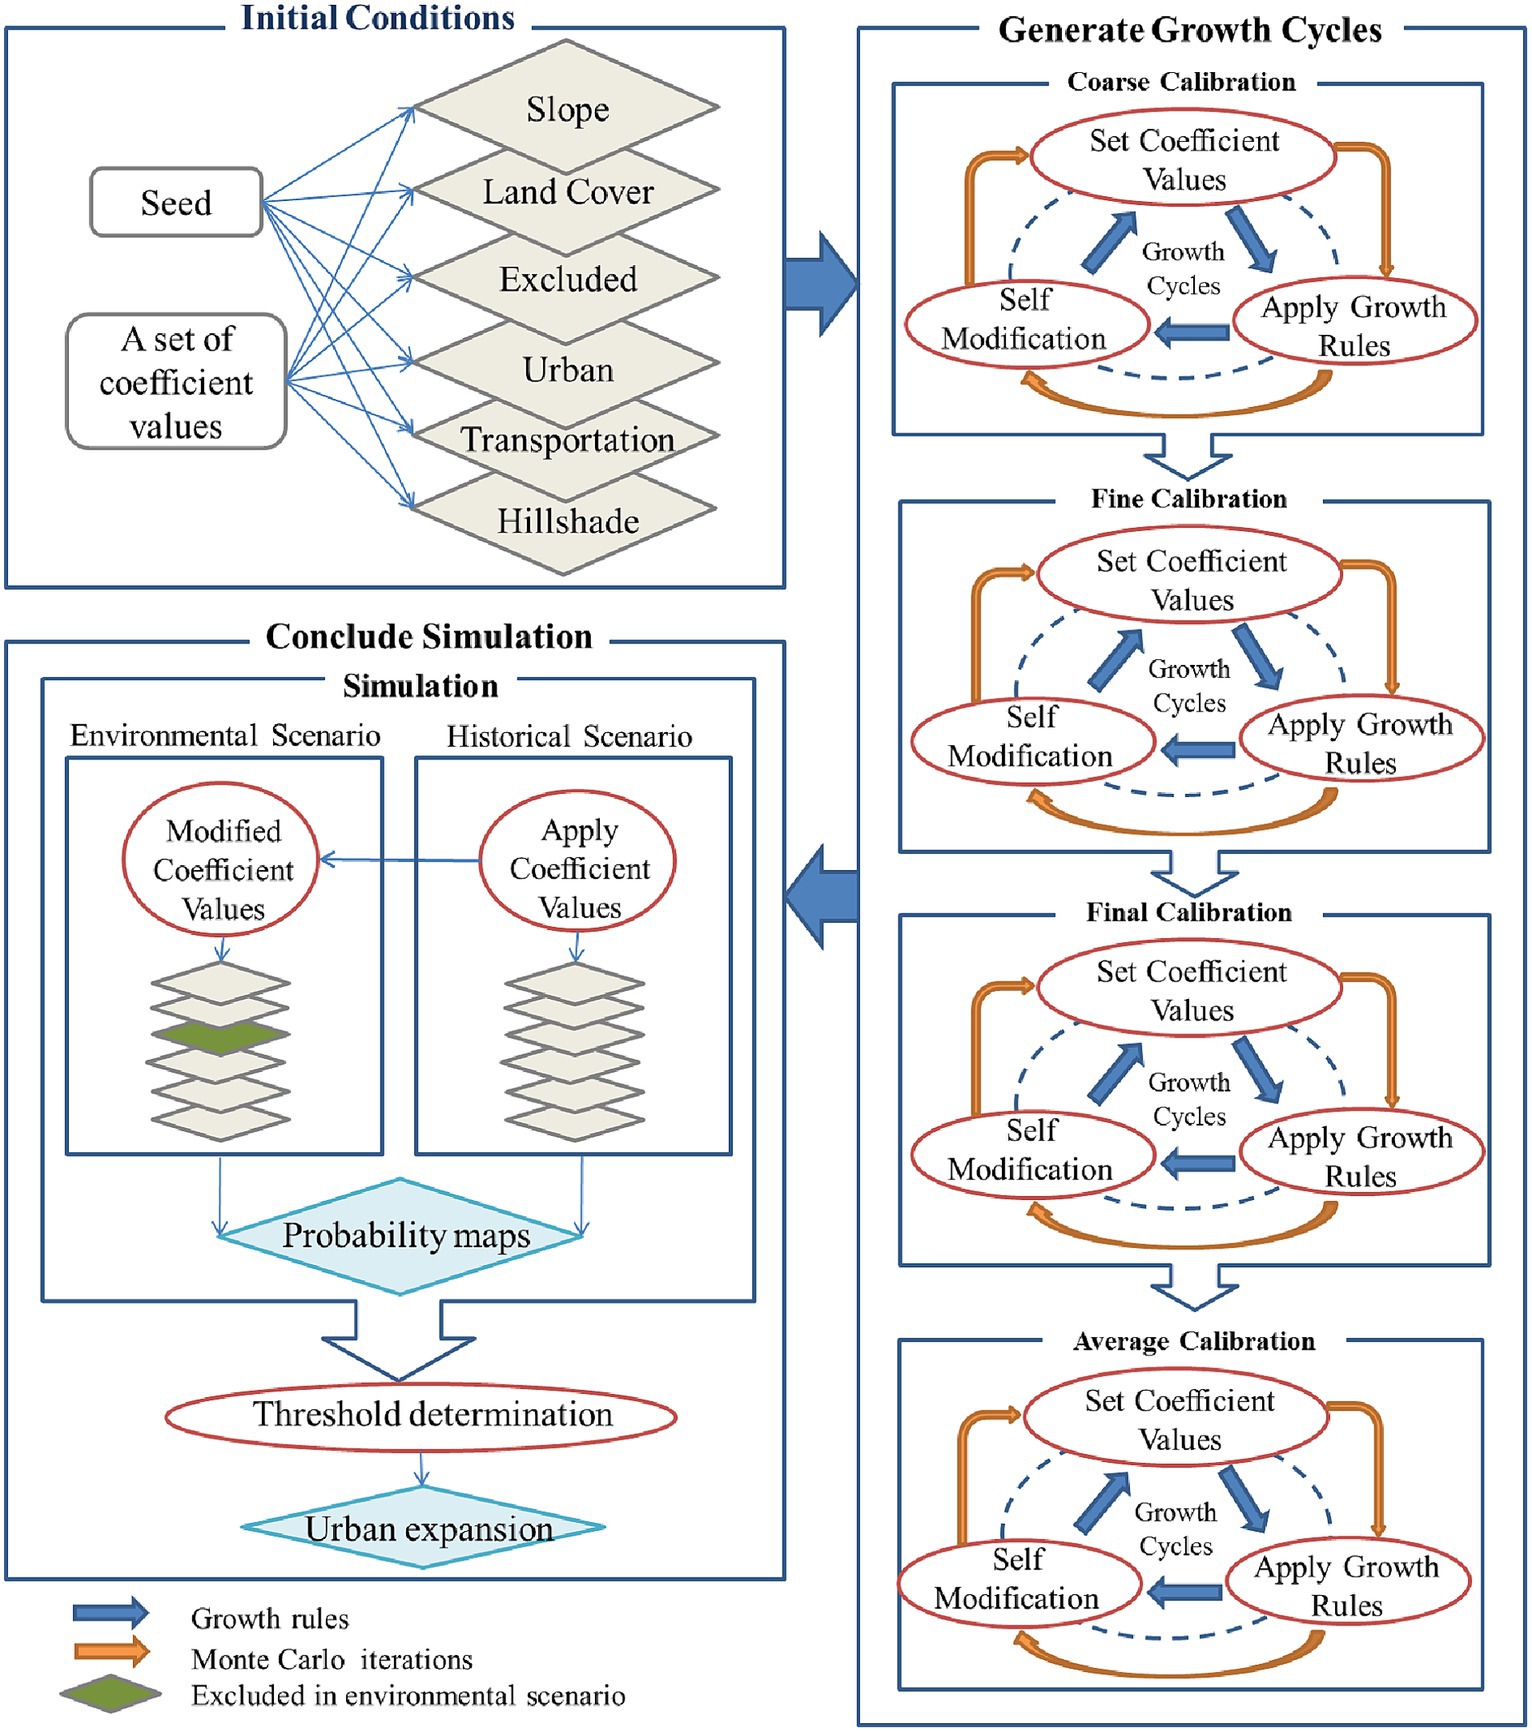
Figure 2. The SLEUTH model’s structural phases and processes [adapted and modified from Chaudhuri and Clarke (2013)].
The SLEUTH model was retrieved from the website http://www.ncgia.ucsb.edu/projects, the Project Gigalapolis section (Chaudhuri and Clarke, 2013). Operating systems based on UNIX or UNIX-like execute the model. Therefore, this model was implemented by installing Cygwin64 Terminal, which is UNIX emulator software on Windows.
After the introduction of the input layers for modeling, to perform coarse calibration, the initial five growth coefficients were considered with 25 steps in the range of 0 to 100. Urban sprawl modeling begins with a “seed” urban file with the oldest urban year, and at least two roadmaps that interact with a slope layer to allow the generation of new nuclei for outward growth (Figure 2).
The “Generate Growth Cycles” calibration process in Figure 2 employs a brute force calibration technique that gradually reduces the range of SLEUTH behavior parameter values (five growth coefficients) throughout the calibration process until it leaves the set that most closely matches the historical data (Silva and Clarke, 2002). In this section of Figure 2, the outer loop runs Monte Carlo iterations while the inner loop runs the growth rules.
As mentioned, the SLEUTH model is based on CA. Table 2 briefly shows the equations used in the steps of CA implementation (Benchelha et al., 2022).
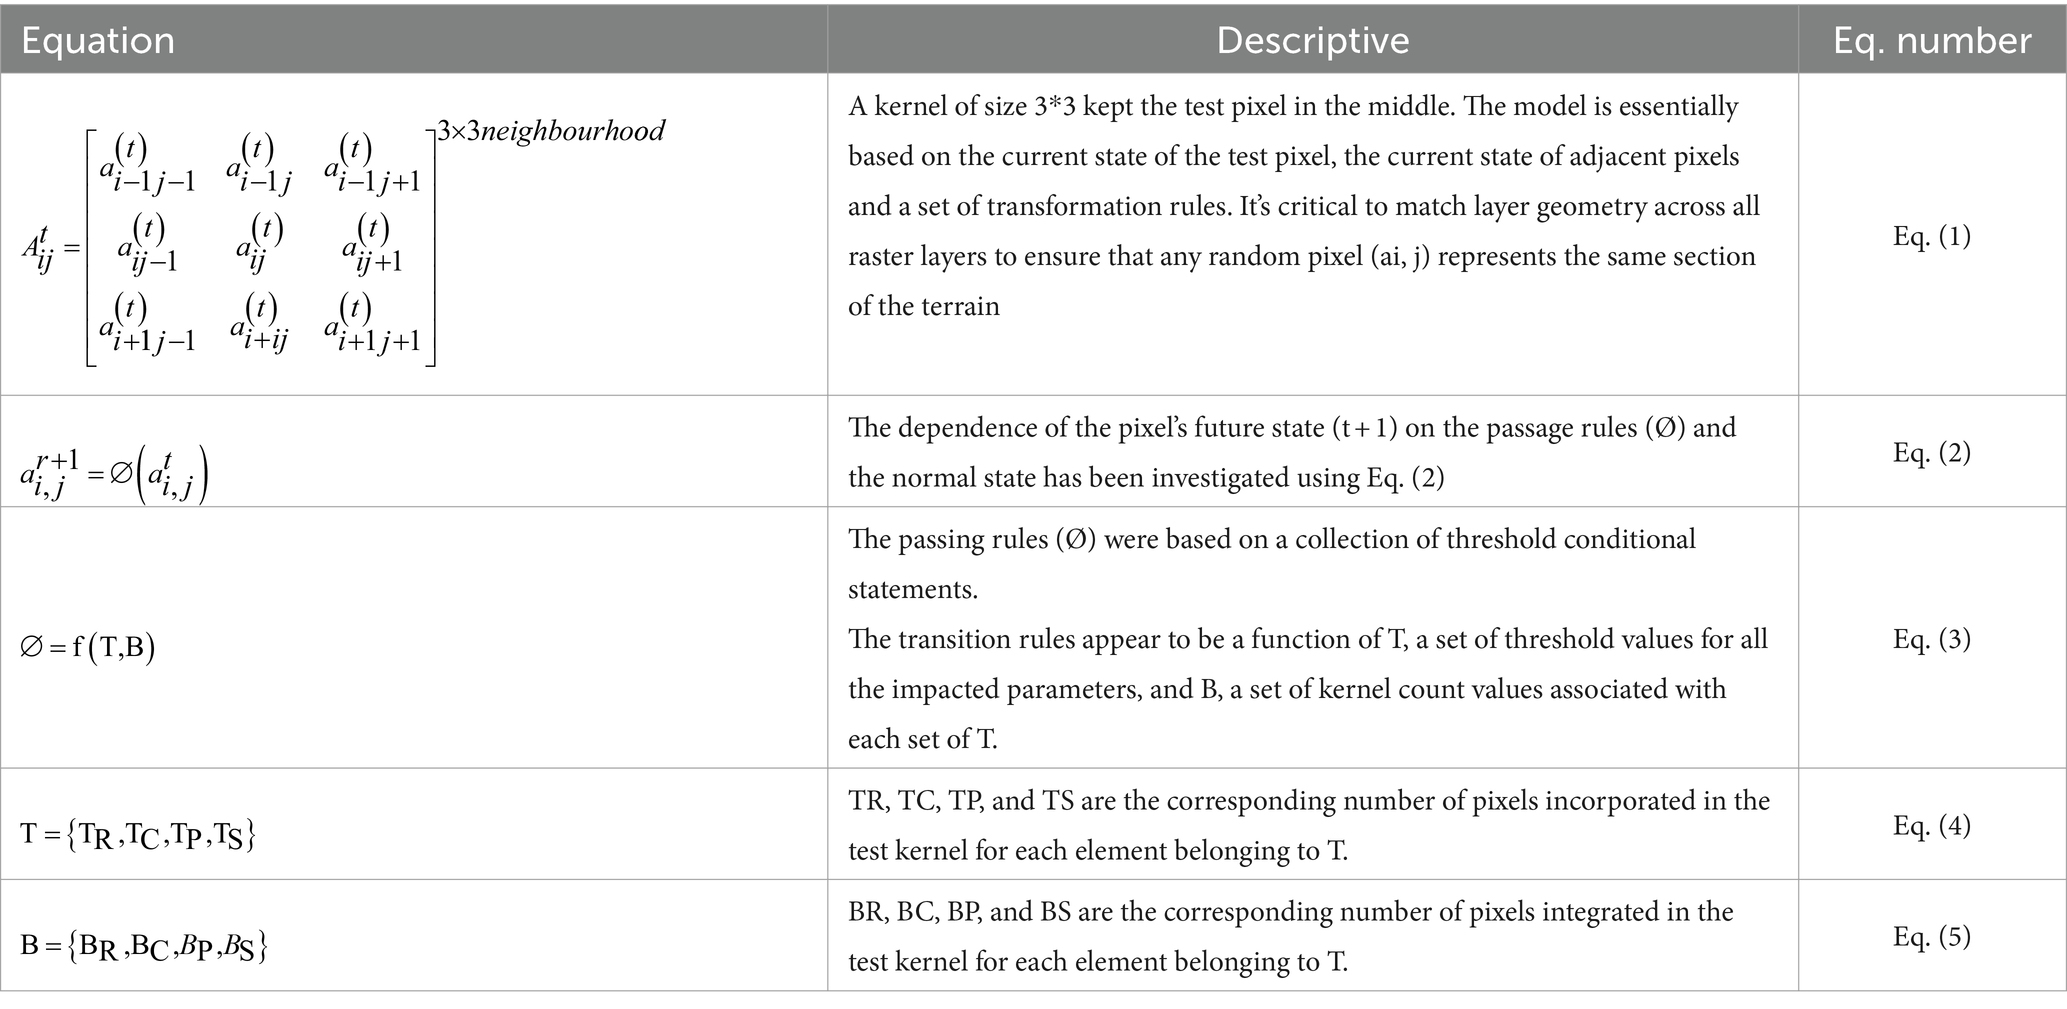
Table 2. Equations used in CA implementation steps.
The five growth coefficients include the diffusion coefficient, the breed coefficient, the spread coefficient, the slope resistance factor, and the road gravity coefficient. Diffusion determines how dispersive the distribution is in general. This value, which is calculated using Eq. 6, determines how frequently a pixel will be picked at random for possible urbanization.
Breed coefficient assesses a separated settlement’s propensity to start its own development cycle. The spread coefficient regulates how much organic expansion occurs in the system’s direction. The likelihood of settlements expanding higher on steep slopes is influenced by slope resistance. If new settlements are within a certain distance of an existing road, road gravity affects how desirable they are for the current road network. Calibration was done in SLEUTH by Brute Force method, including four steps: coarse, fine, final and average. Several metrics of goodness of fit are generated because of each calibration step (Table 3).
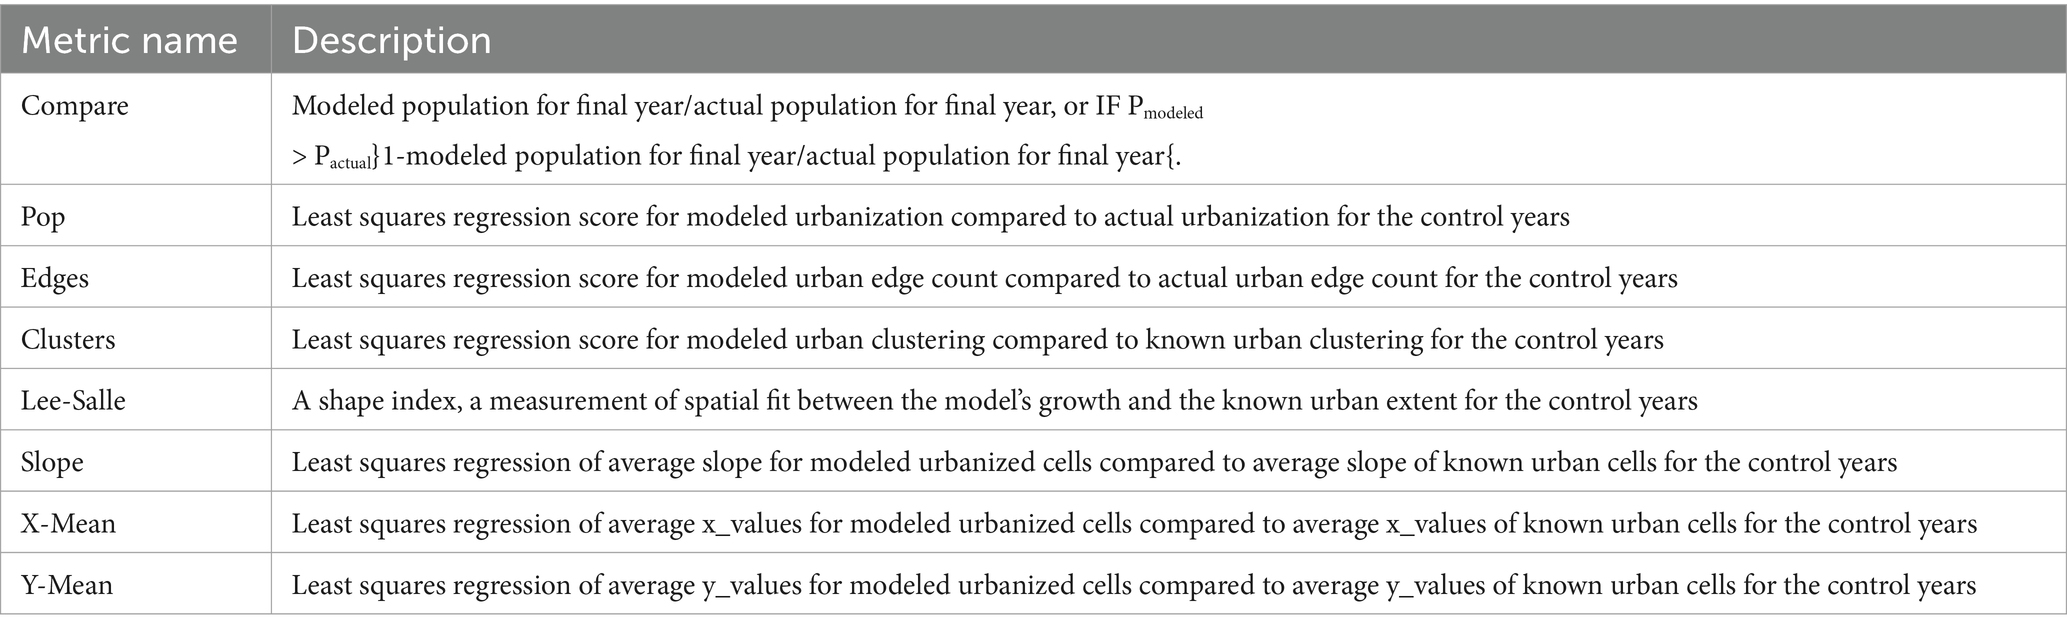
Table 3. Some metrics that can evaluate the goodness of fit of the SLEUTH model (Dietzel and Clarke, 2007).
The metrics in Table 2 can be used alone or in combination for evaluation. Among the metrics in this table, Lee-Salee is the most common (Asadullah and Muhammad, 2000; Rafiee et al., 2009b; Feng et al., 2012; Akın et al., 2014; Jahanishakib and Erfani, 2021), and among the composite indexes (Dietzel and Clarke, 2007; Sakieh et al., 2015; Li et al., 2018), it is the OSM index, which is got by multiplying seven statistical coefficients according to Eq. 7, and evaluates the accuracy of the model implementation.
In this study, after completing each calibration step, the “goodness of fit” is determined by the Optimal SLEUTH (Dietzel and Clarke, 2007), and the range of the five growth coefficients based on the highest OSM values in each stage of calibration was narrower and the number of steps increased. The set of five primary growth coefficients was considered in steps ranging from 0 to 100, narrowing after each calibration. In this way, based on the highest OSM values, the lower and upper limits and the new range of the five growth coefficients were got for each stage of calibration. The selection of the range of coefficients in the calibration stages depends on the experience of the researcher and their familiarity with the region and its historical growth pattern. In the current study, by validating the results for 2013, which are explained in the Model validation section, it was obtained from the appropriate selection of confidence coefficients. After the calibration of average, the set of parameters with the highest OSM is used for prediction. Also, during the calibration process, the Lee-Salee index was also used to better control the calibration process.
The prediction stage as the last stage of the model shows the probability of the city expansion in the specified years in the future. The starting year of the prediction was 2020 and the end year was 2050. After the prediction stage is completed, several gif files are produced that show the growth of the city year by year until the end of the prediction year. In these maps, larger values show a higher probability of urbanization of the corresponding pixels. Next, the probability threshold of urbanization is determined and used in classification of probability map. The historical growth scenario based on the exclusion layer of this scenario was evaluated based on the explanations given. In order to evaluate the environmental growth scenario, besides applying the environmental growth exclusions layer, the coefficients got from the different stages of the historical growth calibration were changed in favor of the organic growth model.
The validation of the prediction map was performed by comparing it to the reality map of 2023, derived from the LCZ method, using the Receiver Operating Characteristic (ROC) analysis. For this purpose, the Landsat data for the year 2023 (Table 1) were downloaded, classified, and assessed for classification accuracy. The SLEUTH model also ran again for 2023 (based on the urban growth layers of 1990–2000–2010 and 2020). The values of the Area under curve (AUC) serve as the basis for measuring the accuracy and correctness of the model. The closer the value of the area under the curve is to one, the more accurate the evaluated model is and the closer it is to the ideal state.
Slope, land use, exclusion, urban extent, transportation and hillshade are the input layers for SLEUTH model. Figures 3–5 showed the slope and hillshade, the transport layers for the years 1990, 2000, 2010, and 2020, and the exclusion layer for the two scenarios of historical and environmental growth, respectively.
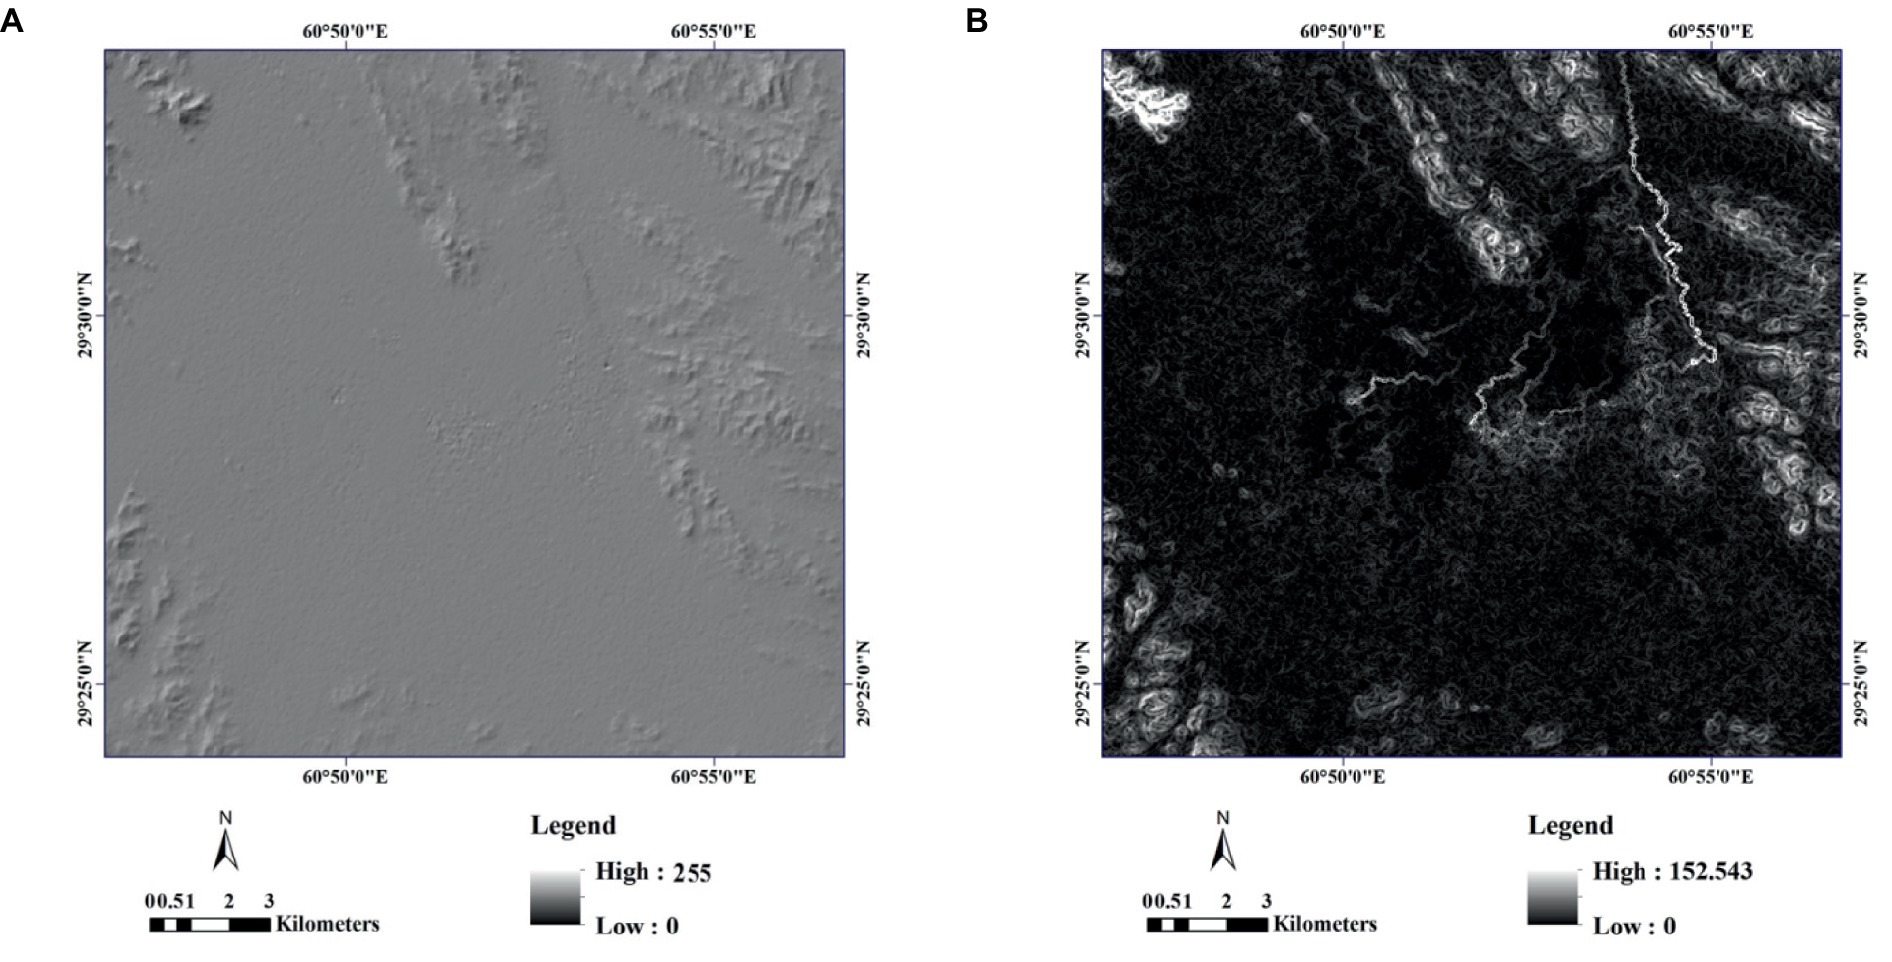
Figure 3. Hillshade layer (A) and Slope layer (B) of the study area.
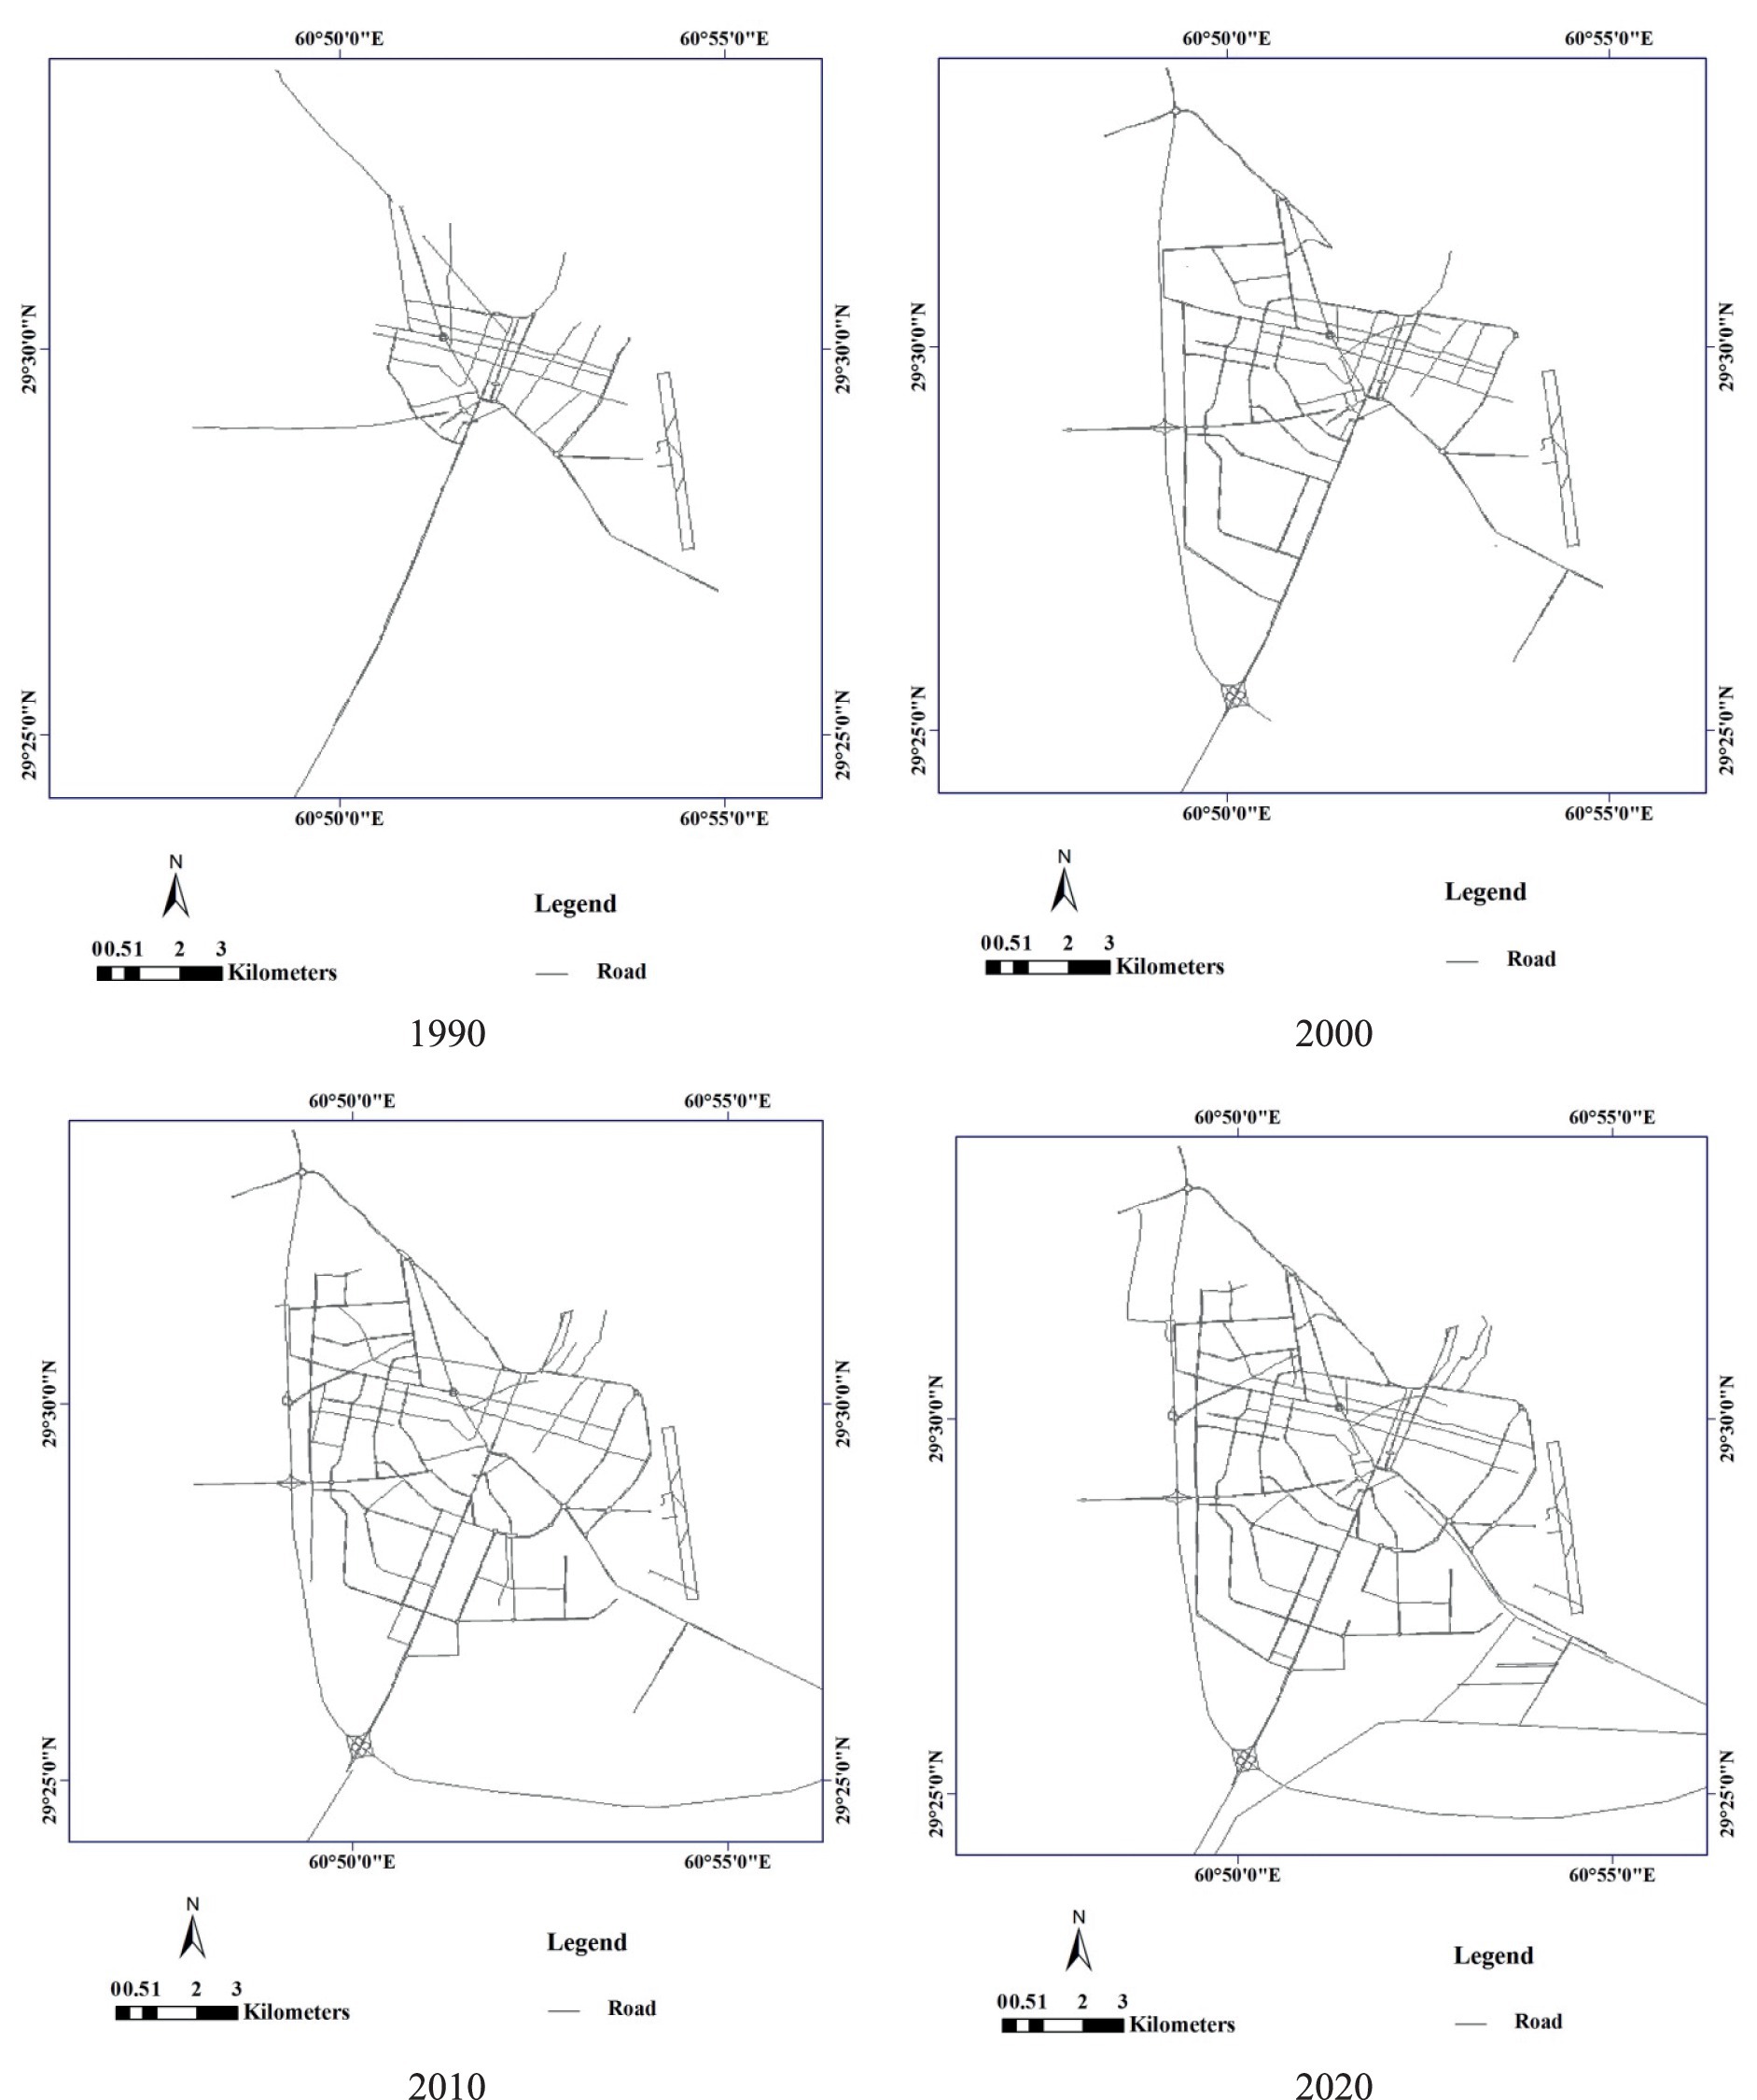
Figure 4. Transportation networks in four years.
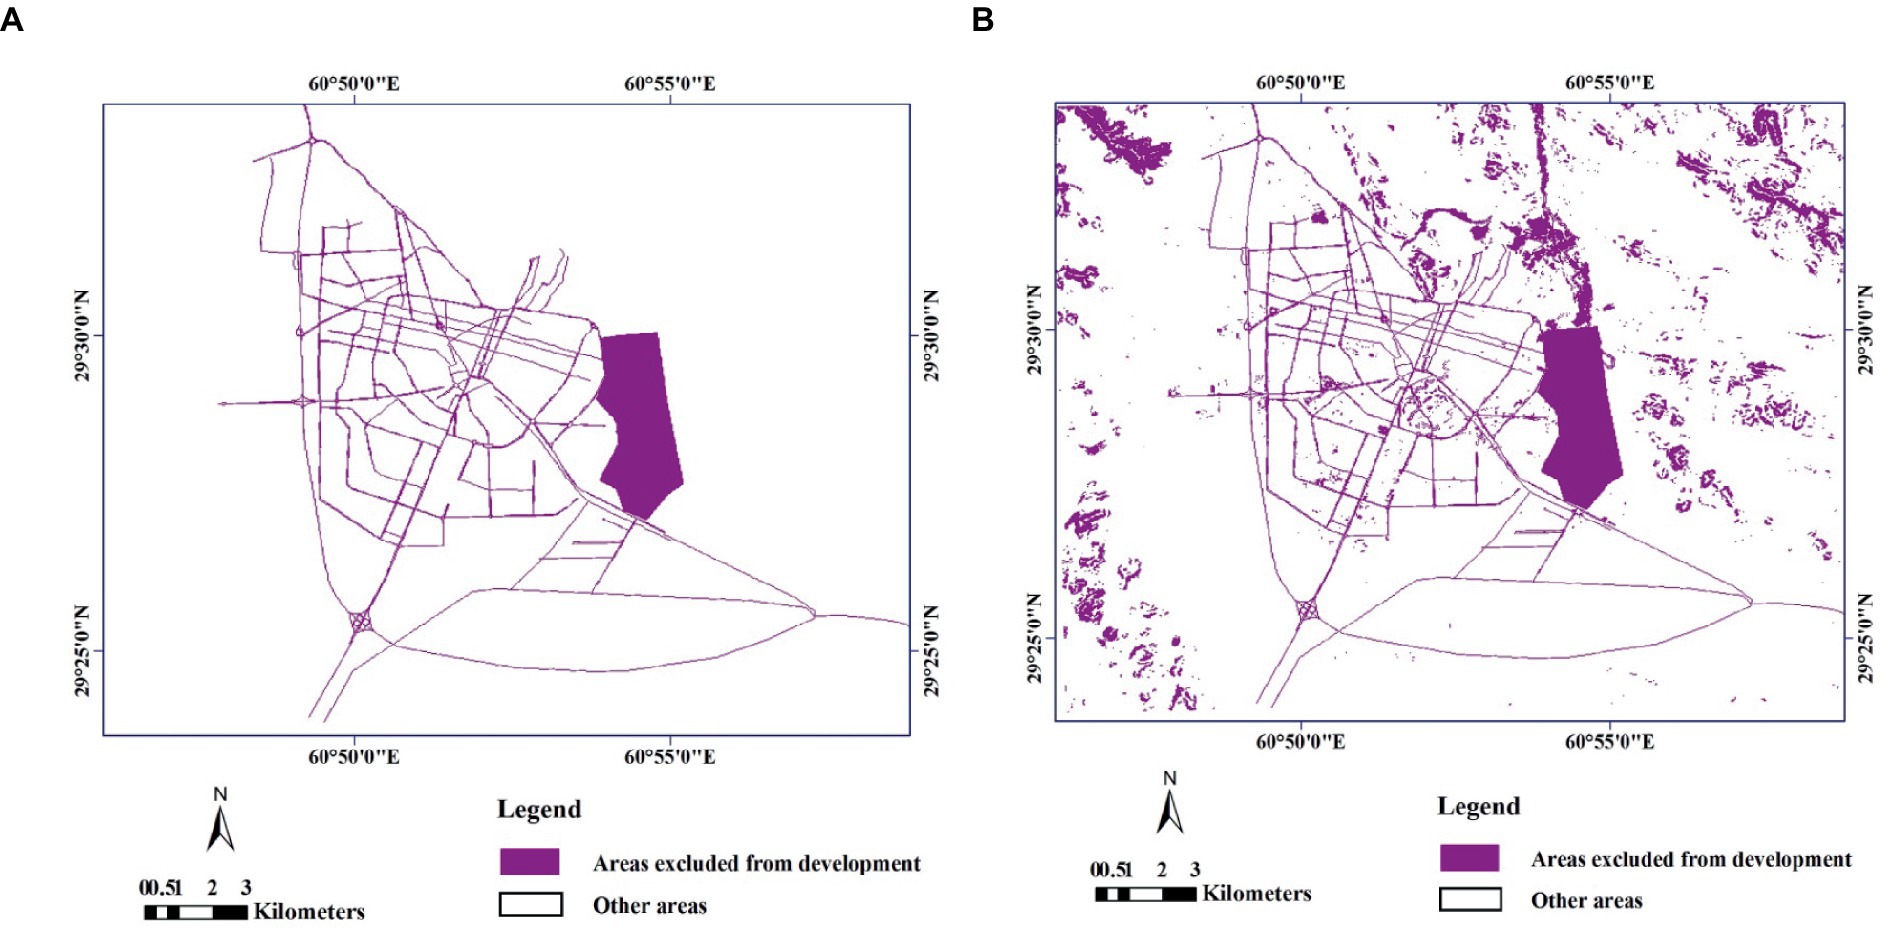
Figure 5. Areas excluded from development in historical growth scenario (A) and environmental growth scenario (B).
The classification results of Landsat images using the LCZ algorithm for the calibration period (from 1990 until 2020 with a decade interval) and one year (2023 for validation of model results) show the rapid growth of Zahedan city over 33 years (Figure 6). The accuracy assessment of the classification results showed that the producer’s accuracy for the city class was higher than the user’s accuracy in all four years. This indicates that there are more pixels belonging to the non-urban class that were misclassified as urban class, compared to the number of pixels belonging to the urban class that were misclassified as non-urban class (Table 4). Investigation into the points classified as urban, which are actually non-urban, revealed that they are primarily located in vacant areas within or near the city. The use of thermal bands in this method has led to the classification of areas under the influence of the city (thermal effect of built-up areas) as urban areas. Due to the consideration of the urban sphere of influence, this method was chosen for classification in this study. The other accuracy statistics are presented in Table 4, which demonstrates the validation of the input data used for modeling as acceptable.
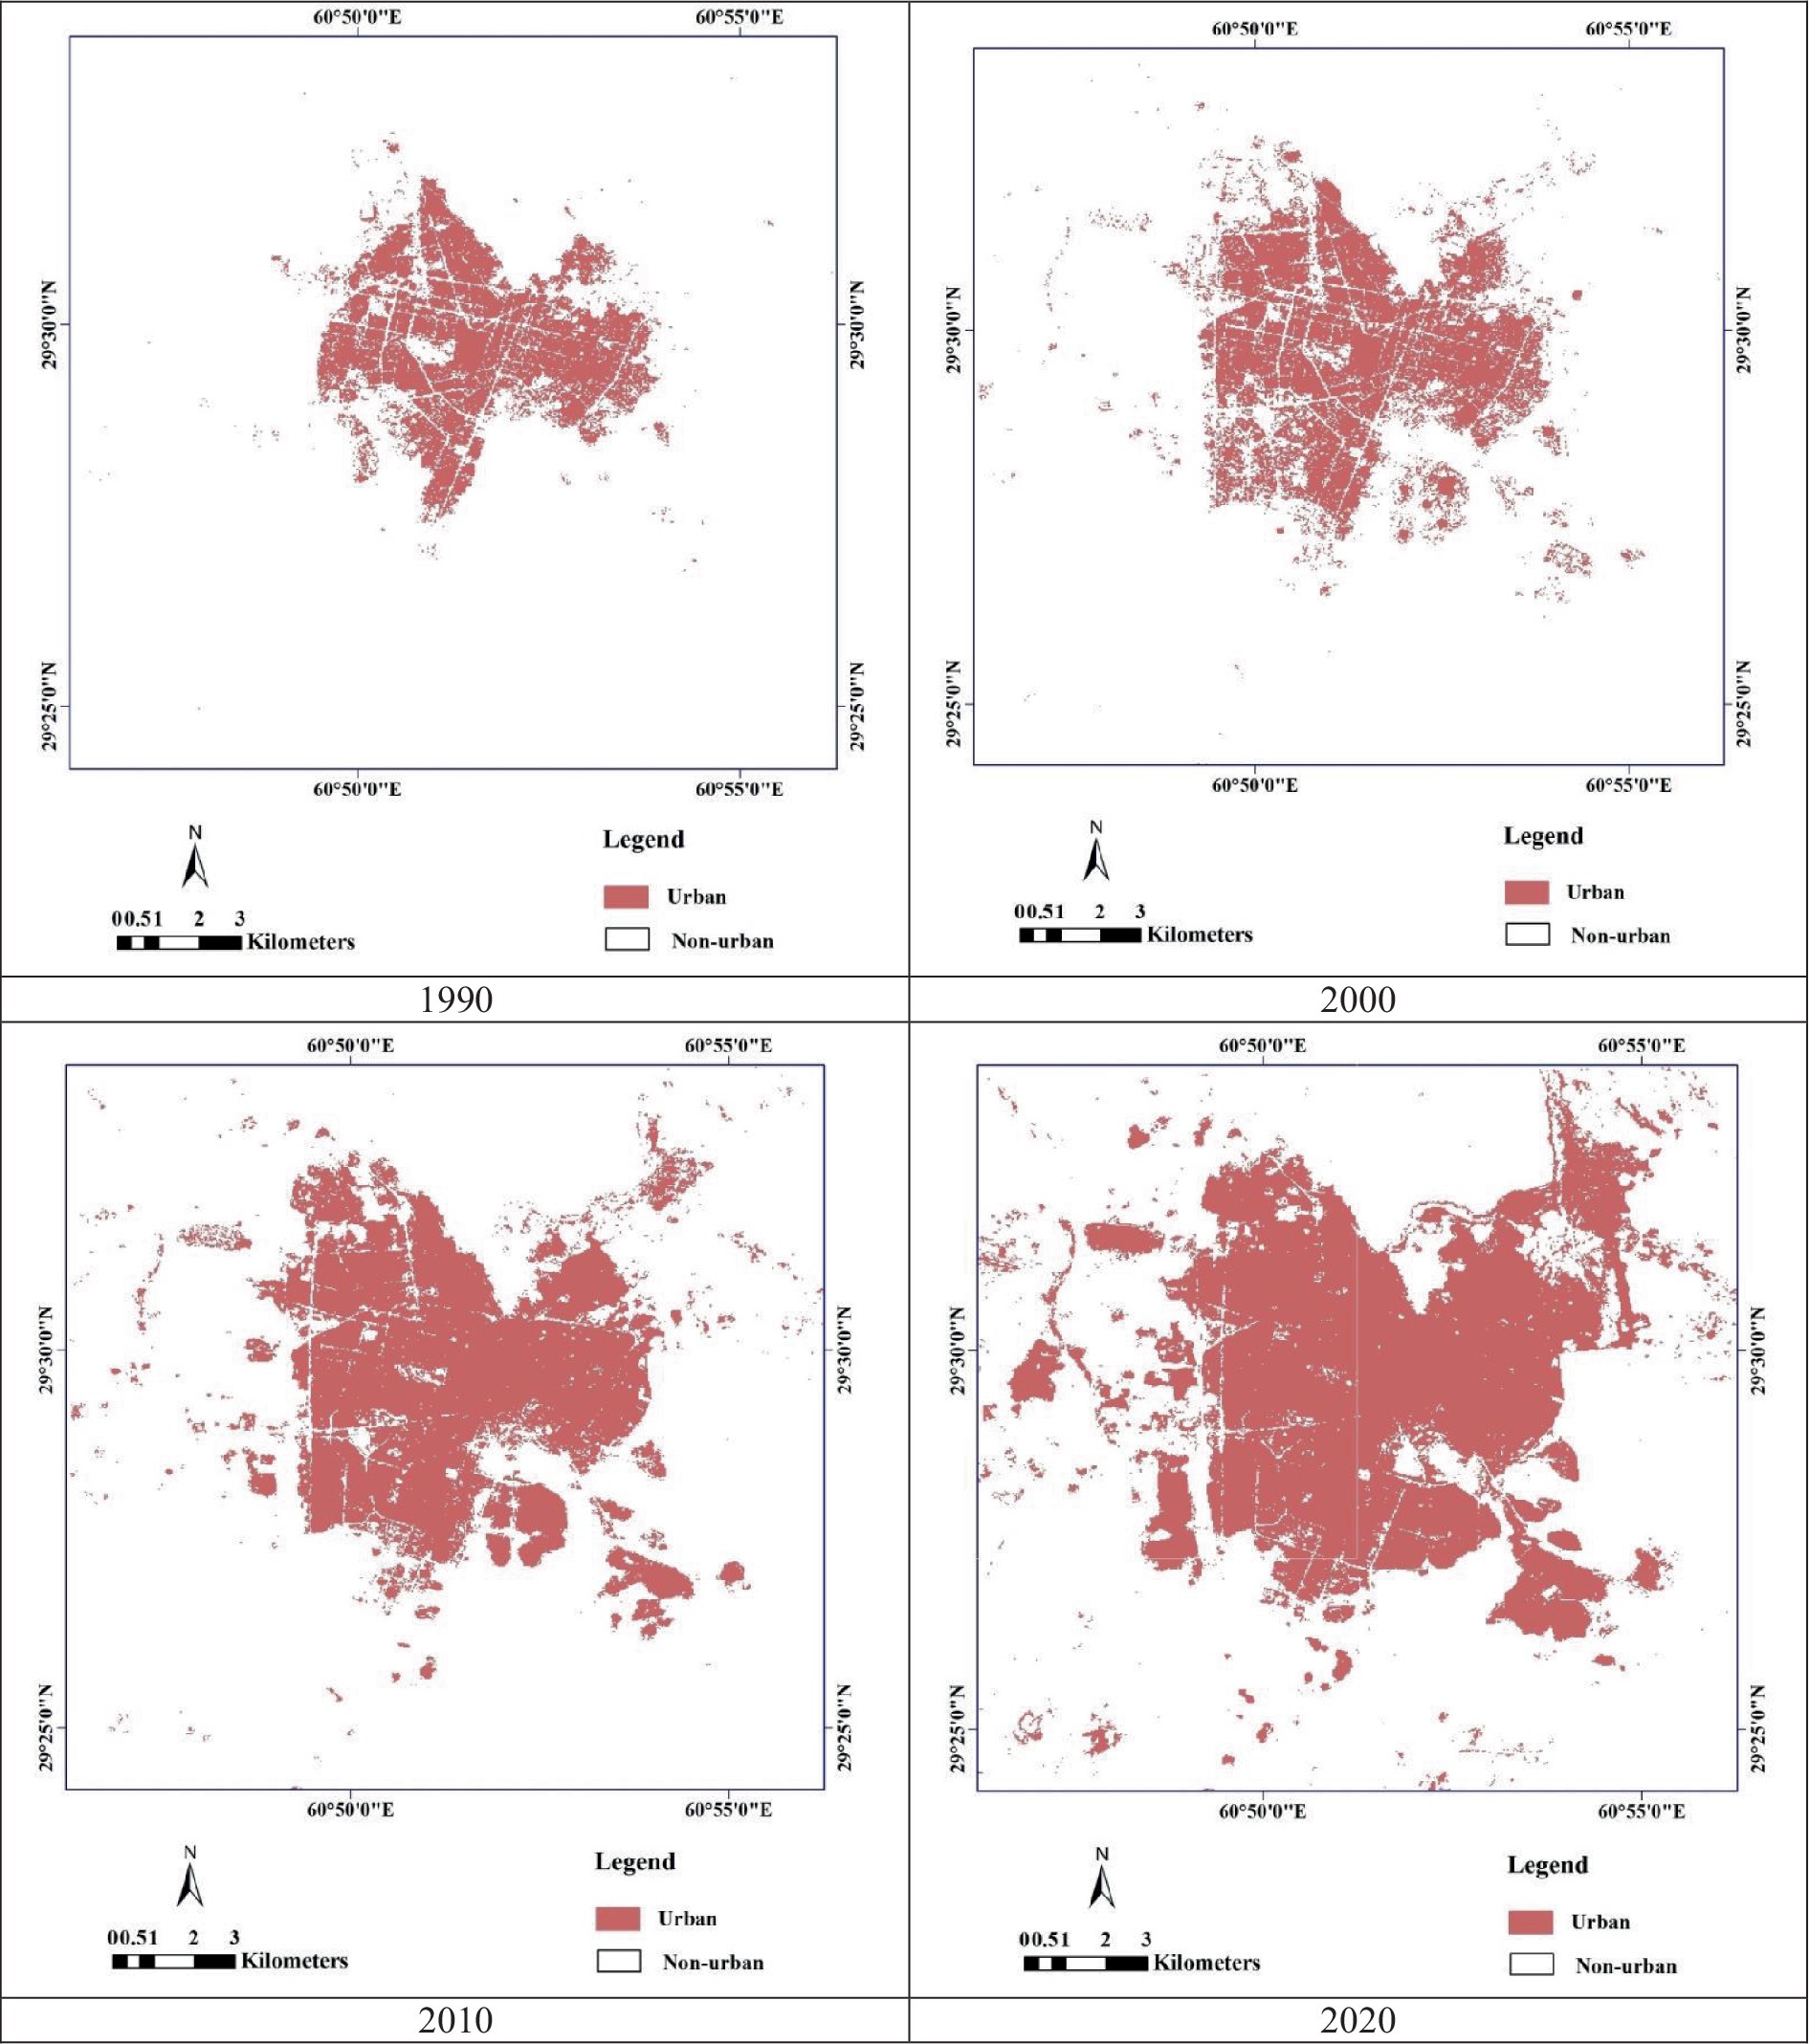
Figure 6. Urban areas in four years.
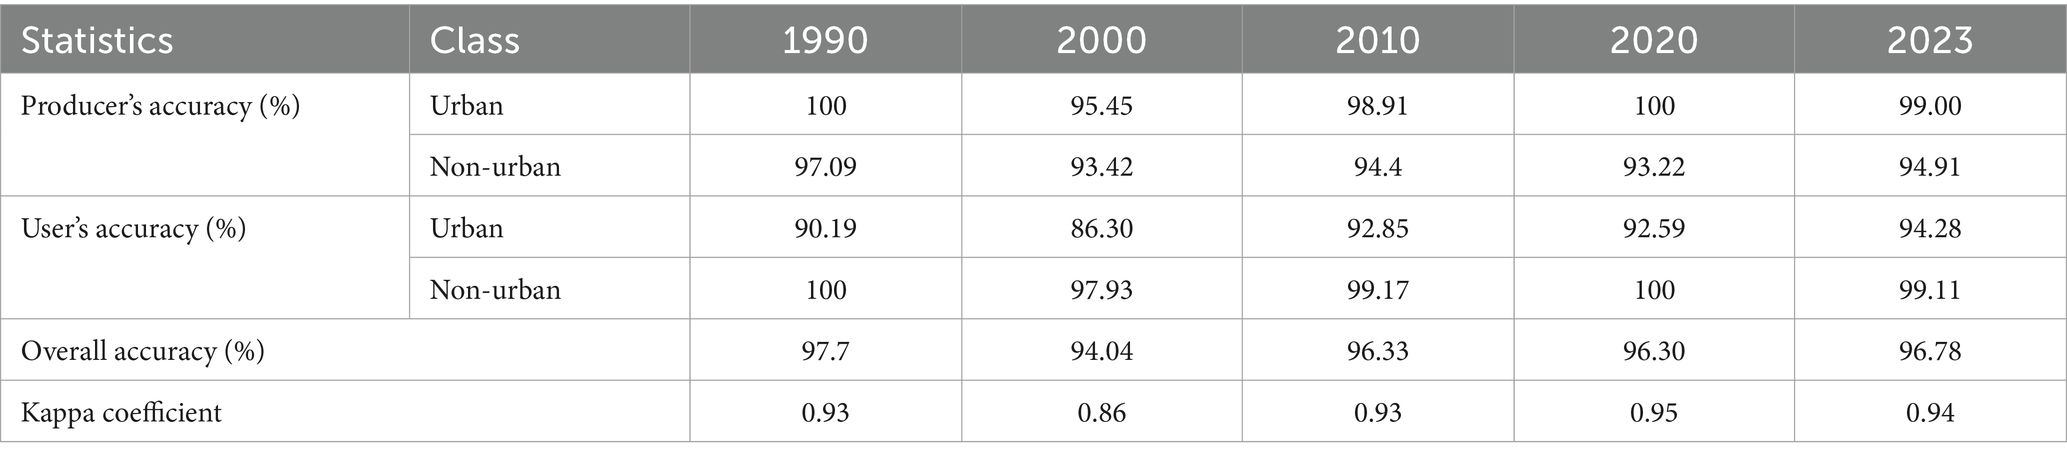
Table 4. Accuracy statistics of classification of urban and non-urban areas.
According to the exclusion layer containing roads and airport and its buffer in the historical growth scenario, four stages of coarse, fine, final and average calibration were performed. In the coarse calibration stage, default five coefficients between 0 and 100, step equal to 25, and Monte Carlo number 4, were considered (Table 5). In the fine stage, based on the results of the calibration of the coarse stage, five coefficients were selected in a narrower range for fine calibration, and thus, the narrowest range (1) was considered in the averaging stage. The starting and ending values and ranges and the execution time of each step are listed in Table 3. As shown in the table, from the first calibration to the last one, the number of Monte Carlo is added, and the highest number of Monte Carlo is in the averaging stage. A more reliable set of prediction parameters will be created by averaging the parameter outcomes of more Monte Carlo iterations because of the model’s random variability. The highest values of OSM and Lee-Salee in different stages of calibration to evaluate the goodness of fit of the model are listed in Tables 6, 7, respectively.
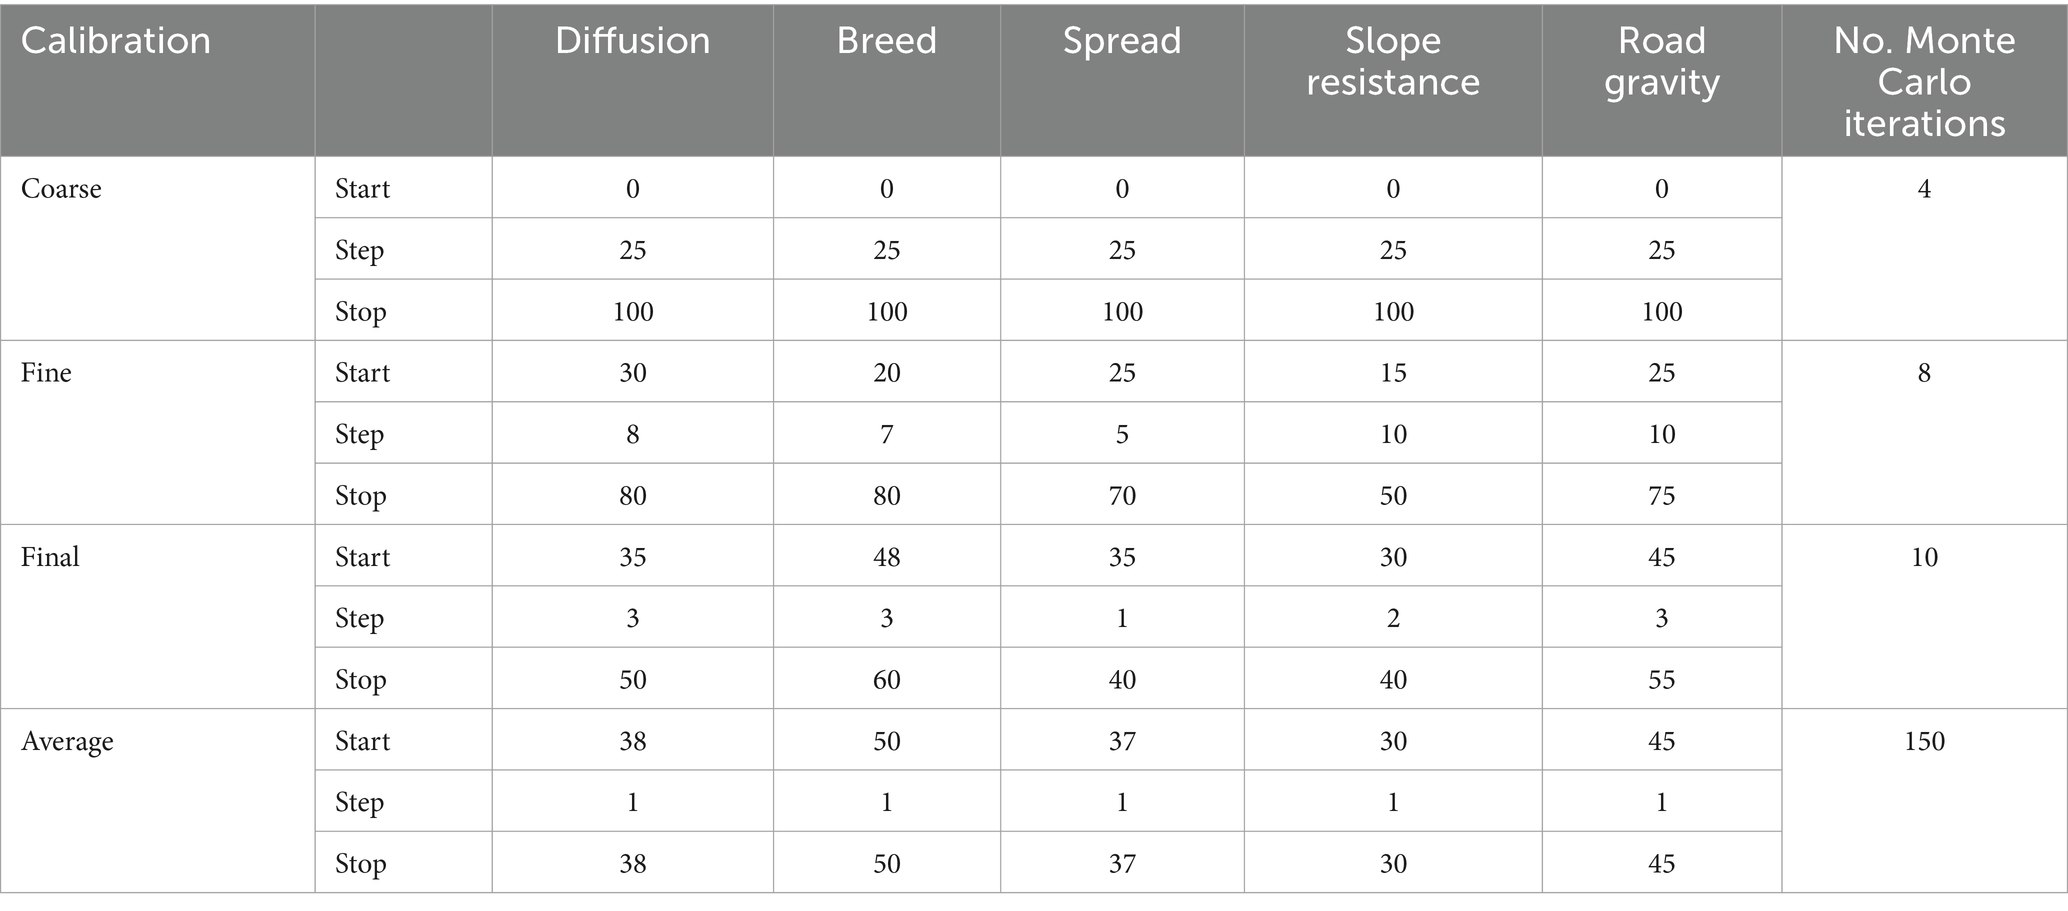
Table 5. Determining the coefficients in the calibration stages of the historical growth scenario.
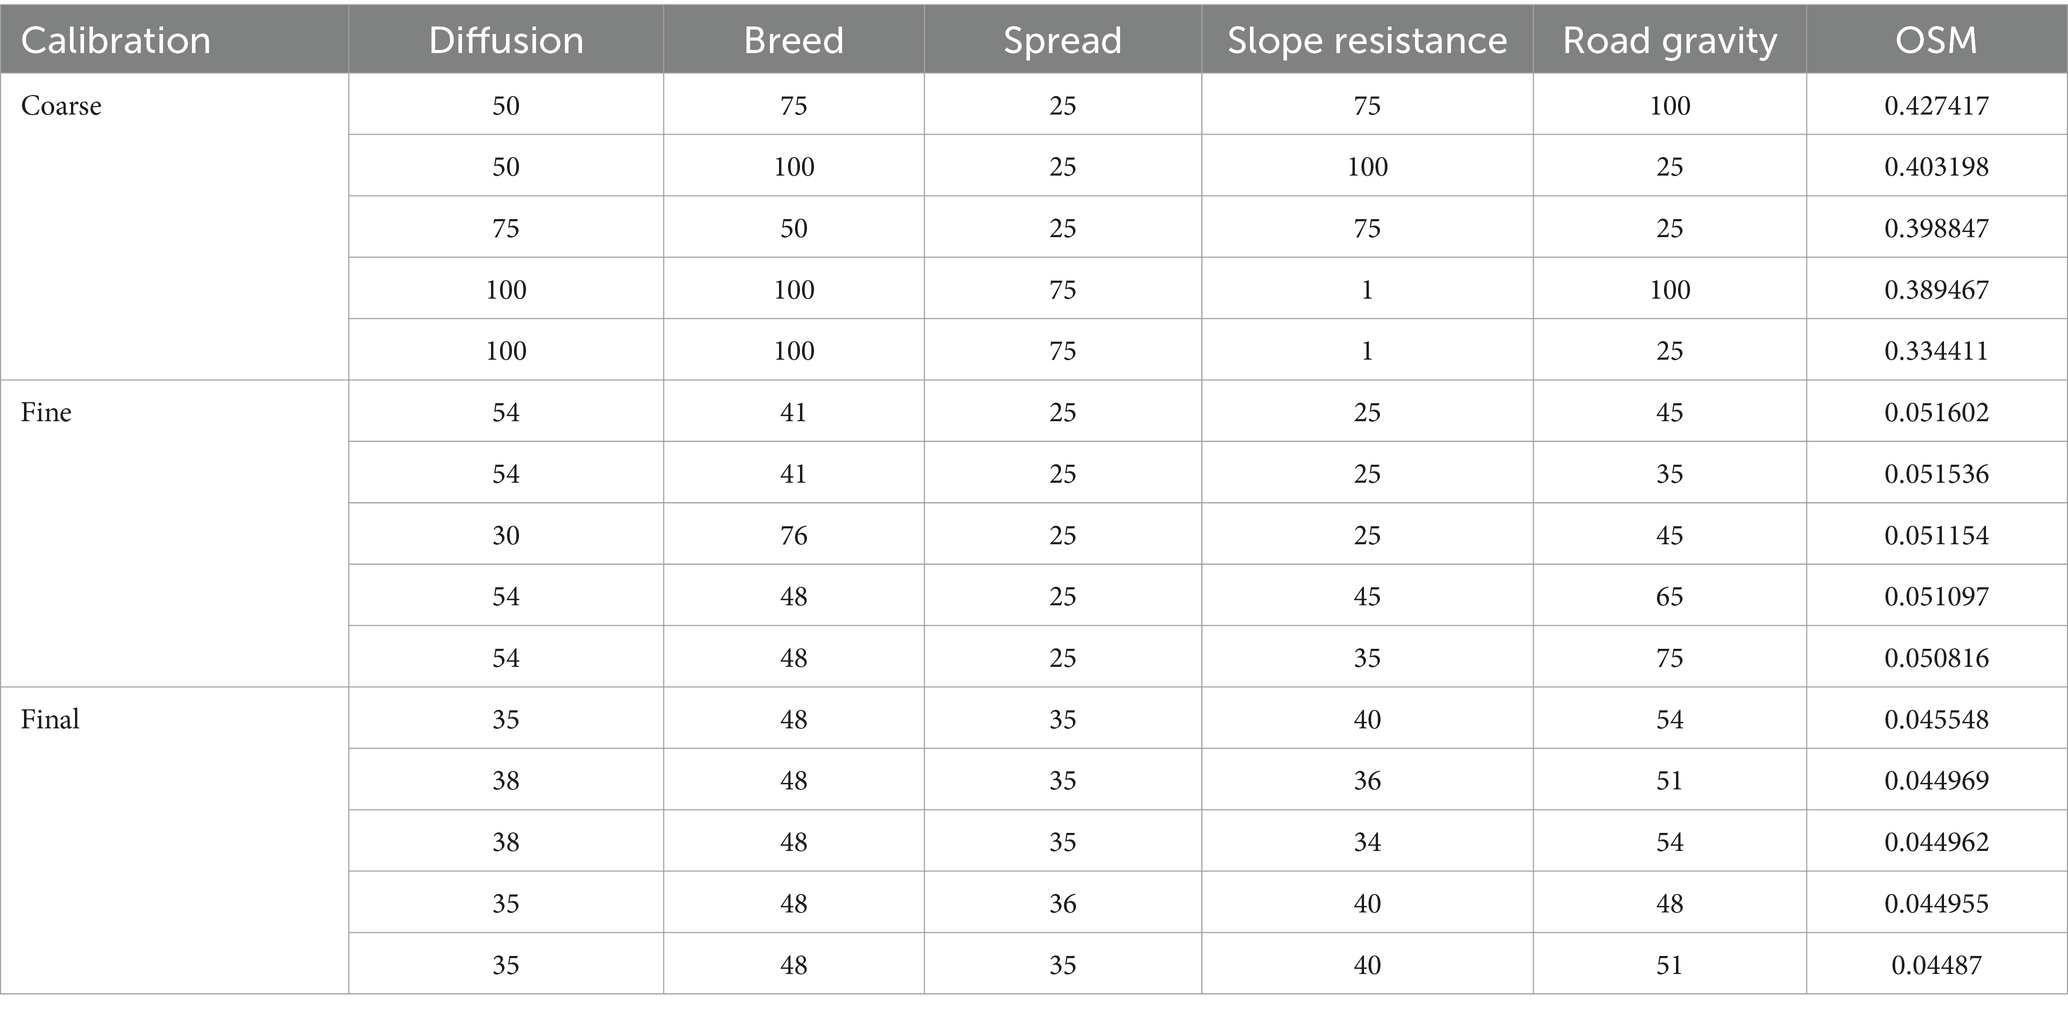
Table 6. The best five coefficients, based on the highest OSM values, extracted from the calibration steps of the historical growth scenario.
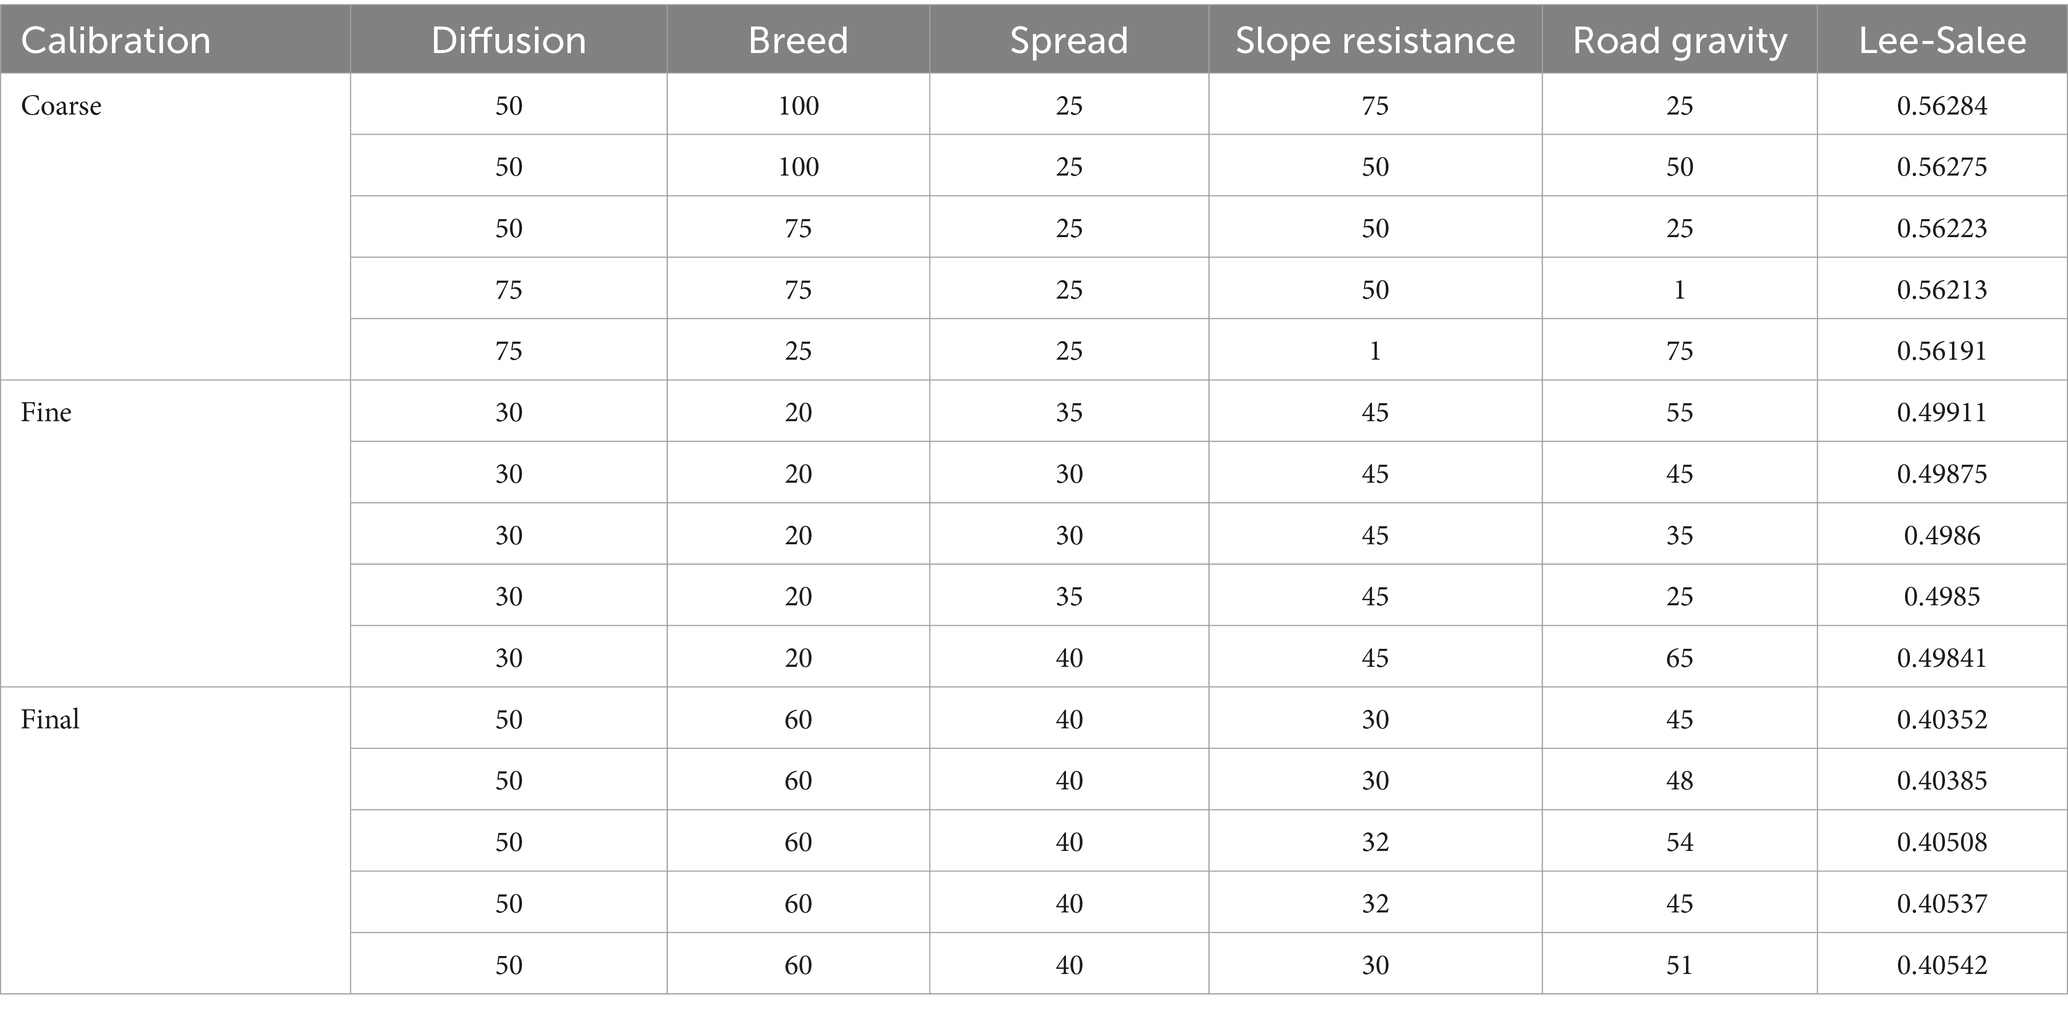
Table 7. The best five coefficients based on the largest Lee-Salee values, extracted from the calibration steps of the historical growth scenario.
According to Table 8, which shows the five coefficients got based on the average calibration, the slope resistance has gradually decreased from 2000 to 2020 with the saturation of areas up to 30% slope. Consequently, due to the saturation of slopes up to 30%, the slope threshold was raised to 40% in the scenario file for the prediction stage. Figure 7 shows the coefficients used in this scenario, the rounded values are the coefficients of 2020. The environmental growth scenario was predicted by changing the five coefficients (Figure 7) and changing the layer of exclusions. Based on Figure 7, breed, diffusion, and road gravity coefficients were considered lower than the historical scenario, and slope resistance and spread coefficients were considered higher than the historical growth scenario. Because of the role of spread in organic pattern growth, the spread coefficient was considered higher than in the historical scenario.
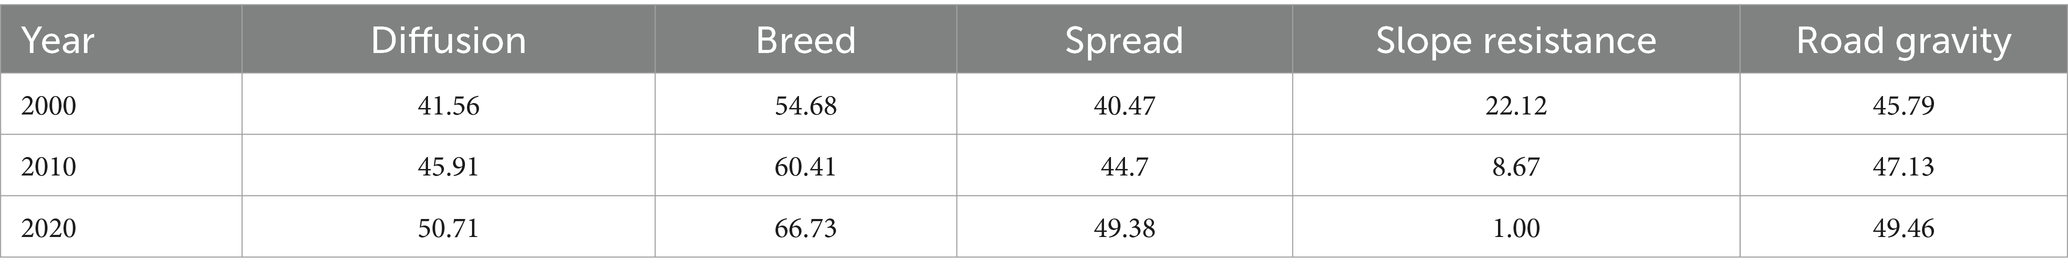
Table 8. The five coefficients got based on the calibration of average in different years of the historical growth scenario with the SLEUTH model.
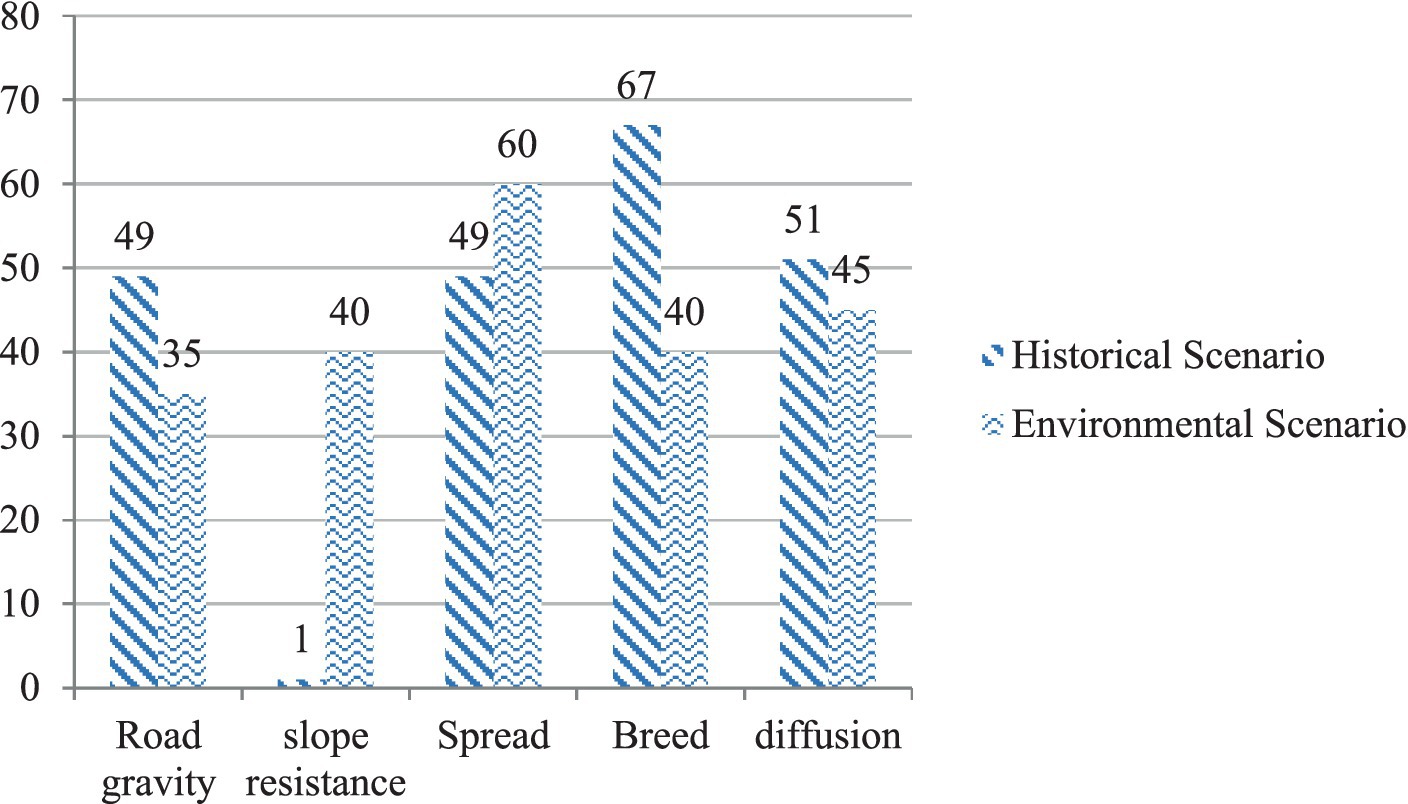
Figure 7. Determining the five coefficients in the historical and environmental growth scenario.
The number of Monte Carlo in the prediction step was considered being 10.
The reclassification threshold for urban area in the simulation results for the year 2050 was set at 80%. Figure 8 shows the simulation results of historical urban and environmental growth scenarios.
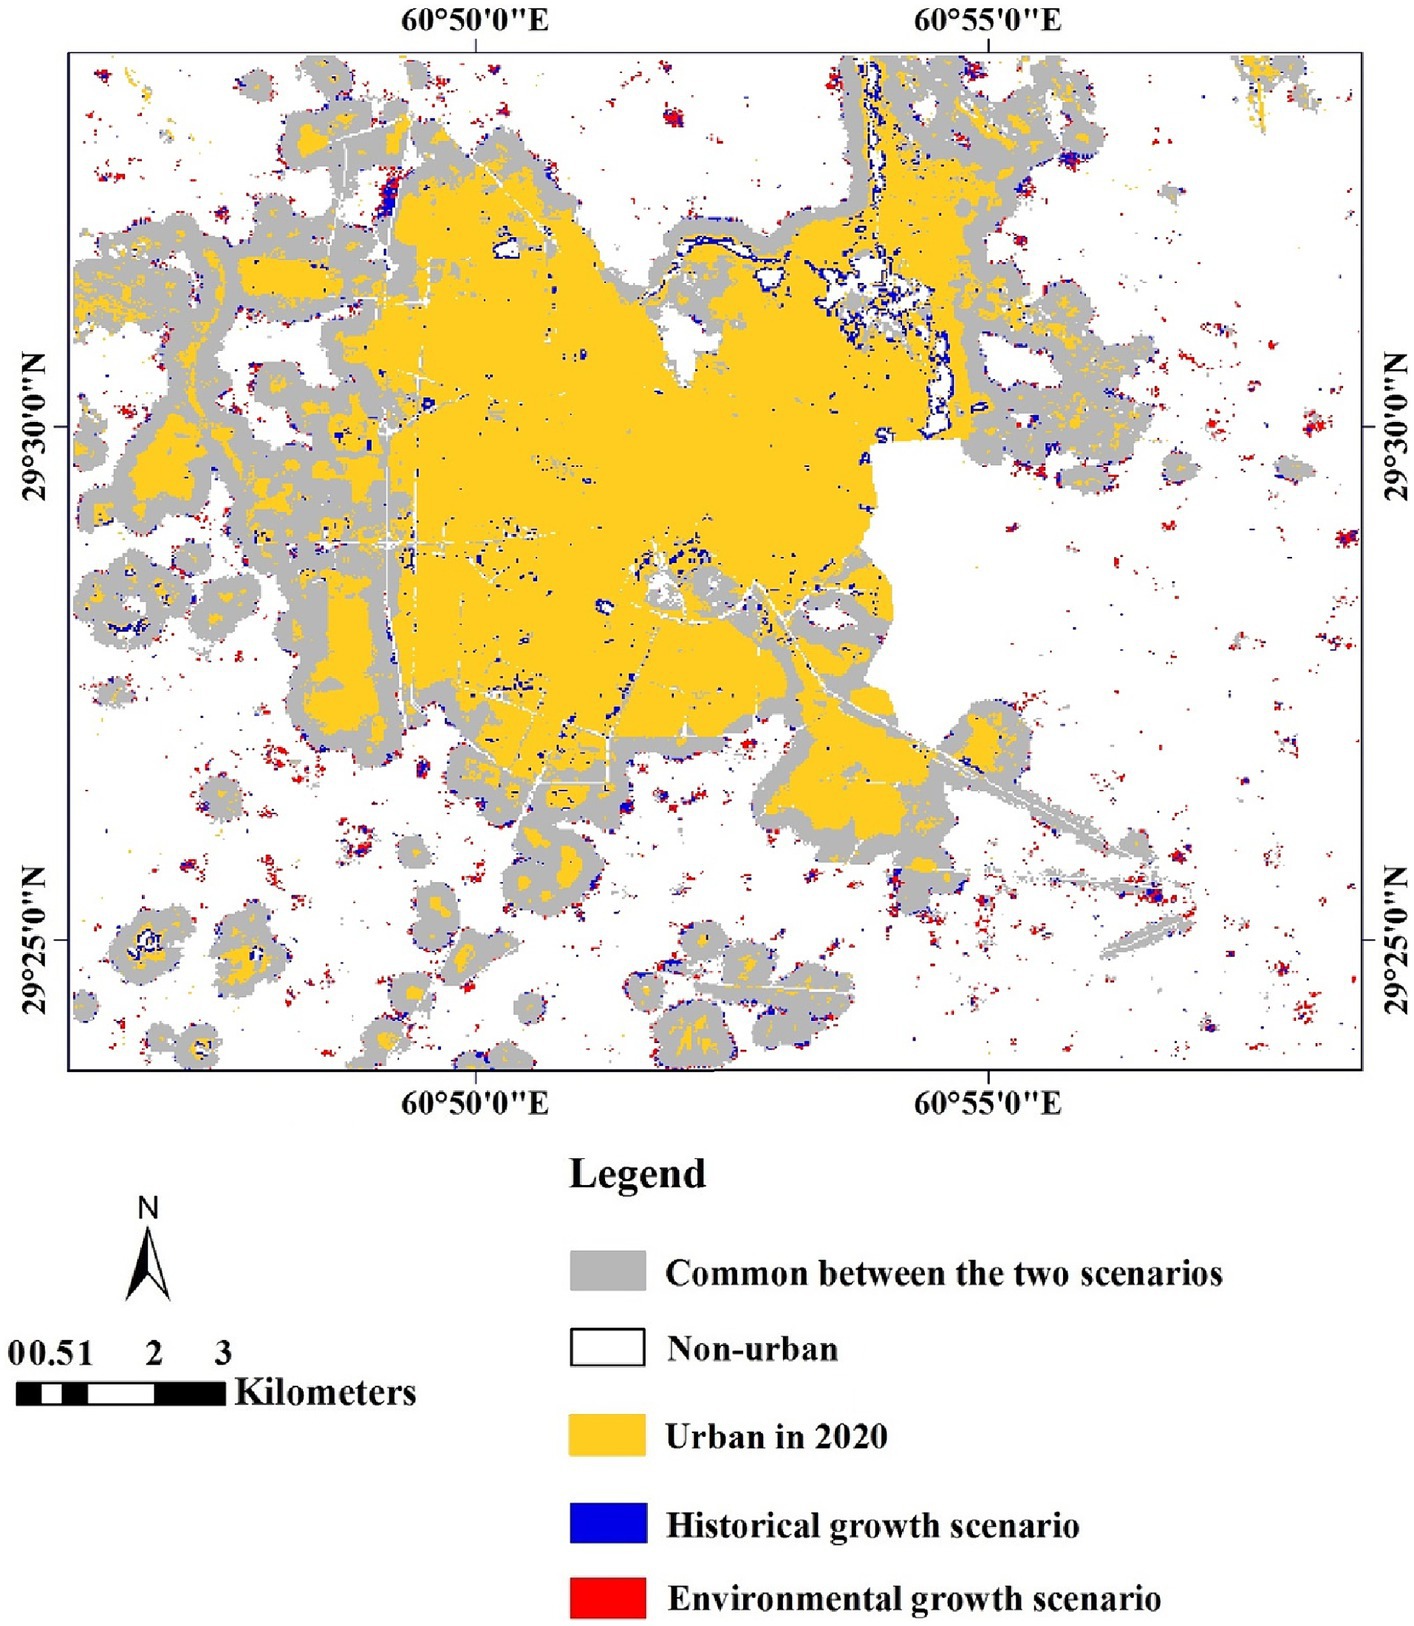
Figure 8. Overlay of simulating the growth of Zahedan in the historical and environmental scenarios in 2050.
According to Figure 9, the increase in area of Zahedan in 2050 will be between 15912.18 and 19713.78 ha in the historical growth scenario and it will be 16083.72 ha in the environmental scenario.
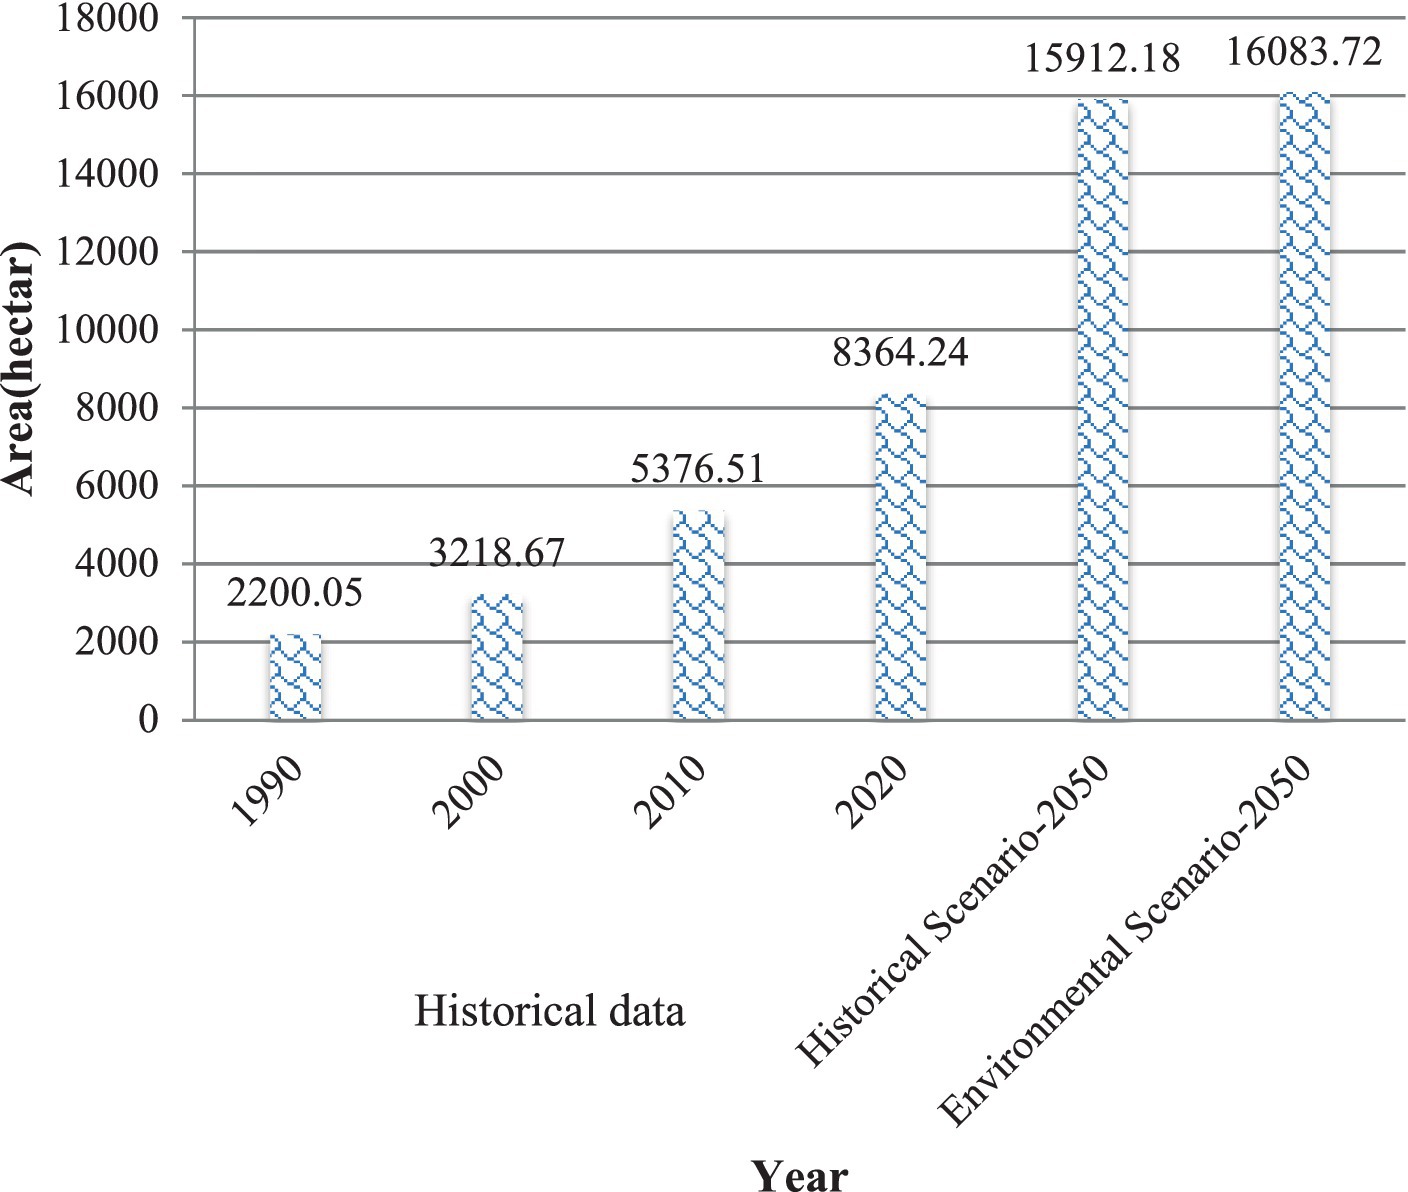
Figure 9. The area of Zahedan in different past and predicted years.
The prediction map generated by the SLEUTH model for the year 2023 has been reclassified using a threshold. Pixels with a probability of over 80% of becoming a city were classified as urban areas (Figure 10A). The validation results of the prediction map, using the reclassified LCZ map as references (Figure 10B), showed an AUC value of 0.924. This is demonstrated in Figure 10C, which confirms the successful validation of the model.
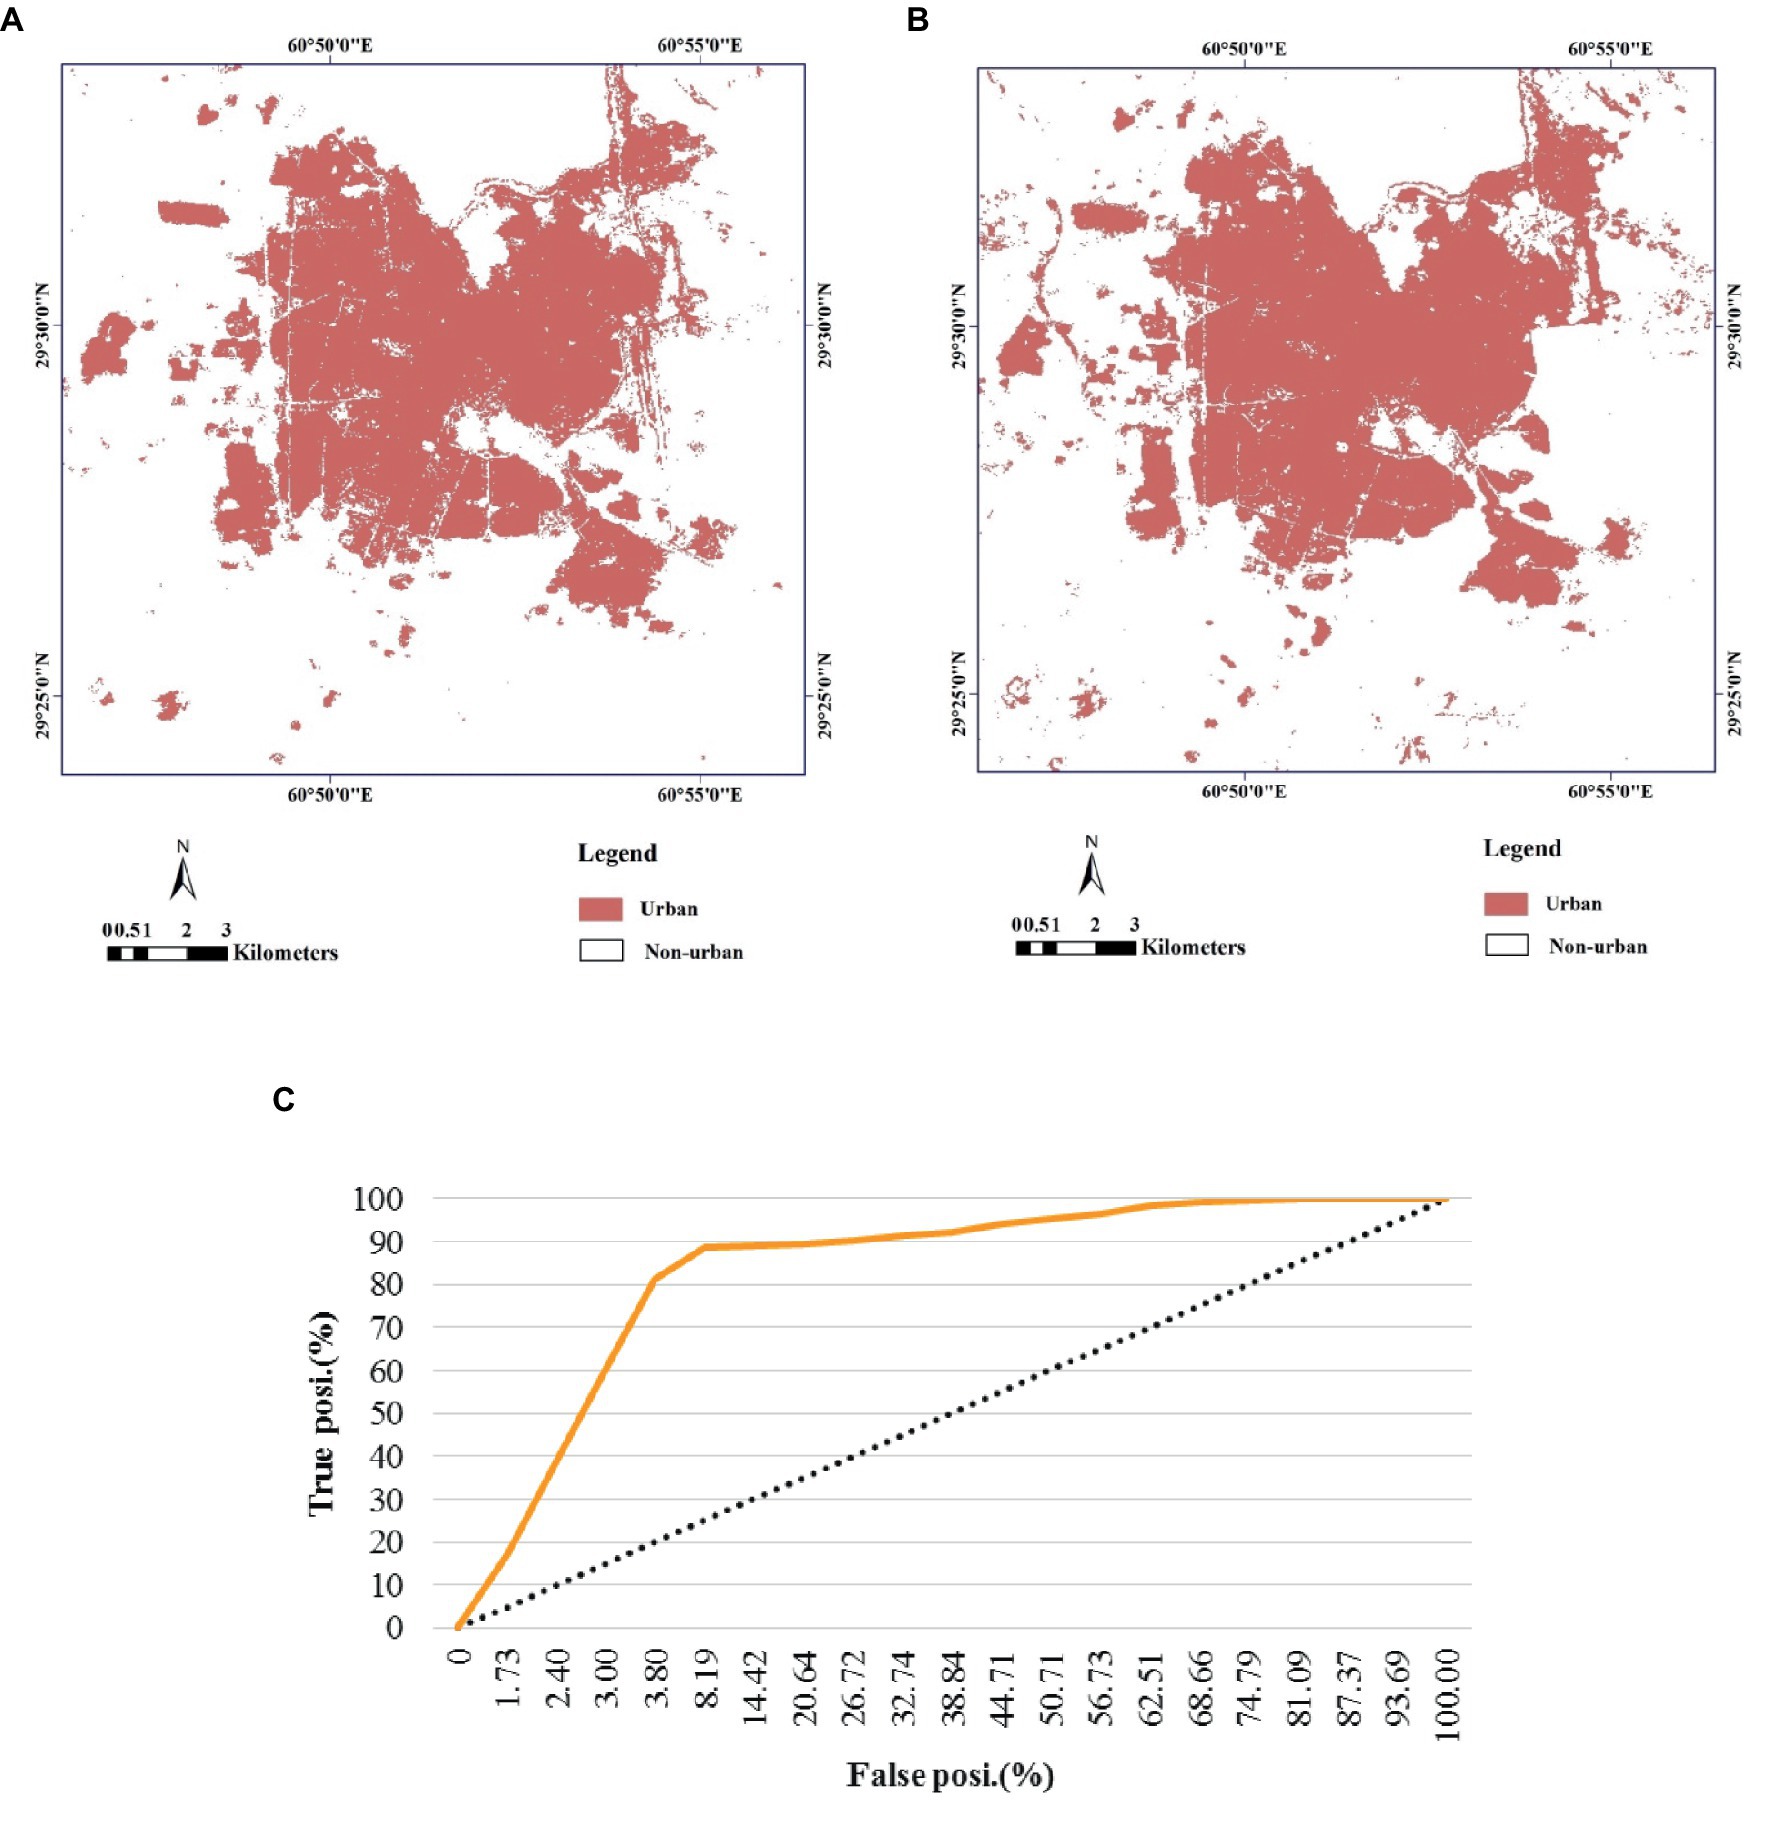
Figure 10. Classified map of urban areas (A), simulated map (B) of Zahedan at 2023, and ROC for model validation (C) (the ROC curve was generated using the cumulative probability of urbanization in the year 2023 and the reference layer for the same year. The dashed line represents random location, with an area under the curve (AUC) of 0.50).
In the present study utilizes the LCZ classifier to demonstrate urban and non-urban areas based on local climates. However, it should be noted that the border of the city depicted by the classifier may extend slightly beyond the actual physical limits of the built-up areas. The city border can be defined as (1) the outer limit of the build-up areas or (2) the region influenced by the build-up areas. It seems that the use of second type of classifiers is more appropriate for the studying fields such as ecology, local climate change, climate comfort and environmental management. Nevertheless, they do not show their actual accuracy because they are compared to the built-up areas, not influenced ones. The determination of the city’s borders has been accomplished through the classification of satellite images using various methods, from simple to complex. The methods used in other studies in dry areas, such as maximum likelihood, minimum distance, Fisher, KNN, fuzzy, artificial neural network, and SVM have shown that urban areas are classified slightly less accurately than in reality (Jahanishakib and Erfani, 2021; Satari et al., 2023). However, the city and its extent of influence are greater than built-up area, leading to changes in the local climate. The LCZ method considers all possible land use classes within the urban limits, with a focus on microclimate changes in 17 classes. As a result, it is highly compatible with the actual conditions of the city, rather than just the boundaries of urbanized areas. Although, the accuracy statistics of this method indicate acceptable accuracy (Table 4). Another advantage of this method is the handling of mixed pixels. In the case of urban classification, for example, it takes into account ten distinct land features. In traditional methods, classifying all of these features as belonging to the city class is more likely to lead to an increase in classification errors.
The growth modeling of Zahedan was done using cellular automata method with the help of the SLEUTH model and under two historical and environmental growth scenarios. The environmental growth scenario was predicted by changing the five coefficients and changing the layer of exclusion. Breed, diffusion, and road gravity coefficients were considered lower than the historical scenario, and slope resistance and spread coefficients were considered higher than the historical growth scenario (Figure 7). The higher the resistance to the slope is, the probability of urbanization on high slopes should decrease, and therefore, it can play a role as an effective ecological factor in controlling the growth of the city in the environmental scenario. In the environmental scenario the coefficient spread was considered higher than the historical scenario due to several considerations that make the results more reasonable and acceptable (Figure 7). These considerations are such as the reality of increasing demand for migration to Zahedan and the high speed of expansion of the city. Also, it must be considered that spread coefficient play a significant role in the organic growth, which is the most environmentally friendly model of the city’s development.
The results of the calibration of historical growth scenario averaging in the SLEUTH model showed that the breed coefficient with the value of 67 and the diffusion coefficient with the value of 51 and the spread and attraction coefficient to the road with the value of 49 caused the growth in the outskirts of the city and the development of urban centers far away from the current state of the city. This is done in a guided way through the attraction to the road (Figures 7, 9). Also, the slope resistance coefficient with a numerical value of 1 shows that the topographical limitation for the urban growth of the studied area are very small (Figure 7).
OSM and Lee-Salee indexes were used to determine the five coefficients to simulate the growth of Zahedan, which occurred during several stages of calibration, so that the range and steps were determined according to more criteria. The Lee-Salee measure examines the spatial fit between the model’s growth and the known urban extent for the control years. The OSM is based on comparing the modeled population with the actual one for the final year, and some Least Squares Regression is used to describe the growth patterns. Therefore, in Lee-Salee’s opinion, as a shape index in areas with low ecological diversity and a uniform land surface, it can help to decide on the selection of the range and steps of each stage of calibration, along with the OSM index. Similar to study of Jahanishakib and Erfani (2021), both indexes were used to get calibration coefficients in order to simulate the growth of Birjand, which has a climate and landscape similar to the study area. Also, the Lee-Salee index has been used in some studies (Asadullah and Muhammad, 2000; Rafiee et al., 2009b; Feng et al., 2012; Akın et al., 2014) and the efficiency of using the OSM index has been confirmed to determine the five coefficients in different stages of SLEUTH calibration (Sakieh et al., 2015; Rasouli, 2016; Dadashpoor et al., 2019; Mahmoudzadeh et al., 2019; Saxena and Jat, 2020; Kumar and Agrawal, 2023).
Considering that the validation of the results of the SLEUTH model in 2023 was highly accurate (Figure 10), it is reassuring to use the developed model for simulating the future, as done in this study for the year 2050. The validation using historical land cover maps was already considered by Koko et al. (2020), Gemitzi (2021), and Benchelha et al. (2022). However, validation of the SLEUTH model has not been conducted in many studies due to its self-modification capability (Bihamta et al., 2015; Bajracharya et al., 2020; Guan et al., 2020; Mustak et al., 2022). It can be concluded that in these studies, calibration was considered as a part of validation, or the model calibration has been preferred over the validity of the result’s model. The results of the present research showed that in the historical growth scenario, the amount of area prediction until 2050 will increase to about twice that of 2020. In other words, the area in 2020 will reach from 8364.24 ha to 15912.18 ha in a historical growth scenario predicted by the SLEUTH model, which will show the upward trend of growth until 2050, which will be accompanied by more distribution than the environmental growth scenario (16083.72 ha) (Figures 8, 9).
The value of 49 road gravity coefficient in the historical scenario shows that the future development of Zahedan city will be moderately affected by the road. Figure 8 shows the urban spots around the road, especially in the southeastern parts of the city, which do not completely cover the road due to the moderate effect. Also, the parts added to the city in the southern and western areas have been created from the diffusion and spread of urban spots in 2020. For this reason, the reduction of this coefficient in the environmental scenario did not have a significant impact on the reduction of urban development around the road in this scenario. The effect of the low slope and road gravity coefficient and the prominent role of the spread coefficient have led to a little more area of urban patches in the environmental scenario compared to the historical growth scenario. Although the prediction results in two scenarios differ, the differences are not significant in area. This is because the suitable slope for urban development which are considered in the environmental scenario, are already saturated (Figure 8), and the extent of green coverage is limited. Considering that many cities in Iran (Bihamta et al., 2015; Sakieh et al., 2015; Khammar and Heydari, 2016; Saeidi et al., 2018; Ghamari et al., 2019; Esfandeh et al., 2021) and outside of Iran (Jawarneh et al., 2015; Kumar and Agrawal, 2023) are affected by these two factors, the city of Zahedan shows a different pattern of growth in which other coefficients are more important. However, the findings presented bear resemblance to the research conducted by Jahanishakib and Erfani (2021) in a dry urban area in Iran. The analysis of satellite images and field visits also show marginalization without facilities such as asphalt roads, which shows the low effect of roads historically. This result is contrary to the results of some studies (Esfandeh et al., 2021; Salem et al., 2021) that show the special and different socio-economic context of this city. The value of marginal lands, which have been effective in the city’s expansion in other urban areas of Iran (Hoseini et al., 2016; Khammar and Heydari, 2016), have also been involved in Zahedan, in such a way that at every stage of the city’s growth, marginal lands acquire a higher value and encourage the growth of more of the city organically. The increase in the urban population of Zahedan is influenced by ethnic factors, religious attraction, commercial attraction, the concentration of more facilities and more job opportunities than in other parts of the province, religious beliefs for having children, etc., subsequently, the high demand for housing has continuously increased the value of marginal lands and increases the attraction for investment in construction.
Figure 8 shows well that the historical growth pattern fills the empty spaces inside the urban, similar to the findings of Esfandeh et al. (2021). The comparison of the two scenarios in this figure shows that the filling of empty spaces in the city is much more in the historical growth scenario than in the environmental scenario. This disparity can be justified by considering that some of the empty spaces are green spaces that are in exclusion layer of environmental scenario, and the chosen high spread ratio of 60, which surpasses the ratio of the historical growth scenario (49), poses an obstacle to the filling of empty spaces in the city. The urban growth pattern of Zahedan is in line with Jahanishakib and Erfani (2021) that showed that the growth of the city of Birjand, which has an ecological and social economic similarities with Zahedan, will also occur in the future mainly in the outskirts of the city and organically. Also, the study of Esfandeh et al. (2021) for the coastal Parsian city of Iran showed that the historical growth pattern of the city is organic.
Simulating historical scenario for urban growth that permitted ongoing urban area expansion in line with historical patterns, with no restrictions, and environmental scenario which considers some ecological factors and the growing need of the society to establish settlements, provides a wider decision-making space for decision-makers to guide the pattern of urban growth. It is expected that we will move from the scenario of historical growth to environmental growth, the most important characteristic of which is to prevent urban development in the green empty spots of the city. According to some (Liu et al., 2019), removing each of these scenarios without considering their effective role leads to unreasonable predictions in future constructions.
Contrary to most studies (Wang et al., 2012; Clarke and Johnson, 2020; Salem et al., 2021; Nadoushan, 2022), concerns such as the transformation of villages, agricultural lands, and forests into build-up areas caused by urban expansion were expressed, in the studied area, there are no villages, agricultural and forest lands, and even dense pastures around them, and there is a new concern in terms of the lack of ecological capacity and the severe lack of urban green space, which will become more intense in the future. This area is highly prone to the expansion of build-up areas due to socio-economic issues and not ecological capability. In such a way that even the drinking water of the region is supplied from the reservoirs of the Chah Nimeh of Sistan. Therefore, as expected for dry climates, the studied area has a very simple landscape, which is saturated in terms of suitable slopes for construction, and practically the city is not capable of development from the east. Contrary to numerous studies (Bihamta et al., 2015; Khammar and Heydari, 2016) where the slope is mentioned as an effective control factor, this factor will not play a significant role in guiding the urban growth pattern in the study area in the future. Considering the evenness landscape of the region, other information, such as aesthetic (Saeidi et al., 2018), ecosystem services (Li et al., 2018), etc. cannot be used in the exclusion layer or even instead of the slope layer. However, the prediction made according to the various calibration steps and model validation provided satisfactory results.
The extent and per capita of Zahedan’s green space is very small, which should be taken into consideration by the authorities considering the rapid growth of the city, especially in the scenario of historical growth that happens in filled mode. The increase in land prices also threatens the destruction of at least the green space, that in the scenario of environmental growth is clearly non-urban areas (white patches inside urban areas in Figure 9), which are mainly vegetation covers in the northern and central parts of the city, in the scenario of historical growth replaced by urban cover. If the historical trend of urban expansion persists, there will eventually be no space left for urban green space within city boundaries. This could lead to adverse environmental impacts, a decline in citizens’ quality of life, and pose challenges for urban management related to land ownership. Disproportion between infrastructures, such as roads, with urban expansion has highlighted that the demand for housing surpasses the urban management’s capacity to improve infrastructure. The inadequate coordination of infrastructure, such as roads, with urban expansion has highlighted that the demand for housing surpasses the urban management’s capacity to improve infrastructure. The marginalization resulting from the disadvantaged socio-economic status of marginalized individuals, along with decreased security, will worsen visual pollution, particularly at the city entrances, negatively impacting residents’ well-being and tourists’ perceptions.
Considering that understanding the interdependencies between urban growth patterns, infrastructure and socio-economic indicators, which is a step in achieving sustainable urban development (Mallouk et al., 2019; Benchelha et al., 2022), the results can help the decision makers to guide the pattern of urban growth, and at the same time, take measures to meet the growing needs of the population in terms of locating green spaces and urban facilities according to the expected urban expansion. In this regard, it is recommended to guide the urban growth model towards the environmental scenario, considering its greater compliance with the organic model.
The main strength of the study lies in selecting a less researched area with unique ecological conditions for investigation. The study also utilized the LCZ classifier, conducted a calibration process for the SLEUTH model, and validated its findings. Urban areas extracted from the LCZ classifier showed that the affected areas were characterized by built-up spaces, which can be considered as the ecological border of the city. During the calibration process, the model gradually narrows down the range of coefficients in each stage, thereby improving the accuracy of the results. This self-modification capability enables the model to better comprehend the dynamics and factors driving urban expansion, leading to more precise predictions of future growth. The validation of the model ensures that the simulated urban growth aligns with observed expansion patterns, thereby enhancing the model’s representation of real-world scenarios. However, a notable limitation of the study was the limited CPU capability of the PC used to run the model, which resulted in time-consuming processes. This limitation restricted both the study area and the number of runs available for sensitivity analysis and validation. Furthermore, while the SLEUTH model can consider multiple influencing factors, like other approaches (Salem et al., 2021), it is unable to incorporate certain important drivers such as political influences. Therefore, for future studies, it is suggested to perform Hybrid approaches that combined SLEUTH with other methods such as genetic algorithm (SLEUTH-GA) to speed up model execution and comparison of validity of different model. Likewise it is recommended to consider alternative scenarios that highlight the impact of the particular socio-economic conditions in the research location or comparable areas. Moreover, in regions where topographic factors have minimal influence, such as areas with gentle slopes or where developable spaces are already saturated in terms of slope, it is advised to substitute a different significant layer not originally included in the model input, rather than relying solely on the slope layer. It is advised to incorporate the findings of this study and other related research in future studies, such as examining the impact of expanding urban areas on urban ecosystem services.
In this study, The CA based SLEUTH model was used to predict the urban growth of Zahedan until 2050. Two scenarios, historical and environmental, were considered in a dry climate and an evenness landscape, including the city, rocky outcrops, and surrounding barren lands. The results showed that the SLEUTH model is effective in simple landscape with low effect of slope, where it is not possible to replace the slope layer with other layers, such as cognitive aesthetics or other ecosystem services. In both scenarios, intense urban development can be expected. However, the form of urban expansion in the historical growth scenario is more concerning due to the high probability of vegetation removal and a more scattered pattern of expansion.
Given the successful validation results of the SLEUTH model in the study region, it is suggested that this model be utilized in comparable areas with similar landscape and climate characteristics, where the role of economic, social and political factors is more meaningful than ecological factors. It is particularly advised to incorporate socio-economic factors into the model, such as in the exclusion layer or as a replacement for slope if its influence is minimal.
Prediction of urban growth was a study necessity in Zahedan that experiencing rapid growth rate and high immigration in arid areas with minimal urban vegetation cover. This is because predicting the development of urban green belts, green spaces, and parks is essential for managing these settlements, taking into account the size of the urban areas and the climate of the region. The development of infrastructure is also crucial for the areas predicted to experience city expansion, which is another way the findings can be utilized. This study emphasizes the importance of drawing the attention of officials to the future worsening of regional design problems. The findings can assist local officials and policymakers in creating successful strategies for managing urban growth according to socio-economic and environmental needs of citizens in Zahedan and other similar cities.
The raw data supporting the conclusions of this article will be made available by the authors, without undue reservation.
Ethical approval was not required for the studies involving humans because this study does not require the mentioned items. The studies were conducted in accordance with the local legislation and institutional requirements. Written informed consent for participation was not required from the participants or the participants’ legal guardians/next of kin in accordance with the national legislation and institutional requirements because this study does not require the mentioned items.
NS: Data curation, Formal analysis, Investigation, Software, Writing – original draft. ME: Data curation, Formal analysis, Investigation, Software, Writing – original draft, Conceptualization, Funding acquisition, Methodology, Project administration, Resources, Supervision, Validation, Visualization, Writing – review & editing. FJ: Conceptualization, Investigation, Methodology, Project administration, Software, Validation, Writing – review & editing, Formal analysis, Supervision, Visualization.
The author(s) declare financial support was received for the research, authorship, and/or publication of this article. The authors report administrative and non-financial support was provided by the University of Zabol under grant number IR-UOZ-GR-4956.
This paper is from a M.Sc. student thesis.
The authors declare that the research was conducted in the absence of any commercial or financial relationships that could be construed as a potential conflict of interest.
All claims expressed in this article are solely those of the authors and do not necessarily represent those of their affiliated organizations, or those of the publisher, the editors and the reviewers. Any product that may be evaluated in this article, or claim that may be made by its manufacturer, is not guaranteed or endorsed by the publisher.
Akın, A., Clarke, K. C., and Berberoglu, S. (2014). The impact of historical exclusion on the calibration of the SLEUTH urban growth model. Int. J. Appl. Earth Obs. Geoinf. 27, 156–168. doi: 10.1016/j.jag.2013.10.002
Asadullah, M., and Muhammad, C. M. (2000). An exploratory use of SLEUTH urban growth model in the spatiotemporal growth simulation of greater Karu urban area. Int. J. Eng. Sci. Comput 10, 24420–24426. doi: 10.6084/m9.figshare.11674125
Ayazli, I. E. (2020). Using the Total exploratory factor analysis (T-EFA) as a calibration technique for SLEUTH model. Int. Arch. Photogramm. Remote Sens. Spat. Inf. Sci. XLIV-4/W3-2020, 44, 85–88. doi: 10.5194/isprs-archives-XLIV-4-W3-2020-85-2020
Bajracharya, P., Lippitt, C. D., and Sultana, S. (2020). Modeling urban growth and land cover change in Albuquerque using SLEUTH. Prof. Geogr. 72, 181–193. doi: 10.1080/00330124.2019.1674668
Bechtel, B., Alexander, P. J., Böhner, J., Ching, J., Conrad, O., Feddema, J., et al. (2015). Mapping local climate zones for a worldwide database of the form and function of cities. ISPRS Int. J. Geo Info. 4, 199–219. doi: 10.3390/ijgi4010199
Benchelha, N., Bezza, M., Belbounaguia, N., Benchelha, S., and Benchelha, M. (2022). Modeling dynamic urban growth using cellular automata and geospatial technique: case of Casablanca in Morocco. Int. J. Geoinform. 18, 27–40. doi: 10.52939/ijg.v18i5.2369
Bihamta, N., Soffianian, A., Fakheran, S., and Gholamalifard, M. (2015). Using the SLEUTH urban growth model to simulate future urban expansion of the Isfahan metropolitan area, Iran. J. Indian Soc. Remote Sens. 43, 407–414. doi: 10.1007/s12524-014-0402-8
Bose, A., and Chowdhury, I. R. (2020). Monitoring and modeling of spatio-temporal urban expansion and land-use/land-cover change using markov chain model: a case study in Siliguri metropolitan area, West Bengal. India. Model. Earth Syst. Environ. 6, 2235–2249. doi: 10.1007/s40808-020-00842-6
Chaudhuri, G., and Clarke, K. C. (2013). The SLEUTH land use change model: a review. Int. J. Environ. Resour. Res. 1, 88–104. doi: 10.22069/ijerr.2013.1688
Clarke, C. K., Hoppen, S., and Gaydos, L. (1997). A self-modifying cellular automaton model of historical urbanization in the San Francisco Bay area. Environment and planning B: Planning and design 24, 247–261.
Clarke, K. C., and Gaydos, L. J. (1998). Loose-coupling a cellular automaton model and GIS: long-term urban growth prediction for San Francisco and Washington/Baltimore. Int. J. Geogr. Inf. Sci. 12, 699–714. doi: 10.1080/136588198241617
Clarke, K. C., and Johnson, J. M. (2020). Calibrating SLEUTH with big data: projecting California’s land use to 2100. Comput. Environ. Urban. Syst. 83:101525. doi: 10.1016/j.compenvurbsys.2020.101525
Dadashpoor, H., Azizi, P., and Moghadasi, M. (2019). Analyzing spatial patterns, driving forces and predicting future growth scenarios for supporting sustainable urban growth: evidence from Tabriz metropolitan area. Iran. Sustain. Cities Soc. 47:101502. doi: 10.1016/j.scs.2019.101502
Dadashpoor, H., and Salarian, F. (2020). Urban sprawl on natural lands: analyzing and predicting the trend of land use changes and sprawl in Mazandaran city region, Iran. Environ. Dev. Sustain. 22, 593–614. doi: 10.1007/s10668-018-0211-2
Dietzel, C., and Clarke, K. (2006). The effect of disaggregating land use categories in cellular automata during model calibration and forecasting. Comput. Environ. Urban. Syst. 30, 78–101. doi: 10.1016/j.compenvurbsys.2005.04.001
Dietzel, C., and Clarke, K. C. (2007). Toward optimal calibration of the SLEUTH land use change model. Trans. GIS 11, 29–45. doi: 10.1111/j.1467-9671.2007.01031.x
Du, R. (2016). Urban growth: changes, management, and problems in large cities of Southeast China. Front. Archit. Res. 5, 290–300. doi: 10.1016/j.foar.2016.04.002
Esfandeh, S., Danehkar, A., and Salmanmahini, A. (2021). Simulation and prediction of urban growth pattern until 2050 using SLEUTH-3R model (case study: coastal area of Parsian city). J. Environ. Stud. 47, 65–88. doi: 10.22059/jes.2021.324700.1008185
Fathi Taperasht, A., Shafizadeh-Moghadam, H., and Kouchakzadeh, M. (2022). Spatial-temporal analysis of Iran’s climatic classification based on Domarten method and Mann-Kendall test in the statistical period of 1995-2019. Environ. Sci. 20, 137–154. doi: 10.52547/envs.2021.1105
Feng, H.-H., Liu, H.-P., and LÜ, Y. (2012). Scenario prediction and analysis of urban growth using SLEUTH model. Pedosphere 22, 206–216. doi: 10.1016/S1002-0160(12)60007-1
Gemitzi, A. (2021). Predicting land cover changes using a CA Markov model under different shared socioeconomic pathways in Greece. GISci. Remote Sens. 58, 425–441. doi: 10.1080/15481603.2021.1885235
Ghamari, L., Kianysadr, M., and Monavari, S. M. (2019). Evaluation of the desirability of high-rise buildings with FANP model and SLUTH-GA model (case study; Tehran 22 area-Chitgar). J. Environ. Sci. Stud. 4, 1623–1635. Available at: https://www.jess.ir/article_95566.html?lang=en
Guan, D., He, X., He, C., Cheng, L., and Qu, S. (2020). Does the urban sprawl matter in Yangtze River Economic Belt, China? An integrated analysis with urban sprawl index and one scenario analysis model. Cities 99:102611. doi: 10.1016/j.cities.2020.102611
Hajibabaei, S., and Zakerhaghighi, K. (2017). “A simulation of land use change in Hamadan in 2040 using cellular automation and data mining method” support vector vectorization and fuzzy automated cells. Hum. Geogr. 76, 99–113. doi: 10.22067/gusd.v4i1.55638
Hastie, T., Tibshirani, R., Friedman, J. H., and Friedman, J. H. (2009). The elements of statistical learning: Data mining, inference, and prediction. New York: Springer. Springer.
Hoseini, M., Karimi, M., Saadi Mesgari, M., and Heydary, M. (2016). Design and implementation of integrated system for urban land use change modeling. J. Appl. Res. Geogr. Sci. 16, 69–91.
Huang, J., Zhang, J., and Lu, X. X. (2008). Applying sleuth for simulating and assessing urban growth scenario based on time series tm images: referencing to a case study of Chongqing, China. Int. Arch. Photogramm. Remote. Sens. Spat. Inf. Sci. 37, 597–606.
Inouye, C. E. N., de Sousa Jr, W. C., De Freitas, D. M., and Simões, E. (2015). Modelling the spatial dynamics of urban growth and land use changes in the north coast of São Paulo, Brazil. Ocean Coast. Manag. 108, 147–157. doi: 10.1016/j.ocecoaman.2014.12.016
Jahanishakib, F., and Erfani, M. (2021). Simulation of urban land use growth scenarios using the cellular automata method of SLEUTH. J. Environ. Stud. 47, 245–266. doi: 10.22059/jes.2021.328447.1008215
Jawarneh, R. N., Julian, J. P., and Lookingbill, T. R. (2015). The influence of physiography on historical and future land development changes: a case study of Central Arkansas (USA), 1857–2030. Landsc. Urban Plan. 143, 76–89. doi: 10.1016/j.landurbplan.2015.06.010
Kawiani, A., Farhudi, R., and Rajabi, A. (2018). Urban growth and its influencing factors. Geography 15, 21–36.
Khammar, G., and Heydari, A. (2016). Evaluation of smart urban growth pattern in iranian newtowns’point on sadra newtown using sleuth model 16, 253–270. Available at:: http://geographical-space.iau-ahar.ac.ir
Koko, A. F., Yue, W., Abubakar, G. A., Hamed, R., and Alabsi, A. A. N. (2020). Monitoring and predicting spatio-temporal land use/land cover changes in Zaria City, Nigeria, through an integrated cellular automata and markov chain model (CA-Markov). Sustain. For. 12:10452. doi: 10.3390/su122410452
Kumar, V., and Agrawal, S. (2023). Urban modelling and forecasting of land use using SLEUTH model. Int. J. Environ. Sci. Technol. 20, 6499–6518. doi: 10.1007/s13762-022-04331-4
Kuo, H.-F., and Tsou, K.-W. (2017). Modeling and simulation of the future impacts of urban land use change on the natural environment by SLEUTH and cluster analysis. Sustain. For. 10:72. doi: 10.3390/su10010072
Li, F., Wang, L., Chen, Z., Clarke, K. C., Li, M., and Jiang, P. (2018). Extending the SLEUTH model to integrate habitat quality into urban growth simulation. J. Environ. Manag. 217, 486–498. doi: 10.1016/j.jenvman.2018.03.109
Liu, Y., Li, L., Chen, L., Cheng, L., Zhou, X., Cui, Y., et al. (2019). Urban growth simulation in different scenarios using the SLEUTH model: a case study of Hefei, East China. PLoS One 14:e0224998. doi: 10.1371/journal.pone.0224998
Mahini, A. S., and Gholamalifard, M. (2007). Dynamic spatial modeling of urban growth through cellular automata in a GIS environment. Int. J. Environ. Res\. 1, 272–279. doi: 10.22059/IJER.2010.137
Mahmoudzadeh, H., Vahedi Aghjea, A., and Herischian, M. (2019). Application of scenario based SLEUTH model for urban growth simulation (case study: Tabriz metropolitan area). Geogr. Urban Plan. Res. 7, 553–580. doi: 10.22059/jurbangeo.2019.279136.1085
Mallouk, A., Elhadrachi, H., Malaainine, M. E. I., and Rhinane, H. (2019). Using the SLEUTH urban growth model coupled with a GIS to simulate and predict the future urban expansion of Casablanca region, Morocco. Int. Arch. Photogramm. Remote Sens. Spat. Inf. Sci. XLII-4/W12, 42, 139–145. doi: 10.5194/isprs-archives-XLII-4-W12-139-2019
Mustak, S., Baghmar, N. K., Singh, S. K., and Srivastava, P. K. (2022). Multi-scenario based urban growth modeling and prediction using earth observation datasets towards urban policy improvement. Geocarto Int. 37, 18275–18303. doi: 10.1080/10106049.2022.2138983
Nadoushan, M. A. (2022). Advancing urban planning in arid agricultural-urbanized landscapes of Iran: spatial modeling evidence from a rapidly developing region. Sustain. Cities Soc. 87:104230. doi: 10.1016/j.scs.2022.104230
Pathirana, A., Denekew, H. B., Veerbeek, W., Zevenbergen, C., and Banda, A. T. (2014). Impact of urban growth-driven landuse change on microclimate and extreme precipitation—a sensitivity study. Atmos. Res. 138, 59–72. doi: 10.1016/j.atmosres.2013.10.005
Pontius, R. G., Boersma, W., Castella, J. C., Clarke, K., de Nijs, T., Dietzel, C., et al. (2008). Comparing the input, output, and validation maps for several models of land change. Ann. Reg. Sci., 11–37. doi: 10.1007/s00168-007-0138-2
Rafiee, R., Mahiny, A. S., and Khorasani, N. (2009a). Assessment of changes in urban green spaces of Mashad city using satellite data. Int. J. Appl. Earth Obs. Geoinf. 11, 431–438. doi: 10.1016/j.jag.2009.08.005
Rafiee, R., Mahiny, A. S., Khorasani, N., Darvishsefat, A. A., and Danekar, A. (2009b). Simulating urban growth in Mashad City, Iran through the SLEUTH model (UGM). Cities 26, 19–26. doi: 10.1016/j.cities.2008.11.005
Rasouli, M. (2016). Determination of coefficient affecting urban growth in SLEUTH model for Ali Abad, Ramiyan and Azadshahr regions. Geogr. Plan. Sp. 6, 1–12. Available at: https://gps.gu.ac.ir/article_41668.html?lang=en
Saeidi, S., Mirkarimi, S. H., Mohammadzadeh, M., Salmanmahiny, A., and Arrowsmith, C. (2018). Designing an integrated urban growth prediction model: a scenario-based approach for preserving scenic landscapes. Geocarto Int. 33, 1381–1397. doi: 10.1080/10106049.2017.1353647
Sakieh, Y., Amiri, B. J., Danekar, A., Feghhi, J., and Dezhkam, S. (2015). Simulating urban expansion and scenario prediction using a cellular automata urban growth model, SLEUTH, through a case study of Karaj City. Iran. J. Hous. Built Environ. 30, 591–611. doi: 10.1007/s10901-014-9432-3
Salem, M., Bose, A., Bashir, B., Basak, D., Roy, S., Chowdhury, I. R., et al. (2021). Urban expansion simulation based on various driving factors using a logistic regression model: Delhi as a case study. Sustainability 13:10805. doi: 10.3390/su131910805
Satari, N., Erfani, M., and Jahanishakib, F. (2023). Efficiency assessment of micro-climate change in land cover distinguishing compared to some supervised classification techniques for an arid urban environment. J. RS GIS Nat. Resour. 1:5. doi: 10.30495/girs.2023.689922
Satari, N., Erfani, M., and Jahanishakib, F. (2024). Comparison of the efficiency of local climatic zone algorithm in separating built-up area compared to built-up indices. Iran. J. Remote Sens. GIS, 15, 1–16. doi: 10.48308/gisj.2022.102576
Saxena, A., and Jat, M. K. (2019). Capturing heterogeneous urban growth using SLEUTH model. Remote Sens. Appl. Soc. Environ. 13, 426–434. doi: 10.1016/j.rsase.2018.12.012
Saxena, A., and Jat, M. K. (2020). Land suitability and urban growth modeling: development of SLEUTH-suitability. Comput. Environ. Urban. Syst. 81:101475. doi: 10.1016/j.compenvurbsys.2020.101475
Shahnavashi, Y., Anvari, M. R., and Karimian Bostani, M. (2021). Explain and prioritization the livability of urban region (case study: Zahedan City). Geography (Regional Planning) 10, 613–630.
Shi, Y., Wu, J., and Shi, S. (2017). Study of the simulated expansion boundary of construction land in Shanghai based on a SLEUTH model. Sustainability 9:876. doi: 10.3390/su9060876
Silva, E. A., and Clarke, K. C. (2002). Calibration of the SLEUTH urban growth model for Lisbon and Porto. Portugal. Comput. Environ. Urban Syst. 26, 525–552. doi: 10.1016/S0198-9715(01)00014-X
Silva, E. A., and Clarke, K. C. (2005). Complexity, emergence and cellular urban models: lessons learned from applying SLEUTH to two Portuguese metropolitan areas. Eur. Plan. Stud. 13, 93–115. doi: 10.1080/0965431042000312424
Soufi, M., Behzadi, S., and Aghamohammadi, H. (2018). Developing a baseline approach for modeling land use change. J. Geomatics Sci. Technol. 7, 103–118. Available at: http://jgst.issgeac.ir/article-1-654-en.html
Thamaga, K. H., Dube, T., and Shoko, C. (2022). Evaluating the impact of land use and land cover change on unprotected wetland ecosystems in the arid-tropical areas of South Africa using the Landsat dataset and support vector machine. Geocarto Int. 37, 10344–10365. doi: 10.1080/10106049.2022.2034986
The I.R. of Iran Meteorological Organization. (2022). Weather data request system. Available at: https://data.irimo.ir/
The Iran Social Science Data Portal. (2024). Population and households, by provinces and cities. Available at: https://irandataportal.syr.edu/census/census-2016
Triantakonstantis, D., and Mountrakis, G. (2012). Urban growth prediction: a review of computational models and human perceptions. J. Geog. Inform. Syst. 4, 555–587. doi: 10.4236/jgis.2012.46060
UN (2018). World urbanization prospects: The 2018 revision. New York: United Nations Publications. Available at: https://esa.un.org/unpd/wup/
Wang, L., Li, C., Ying, Q., Cheng, X., Wang, X., Li, X., et al. (2012). China’s urban expansion from 1990 to 2010 determined with satellite remote sensing. Chin. Sci. Bull. 57, 2802–2812. doi: 10.1007/s11434-012-5235-7
Xian, G., and Crane, M. (2005). Assessments of urban growth in the Tampa Bay watershed using remote sensing data. Remote Sens. Environ. 97, 203–215. doi: 10.1016/j.rse.2005.04.017
Yang, J., Gong, J., Tang, W., and Liu, C. (2020). Patch-based cellular automata model of urban growth simulation: integrating feedback between quantitative composition and spatial configuration. Comput. Environ. Urban. Syst. 79:101402. doi: 10.1016/j.compenvurbsys.2019.101402
Yang, X., and Lo, C. P. (2003). Modelling urban growth and landscape changes in the Atlanta metropolitan area. Int. J. Geogr. Inf. Sci. 17, 463–488. doi: 10.1080/1365881031000086965
Yu, D., Yanxu, L., and Bojie, F. (2019). Urban growth simulation guided by ecological constraints in Beijing city: methods and implications for spatial planning. J. Environ. Manag. 243, 402–410. doi: 10.1016/j.jenvman.2019.04.087
Keywords: land use change, urban expansion, spatial simulation, scenario building, urban environmental management, cellular automata (CA), spatial dynamics
Citation: Satari N, Erfani M and Jahanishakib F (2024) Modeling urban expansion in Zahedan’s dry climate: insights from the SLEUTH model. Front. Sustain. Cities. 6:1357350. doi: 10.3389/frsc.2024.1357350
Edited by:
Jianquan Cheng, Manchester Metropolitan University, United KingdomReviewed by:
Do Ngoc Khanh, Tokyo Institute of Technology, JapanCopyright © 2024 Satari, Erfani and Jahanishakib. This is an open-access article distributed under the terms of the Creative Commons Attribution License (CC BY). The use, distribution or reproduction in other forums is permitted, provided the original author(s) and the copyright owner(s) are credited and that the original publication in this journal is cited, in accordance with accepted academic practice. No use, distribution or reproduction is permitted which does not comply with these terms.
*Correspondence: Malihe Erfani, bWFsaWhlZXJmYW5pQHVvei5hYy5pcg==
Disclaimer: All claims expressed in this article are solely those of the authors and do not necessarily represent those of their affiliated organizations, or those of the publisher, the editors and the reviewers. Any product that may be evaluated in this article or claim that may be made by its manufacturer is not guaranteed or endorsed by the publisher.
Research integrity at Frontiers
Learn more about the work of our research integrity team to safeguard the quality of each article we publish.