 Anil Kumar Roy
 Meghnad Saha
- 1Faculty of Planning, Center for Environmental Planning and Technology (CEPT) University, Ahmedabad, Gujarat, India
- 2Ernst & Young LLP, Kolkata, West Bengal, India
Gujarat has been one of the leading states in India as far as the levels of urbanization are concerned. This is due to its pull factors attracting migrations from outside the state. However, the urban population is concentrated in a few districts dominated by large urban centers such as Ahmedabad, Surat, Rajkot, Vadodara, Bhavnagar and Jamnagar. The levels of urbanization in Gujarat have been higher than the national average throughout independent India. It has also experienced rapid urban growth of population during the same period, but the recently emerging concentration and pattern of urbanization have been lopsided, meaning that a few districts contributes more than half of the total urban population of the state. Literature in the thematic areas of urbanization particularly in Gujarat are few and limited. The studies so far have discussed about the impact of globalization and urbanizations, trends and patters of urbanization, dynamics of urban development and migration in Gujarat. This study particularly focuses on establishing a link between migration and urbanization using district level data on urbanization. This study is unique in the sense that previous studies have failed to capture the interstate migration and levels of urbanization in the state of Gujarat in India. Recent census data show a substantial increase in the census towns in Gujarat in the vicinity of the developed corridor and within the influence areas of large metropolitan cities. This paper aims to analyze the trends and emerging patterns in the levels of urbanization at the district level. It attempts to understand the inequalities in the distribution of urban population using the GINI coefficient of different size-class towns during the 2001 and 2011 censuses. It also tries to map the distribution of the urban population at the district level to show the emerging pattern. Emerging trends and the existing network of the census towns of 2011 have also been mapped to provide the idea of regional distribution. The existing urbanization pattern in Gujarat matches with the industrial development. It reminds colonial experiences of induced industrialization, attracting colossal in-migration and higher urbanization. The migration pattern during the last two census periods shows that respective districts of the above-mentioned cities are attracting in-migration due to the early post-independence industrialization period. We have calculated the net contribution from migration to the levels of urbanization using D-2 Series migration data from the census of India for the years 2001 and 2011. It shows that Central Gujarat, Saurashtra and South Gujarat have gained more due to migrations from other states to sustain their industrial development, leading to rapid and higher levels of urbanization in these regions. However, the future of urbanization in the state will depend on carefully selecting industrial activities that are sustainable in the long run.
1. Introduction
Migration and urbanization go hand in hand in the Indian context. However, in-situ urbanization has been a new phenomenon in recent decades. Migration is a component of the levels of urbanization along with the natural increase in the urban populations in a given geography. It is not to blame migration for being entirely responsible for urbanization in India. Migration is not the only cause of urbanization! The component of urban growth, or we may call it the process of urbanization, are: (1) natural increase in urban population; (2) net migration to an urban area; (3) reclassification of settlements as towns or their declassification because of changes in economic activities and acquiring urban characteristics; (4) the extension of boundaries of the cities and towns.
Levels of urbanization in Gujarat have traditionally been higher than the national average ever since the beginning of the last Century (Kundu, 2000). It has been led by the industrial and infrastructure development in the state resulting in a typical colonial pattern of urbanization (Mahadevia, 2014). However, the urban population in the state has been concentrated in a few cities, where large-scale industrial and infrastructure development has already taken place. The pattern of urbanization in terms of the distribution of the urban population is therefore skewed, showing increasing regional disparity in the levels of urbanization (Kundu, 2011). According to the (Census of India, 2011), Gujarat is the 6th most urbanized state in India, next to Goa (62.17 per cent), Mizoram (51.51 per cent), Tamil Nadu (48.39 per cent), Kerala (47.70 per cent) and Maharashtra (45.23 per cent) with 43 per cent of its population living in 329 towns and cities accounting for 25 million urban population in the state. There has been a rapid growth in the urban population in the state post-independence until 1981 after that it has slowed down till 2011. However, there has not been any sign of a slower growth rate of the urban population in the large urban agglomerations in the state in the last few decades.
The pattern of urban population distribution is highly skewed in favor of large cities where Class I cities of the state have 71 per cent of the total urban population. It further gets concentrated as 53 per cent of the entire urban population of Gujarat comes from only the four largest cities in the states, i.e., from Ahmedabad, Surat, Vadodara, and Rajkot. Regional disparity in the size class distribution of urban population has been accentuated between the last two censuses during 2001 and 2011 as the Gini coefficient has increased from 0.6760 to 0.7222, respectively. It implies that the urban population in the large cities is growing more rapidly than their counterparts in small and medium towns in Gujarat. The urban population in the state are also concentrated along the major highways due to industrialization and large-scale infrastructure development (Kundu et al., 1999). However, a recent pattern of the distribution of urban pupation is spreading toward Saurashtra, and coastal regions of Gujarat as the focus of industrial and infrastructure projects are in these regions. This pattern results from the rapid development of various industry and infrastructure projects due to foreign and domestic investment in the state, particularly in the newly emerging industrial corridors. These types of capital flow are inducing the rapid urbanization in the state (Mahadevia, 2014).
There are limited studies so far done to understand the contribution of migrations to the overall urbanization in the state and the emerging trends and patterns. The previous studies so far have dealt with the impact of globalization on urban development in the state, industrialization (Unni et al., 2001) and resultant urbanization, migration and dynamics of overall urban development in the state. There has not been any attempt to understand the regional pattern of urbanization in the state. Therefore, this study has the following objectives to explore and provide policy implications. This study aims to understand how the trends and urbanization patterns have emerged in Gujarat during the last two censuses (2001–2011). The paper also tries to examine the spatial distribution of urban populations using GIS techniques at the district level. It has measured the inequality of urbanization across the size class of the cities and towns in Gujarat. However, it has also captured the net contribution of migration to the levels of urbanization at both the state and district-level and has mapped the pattern. Last but not the least, it tries to provide a few policy implications for sustainable urban development in the states.
2. Methodology and database
The trends in the level of urbanization of the Gujarat state have been calculated using percentage urban population data from the respective censuses during a more extended period, i.e., 1901 to 2011. Further, the decadal growth rate of the urban population has been calculated using post-independent censuses beginning 1951 to 2011. Per cent growth (Straight line) rate has been calculated using in percentage change using the following formula:
Where: Vpresent = Value of the current year; Vpast = Value of the previous year.
For the calculation of dispersal and concentration of urban population in size-class towns, we have used the Gini Concentration Index in this study. One of the dimensions of the urbanization process is the concentration of the urban population in a few urban centers. Concentration refers to the unevenness in the distribution of the urban population dominated by the large cities, in this case, Class I cities. The following formula has been used to calculate Gini Coefficient for the number of towns across size class and their respective urban population in 2001 and 2011 respectively. The higher value of the Gini coefficient shows a higher concentration.
• Xi = cumulative proportion of urban population
• Yi = cumulative proportion of urban localities
• n = number of urban localities.
Using GIS mapping techniques, the percentage urban population of each district between the last two censuses, i.e., in the years 2001 and 2011, respectively, have been mapped to understand the regional concentration of the urban population. In place of any defined regional boundary at the sub-provincial level, district boundaries are considered the state's political regions. The distribution of census towns (non-statutory urban areas) has been represented at regional levels by combining the districts into four broad regions at the sub-provincial levels. The following scheme illustrates the various regions of Gujarat (see Table 1).
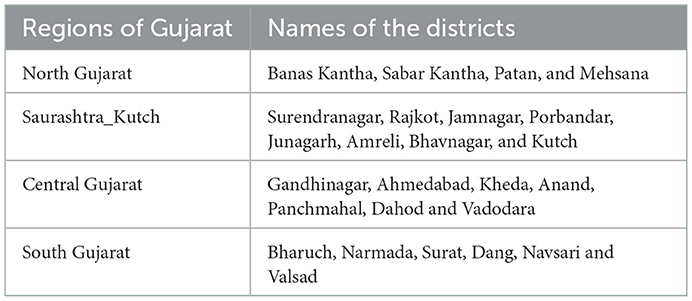
Table 1. Regions of Gujarat with their district names.
An attempt has also been made to map the location of different class size cities and see their clustering effects. GIS mapping has been used to plot the cities of different class-sized using Census data from 2001 and 2011.
Finally, this paper also calculated the net contribution of migrations (inter-state and intra-state) to the state's urbanization and for each district during the period of the last two censuses, i.e. 2001 and 2011.
2.1. The net contribution of urbanization from migration
For the net contribution of urbanization considering the onward minus reverse migration for a decade's areas for both sexes, among intra- district migrants by last residence (Duration 0–9 years), the following equation has been used.
• NM = (MD/PD) *100
• NM = Net contribution of urbanization from migration
• MD = difference of inter-state migration from rural to urban and urban to rural
• PD = difference of district urban population from last decades.
To better understand the contribution of migration to urbanization, it is crucial to know the various streams of internal migration. They are rural to rural, rural to urban, urban to rural and urban to urban. Amongst these streams, the rural to urban migrations add to the urban population; however, the reverse migration from urban to rural depletes the same hence the net balance of these two streams is the net contribution of migration to the urban population or the levels of urbanization of a given politico-geographical unit (Bhagat and Mohanty, 2009). The distribution of the districts with a net contribution of migration to urbanization has also been mapped to understand the emerging pattern in Gujarat.
3. Trends in levels of urbanization in Gujarat, 1901 to 2011
Gujarat has been more urbanized than most of the states in India ever since the dawn of the 20th Century. The levels of urbanization in terms of the percentage of urban population to the total population in Gujarat were 22 per cent in 1901 while India's level of urbanization was only 11 per cent (see Figure 1). Registering a decline of 3.08 percentage points from the previous decade in 1911, it reached 27 per cent in 1951. It declined marginally to 26 per cent in 1961, the year Gujarat became a separate state from the Bombay Presidency. Since then, it has always shown an increasing trend in the level of urbanization reaching 43 per cent in the last census, i.e., 2011. The present rate of urbanization in Gujarat is low and decelerating over time (Kundu, 2000). Workers' arrival from another state is an essential factor responsible for the pace of urbanization. The state has a high net in-migration rate in rural and urban areas (Kundu and Gupta, 1996).
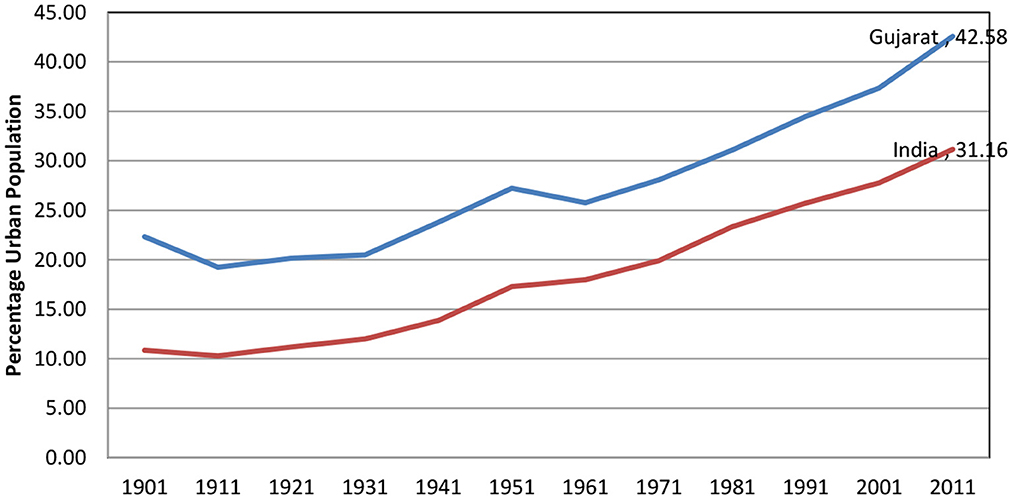
Figure 1. Levels of Urbanization in Gujarat-1901 to 2011. Source: Computed from Census of India respective years from 1901 to 2011.
However, the growth rate of the urban population in the state has decelerated in recent decades compared to the growth rate of the urban population in India (Kundu, 2000), which has slightly picked up in the last census. The decadal urban growth of Gujarat resembles that of the decadal urban growth rate of India (see Table 2).
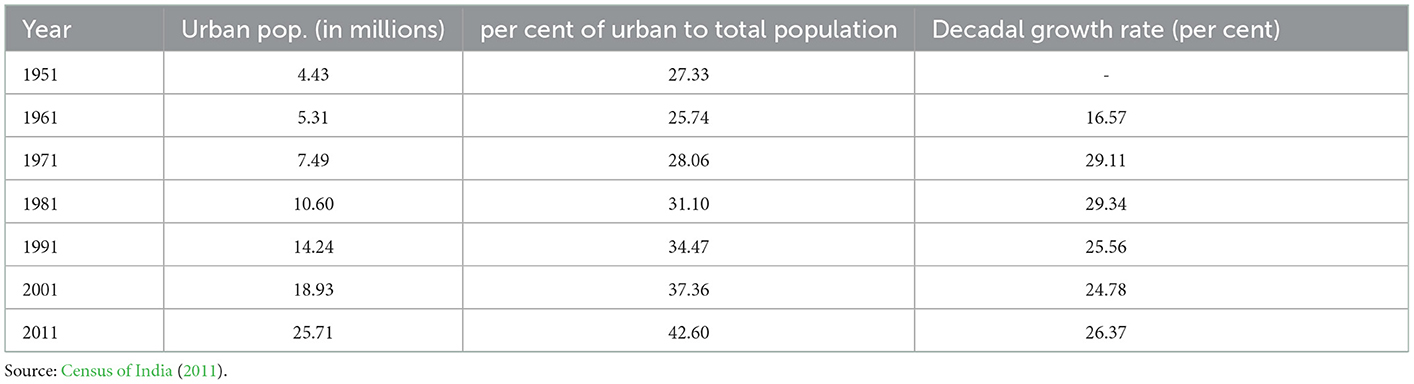
Table 2. Decadal growth rate of urban population, Gujarat-1951 to 2011.
Table 2 provides decadal urban growth in Gujarat between 1951 and 2011. It is observed that more than two million urban population were added during the first decade of formation of the state of Gujarat from erstwhile Bombay State in 1961, registering a growth rate of 29.11 per cent between 1961 and 1971. During this decade, Gujarat state focused on backward area development while establishing industrial estates in each district to attract employment. It led to massive migration from rural areas to urban areas of Gujarat, soon consolidating the industrialization in backward areas in 1981 (Hirway, 1995).
The decadal growth rate of the urban population in Gujarat has been consistently increasing till it reached its peak in 1981, registering an ever-highest growth rate of 29.34 per cent from the previous decade. The urban population's growth rate started declining in 2001 with 24.78 per cent growth. There has been a slight acceleration in the urban population's growth rate during the last decade, which increased to 26.37 per cent in 2011. One of the reasons for this acceleration is the increase in the number of census towns during the last decade. However, industrial investment in Saurashtra and Kutch regions has also increased the urban population due to the in-migration of labor from within and outside the state (Jariwala, 2015).
4. Urbanization across the various size class of towns in Gujarat
Table 3 shows the number and share of the urban population in the census size of towns in Gujarat between 2001 and 2011. Class IV towns have registered the highest increase since the last census (2001–11). The correspondingly share of the urban population in this class town has not increased substantially, indicating that these were the large villages and small towns that had just acquired the status of class IV towns. This phenomenon is also true for Class V and Class VI towns of Gujarat, where their numbers have increased substantially but do not reflect the corresponding increase in the share of the urban population as compared to the last census in 2001. It implies that a substantial increase in the percentage of the urban population has been registered only by the Class I towns, from 65.54 per cent in 2001 to 71.42 per cent in 2011, while Class II and III towns have shown a declining share of the urban population even though their numbers have also increased during the same period, this is called hyper urbanization (Awasthi, 2021).
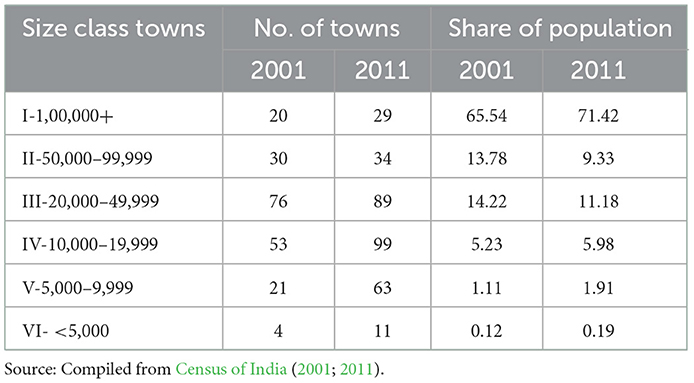
Table 3. Number of towns and share of the population, Gujarat-2001 to 2011.
More than two-third of the total urban population is concentrated in Class I cities of Gujarat. In other words, 71.42 per cent of the total urban population is concentrated only in 29 class I cities in Gujarat. One of the prime reasons for the hyper urbanization is better employment opportunities and basic urban infrastructures being available in the big cities of Gujarat compared to the small and medium sizes of the town (Bhagat, 2011). These Class I cities are also traditional urban center of trade and commerce for the rural hinterland.
It is expected that with infrastructure development and better connectivity to rural hinterland, this urbanization will spread out, reducing the regional concentration. However, this is not the case in Gujarat. We have worked out a GINI – coefficient of the size class-wise urban population between 2001 and 2011 (see Tables 4, 5). The result shows that the GINI Coefficient has increased, implying that the distribution of the urban population in Gujarat has further concentrated in Class I cities. In other words, the urban population in Gujarat is highly skewed (in favor of large cities). The concentration of the urban population has further increased during the last census.
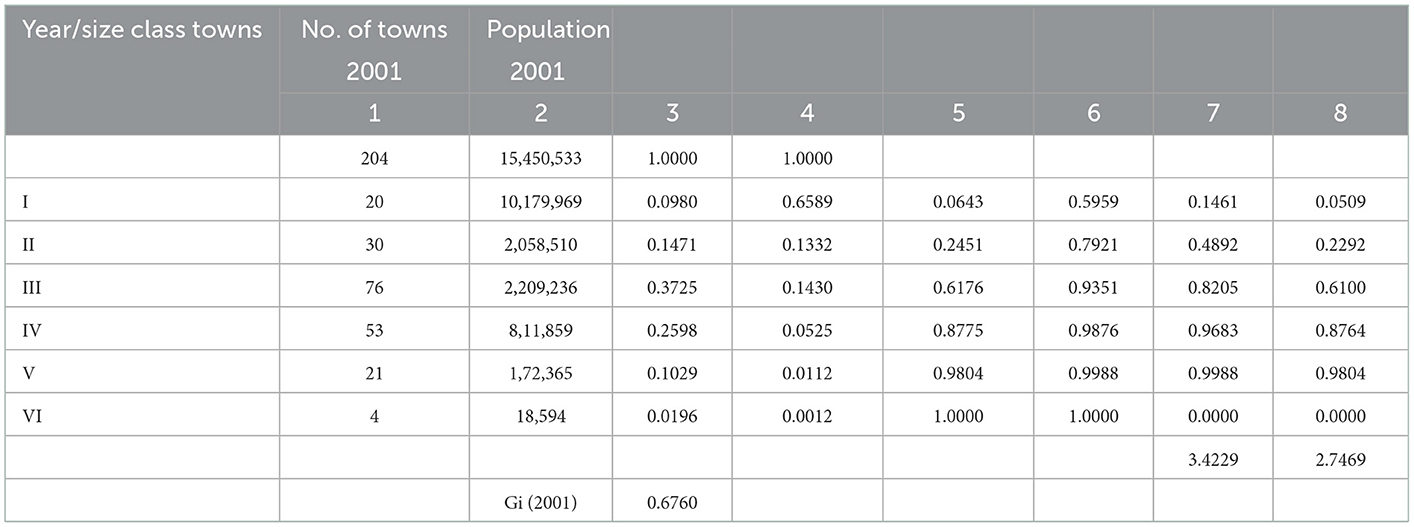
Table 4. Gini co-efficient of size class towns-2001.
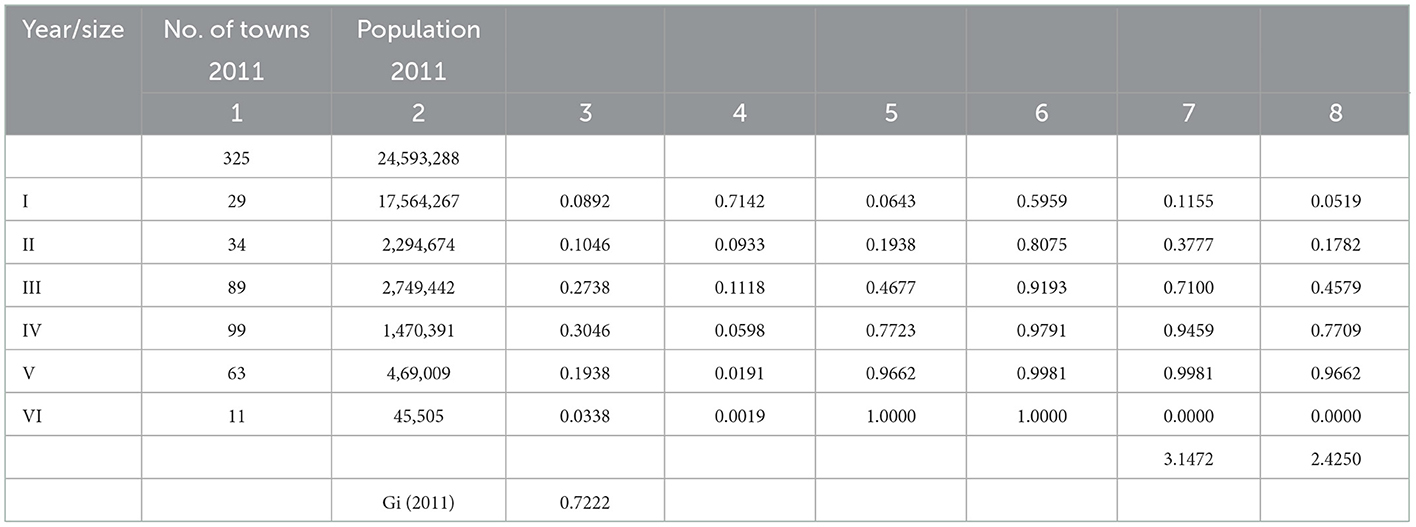
Table 5. Gini co-efficient of size class towns-2011.
5. Metropolitanization in Gujarat
Table 6 shows the share of the urban population of 4 metropolitan cities of Gujarat between 2001 and 2011. It also shows the growth rate of the urban population during the same period among these four largest cities in the state. More than half (53 per cent) of the total urban population of Gujarat lives in these four metropolitan cities, namely Ahmedabad, Surat, Vadodara, and Rajkot. While the share of Vadodara and Rajkot has declined marginally, those of Ahmedabad and Surat have increased. The share of the urban population of Surrat to the total urban population of the state has increased from 15.75 per cent in 2001 to 18.17 per cent in 2011, registering the highest increase in the share of urban population among the metropolitan cities of Gujarat. Surat has emerged as one of the major industrial and commercial centers in south Gujarat in recent years. Textile manufacturing and other small and medium industries developed in an organized manner, such as Technopark, along with its diamond processing industrial clusters, have attracted many migrants from within and outside of the state during the last decade. The other emerging metropolitan cities in Gujarat are Jamnagar and Bhavnagar, where industrialization has been promoted, creating a demand for labor, thereby increasing the urban population of these urban centers. Reliance industries and ESSAR petrochemical industries are creating significant job opportunities in Jamnagar.
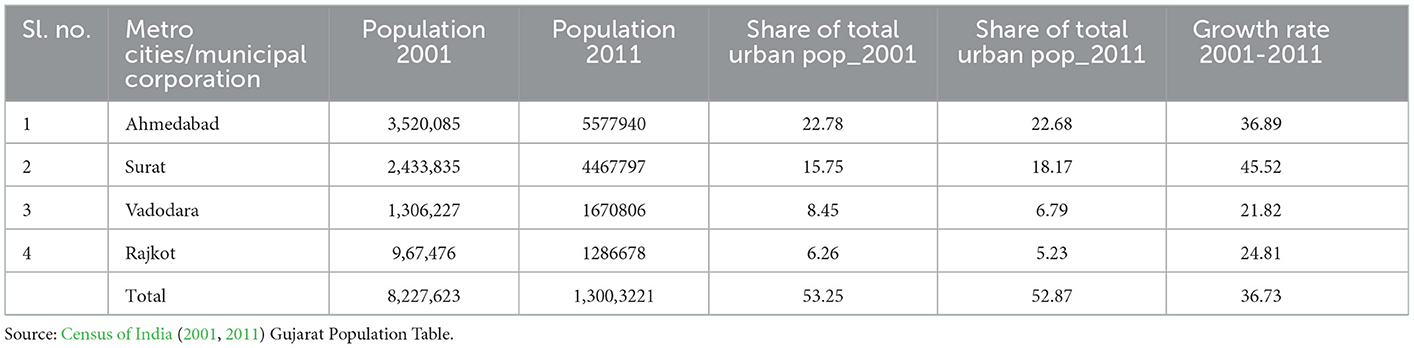
Table 6. Share and the rate of growth of urban population in metropolitan cities, Gujarat-2001-2011.
Table 6 shows that Surat and Ahmedabad registered the highest urban population growth rate for the years 2001 and 2011. The decadal growth rate of the urban population of Surat is 46 per cent which is one of the highest reported by any metropolitan city in the country. These four metropolitan cities of Gujarat have been consistently growing at a faster rate. The decadal population growth rate of all these four metropolitan cities is 36.73 per cent which is a very high growth rate. Compared to other metropolitan cities, Vadodara is growing at a 22 per cent rate of decadal growth during the same time.
6. Spatial distribution (pattern) of urban population in Gujarat, 2001–2011 (district level analysis)
The urban population was confined to a few districts of Gujarat in 2001 (see Figure 2). Ahmedabad district reported more than 60 per cent of urbanization, followed by Vadodara, Surat, Rajkot and Jamnagar, with 40 to 60 per cent levels of urbanization. These five districts have an urban population greater than the national and state averages. These districts are also the leaders in industrial development, especially Ahmedabad, Surat and Vadodara. Rajkot and Jamnagar have recently industrialized, attracting more migrant populations both from within the state and outside in the major urban centers in these districts. The concentration of industries, both large and small and medium-sized, are in these five districts. Ahmedabad and Surat are the major commercial and industrial centers of the state. Ahmedabad was once considered the Manchester of India due to its textile industries. Later with the decline of the textile industry, it has become a big commercial hub of the state with a few clusters of small and medium-sized industrial estates such as Naroda, Odhav and Vatva hence creating a significant pull factor for in-migration in Ahmedabad city. The high proportion of the urban population in these five districts is due to the higher concentration of industries. It is considered an industry-led urban development in Gujarat.
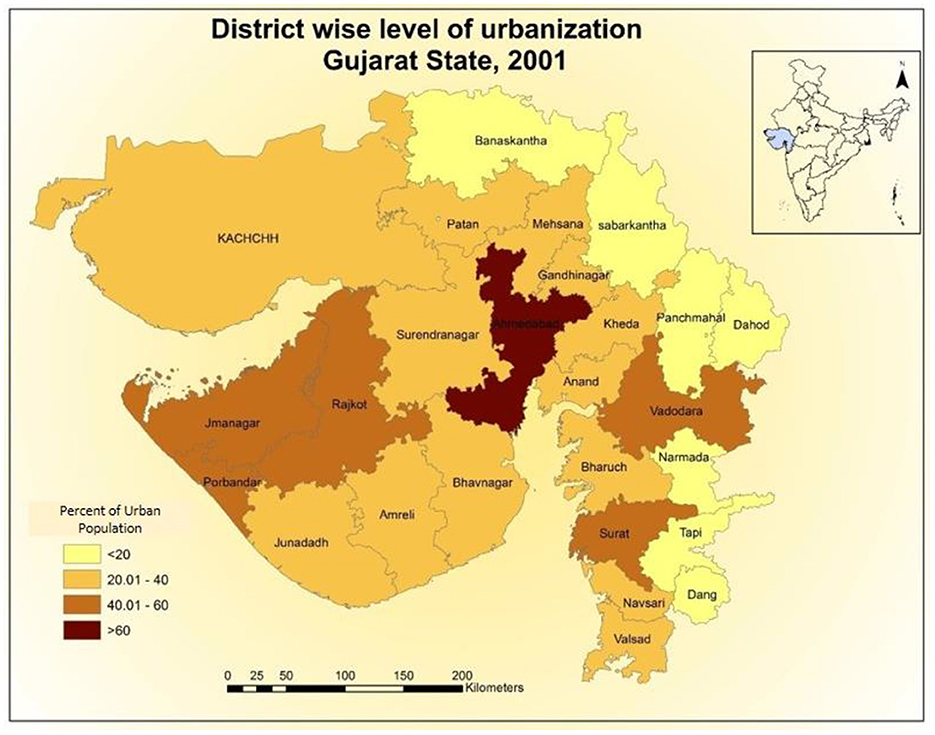
Figure 2. District-wise level of urbanization, Gujarat-2001. Source: Prepared by the Authors, 2019.
The majority of the districts (13 districts) reported their per cent urban population in the range of 20–40 per cent. The cluster of “Eastern Patti1” districts such as Banaskantha, Sabarkanntha, Panchmahal, Dahod, Narmada, Tapi and Dang is the least urbanized, with less than 20 per cent urban population. These are predominantly tribal districts of Gujarat where induced industrialization did not occur. These districts rely on agriculture and forest-based livelihood. However, Ahmedabad districts reported the highest percentage of urban population (80 per cent) in 2001. Seven districts, namely Surat, and Vadodara from Central and South Gujarat, respectively and Rajkot, Jamnagar and Porbandar from Saurashtra have shown their percentage urban population greater than the state and national average in the year 2001. These districts fall in the range of 40–60 per cent level of urbanization during 2001.
The scenario in the year 2011 has slightly changed as far as the levels of urbanization in Gujarat are concerned. Figure 3 shows the district-wise levels of urbanization (per cent urban population) during the 2011 census. Surat district joined the league of Ahmedabad with over 60 per cent urban population in 2011. Vadodara, Rajkot and Jamnagar still show a proportion of the urban population in the range of 40–60 per cent. Two surprise districts that joined the league with a 40–60 per cent urban population in the year 2011 are Bhavnagar and Gandhinagar. However, the biggest gainer is Surat, with 80 per cent of levels of urbanization. The higher concentration of urban population is spreading to the non-industrial districts during the 2011 census, indicating a slight change in the pattern of urbanization in Gujarat. The 2001 census reported a higher concentration of urban population (compared to the state average and national average) in five districts, while in the 2011 census, seven districts reported a higher percentage (more than 40 per cent) of the urban population. Except for the “Eastern Patti,” other districts of Saurashtra, Central, North and South Gujarat have reported a percentage urban population in the range of 20–40 per cent. There has been no change in the share of the urban population in the districts of Eastern Patti, and they are still in the category of less than 20% urbanized. However, Ahmedabad district (84%) still holds the top position in the percentage of the urban population in the year 2011, followed by Surat districts with 80 per cent urban population.
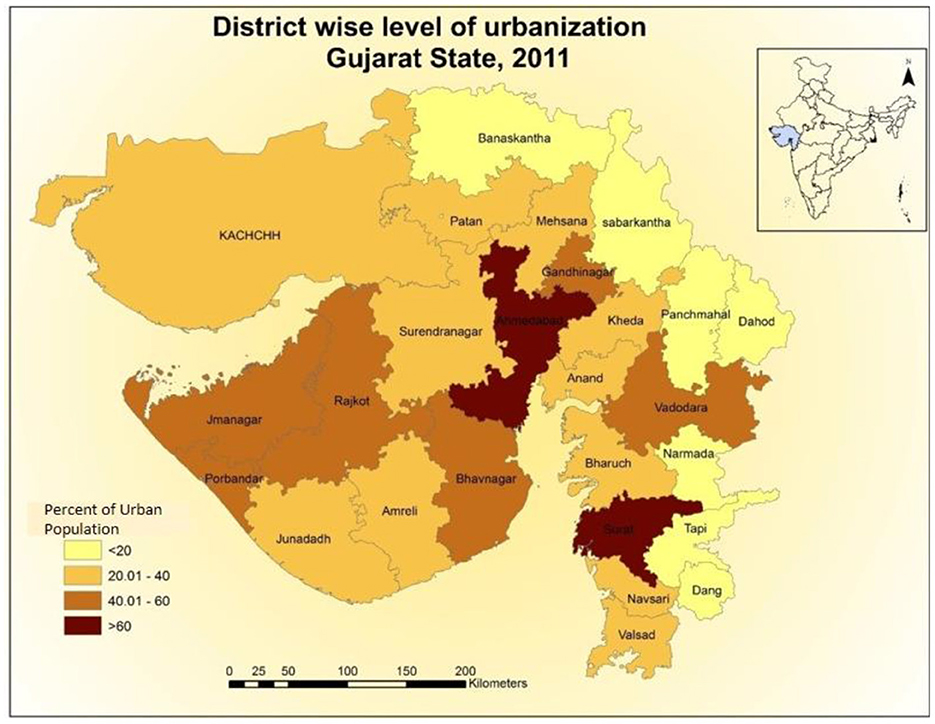
Figure 3. District-wise level of urbanization, Gujarat-2011. Source: Prepared by the Authors, 2019.
The change in the distribution pattern of the district-wise urban population in the year 2011 can be summarized in the following points:
1. Urbanization is concentrated in 7 districts of Gujarat, namely- Ahmedabad, Surat, Vadodara, Rajkot, Bhavnagar, Jamnagar and Gandhinagar districts.
2. These districts are traditionally attracted industrial investments and progressed through large-scale infrastructure development (Bagchi et al., 2005).
3. Cities especially large ones in these districts have benefitted from economic liberalization through industrial and infrastructure investments that attracted huge labor in-migration from other states leading to high levels of urbanization (Kundu, 2000).
The economic benefits are to some extent spreading to the hinterlands of Gujarat. The significant industrial development in Jamnagar, Rajkot and Bhavnagar has resulted in huge in-migration, thereby increasing the levels of urbanization in these districts post-liberalization. However, the large-scale industrial activities in the Kutch districts just after the major earthquakes in 2001 to provide a constant source of livelihood to the affected population have not been able to improve much of the levels of urbanization in the largest districts of India. Interestingly, Kutch districts have a 35 per cent urban population greater than the national average in 2011.
6.1. Distribution of size class towns in Gujarat—An emerging pattern
The spatial distribution of size class towns of Gujarat is shown in Figure 4. Large cities, particularly Class I (with a 1 lakh population), are concentrated along with the “Golden Corridor2” (Ahmedabad-Surat-Valsad) in North and South Gujarat and the Saurashtra Region. A sizeable number (39) of statutory towns were also located in the North and South Gujarat in 2001 (see Table 7). They altogether account for more than 52 per cent of the total urban population of the state.
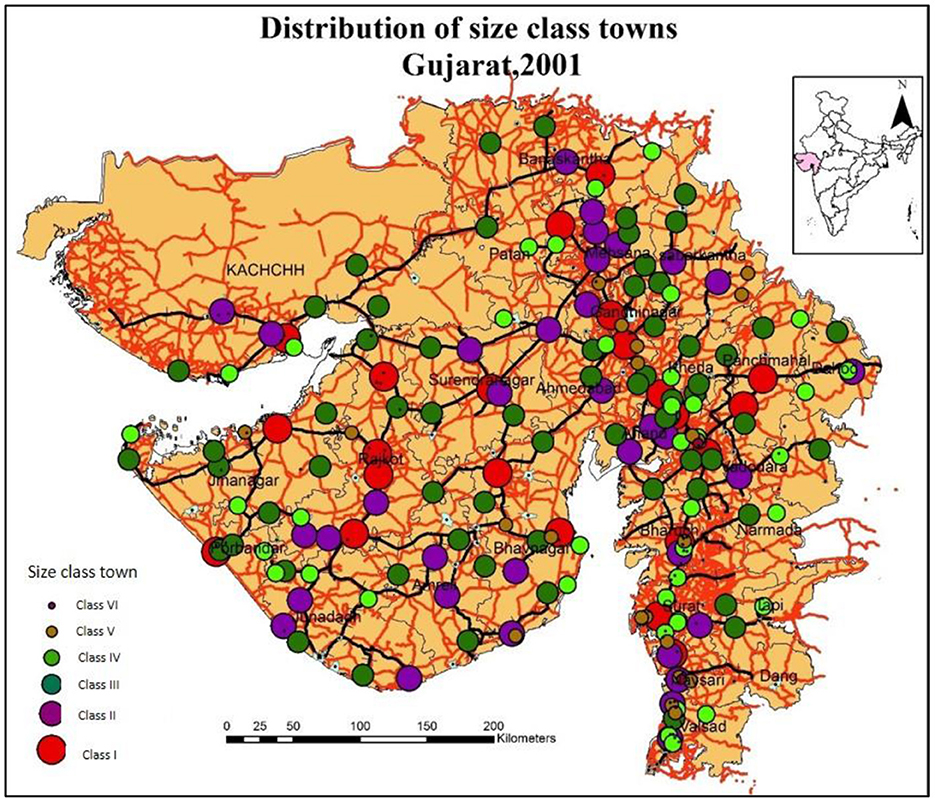
Figure 4. Distribution of size class towns in Gujarat-2001. Source: Prepared by the Authors, 2018.
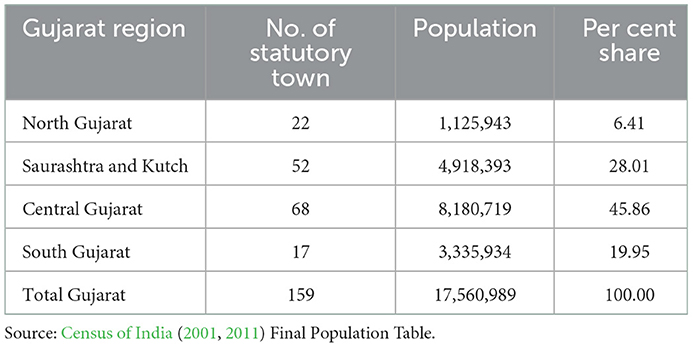
Table 7. Statutory towns in Gujarat, 2001.
However, the distribution pattern of these towns has changed between the last two censuses (2001–2011) (see Tables 7, 8). Figure 5 shows the distribution of towns as per the census of 2011. It has been observed that the “Golden Corridor” has more concentration of big-sized towns (Class I, Class II and Class III) followed by the Saurashtra Region. The areas predominantly rural in nature, such as Eastern Patti (Eastern Tribal Districts), have reported the presence of all-size class towns, a recent phenomenon. In other words, urbanization is happening in Gujarat's remote and poor districts. New urban centers are emerging in both the Tribal and Coastal districts of Gujarat, a phenomenon of in-situ urbanization (Pradhan, 2013).
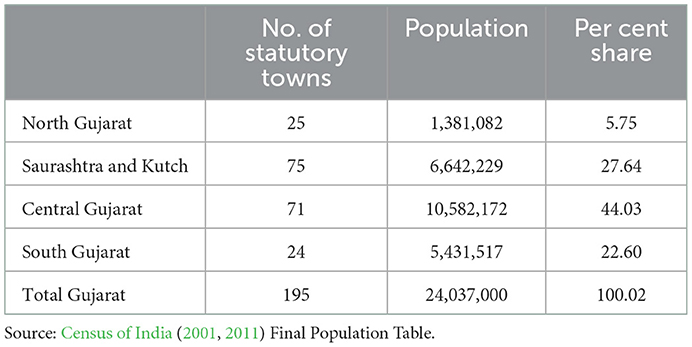
Table 8. Statutory towns in Gujarat, 2011.
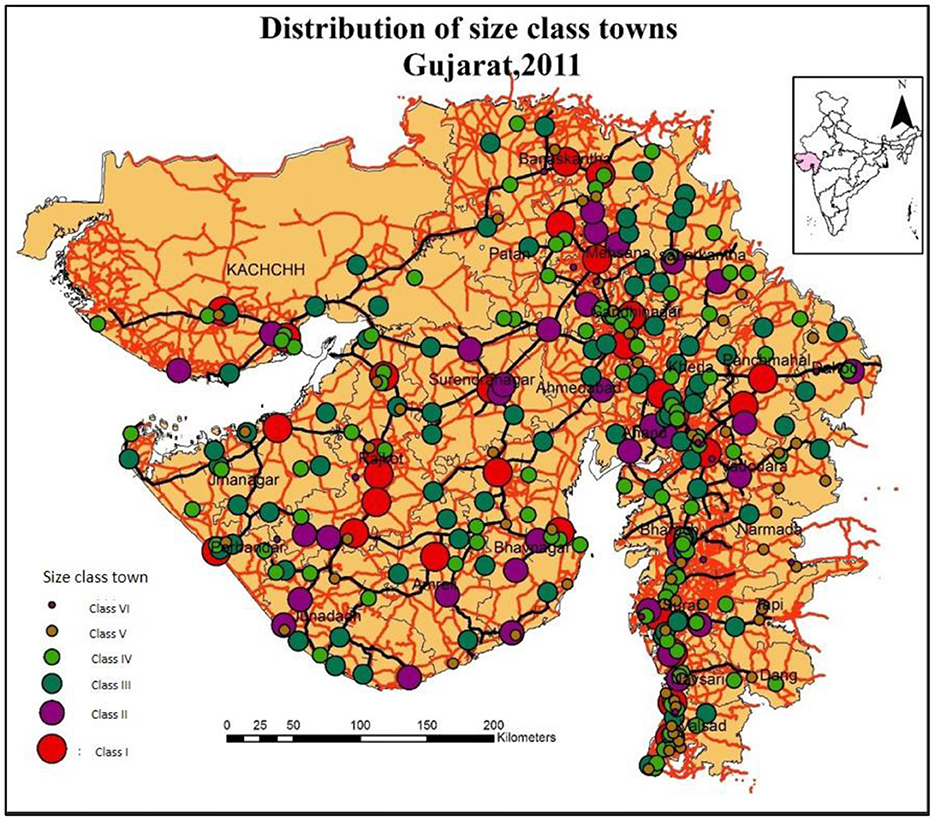
Figure 5. Distribution of size class towns in Gujarat- 2011. Source: Prepared by the Authors, 2018.
6.2. Emerging network of census towns in Gujarat-2011
If one observes (see Figure 6) the patterns of the location of Census Towns (CTs) in Gujarat (2011), they are either located in remote areas or in and around large urban centers (Roy and Pradhan, 2018). Many CTs have emerged in the peripheral regions away from the traditionally large urban centers. They are the graduated large-sized high-density rural settlements due to increased rural non-farm workers, especially in the Tribal Belt of Gujarat. This phenomenon is quite like what happened in the case of urban transformation in West Bengal, which reported the highest number of census towns in 2011 in India (Guin, 2016).
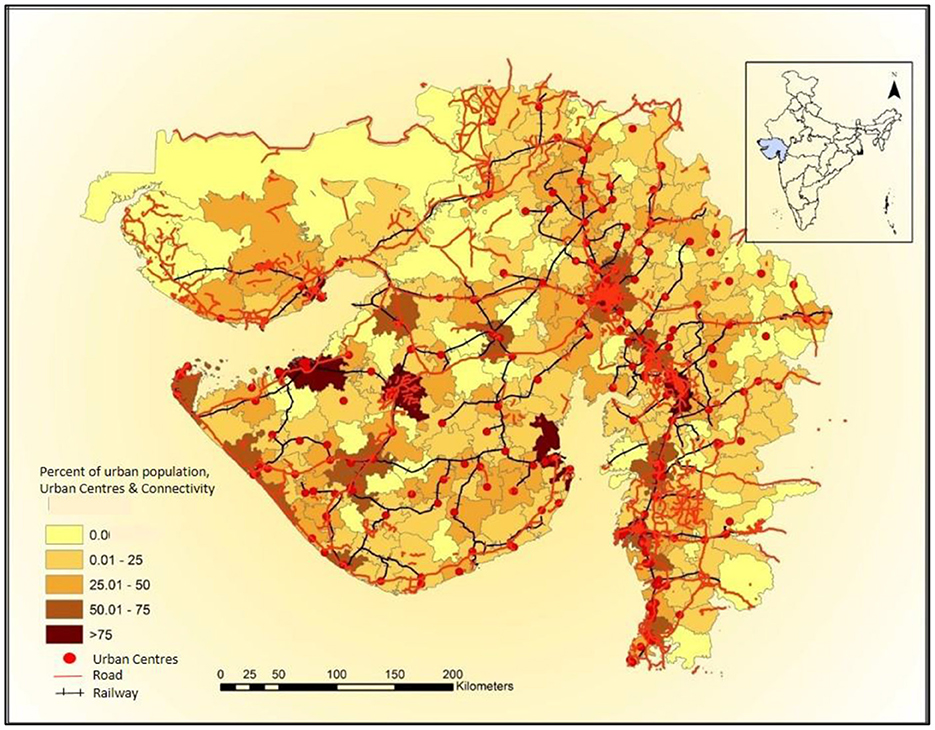
Figure 6. Distribution of census towns in Gujarat-2011. Source: Prepared by the Authors, 2018.
The census towns in Gujarat are connected to their nearest large urban centers through rail and road infrastructure, making a network of towns/cities around them. They are also located along the Golden Corridor of Gujarat. It is expected that the highly skewed distribution of urban population in a few districts may change with more and more urban centers spreading toward the poor and backward districts of Gujarat due to the transformation of high-density rural settlement from primarily agricultural to the non-farm economic activity-based labor force (Guin, 2016).
There has been a considerable jump both in the number of CTs and their share of the urban population in the state in the year 2011 (see Tables 9, 10). The total number of CTs has increased from 63 to 153, registering an increase of 2.4 times during 2001–2011, while the share of the urban population of CTs has also increased slightly over two times from 3.21 per cent to 6.98 per cent. It is a substantial increase in one decade, i.e. from 8.25 lakhs to 17.96 lakhs. However, these urban populations are unacknowledged (Pradhan, 2013) by the state government and do not have the statutory status of urban as far as governance is concerned. They are governed by the rural administration called Panchayati Raj institutions in India.
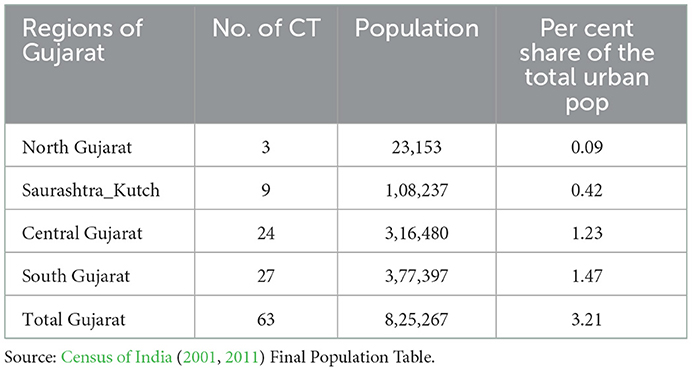
Table 9. Numbers and share of urban population in census towns of Gujarat-2001.
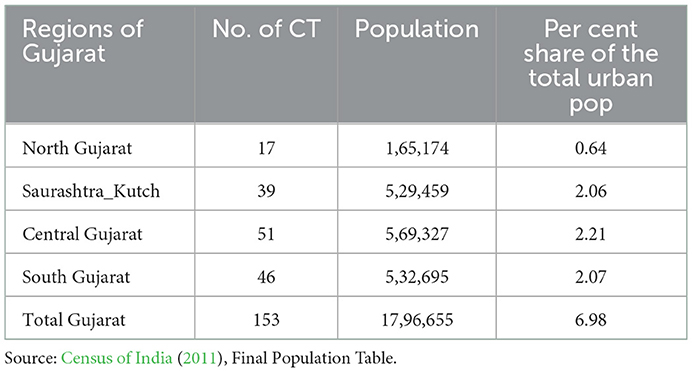
Table 10. Numbers and share of urban population in census towns of Gujarat, 2011.
7. Trend and pattern of urbanization due to migration in Gujarat, 2001–2011
Gujarat had been leading among the major states that attract inter-state migration to urban areas in India. The net contribution from migration to the levels of urbanization was 36 per cent in 2001 (Bhagat and Mohanty, 2009), while it reached 55% in 2011. Much of the contribution from migration to urbanization has been registered by inter-state migration (35 per cent), followed by intra-state migration (20 per cent). Inter-district migration stagnated between 2001 and 2011. However, intra-district migration has contributed to urbanization during the same period (see Table 11). This increasing migration contribution to Gujarat's urban areas has been due to some of the performing districts and urban centers of Gujarat where jobs are being created in the manufacturing and service sectors.
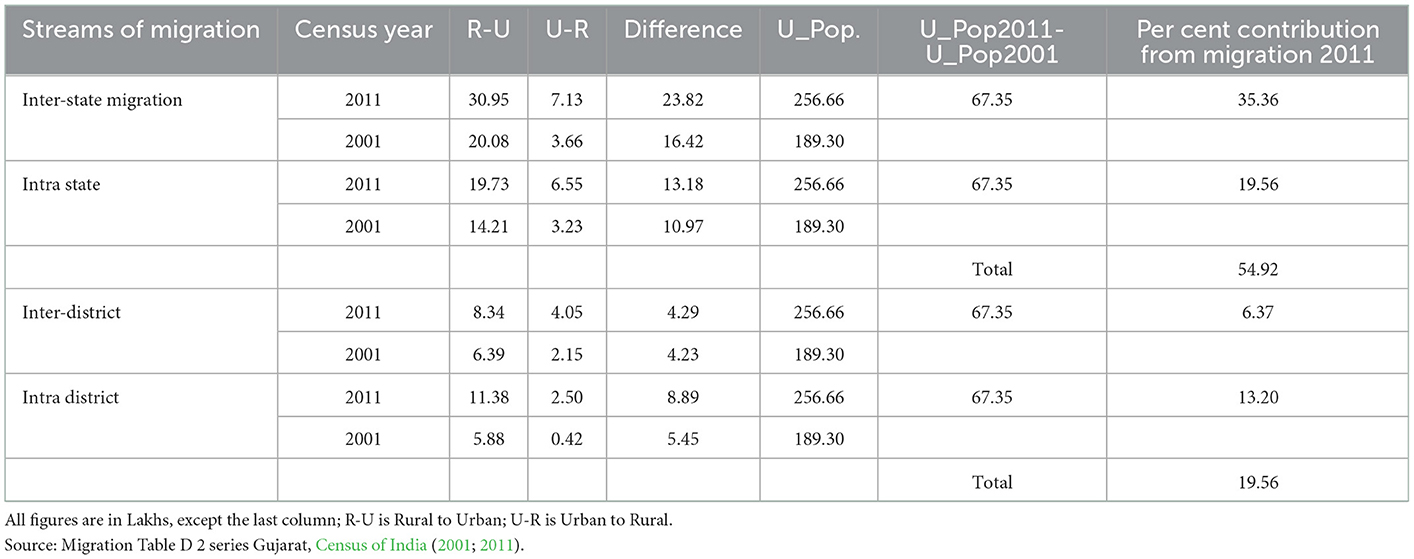
Table 11. Trends and pattern of migration in Gujarat −2001 to 2011.
The industrial investments in the state after the economic liberalization in 1992 started giving results during the early 2000's. A primary emphasis was given to large-scale industrial development under the Special Economic Zones (SEZs) and Special Investment Regions (SIRs), namely, PCPIR Bharuch, Surat- Vapi-Ankeleswar Industrial Corridor, Hazira SIR etc. In addition, some urban centers such as Surat, Bharuch, Rajkot, Gandhinagar, Ahmedabad and Vadodara (Halol-Savli SIR) diversified their economic base and attracted large-scale industrial development. These industrial developments involved manufacturing multi-products, chemical products, heavy engineering and automobile, textile and diamond processing etc. These industrial centers are the immediate hinterlands of the large urban agglomeration in Gujarat and have attracted migrants' labors both from interstate and intrastate.
The distribution pattern of urbanization from the net contribution of migration follows the peculiar pattern of district-level urbanization. The pattern indicates that the urbanization in Gujarat is led by migration, while natural increase and other factors of urbanization contributed less than 45% to the overall levels of urbanization during the last decade.
As far as urbanization in Gujarat is concerned, as stated earlier, South Gujarat, Central Gujarat, and Saurashtra regions are comparatively urbanized compared to North Gujarat and Eastern Gujarat, sometimes called Eastern Patti3 consisting of Dahod and Panchmahal districts. A regional pattern of migration emerges that contributes to the state's urbanization levels in the last two censuses (see Figure 7, also see Table 12). Gandhinagar, Surat and Valsad districts have been able to contribute more than 40% of urbanization through migration only during 2001 and 2011, while Rajkot, Bhavnagar from Saurashtra and Vododara and Narmada from Center and South Gujarat respectively have registered a net contribution of migration to the urbanization in the range of 30–40%. The other districts that have registered a 20–30% net contribution from migration to urbanization during the same period are Ahmedabad, Jamnagar, Junagarh, Bharuch and Navsari. The districts registered a net contribution from migration to urbanization in the range of 10–20% are Patan and Mehsana from North Gujarat; Surendranagar, Porbandar, and Amreli from Saurashtra and Panchmahar and Dang from Central and South Gujarat. The rest of the districts in Gujarat have accounted for less than 10 per cent of the net contribution from migration to the urbanizations, except Dahod which has a net loss of 15 per cent due to outmigration between 2001 and 2011 (see Figure 7). Amongst these districts, Kuchchh has the least contribution from migrations to the levels of urbanization, followed by Anand, Sabarkantha, Kheda, and Banaskantha districts (see Table 12).
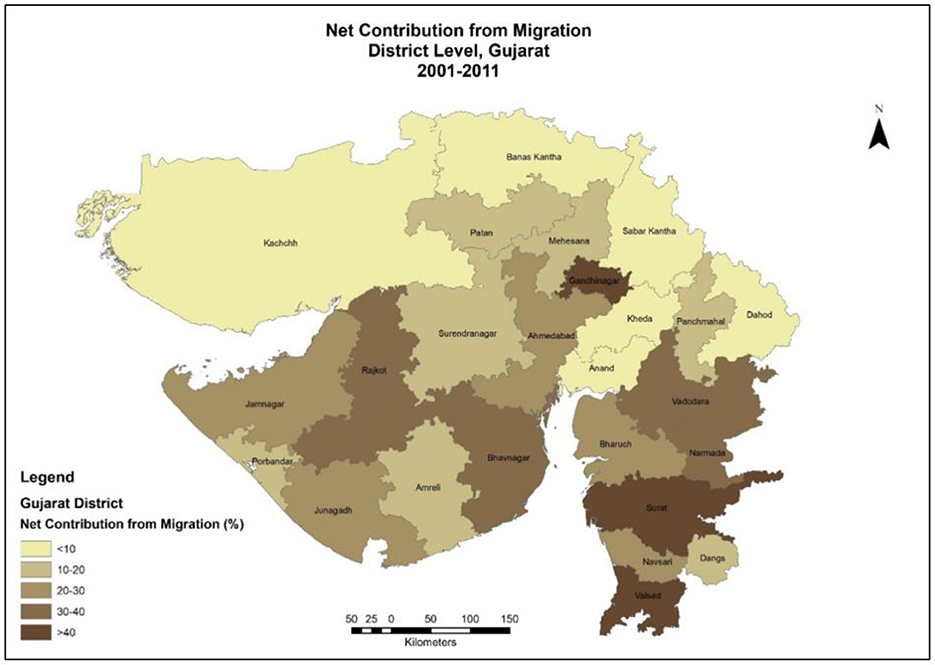
Figure 7. Per centage contribution of migration to the levels of urbanization. Source: Primary Census Abstract, Census of India (2001; 2011) Migration Table D 02, Source of distribution Map: Authors.
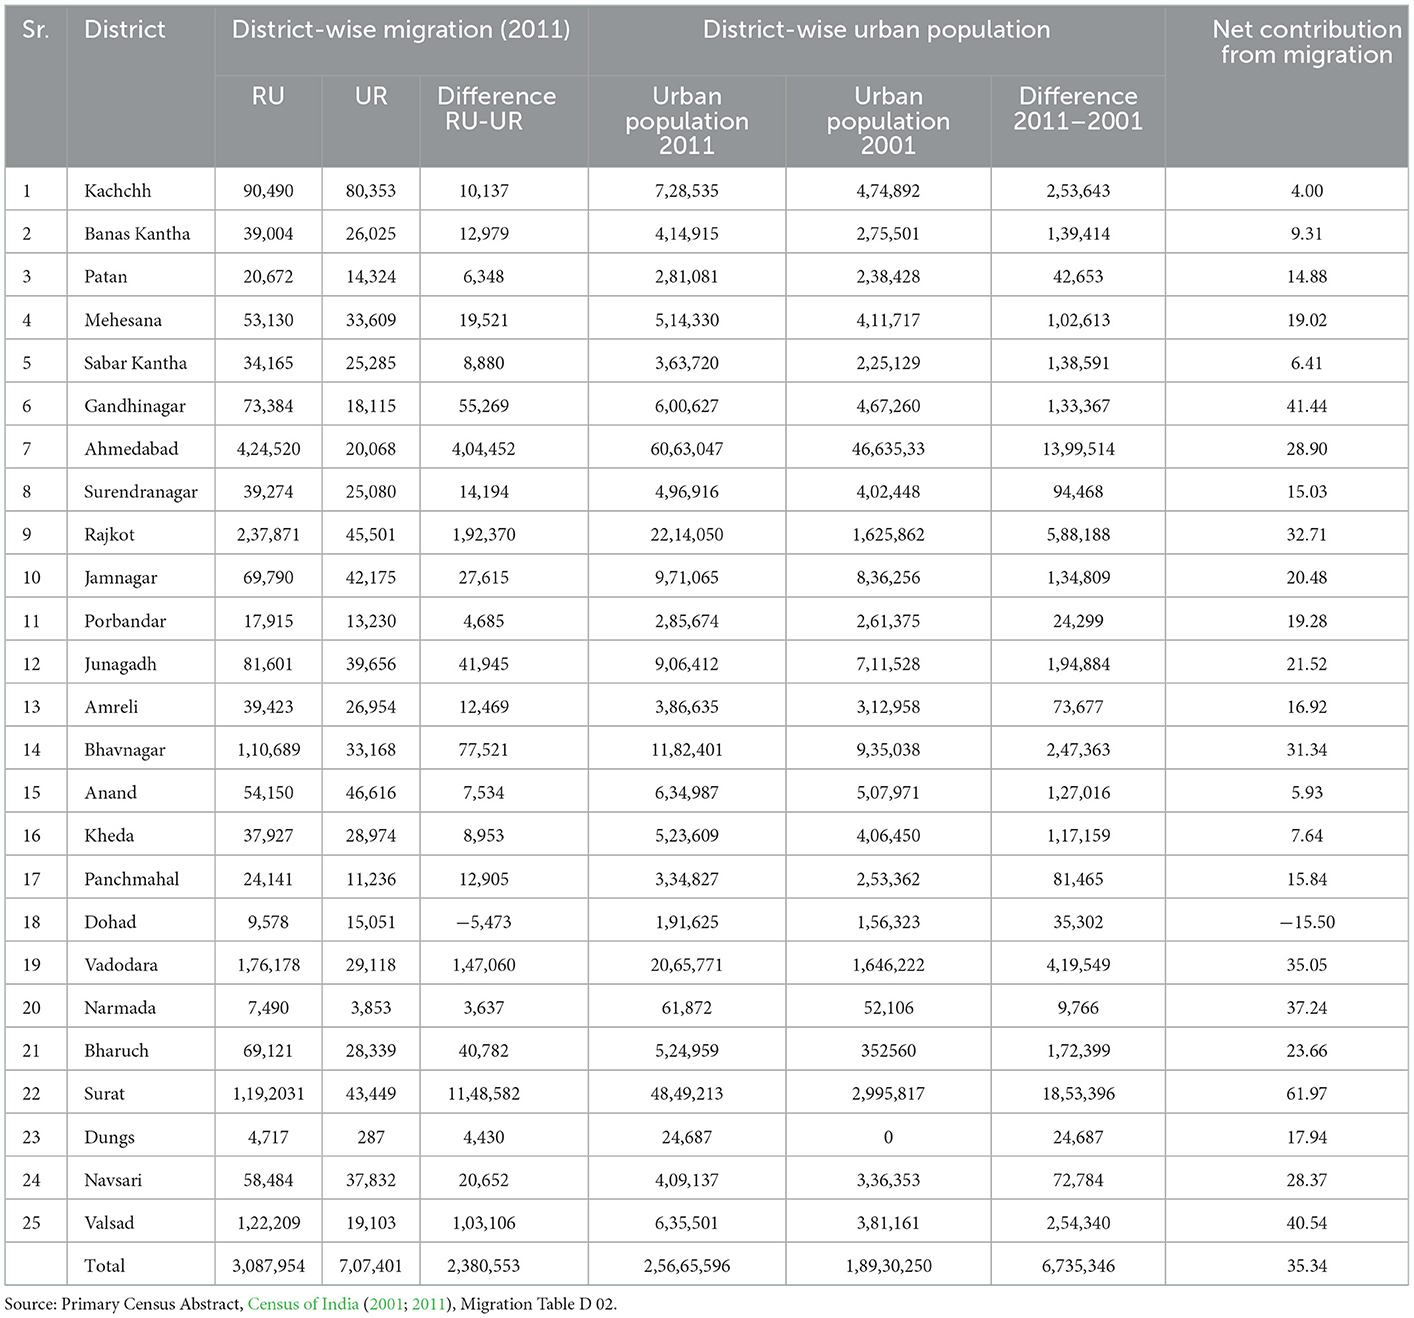
Table 12. District-wise net contribution of urbanization from migration, 2001–2011.
This regional pattern of net migration coincides with the overall pattern of urbanization. However, Ahmedabad, Rajkot and Bhavnagar, the three out of the six major urban agglomerations of the state, have contributed slightly below the inter-state average net contribution from migration (35%) during the last two censuses. In contrast, they have performed better as far as levels of urbanization are concerned. It may be due to the contribution through their natural growth of population and the expansion of the respective municipal corporation's limits. The south Gujarat districts such as Surat, Valsad, and Narmada, along with the Gandhinagar and Vadodara from central Gujarat, have contributed more than the state average (35%) of the net migration to the total urbanization in their respective districts. Surat, Valsad and Narmada districts diversify their economic activities in diamond, textile, heavy engineering and port-led petrochemical industries. Due to this, large-scale migrant labors are attracted from other states (such as UP, Bihar, Assam, Jharkhand and West Bengals) and within the state. Manufacturing industrial locations and oil refineries are favored in the Saurashtra regions, namely Rajkot, Jamnagar, Junagarh and Bhavnagar, which require substantial labor demands that the migrants are filling from UP, Bihar, Assam, West Bengal and Odisha.
8. Future direction of urbanization in Gujarat
Urbanization in Gujarat, though lopsided, will be rapid and urban expansion leading to sub-urbanization shall be the characteristics of urban development in the state. The trends of urbanization in the last century and especially post-independence have followed a colonial pathway of urbanization where induced urban development through industrialization took place. The cities are not only growing large in terms of population, but the spatial growth of cities has resulted in huge built-up areas across the major urban agglomerations and their hinterlands. Urban expansion has been an easy option for investors and planners to create industrial clusters as a magnet for migration resulting in rapid urbanization in the state in both short and long run. Cities like Gandhinagar, Ahmedabad, Rajkot, Vadodara, Jamnagar, Bhavnagar, Surat, and Vapi-Ankleshwar are growing rapidly due to the diversification of the urban economy. The peripheral land areas of these cities are relatively cheaper than their respective core. Hence industrial and the real estate developments are preferred. For example, Ahmedabad- Sanand Industrial Area, Mehsana-Kalol and Halo-Savli Industrial Corridors (all auto-mobile manufacturing) in Central Gujarat; Bahruch-Surat-Vapi-Ankaleswar Industrial Corridor (petrochemical, heavy engineering and textile industries) in South Gujarat; and Rajkot and Jamnagar Industrial regions (manufacturing, food processing and petrochemical industries) are the major emerging industrial agglomeration in Gujarat. They are likely to lead to higher levels of urbanization in future. Besides, port-led industrial development is taking place at Hazira, Mundra and Kandla Ports, respectively, the three major ports of South Gujarat and Kutch. These may create further demand for migrant labor in the state, leading to urbanization in these emerging industrial centers.
The following industrial and infrastructure developmental projects of the state are likely to come up, which may attract more migrants and would result in rapid urban growth, increasing the levels of urbanization in the state:
1. High-speed rail corridor (508 Km) connecting Ahmedabad and Mumbai at the cost of US $9.7 billion;
2. Delhi-Mumbai Industrial Corridor (DMIC) and Dedicated Freight Corridor (DFC) pass through the state with four industrial nodes at Mehsana, Ahmedabad, Vadodara and Surat;
3. Petroleum, Chemicals and Petrochemicals Investment Region (PCPIR) at Bharuch Region;
4. The upcoming greenfield port at Vansi Borsi is a multi-purpose, all-weather port costing the US $ 615 million.
5. Coastal Employment Zones (CEZs) at Hazira port. These CEZs aim to promote the development of port-proximate industrial clusters, encourage port-led development, and reduce logistics costs and time for movement, enhancing the global competitiveness of the Indian manufacturing sector.
A report by the Census of India, 2006 projects the first quarter of the present century population for India and the states. It says that India's urban population would reach 400 million i.e. 38 per cent of the total population, in 2026. At the same time, the projected urban population for 2026 for the state of Gujarat will be 53%, preceeded by Maharashtra, Tamil Nadu and Delhi. One can expect Gujarat's level of urbanization crossing 50% mark in the 2021 census. According to the above report, Gujarat will be in the league of the top five states in India, which will cross the 50 per cent levels of urbanization occupying 4th position, followed by Punjab at 5th rank.
9. Conclusion and policy implication for sustainable urbanization
Gujarat is one of the most urbanized states in India, with levels of urbanization (42.58%) more than the national average of 31.16 as per the census 2011, it provides opportunities for a diversified economy that attracts migrants from within and outside the state. Gujarat's level of urbanization has always been higher than the national average throughout the last century and till 2011. However, the major concentration of urban populations (more than 52%) is residing only in the four metropolitan cities (Ahmedabad, Surat, Vadodara, and Rajkot) in the state in 2011. As far as the distribution of urban population in the state is concerned, it is highly skewed in favor of large cities. Our result of the GINI co-efficient confirms that the concentration of the urban population in the state has strengthened between the last two censuses, i.e., 2001 and 2011.
The spatial distribution of different-sized class towns in Gujarat shows a distinct pattern. Most of the Class I, Class II, and Class III towns are located along the “Golden Corridor” and in the Saurashtra Regions, while small and medium towns, particularly Class IV, V, and VI, are in the Kutch, “Eastern Patti” districts and South Gujarat barring Surat. The census towns have recently registered a huge increase both in number and share of the urban population in the state. It is in-situ urbanization and may weaken the concentration of the levels of urbanization in a few districts. However, the census towns are unacknowledged and, at the same time, well connected to large urban and industrial centers. They are well networked through rail/road, which may help spread urbanization in Gujarat's neglected regions.
The trends and pattern of urbanization at the district level indicate that the higher levels of urbanization i.e., more than 40% are reported by the seven districts (Ahmedabad, Surat, Vadodara, Rajkot, Bhavnagar, Jamnagar, and Junagarh) in the year 2011 compared to five districts in the year 2001 which did not include Jamnagar and Bhavnagar in the year 2001 (see Figures 2, 3). These seven districts account for more than 70% of the total urban population of the state in the year 2011. Large-scale industrial development and ease of business for the small and medium enterprises, along with better connectivity and industrial, ports and related facilities, have resulted in a massive migration of labor forces from other states. These contributed to the higher urbanization in Gujarat in recent decades.
The recent trends and pattern of net contribution of migration to urbanization coincide with the levels of urbanization, indicating the huge influence of in-migration of the labor force from outside the states. As the urban development activities are spreading in Saurashtra, Central and Eastern Gujarat, it will further attract migrants from both outside and within the state soon, leading to higher levels of urbanization in the state. The state is poised to cross 53% levels of urbanization by the year 2026 (Census of India, 2006). The mega industrial and infrastructure projects that are likely to be completed in the near future will further influence in-migration in the state and in the selected few cities and districts, creating a regional imbalance in urbanization in the state.
Data availability statement
The original contributions presented in the study are included in the article/supplementary material, further inquiries can be directed to the corresponding author.
Author contributions
MS has provided data analysis, GIS mapping support, and provided support in doing an extensive literature review and data collection prior to the compilation of the article by AR. The conceptualization of this article was done by AR and MS. All authors contributed to the article and approved the submitted version.
Acknowledgments
The previous version of this paper was presented in a national seminar on The Changing Rural Landscape- Pathway Ahead, during 4–5 July 2019 at the Sardar Patel Institute of Economic and Social Research (SPIESR), Thaltej, Ahmedabad, Gujarat, India. The comments received by the participants have helped improve the earlier draft. We thank R. B. Bhagat and Y. K. Alagh for their valuable comments in improving this paper in its current form. We also thank Ayan Rudra and Paulami De for their support in preparing the migration table and map respectively. The authors would also like to thank Amitabh Kundu and Darshini Mahadevia for inviting us to write the paper for this special issue.
Conflict of interest
MS was employed by Ernst & Young LLP after the completion of this article.
The remaining author declares that the research was conducted in the absence of any commercial or financial relationships that could be construed as a potential conflict of interest.
Publisher's note
All claims expressed in this article are solely those of the authors and do not necessarily represent those of their affiliated organizations, or those of the publisher, the editors and the reviewers. Any product that may be evaluated in this article, or claim that may be made by its manufacturer, is not guaranteed or endorsed by the publisher.
Footnotes
1. ^Eastern Districts having predominantly agriculture and tribal area.
2. ^The industrial corridor regions between Ahmedabad and Surat and beyond until Mumbai.
3. ^Eastern part of the Gujarat state is a Tribal area, where urban and industrial developments have not taken place compared to Central and South Gujarat, due to constitutional safeguards to protect the tribal culture.
References
Awasthi, S. (2021). Hyper-urbanization and migration: a security threat, Cities 108, 2965. doi: 10.1016/j.cities.2020.102965
Bagchi, A. K., Das, P., and Chattopadhyay, S. K. (2005). Growth and structural change in the economy of Gujarat, 1970–2000. Econ. Polit. Wkly. 35, 3039–3047.
Bhagat, R. B. (2011). Emerging pattern of urbanization in India. Econ Polit WeeklyEcon. Polit. Wkly. 3, 10–13.
Bhagat, R. B., and Mohanty, S. (2009). Emerging pattern of urbanization and the contribution of migration in urban growth in India, Asian Pop. Stud. 5, 24. doi: 10.1080/17441730902790024
Census of India. (2001). Primary Census Abstract- Gujarat, Registrar of Census, Government of India, 2001.
Census of India. (2006). Population Projections for India and States 2001–2026 Report. The Technical Group on Population Projections Constituted by The National Commission on Population, May 2006.
Census of India. (2011). Primary Census Abstract- Gujarat, Registrar of Census, Government of India, 2011.
Guin, D. (2016). Urban Transition in West Bengal, India, J. Asian Afr. Stud. 45, 1–19. doi: 10.1177/0021909616649211
Hirway, I. (1995). Selective development and widening disparities in Gujarat. Econ. Polit. Wkly. 30, 2603–2618.
Jariwala, V. S. (2015). Urbanisation and its trends in India—A case of Gujarat. Artha-Vikas J. Econ. Develop. 51, 72–85.
Kundu, A. (2000). Globalising Gujarat-urbanisation, employment and poverty. Econ. Polit. Wkly. 35, 3172–3181.
Kundu, A. (2011). Trends and Process of Urbanisation in India, Human Settlements Group, International Institute for Environment and Development (IIED). New York: UK and Population and Development Branch, United Nations Population Fund (UNFPA).
Kundu, A., Bagchi, S., and Kundu, D. (1999). Regional Distribution of Infrastructure and Basic Amenities in Urban India: Issues Concerning Empowerment of Local Bodies. Econ. Polit. Wkly. 34, 3172–3181.
Kundu, A., and Gupta, S. (1996). Migration, urbanisation and regional inequality. Econ. Polit. Wkly. 31, 3191–3398.
Mahadevia, D. (2014). “Dynamics of urbanization in Gujarat,” in Growth or Development: Which Way is Gujarat Going?, eds I. Hirway, A. Shah, and G. Shah, G. (New Delhi: Oxford University Press), 340–379.
Pradhan, K. C. (2013). Unacknowledged urbanization: new census towns of India. Econ. Polit. Wkly. XLVIII, 2013.
Roy, S. N., and Pradhan, K. C. (2018). Census Towns in India Current Patterns and Future Discourses, Working Paper. New Delhi: Center for Policy Research.
Keywords: Gujarat, pattern of urbanization, district level analysis, pattern of migration, migration and urbanization in Gujarat
Citation: Roy AK and Saha M (2023) Emerging trend and pattern of urbanization and its contribution from migration in Gujarat: Evidence from district level analysis. Front. Sustain. Cities 5:985278. doi: 10.3389/frsc.2023.985278
Received: 03 July 2022; Accepted: 09 January 2023;
Published: 03 March 2023.
Edited by:
Agung Suwandaru, Western Sydney University, AustraliaReviewed by:
C. Mohammed Firoz, National Institute of Technology Calicut, IndiaSatya P. Singh, Saurashtra University, India
Copyright © 2023 Roy and Saha. This is an open-access article distributed under the terms of the Creative Commons Attribution License (CC BY). The use, distribution or reproduction in other forums is permitted, provided the original author(s) and the copyright owner(s) are credited and that the original publication in this journal is cited, in accordance with accepted academic practice. No use, distribution or reproduction is permitted which does not comply with these terms.
*Correspondence: Anil Kumar Roy, YW5pbC5yb3lAY2VwdC5hYy5pbg==
†These authors have contributed equally to this work