 Atakan Genç
 Khaled Alkhaledi2*
 Salaheddine Bendak
- 1Department of Industrial Engineering, Haliç University, Istanbul, Türkiye
- 2Department of Industrial Engineering, University of Kuwait, Kuwait City, Kuwait
- 3Star Araştirma ve Denetim Hizmetleri, Istanbul, Türkiye
Using public transport is an important part of daily routine of many people in large cities and consumes considerable time and financial resources. Enhancing public transport can help in encouraging less use of privately owned motor vehicles and, therefore, in emitting less greenhouse gases. Hence, there is a need to improve public transport and make it more attractive than private motor vehicles. This study aims to assess commuters opinion on several aspects related to using public buses in Istanbul with the ultimate aim of making them more attractive than private motor vehicles. A total of 620 randomly selected bus commuters responded to a questionnaire specially prepared for this purpose. Satisfaction rates with most aspects related to public buses were found to be high. Nevertheless, non-parametric test results revealed that female commuters recorded significantly lower satisfaction rates than male commuters on many aspects related to public buses. Results also revealed that a significant minority of commuters walk for long distances to the nearest bus stop or wait for very long times for the next bus to come. Moreover, results revealed that commuters of older ages and higher income levels recorded significant higher satisfaction rates than others. Results also show that the majority of commuters support increasing bus fees during peak hours in order to minimize crowdedness during these hours. Implications of these results for decision makers in megacities on ways to encourage the use of public buses are discussed at the end.
1 Introduction
Cities all over the world are becoming more crowded due to the continuous increase in population, migration from rural areas and, in some cases, migration from other countries, and Istanbul city is no exception to this. Adding the recent economic prosperity over the last few decades to these factors led to more and more cars being put on Istanbul streets. This, inevitably, is causing heightened traffic congestion, increased fossil fuel consumption and more greenhouse gases emission. All of these features are becoming common features in crowded cities where they are adversely affecting public health and economic prosperity and increasing greenhouse gas emissions (Alkhaledi, 2015; Botzoris et al., 2015; Alkhaledi et al., 2017; Erdoğdu and Watson, 2023).
Public transport is considered as a more viable transportation option. It helps in minimizing dependence on private motor vehicles and therefore in less traffic congestion, lower stress levels for commuters and lower fossil fuel emissions particularly in highly congested cities like Istanbul. At the same time, using public transport is an important part of daily routine of many individuals, especially in large cities. It consumes considerable time and financial resources of inhabitants of those cities (Jain et al., 2014; Clark et al., 2020; Soza-Parra et al., 2022). Therefore, enhancing public transport system in any city is expected to help in encouraging less use of privately owned vehicles. Thus, there is a dire need to improve public transport and make it more attractive than private motor vehicles (Susilo et al., 2010; Jain et al., 2014). Many studies have assessed commuters preferences, travel experience and the effects of commuting on individuals (Ismail et al., 2012; Clark et al., 2020; Lee et al., 2020; Erdoğdu and Watson, 2023; Yang et al., 2023).
Despite the ever-increasing cost of running private motor vehicles, evidence suggests that private vehicle ownership is on the rise across the globe with the ever-increasing new vehicle registrations (Paul and Blumenberg, 2023). Therefore, understanding how public transport can be made a more attractive alternative to private motor vehicles is essential.
Public transport includes a multitude of alternative modes (like buses, ferryboats, minibuses, taxis, trains, etc.), different types of passengers (like older people, disables people, students, workers, leisure travelers, etc.) and passengers with various travel purposes and frequencies. Similarly, many factors can affect commuters decisions to use public transport over private vehicles. These factors include access times to service points and end destinations, waiting times at stops and interchanges, travel times, service timeliness, car ownership, income level, travel cost, etc. Nevertheless, this topic has not been addressed comprehensively and, in general, has been underreported in the scientific literature (Susilo et al., 2010; Ismail et al., 2012; Soza-Parra et al., 2022; Ulahannan and Birrell, 2022).
Public transport characteristics usually influence commuters demand (i.e. their decision to use public transport). Poudenx (2008) argued that the quality, comfort and punctuality of public transport modes have to be enhanced in order to encourage commuters to switch from using own motor vehicles to public transport. Therefore, understanding how public transport services are offered and assessing their quality are essential for understanding the attitude, behavior and preferences of commuters and demand for public transport in general. It is important, thus, to understand the nature and dynamics of these characteristics in order to increase demand and optimize the use of public transport (Eboli and Mazzulla, 2007; Matas et al., 2009; Ismail et al., 2012; Taylor and Camille, 2012; Botzoris et al., 2015).
Public transport is environmentally friendly, energy efficient and reduces thousands of tons of CO2 per year (Alkhaledi, 2015; Botzoris et al., 2015). It serves as a more environmentally friendly and energy efficient option than private motor vehicles. Specifically, buses emit 103 g of carbon dioxide per passenger kilometer in comparison to 168 g emitted by private motor vehicles (Department for Business, Energy and Industrial Strategy, 2020). Similarly for energy use, busses consume, on the average, 1 MJ/km while private motor vehicles consume 2–3 MJ/km (Poudenx, 2008). This makes encouraging the use of public buses a dire need for local authorities in crowded cities.
The ever increasing traffic congestion and pollution in crowded cities, together with the dramatic climate change make reducing carbon emissions a necessity. Improving public transportation and assessing public preferences is essential in this regard. Assessing perceptions and experiences of public bus commuters, as also stressed by Eboli and Mazzulla (2007), is a dare necessity in this regard. This study aims to assess public opinion on one of the modes of public transport, namely buses, in Istanbul city. It specifically aims to assess what makes commuters, or potential commuters, opt to use, or not to use, buses in this city with 16 million residents and millions of others who go there for business, tourism or other purposes. Results of this study are expected to shed more light on public buses commuter preferences and help decision makers in making buses a more attractive option to private motor vehicles for them. This, in turn, will inevitably help in reducing greenhouse emissions.
Next section introduces materials and methods used in the current study. This is followed by a results section. Finally, discussion and conclusions are given in the last section.
2 Materials and methods
To explore commuters attitude toward and preferences regarding public buses in Istanbul, a questionnaire was developed based on questionnaires and ideas presented by Susilo et al. (2010), Botzoris et al. (2015), Ziefle and Wilkowska (2015), and Ulahannan and Birrell (2022). The questionnaire was divided into two sections. The first section on demographic data asked respondents about:
1. Gender: (male, female)
2. Age (17–24, 25–34, 35–44, 45–54, 55–64, 65+)
3. Education level (primary school or less, middle school, high school, 2-year technical college, university graduate)
4. Income: (very low, low, medium, high, very high)
5. Work status? (unemployed, student, worker, professional (e.g. lawyer, engineer, etc.) manager, retired, housewife, self-employed, other professions)
6. Owning a private car? (yes, no)
The second section of the questionnaire included 14 questions as follows:
1. How often do you use public buses? (everyday, 3–5 days/week, 1–2 days/week, 1–2 days/month, <1 day/month)
2. Why do you use public buses? (to go to work, go to school, follow up on personal work like bank, for social purposes like visiting friends and family, have fun or for touristic purposes, for health related issues, others)
3. What other alternatives did you have to travel to the same destination? (walking, using a taxi, using my motor vehicle, using a bicycle, other alternatives, I don't have any other alternative)
4. How long does it take you to get to your most frequently used public bus stop (in minutes)?
5. In relation to the previous question, how do you find the duration you indicated? (very inconvenient, inconvenient, average, convenient, very convenient)
6. How long do you wait, on the average, for the bus to arrive on your most frequently used public bus (in minutes)?
7. In relation to the previous question, how do you find the duration you indicated? (very inconvenient, inconvenient, average, convenient, very convenient)
8. Out of the following mobile phone apps, which one do you use more often than others and why? (MetroIstanbul, Sehir Hatlari, MobIETT, IBB Nav, Trafi, Moovit, Citymapper, others)
9. While traveling on buses, what sort of information do you need (you can choose upto three options)? (line information, bus stop locations, travel time, bus stop arrival times, information on other bus trips, bus ticket fees, delays, others)
10. Do you support the option to increase bus fees during peak hours? (yes, no; if no why?)
11. Do the current bus routes satisfy your needs? (yes, no)
12. Are you satisfied with the quality of bus service you are getting? (extremely unsatisfied, unsatisfied, neutral, satisfied, extremely satisfied)
13. Are you satisfied with bus stops (waiting area, sitting facilities, information screens, etc.)? (yes, no)
14. Do you find bus stop locations safe and convenient in general? (yes, no)
The sample size was determined as 620 based on previous similar studies [e.g., Jain et al. (2014), Botzoris et al. (2015), and Ziefle and Wilkowska (2015)]. Therefore, data collection continued till reaching this number. Potential participants were randomly approached at bus stops across six suburbs of Istanbul (three on the European side and three on the Asian side) by a team of two trained data collectors. Children under the age of 17 were not approached and, therefore, were not included in the study. Potential participants were explained the purpose of the study and asked to participate in it while assuring them that no personal information would be sought. After securing their verbal consent, they were given a tablet to confirm their consent on the tablet and then they were asked to reply to the questions on the tablet. It took the majority of respondents 5–8 min to respond to the questionnaire. Their questions, if any, were answered in the meantime. Descriptive statistics and crosstabulation were used to explore the data. Since normality could not be assumed in the results, non-parametric tests, namely Kruskal Wallis and Mann-Whitney U tests, were used to analyze the data. A significance level of 0.05 was adopted in this study.
3 Results and discussion
3.1 Demographics
Out of the 620 people who participated in this study, 403 (65%) were male and 217 (35%) were female. Moreover, 200 (32.3%) were in 17–24 age group, 157 (25.3%) in 25–34 age group, 123 (19.8%) in 35–44 age group, 81 (13.1%) in 45–54 age group, 35 (5.5%) in 55–64 age group and 24 (3.9%) were 65 years of age or older. Education level distribution of respondents was as follows: illiterate 3 (0.5%), primary school 57 (9.2%), intermediate school 94 (15.2%), high school 254 (41%), technical college 30 (4.8%), bachelor 168 (27.1%) and master degree or above 14 (2.3%).
As for monthly income, 44 (7.1%) reported receiving no or close to zero income, 104 (16.8%) reported receiving very low income, 134 (21.7%) reported receiving low income, 137 (22.1%) reported receiving medium income, 77 (12.4%) reported receiving high income while 74 (11.9%) reported receiving very high income. The remaining 50 (8.1%) respondents did not wish to reveal their income.
For work status, out of the 620 respondents, there were 178 (28.7%) students, 35 (5.6%) professionals, 10 (0.16%) managers, 29 (4.7%) retired, 29 (4.7%) housewives, 58 (9.4%) unemployed, 229 (36.9%) workers, 41 (6.7%) self-employed and 8 (1.4%) of other professions while 3 (0.5%) declined to respond to this question. In the final question on demographics, 121 (19.5%) of the respondents indicated that they own a private motor vehicle while the remaining 499 (80.5%) indicated that they don't.
An overall look at demographic characteristics of the 620 respondents reveal that they cover a wide spectrum of the society in terms of gender, age, education level, income, and work status. This adds to the representative nature of the sample chosen and enhances credibility of the results.
3.2 General findings
Results of all questions on bus usage and satisfaction are summarized in Table 1.
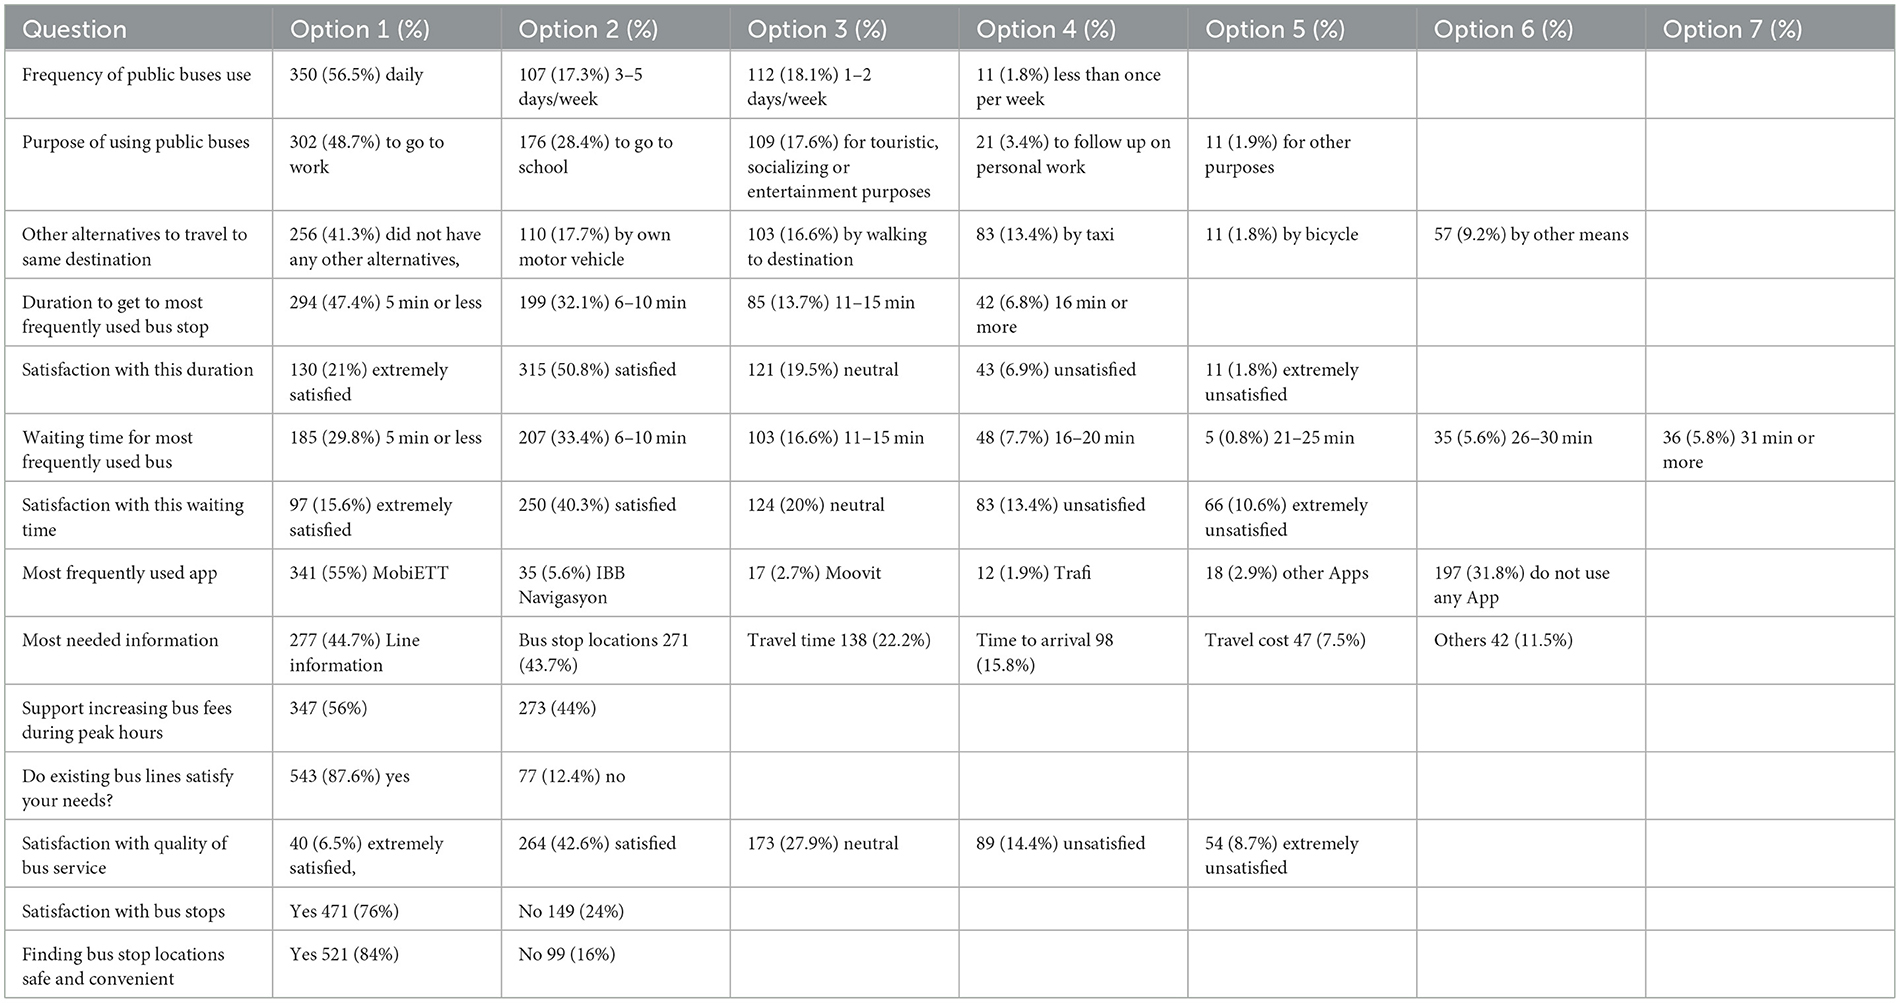
Table 1. Questionnaire results.
As can be seen in Table 1, the majority of respondents indicated using public buses on a daily basis and using them to go to work or school. Moreover, a considerable part of respondents (41.3%) indicated not having any other alternative to get to the same destination other than public buses while others indicated having various alternatives for that. This shows that a fairly large portion of public bus users use those buses regularly and that using public buses is their only option.
Out of the 620 respondents, 20.5% indicated that it took them 11 or more minutes to get to their most frequently used bus stop with few of them indicating very long durations (upto 60 min) to reach to their most frequently used bus stop. Also, 8.7% of respondents indicated their dissatisfaction with their waiting times at bus stops. Although the majority of the sample chosen indicated waiting reasonable durations for buses and their satisfaction with that, yet some indicated waiting for long periods and their dissatisfaction with those waiting times. It is therefore recommended that authorities try to investigate this issue and do a detailed study on bus stop locations in order to make them closer to users in this city of 16 million inhabitants and millions of others who come to visit.
Besides this, 63.2% of respondents indicated waiting 10 min or less for their most frequently used bus with another 5.8% indicating waiting 31 min or more for buses while all others lied in between. Moreover, 55.9% of them indicated their satisfaction with this duration, 20% were neutral while the remaining 24.1% indicated their dissatisfaction. This finding pinpoints that a considerable portion of commuters wait for very long times, that many are not satisfied with their waiting times. It is recommended that this problem be addressed by authorities to try to minimize this waiting duration and improve satisfaction.
For the most needed information, 44.7% of respondents indicated line information, 43.7% bus stop locations, 22.2% travel time, 15.8% time to arrival and 7.5% travel cost. As for the most frequently used mobile phones Apps, results indicated that MobIETT, which is an App developed by the Greater Municipality of Istanbul for mobilization and transportation purposes, was the App used by 55% of respondents while 31.8% of them indicating not using any App. The remaining 13.2% indicated using other Apps.
Again, the majority (55%) of respondents indicated their acceptance of the idea of increasing bus fees during peek hours to minimize congestion. Finally for satisfaction questions, 87.6% of respondents indicated that bus services satisfy your needs, 82.6% indicated their satisfaction with the quality of bus services, 76% indicated their satisfaction with existing bus stops and 84% indicated finding bus stops suitable in terms of location and safety. This indicates that the majority of bus commuters are satisfied with bus services. Yet there is a minority who indicated their dissatisfaction which should be addressed by authorities to try to satisfy their needs and improve satisfaction rates.
3.3 Gender differences
Mann-Whitney U test results showed that female respondents indicated significantly lower satisfaction rate with bus services than male respondents (p < 0.001). Results revealed that 57.3% of males indicated their satisfaction with bus services (with 25.1% indicating being neutral) while 33.6% of females indicated their satisfaction with bus services (with 33.2% indicating being neutral). Moreover, Mann-Whitney U test results showed that female respondents indicated significantly lower satisfaction rate with waiting times than male respondents (p < 0.001). 74.9% of males indicated their satisfaction with their waiting times (with 18.4% indicating a neutral opinion) while 65.9% of females indicated their satisfaction with their waiting times (with 21.7% indicating a neutral opinion). Finally, results showed that 82.5% of female respondents indicated that current bus services satisfy their needs while 90.3% of males indicated the same response (p < 0.01). It is clear from the results that there is a trend of lower satisfaction of female commuters that their male counterparts.
This generally lower satisfaction of female commuters might be attributed to many factors including physiological differences, family commitments, car ownership, and others. It should be noted that male respondents generally indicated a higher rate of motor vehicle ownership than female respondents (23.1 vs. 12.9%), however this difference was not statistically significant. Yet, this important finding should serve as an indicator for authorities to aim for better services specifically targeting female commuters.
3.4 Age effects
Kruskal-Wallis test results indicated that satisfaction with quality of bus services (p = 0.03), overall satisfaction with bus stops (P < 0.001), satisfaction with safety and convenience of bus stop locations (P < 0.001) and car ownership increased with age (p < 0.01). This might be attributed to changes in expectations and increased financial power with advances in age. It is therefore recommended that public transport authorities find ways to improve satisfaction of younger users of public buses.
3.5 Income effects
Kruskal-Wallis test results indicated that overall satisfaction with general bus services (p < 0.001), satisfaction with bus routes (p = 0.03) and waiting time at bus stops (p < 0.001) was higher in high income groups than among low income groups. These interesting findings might be attributed to general life satisfaction and the presence of more alternatives for commuters with higher income. Moreover, results showed that people with higher income tend to use public buses less than those with lower income (p = 0.04) probably due to the presence of more transport options for them (like taxis and private vehicles).
3.6 Education level effects
Kruskal-Wallis test results indicated that commuters with higher education levels tend to own motor vehicles more often than commuters with lower levels (p = 0.03). This might be attributed to the anticipated higher income of people with higher education levels than those with lower education levels.
4 Discussion and conclusions
This study aimed to assess public opinion on bus services, as one of the modes of public transport, in Istanbul city and assess what makes commuters opt to use, or not to use, public buses as one of the most important modes of public transport. Results are expected to shed light on how to increase public transport usage, decrease private motor vehicle usage and lower greenhouse emissions. A total of 620 people responded to the questionnaire with 77.4% of them being young (under the age of 44) and with 65% of them being male. Demographic data of respondents indicate that they come from a wide variety of professions, age groups, education levels, etc. which adds to the credibility of the findings.
One of the main findings of the current study was the lower satisfaction rate of female commuters than their male counterparts on many of the factors investigated. A similar finding was reported by Borhan et al. (2019) for public bus computers in Putrajaya, Malaysia where female participants reported a general lower satisfaction and more safety concerns than male commuters. This may be attributed to differences in many factors like physiological attributes, family commitments, car ownership, expectations, etc. It is, therefore, recommended that public transport authorities should investigate this issue further in order to better accommodate female commuters needs and expectations and to try to improve their satisfaction and public bus usage rate.
Finding of the current study also indicate that the majority of public bus commuters are satisfied with bus services, waiting times and bus stop locations. Nevertheless, results indicate that a minority of users still wait for long and unacceptable durations for buses and/or walk for fairly long distances to the nearest bus stop. Satisfaction with waiting time recorded in the current study was higher than that reported by Soza-Parra et al. (2022) where greater dissatisfaction of bus commuters was reported in Santiago, Chile and by Botzoris et al. (2015) in Thessaloniki, Greece. This greater satisfaction with commuters' waiting time for public busses in Istanbul might be attributed to the better road infrastructure that Istanbul has and mainly newer and better maintained buses in Istanbul when compared to those of Santiago. Nevertheless, these potential reasons need to be investigated further.
Results also indicate that satisfaction is higher on some public bus satisfaction indicators for commuters of older ages and higher income levels. These findings should encourage authorities to develop ways to improve satisfaction rates among younger public bus commuters with lower income levels and encourage researchers to investigate and assess the relationship between public transport satisfaction and income and age further.
As one of the ways to improve public bus services and decrease congestion is to increase fees during peak times, most respondents indicated supporting this measure, the result which was also echoed in a previous study by Jain et al. (2014). This majority support serves as an indicator to decision makers in megacities to seek alternative ways to improve public transport services and minimize congestion including increasing fees during peak times.
Overall, with the ever-increasing pressure for minimizing carbon footprint and increasing commuter satisfaction as also echoed by Erdoğdu and Watson (2023), there is a growing need for identifying commuters transport decisions in order to make using public transport a more viable option and using private motor vehicles less attractive. Results of the current study revealed that satisfaction with public buses in Istanbul city is high; yet, female and younger commuters and those with lower income levels recorded lower satisfaction rates than other groups of commuters. It is, therefore, recommended that local authorities develop ways to improve satisfaction rates of those groups of commuters. Also, more research is recommended in this area.
Finally, it is important to indicate limitations of the current study. Results presented in this study should be considered with caution. This study was based on the opinion of 620 participants in Istanbul and more research is needed in this area for decision makers to have a clearer understanding of commuter preferences. Also, generalizing the results to other cities may not be appropriate due to differences in circumstances and conditions and more research is needed in this area. More research also is needed to examine commuters opinion of other public transport modes like trains and ferry boats to gain a global ideaon how to improve public transportation services and make them more attractive.
Data availability statement
The raw data supporting the conclusions of this article will be made available by the authors, without undue reservation.
Ethics statement
Ethical review and approval was not required for the study on human participants in accordance with the institutional requirements. Written informed consent from the participants was not required to participate in this study in accordance with the institutional requirements.
Author contributions
AG: Conceptualization, Data curation, Software, Writing – review & editing, Investigation, Supervision, Validation. KA: Investigation, Validation, Writing – review & editing, Methodology. SS: Investigation, Methodology, Writing – review & editing, Conceptualization, Data curation, Resources, Supervision. SB: Conceptualization, Data curation, Methodology, Software, Writing – original draft, Writing – review & editing.
Funding
The author(s) declare that no financial support was received for the research, authorship, and/or publication of this article.
Acknowledgments
The authors would like to thank Haliç University, University of Kuwait and Star Araştırma ve Denetim Hizmetleri for their support of this study.
Conflict of interest
SS was employed by Star Araştirma ve Denetim Hizmetleri.
The remaining authors declare that the research was conducted in the absence of any commercial or financial relationships that could be construed as a potential conflict of interest.
Publisher's note
All claims expressed in this article are solely those of the authors and do not necessarily represent those of their affiliated organizations, or those of the publisher, the editors and the reviewers. Any product that may be evaluated in this article, or claim that may be made by its manufacturer, is not guaranteed or endorsed by the publisher.
References
Alkhaledi, K. (2015). Evaluting the operational and environmental benefits of smart roundabouts. S. Afr. J. Ind. Eng. 26, 191–202. doi: 10.7166/26-2-1025
Alkhaledi, K., Means, K. H., Bendak, S., Arnold, A. M., and Jones, J. (2017). Evacuated solar tube performance enhancement evaluation. J. Eng. Res. 5, 207–222.
Borhan, M. N., Ibrahim, A. N. H., Syamsunur, D., and Rahmat, R. A. (2019). Why public bus is a less attractive mode of transport: a case study of Putrajaya, Malaysia. Period. Polytech. Transp. Eng. 47, 82–90. doi: 10.3311/PPtr.9228
Botzoris, G., Galanis, A., Profillidis, V., and Eliou, N. (2015). Commuters perspective on urban public transport system service quality. WSEAS Trans. Environ. Dev. 11, 182–192.
Clark, B., Chatterjee, K., Martin, A., and Davis, A. (2020). How commuting affects subjective wellbeing. Transportation. 47, 2777–2805. doi: 10.1007/s11116-019-09983-9
Department for Business Energy and Industrial Strategy. (2020). Greenhouse Gas Reporting: Conversion Factors 2019. London: Department for Business, Energy and Industrial Strategy.
Eboli, L., and Mazzulla, G. (2007). Service quality attributes affecting customer satisfaction for bus transit. J Public Transport. 10, 21–34.
Erdoğdu, A. I., and Watson, F. (2023). Millennials' changing mobility preferences: A telecommuting case in Istanbul. J. Cons. Behav. 22, 483–495. doi: 10.1002/cb.2101
Ismail, R., Hafezi, M. H., Mohd Nor, R., and Ambak, K. (2012). Passengers preference and satisfaction of public transport in Malaysia. Aust. J. Basic Appl. Sci. 6, 410–416. doi: 10.19026/rjaset.6.3969
Jain, S., Aggarwal, P., Kumar, P., Singhal, S., and Sharma, P. (2014). Identifying public preferences using multi-criteria decision making for assessing the shift of urban commuters from private to public transport: a case study of Delhi. Transp. Res. F Traffic Psychol. Behav. 24, 60–70. doi: 10.1016/j.trf.2014.03.007
Lee, Y., Circella, G., Mokhtarian, P. L., and Guhathakurta, S. (2020). Are millennials more multimodal? A latent-class cluster analysis with attitudes and preferences among millennial and Generation X commuters in California. Transportation 47, 2505–2528. doi: 10.1007/s11116-019-10026-6
Matas, A., Raymond, J. L., and Roig, J. L. (2009). Car ownership and access to jobs in Spain. Transp. Res. A Pol. Pract. 43, 607–617. doi: 10.1016/j.tra.2009.04.003
Paul, J., and Blumenberg, E. (2023). Vehicle ownership rates: The role of lifecycle, period, and cohort effects. Transp. Res. Interdiscip. Perspect. 21, 100892. doi: 10.1016/j.trip.2023.100892
Poudenx, P. (2008). The effect of transportation policies on energy consumption and greenhouse gas emission from urban passenger transportation. Transport. Res. Part A Policy Pract. 42, 901–909. doi: 10.1016/j.tra.2008.01.013
Soza-Parra, J., Raveau, S., and Muñoz, J. C. (2022). Public transport reliability across preferences, modes, and space. Transportation 49, 621–640. doi: 10.1007/s11116-021-10188-2
Susilo, Y. O., Joewono, T. B., and Santosa, W. (2010). An exploration of public transport users' attitudes and preferences towards various policies in Indonesia: some preliminary results. J. East. Asia Soc. Transp. Stud. 8, 1230–1244.
Taylor, B. D., and Camille, N. Y. (2012). Factors Influencing Transit Ridership: A Review and Analysis of the Ridership Literature, Working Paper. Los Angeles, CA: Department of Urban Planning, UCLA Institute of Transport Studies.
Ulahannan, A., and Birrell, S. (2022). Designing better public transport: understanding mode choice preferences following the COVID-19 pandemic. Sustainability 14, 5952. doi: 10.3390/su14105952
Yang, J., Shiwakoti, N., and Tay, R. (2023). Passengers' perception of satisfaction and its relationship with travel experience attributes: results from an Australian survey. Sustainability 15, 6645. doi: 10.3390/su15086645
Keywords: public transport, buses, megacities, Istanbul, global warming
Citation: Genç A, Alkhaledi K, Sağlam S and Bendak S (2023) Commuters opinion on public transport services in mega cities: the case of Istanbul buses. Front. Sustain. Cities 5:1291914. doi: 10.3389/frsc.2023.1291914
Received: 10 September 2023; Accepted: 07 November 2023;
Published: 27 November 2023.
Edited by:
Paolo Santi, Massachusetts Institute of Technology, United StatesReviewed by:
Uneb Gazder, University of Bahrain, BahrainRenata Żochowska, Silesian University of Technology, Poland
Copyright © 2023 Genç, Alkhaledi, Sağlam and Bendak. This is an open-access article distributed under the terms of the Creative Commons Attribution License (CC BY). The use, distribution or reproduction in other forums is permitted, provided the original author(s) and the copyright owner(s) are credited and that the original publication in this journal is cited, in accordance with accepted academic practice. No use, distribution or reproduction is permitted which does not comply with these terms.
*Correspondence: Khaled Alkhaledi, aGYuc0BrdS5lZHUua3c=; Salaheddine Bendak, c2JlbmRha0BoYWxpYy5lZHUudHI=