 Yue Qian
 Guanmin Qiao
 Tonglu Li4
 Renfeng Ma
- 1Department of Geography and Spatial Information Techniques, Ningbo University, Ningbo, China
- 2Zhejiang Collaborative Innovation Center, Ningbo Universities Collaborative Innovation Center for Land and Marine Spatial Utilization and Governance Research, Ningbo University, Ningbo, China
- 3Donghai Academy, Ningbo University, Ningbo, China
- 4Department of Geography, The University of Hong Kong, Hong Kong, China
Background: Equalization of medical services is fundamental to the development of people-centered urbanization in Chinese-style modernization. In the past few decades, the achievements of the Chinese economy have remarkably increased the quantity and quality of healthcare services. Under rapid urbanization, large-scale population floating has led to a mismatch between supply and demand for healthcare services and raised the tension between spatial demographic reorganization and the relative stability of public healthcare service facilities. The current studies of healthcare spatial deprivation (HSD) mainly are focus on either supply, or demand, or accessibility based on census data. Therefore, it is necessary to build a multiple index that could give a physical result by using ordinary indices and mixing them together by relative methods to overcome this problem.
Measure: We chose Ningbo city, Zhejiang province, located in the eastern coastal region of China, as the study area. Moreover, from 2000 to 2020, the urbanization rate of Ningbo rapidly increased from 55.75 to 78.0%. In order to show the HSD in a rapidly urbanizing city, we first consider the subdistrict as the scale, innovatively absolve the medical accessibility to the IRD (Index of Relative Disadvantage), and construct the Index of Healthcare Relative Spatial Deprivation (IHRSD) framework. Based on the seventh national census data, we apply an IHRSD with Entropy Weight Method, 2SFCA (Two-step Floating Catchment Area Method) and GDM (Geographical Detector Model) to measure where and who are vulnerable to deprive in healthcare.
Result: Measured by IHRSD, (1) There is stronger healthcare spatial deprivation in peri-urban and developed-town in Ningbo; (2) Young childhood and fertile-women are vulnerable to healthcare spatial deprivation, in fact, they are spatially deprived in healthcare; (3) The socio-demographic attribute is a significant factor in healthcare spatial deprivation, especially the level of aging and population clustering; and (4) The relationship between healthcare spatial deprivation and accessibility shows an inverted U-shaped structure.
Conclusion: Our experiments show that the problems of HSD are mainly from the characteristics of the population, the layout of healthcare service institutions, the accessibility of the traffic system and the natural conditions. Although the constructions of equalization of primary medical and health services, hierarchical diagnosis, and treatment, and the “healthcare complex” are currently trying to reduce the phenomenon of HSD. Faced with groups and location, the acquisition of the accurately healthcare service supply is the key to realizing healthcare spatial equity.
1. Introduction
With rapid urbanization, rural residents are constantly flocking to cities, resulting in a gap between the expansion of the entire society and certain distinct groups. It is urgent to make up for deficiencies in public services. Lots of problems emerged in areas where the city may not provide adequate basic institutions and services for their residents, such as exacerbating urban congestion, segregation and inequality, leading to a variety of deprivations (Deguen and Zmirou-Navier, 2010; Gray et al., 2013; Lin et al., 2015). These problems become more serious in rural or other developing areas. The current works raise the profile of urban-rural difference, but small-scale measures of deprivation have not tested the robustness of the different variables with respect to social characteristics, which should clearly be a focus, especially in diverse countries (Braveman et al., 2005; Messer et al., 2006; Tunstall et al., 2012). The “Healthy China” strategy was first proposed in the report of the 19th National Congress in 2017, and since comprehensive and full cycle health services have become a demand of the times. The report on the work of the Chinese Government in 2023 proposed to promote the expansion and subsidence of high-quality medical resources and regionally balanced layout. Public healthcare service institutions are one of the most basic needs of the public, directly related to health and happiness. Currently, there are still serious problems in the allocation of medical resources in urban and rural areas in China, as well as in public health and primary healthcare, and the trend of health inequalities among residents is constantly expanding (Yang et al., 2020). In the context of Chinese development, exploring the spatial deprivation of large-scale population floating services is an important realization of the equalization of healthcare services, satisfying the people's needs, and solving the imbalance of supply-demand.
In the context of rapid urbanization, spatial inequality emerges and leads to spatial deprivation. Spatial inequality is specifically reflected in a series of imbalances between people's living demands and infrastructure construction. Some studies (Bertin et al., 2014; Allik et al., 2016) have confirmed that there are similar associations between healthcare and deprivation in urban and rural areas. The demographic changes caused by urbanization, in particular, have increased demand for healthcare institutions, resulting in a mismatch between healthcare services and population demands, exacerbating healthcare inequalities and leading to healthcare spatial deprivation (HSD; Li et al., 2016; Prasad et al., 2018; Lopes et al., 2019). This kind of deprivation is particularly reflected in the spatial deprivation of vulnerable groups such as the elders (Kabisch et al., 2017), women (Jarman, 1983), children (Huang et al., 2020), the disabled (Qiu et al., 2022), the poor (Loignon et al., 2015; Taylor and Pettit, 2020), and rural residents (Han and Chung, 2022). Many studies (Huang et al., 2020; Qiu et al., 2022) summarize deprivation factors, i.e., social status (Jarman, 1983; Whitehead et al., 2019; Lanlan, 2021), economic status (Loignon et al., 2015), healthcare demands (Field, 2000), accessibility (Baraklianos et al., 2020), and urban-rural disparity (Han and Chung, 2022), which are from extended thinking and in-depth exploration of poverty deprivation. To analyze how these factors affect IHRSD and HSD, there are referential studies on constructing multiple deprivation indices, such as the Townsend Deprivation Index (Townsend, 1987), the Under Privileged Area Score (Jarman, 1983, 1984), the Carstairs Deprivation Index (Carstairs, 1995), Geo-PSA (Geographic-Population Services Access Model; Iyer et al., 2020), IRD (Field, 2000), and the Disability Multiple Deprivation Index (Qiu et al., 2022). These indicators and models play an important role in measuring the quality of urbanization, not only to improve the equalization of public services, but also to establish a basic public service system that benefits all people.
A wide range of studies present comparative analyses of healthcare resource accessibility in specific environment and regions (Wan and Su, 2017; Jin et al., 2019). Current relevant HSD studies mainly provide a single perspective on healthcare supply, healthcare demand, or healthcare accessibility based on census data. There is less research from a comprehensive perspective that includes healthcare quality in healthcare spatial deprivation systems (Iyer et al., 2020). On the supply side, most studies focus on the number of available healthcare services and ignore other services such as the number of hospital beds (Mao and Nekorchuk, 2013). And on the demand side, scholars usually rely on population size as an important indicator for healthcare demands, lacking adjustment for socioeconomic and other attributes (Neutens, 2015). With the rapid development of GIS, accessibility could connect demand-side and supply-side in space, but ignore the characteristic of demander and supplier. Current measures of accessibility in empirical healthcare research tend to be conceptualized in static spatial terms, simplifying population mapping and inflating population demand, thereby generating misleading healthcare landscapes and consequently misinformed policy interventions (Hawthorne and Kwan, 2012; Dewulf et al., 2013). Although the evaluation system of healthcare service quality and related evaluation indicators (Xingquan, 2018) have been continuously focused on and discussed, there are still biased perspectives. Cabrera-Barona P created a composite healthcare accessibility index (CHCA) and a composite healthcare satisfaction index (CHCS) to explain accessibility and satisfaction related to healthcare (Cabrera-Barona et al., 2017), noting that the variable of healthcare service supply represented by different perspectives is a direction for future research in depth. For instance, for primary healthcare concerns, the healthcare service with the highest score could be a healthcare center and not a specialized hospital.
Therefore, we combine supply, demand, accessibility, and healthcare quality evaluation systems into the study of healthcare spatial deprivation, aiming to reveal more comprehensively the trade-off considerations of equity and efficiency behind the healthcare spatial pattern. The IHRSD is used to reveal the spatial deprivation pattern of healthcare resources and service capacity under rapid urbanization and to provide insights for the construction of public service equalization in new urbanization. We establish the following hypotheses: (1) There is high HSD in the downtown because of population clustering, and in the rural area because of the less developed and poverty; (2) Young childhood, fertile women, and the elderly, as the vulnerable groups, are more vulnerable to HSD; and (3) There are regional differences in HSD, mainly due to factors such as socio-demographic, urban development, and nature.
This paper is organized into five parts. Following this introduction, Section 2 aims to introduce the study area, review relevant literature on deprivation and disability, justify the analytical and modeling methods used in this study, and describe how the data were collected and processed. The results are presented and interpreted in Section 3. A critical discussion of HSD follows in Section 4, and conclusions are drawn in Section 5.
2. Methods
2.1. Study area
Ningbo is located between 120°55′-122°16′E and 28°51′-30°33′N. The topography is high in the west and low in the east, with gentle terrain and dense rivers. Ningbo is a typical coastal city, and its urbanization is the epitome of the rapid urbanization of the southeast coastal cities in China. Ningbo has a resident population density of 808 persons per km2. From 2000 to 2020, the urbanization rate of Ningbo has increased from 55.75 to 78.0%, which is in the progress of rapidly urbanization; GDP has risen from 114.46 billion RMB (13.83 billion $USD) to 1,240.87 billion RMB (179.58 billion $USD), with an average annual growth rate of 10.1%. The total number of medical institutions has risen from 929 in 2000 to 4,707 in 2020, with an average annual increase of 8.45%; the total number of beds has risen from 14,535 to 44,447, with an average annual growth of 5.7%; and the number of health technicians has expanded from 19,200 to 79,500, with an average annual growth of 7.4%.
According to the Ningbo Health and Family Planning Statistics Compilation, there are 2,717 healthcare institutions in Ningbo, of which there are 195 hospitals (the 1st grade), 156 healthcare centers (the 2nd grade), 490 community healthcare service stations, and 1,876 village clinics (the 3rd grade), which called tertiary diagnosis and treatment systems, and the ratio of each grade is about 1:1:12, and are the result of a series of healthcare spatial grading systems (Figure 1). Primary healthcare institutions include the 2nd grade and the 3rd grade healthcare facilities, which are widely distributed; therefore, there must be at least one health center in every town or township.
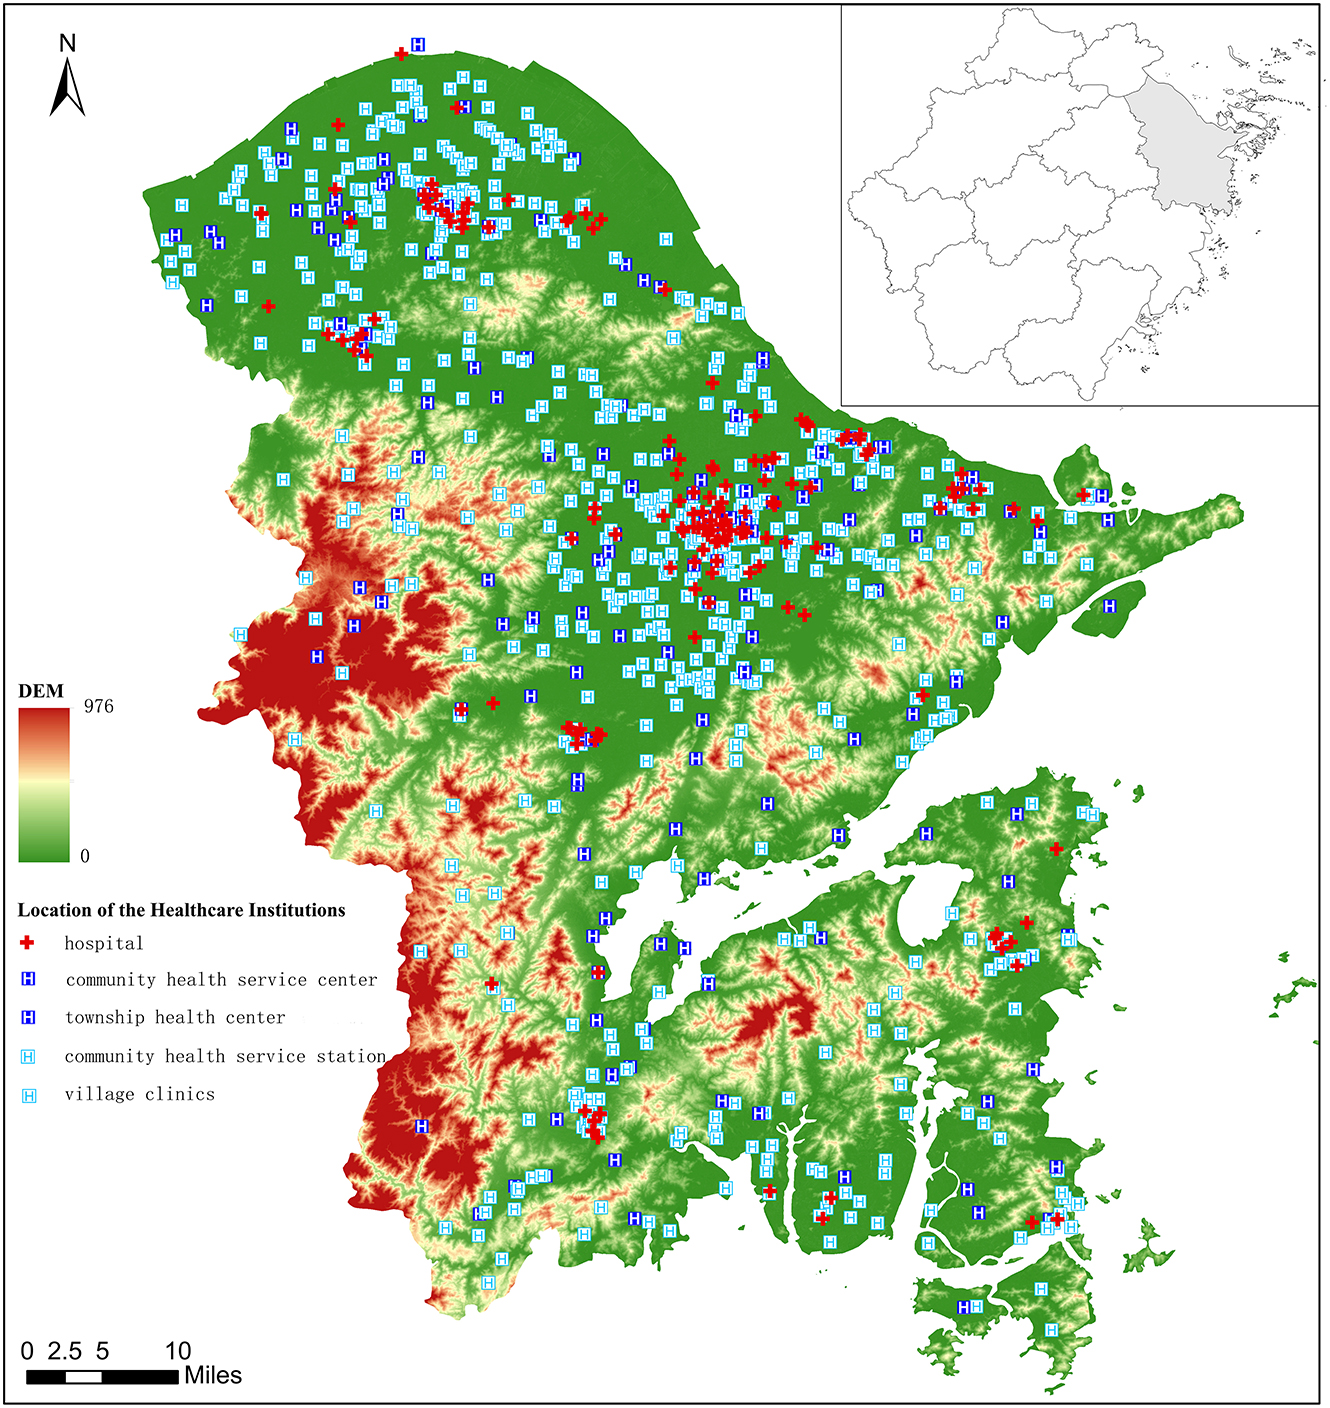
Figure 1. The distribution of muti-level healthcare institutions in Ningbo.
2.2. Methodology
2.2.1. Entropy weight method
To reduce errors, different scholars use different standardization measures, such as z-score method (Allik et al., 2016), the IRIS (Bertin et al., 2014), AHP (Cabrera-Barona et al., 2017), etc., but all suffer from limitations such as lack of robustness, small area limitations, and subjective effects of expert scoring. The deprivation index is constructed quantitatively using an objective weighting method based on entropy weighting, taking into account subjective and objective factors, supply and demand, etc., which helped to form a multi-indicator system. Shannon and Weaver proposed EWM in 1947 (Shannon, 1948), and Zeleny emphasized further developments in 1982. The EWM is utilized to establish the objective weights of the attributes/responses. The probability theory is utilized to compute uncertain information (Entropy). It determines the importance of every response, not including any thoughtfulness of the preference of the decider (the specialist or manager). The EWM works on the principle that superior weight indicator information is more constructive than the lower indicator information. This method includes first deciding objectives (decision matrix) and then calculations of the normalized decision matrix, the probability of the attribute/response to take place, the entropy value of the attribute/response, the degrees of divergence (average information contained) by each response, and after that entropy weight (Rao et al., 2009; Kumar et al., 2017). The greater the dispersion of the indicator, the greater the information entropy of the indicator, the more information it provides, and the greater its role in the spatial deprivation index system, so it is given a higher weight. The entropy weight method (Ming et al., 2018) is calculated as follows:
pijis the magnitude of the variance;
Yij is the coefficient after normalization;
Ej is the information entropy;
Wj is the weight.
2.2.2. IHRSD
The themes of spatial inequality and spatial deprivation are long-standing areas of focus on human geospatial research. Approaches to developing deprivation indices are diverse (Niggebrugge et al., 2005; Pampalon et al., 2009; Pasetto et al., 2010). Spatial deprivation is a system that relates to the conditions in which people are born, grow, live, and work, as well as the conditions that shape everyday life, and has important implications for healthcare equity and spatial equity. Spatial deprivation was first targeted at disadvantaged groups, and many countries have developed appropriate deprivation indices based on this socio-economic disadvantage, such as the Area Deprivation Index (ADI) in the USA and the Index of Multiple Deprivation (IMD) in the U.K. The Social Disadvantage Research Center at the University of Oxford has produced the Indices of Deprivation (ID) for England since 2000 (McLennan et al., 2011). A growing body of research suggests that there is not just a single form of spatial deprivation, but a more specific combination of deprivation forms that can be directly measured, and that this multiple deprivation is interactive (Noble et al., 2006). Numerous studies have demonstrated the existence of vertical inequalities in healthcare utilization based on indicators of education, income, occupation, etc. that represent socioeconomic status. Field (2000) proposes the IRD (Index of Relative Disadvantage) framework to construct an index of spatial deprivation in primary health to measure primary care demands, but the lack of representation of quality of care in this model simplifies the issue of spatial deprivation in healthcare.
The availability of the Carstairs score for such a long time-span is a great strength, but it has also made it vulnerable to social change. This has caused some debate about whether the index is still able to measure deprivation as well as it did in the past (Hanlon et al., 2005; Tunstall et al., 2012). Cabrera-Barona et al. (2015) argued that the Carstairs score is less able to distinguish healthcare inequalities among young adults aged 20–29, and this is largely driven by including car ownership in the measure. And in some circumstances, the Carstairs score is unable to distinguish between deprived and less deprived areas. The Townsend and Carstairs indices also include a very specific variable available in the British Census, namely the indicator of “Non car ownership” (Cabrera-Barona et al., 2015). Which are deemed proxies for income in the urban population, are weaker discriminators of wealth in rural settings (Farmer et al., 2001). Cabrera-Barona et al. (2017) study adds to this debate by showing that car ownership may also underestimate ill health and health inequalities among youth, in addition to the urban-rural issues already raised. However, there are differences in demand for automobiles in rural areas of China and the West. The China's public transportation is widely available, rural areas are more densely built up than in the West and in close proximity to cities, the private car is not a necessity for China's rural population. Therefore, the choice of car ownership as an indicator of economic status is still objective. Though common indicators for the Townsend Deprivation Index (Townsend, 1987) and the Carstairs deprivation index (Carstairs, 1995) are overcrowding and unemployment. The correlation coefficients for overcrowding suggest that the variable has become less suited to capture material deprivation and explain ill health, so we exclude this indicator from IHRSD. As for Chinese social particularities, rural dwellers, who have land tenure and are fully involved in activities related to agricultural production and are in a state of being self-employed, make it impossible to count them as unemployed, so we have excluded the unemployment rate as an indicator (Table 1).
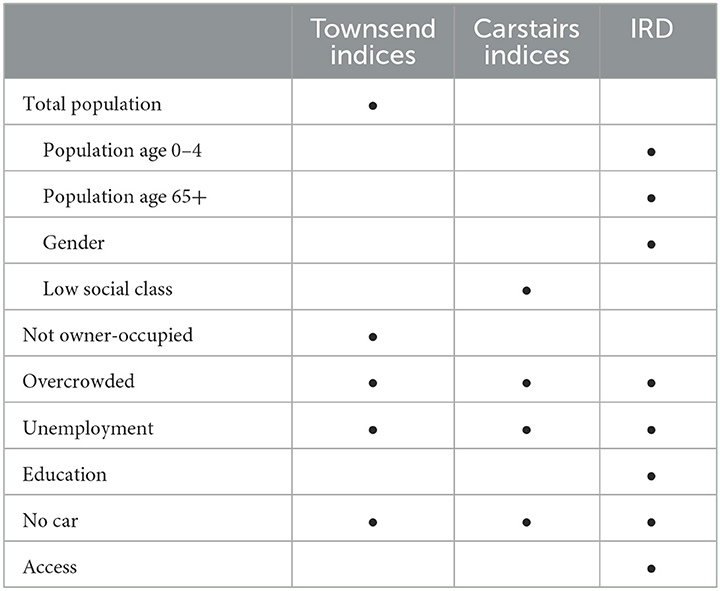
Table 1. Range of variables used in alternative deprivation indices.
The healthcare spatial equity focuses on areas such as emergency medical service capacity, primary care services, and hospital care services. Healthcare spatial equity always uses the general practitioner population as a reference indicator and lacks a comparison of service types across different healthcare quality levels. Iyer et al. (2020) combined the Geo-PSA model based on spatial autocorrelation analysis to reveal four countries' trade-offs between equity in physical access to healthcare and health systems efficiency but simplified this complex issue by excluding the influence of other access factors such as healthcare quality. Healthcare quality evaluation systems often include healthcare service capacity, healthcare service efficiency and healthcare service outcomes (Chao et al., 2020). Relevant studies have constructed various evaluation systems from multiple perspectives such as public service capacity (Jianwei et al., 2018), healthcare professional capacity, DRGs technology (Chao et al., 2020), and macro and micro perspectives (Xingquan, 2018). However, the current evaluation of healthcare quality focuses on an efficiency-oriented comprehensive evaluation of healthcare service quality, which is relatively one-sided (Lingling et al., 2020), as well as how to define and realize value, which are the main directions of healthcare service reform.
The size of the relative spatial deprivation index represents the degree of spatial dispersion of the condition referred to by the indicator rather than whether the total amount of resources is scarce in a pure sense; a smaller relative spatial deprivation index does not mean that resources are not scarce, but rather that the degree of dispersion is lower. Based on Ken's IRD, the IHRSD is constructed by adding the factor of healthcare service quality evaluation, and using healthcare demands and accessibility together as an IHRSD (Table 2).
X1 is the number of young children aged 0–4 years;
X2 is the number of the elderly aged 65 years and above;
X3 is the number of fertile women aged 15–49 years;
X4 is the proportion of unhealthy elderly;
X5 is the proportion of households without private cars;
X6 is the accessibility of medical points;
X7 is the number of medical institutions per 1,000 people;
X8 is the ratio of general hospitals to total regional medical institutions;
X9 community healthcare service centers to total regional medical institutions;
X10 is the ratio of community healthcare service stations to total regional healthcare institutions;
X11 is the ratio of township healthcare centers to total regional healthcare institutions;
X12 is the ratio of village healthcare offices to total regional healthcare institutions;
X13 is the density of road networks.
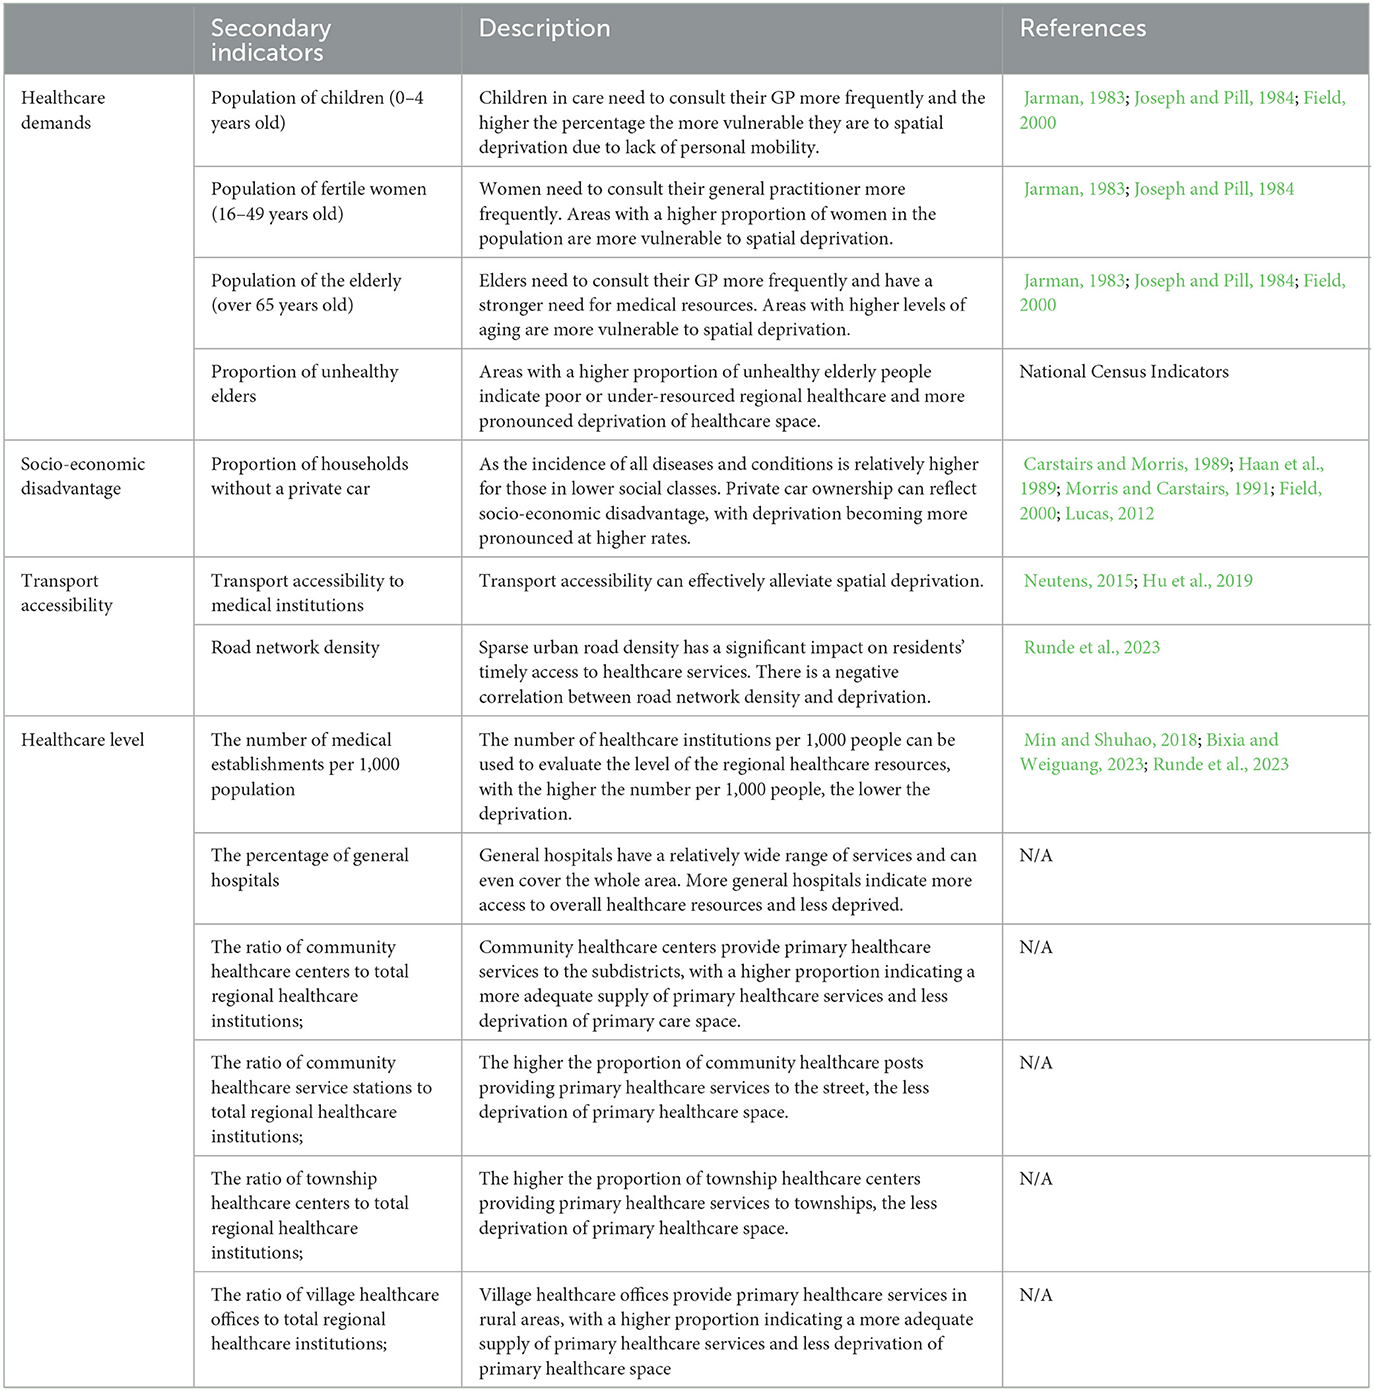
Table 2. The indicators for IHRSD.
2.2.3. Two-step floating catchment area method
Accessibility as a key measure of access to public services and capacity, reflects the ease of access to that resource and the magnitude of people's access to that resource, and thus the level of spatial deprivation. The two-step floating catchment area method (2SFCA) considers the matching ratio between provider and population and the complex spatial interactions between the two. Since 2SFCA's inception (Luo and Wang, 2003), it has been a popular measure of spatial accessibility, particularly in healthcare accessibility (McGrail, 2012). Spatial access emphasizes the importance of spatial separation between supply (i.e., institutions) and demand (i.e., population) and how they are connected in space (Joseph and Bantock, 1982; Joseph and Pill, 1984). 2SFCA yields an accessibility score that is the ratio of supply and demand, each of which interacts with the other in distance decay. 2SFCA measures the convenience of residents at a location reaching and obtaining a service that might be provided by multiple institutions.
The calculation formula is as follows:
Rj is the supply-demand ratio of shelter location j, which represents the service ability of the shelter; dij is the walking distance between shelter location j and population location i; G(dkj, d0) is the Gaussian function, which is a continuous function with the advantages of having the smaller rates of decay in the near and far distance areas and the larger rates of decay in the middle-distance areas (Tao and Cheng, 2016); Ai is the shelter accessibility of population location i, which represents the effective number of shelter seats available for each evacuee; dij is the minimum walking distance between population location i and shelter location l; G(dij) is the aforementioned Gaussian function.
The number of beds in healthcare institutions is used as an indicator of healthcare supply services, and healthcare centers, healthcare service stations and healthcare rooms with no data are assigned a value of 1, healthcare service centers are assigned a value of 10, general hospitals are assigned a value of 20, and tertiary hospitals are assigned an average value of 741. The two-step floating search method is used to measure the accessibility of healthcare services, and a car journey of 15 min, which is regarded as a friendly community in town planning, is chosen as the search radius, i.e., 12,500 m.
2.2.4. Geographical detector model
The geographical detector model (GDM) is a new method for the detection and utilization of spatial heterogeneity (Qian et al., 2021), which consists of four parts, i.e., risk detector, factor detector, ecological detector, and interaction detector. We use it to analyze the effect of these socio-demographic, urban development, and natural factors, i.e., DEM, population density, aging level, road density, river density, social-economic status (average family household private car price level), and urbanization rate on the increase of IHRSD through the rapid urbanization in Ningbo city (Table 3). The basic principle of GDM is described as follows: the study area is first divided into a dependent variable y layer and an influencing factor x layer. The q-value is employed to measure the spatial heterogeneity, which can detect the contribution of factor x to explain the spatial heterogeneity of y. Using a geographic probe, the spatial dissimilarity of the factors is measured (q-values), with q-values falling in the [0,1] interval, with closer to 1 indicating their stronger spatial dissimilarity. We used the field calculator in Arcgis 10.2 to standardize the data, and the risk factor values were reclassified as 1–5 by Natural Breaks. The equation used to calculate the q-value is expressed as follows (Jinfeng and Chengdong, 2017):
where A is the total number of subregions in the study area, and each area can be expressed as follows: α= 1, 2, 3…, A() indicates the variance in each region, and σ2and are the variance in the whole region and the variance in subregion α, respectively; N and Nα represent the total number of spatial units and the number of samples in subregion α, respectively; and W and T are the sum of the variances within a region and the total variance in the whole region, respectively. The value of q(0 < q < 1) can be calculated by the superposition of the y layer and x layer (influencing factors). When the q value is larger, i.e., influencing factor x has a greater explanatory power for dependent variable, the q-value indicates that factor x has an explanatory power of q*100% to y.
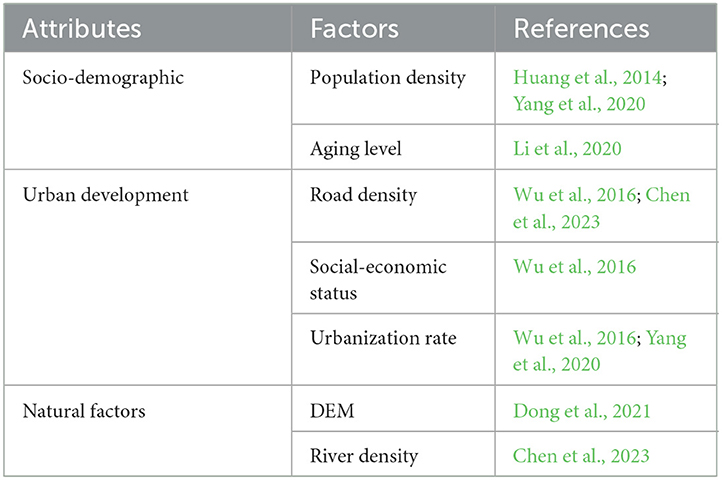
Table 3. The geographical detector indicators for IHRSD.
2.3. Data source
Data derived from the Seventh Population Census and the 2020 Ningbo Health and Family Planning Statistics Compilation. Point-of-healthcare data from the interest of point (POI) of Baidu map. DEM derived from Resource and Environment Science and Data Center, CAS.
3. Result
3.1. The characteristic of HSD
3.1.1. The distribution of HSD
The Thiel index is widely used to evaluate the degree of imbalance and to better understand differences in accessibility between or within regions. The larger the index, the greater the inter-regional differences and the more uneven the development. It is therefore superior to the Gini coefficient, Atkinson coefficient, standard deviation, and coefficient of variation in terms of decomposability. As part of China's primary healthcare system, the number of visits to community healthcare service centers/stations, township healthcare centers, and village clinics can reflect the actual supply of healthcare resources in the region, laterally reflect the demand for basic medical care, and reveal the spatial deprivation pattern of healthcare resources. The Thiel index of Ningbo city T1 is 0.1139; T2 is 0.0269; and T3 is 0.0870. Because T3 is >T2, it is of practical significance to compare the degree of healthcare deprivation in different spaces using subdistrict/town/township as a scale.
The weights of each factor in the IHRSD are calculated as follows:
The IHRSD is mainly concentrated between 0.2 and 0.5, indicating that most regions have a relatively balanced spatial deprivation in healthcare. According to the quality of healthcare institutions, the relative spatial deprivation of primary healthcare is greater than that of general hospitals. In terms of the distribution, the suburban general hospitals' spatial deprivation is more intense, and the primary HSD in the townships/towns is more serious.
Areas with an IHRSD of < 0.2 are located in the center of downtown, such as Jiangxia, Yuehu subdistricts in Haishu District, and some mountainous rural places, such as Luting Township, Dayin and Simingshan Towns in Yuyao County-level City. The downtown is rich in various resources, has convenient transportation, is well-connected and has less deprivation. Although the overall amount of medical resources is less, the rural areas are less deprived due to their sparse population, and there is also less variation within the areas. Areas with IHRSD >0.5 cluster in the mainly peri-urban and developed towns, such as Hongtang subdistrict in Jiangbei District, Zhonghe subdistrict in Yinzhou District, Gulin and Gaoqiao Town in Haishu District, Lanjiang and Yangming subdistrict in Yuyao City and Yuelong subdistrict in Ninghai County. Especially, the IHRSD of Zhonghe Street in Yinzhou District and Xinqi Street in Beilun District is >0.9 (Figure 2).
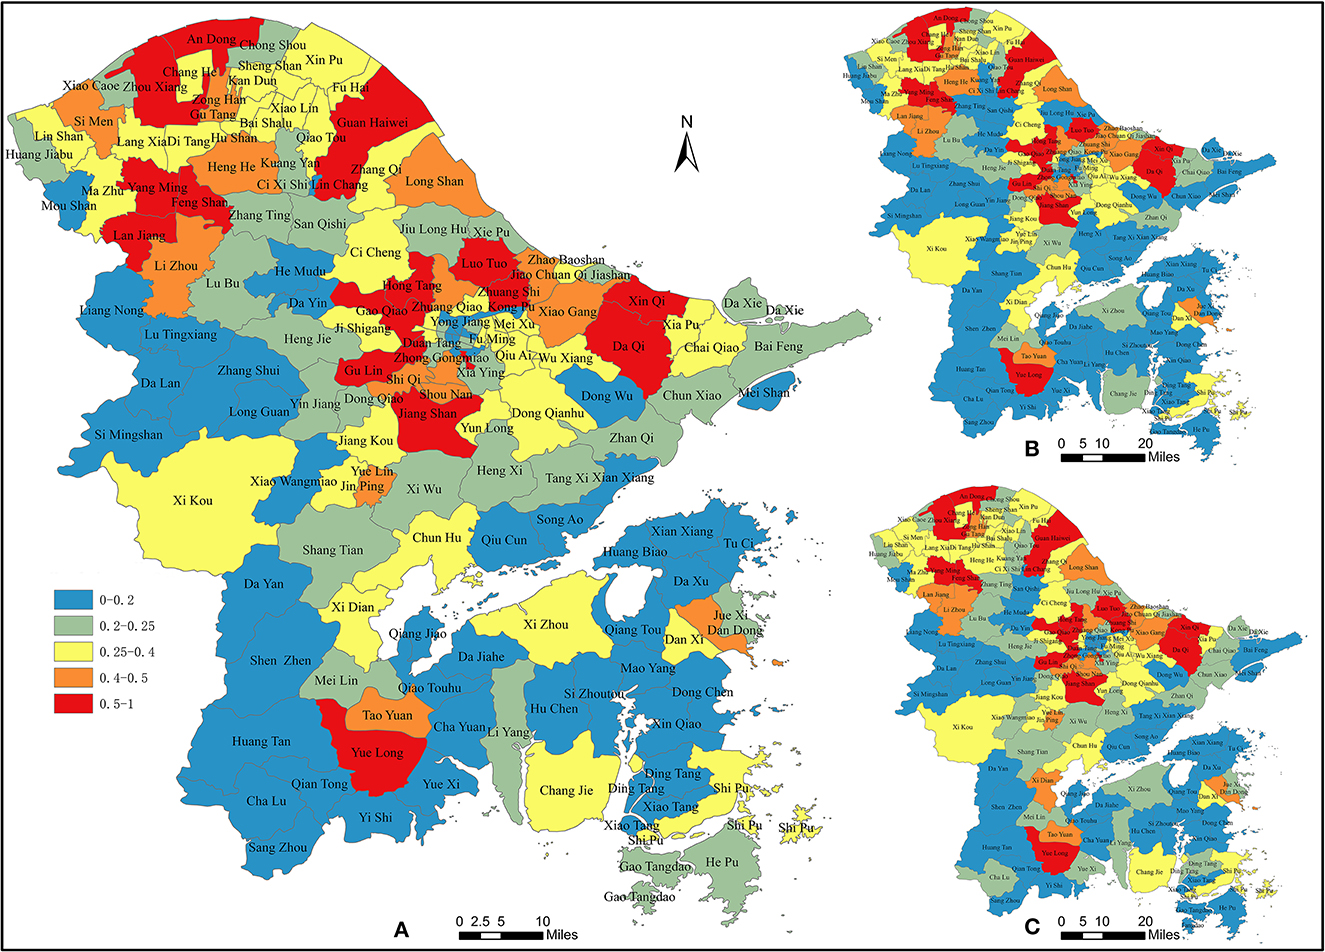
Figure 2. IHRSD. (A) Overall IHRSD; (B) Hospital IHRSD; (C) Primary IHRSD.
IHRSD is mainly found in the peripheral areas of downtown where the population base is large and the demand is extensive, but the distribution of healthcare institutions is sparse. Rapid urbanization causes a mismatch in healthcare resources. The HSD is most severe in the suburbs of districts and counties with higher levels of urbanization and richer medical and healthcare resources, and there is also stronger medical spatial deprivation in the central areas of towns and townships with lower levels of urbanization.
3.1.2. Urbanization and HSD
The overall pattern shows a multi-center concentration of population, located in the central areas of downtown and the urban-rural integration area of the YuCi (Yu Yao county and Ci Xi county) region. The downtown shows population clustering and resource concentration, and the IHRSD remains basically unchanged with the increase in population density and is relatively stable at a low level. Almost all the downtown is an entire urbanization, such as Wangchun, Nanmen subdistrict in Haishu District, and Dongliu, Baizhang subdistrict in Yinzhou District, which are areas of population density >10,000 persons per km2. And in Zhonghe subdistrict, population density is up to 36,736 persons per km2.
The peri-urban and town areas, which are semi-urbanization places, such as the urban-rural integration area of the YuCi region, are expanding rapidly with a large population clustering, but the supply of healthcare resources and other public service institutions is backward, and the healthcare deprivation index shows a positive relationship with population density.
However, the rural areas are overall showing the low IHRSD. The population densities are < 100 persons per km2 in areas such as Si Mingshan, Dalan Town, etc. in the west of Yuyao County-level City, Dayan Township in Fenghua County-level City, which are mainly located in mountainous areas. The central strong towns/townships in these counties are densely populated while the villages in the surrounding townships are sparsely populated, with relatively average overall medical service capacity and a lack of high-grade general hospitals, so the differences between townships are small and the overall degree of deprivation is low, showing a trend that the medical spatial deprivation index increases with increasing population density.
3.1.3. Medical resources per capita and HSD
The distribution of hospitals obviously tends to be in developed areas, concentrated in downtown and developed towns, such as Yuehu subdistrict in Haishu district and Waitan subdistrict in Jiangbei district. These hospitals could provide enough medical resources to the residents in downtown and could decline the HSD in these areas. Community healthcare service centers and township/town healthcare centers are influenced by policy allocation, showing a typical polycentric distribution pattern. Meanwhile, community healthcare service centers/stations also show a polycentric distribution pattern and are mainly concentrated in downtown. Similarly, community healthcare service stations are mainly concentrated in the downtown, Cixi county-level city and Ninghai county, while community healthcare service centers are mainly concentrated in the downtown, Cixi county-level city and Fenghua county-level city. Therefore, with regard to different demands on healthcare service, these places could show different degrees of HSD. The polycentric distribution of township healthcare centers and village healthcare offices is more obvious, scattered in suburban and township areas. Due to the small population, the medical demands of the region are relatively low and result in low deprivation.
In the spatial pattern of the number of medical and healthcare service institutions per 1,000 people, the scarcity of resources per 1,000 people shows a certain negative correlation with the population density of the region, and in Jiangbei, haishu and Yinzhou District, and Cixi County-level city, where the population is highly concentrated, there is an obvious state of healthcare resource tension. The distribution of comprehensive healthcare service institutions is mainly concentrated in downtown, including specifically the Waitan and Wenjiao subdistrict in Jiangbei District; Gulou, Jiangxia, Nanmen, Ximen and Yuehu subdistrict in Haishu District; Baihe, Baizhang, Dongjiao, Dongliu, Minglou, Dongsheng, Zhonghe and Duantang subdistrict in Yinzhou District. The intensity and scope of healthcare services in the agglomeration are much higher than in other areas, which leads to low HSD.
3.1.4. Population distribution and HSD
The spatial distribution of the population of women of childbearing age is mainly concentrated in the downtown, the YuCi region, and the whole area of Zhenhai District. Specifically, the population of women is >40,000 in Jinping, Yuelin, Jiangkou subdistrict and Xikou Town in Fenghua District, Taoyuan and Yuelong subdistrict in Ninghai County, and Dandong, Danxi subdistrict and Shipu Township in Xiangshan County.
The spatial distribution of the population in different age groups has a great impact on the degree of healthcare spatial deprivation with higher weights. Children aged 0–4 years and the elderly population aged over 65 years are concentrated in areas with high population density and are distributed in large numbers in downtown. Regions with more than 5,000 children aged 0–4 years on the subdistrict scale are similar to regions with a spatial deprivation index >0.01, with the highest value in Zhonghe subdistrict. Children are more likely to be deprived because they do not have the capacity to travel on their own and are dependent on their parents and guardians for help.
There are relative differences in the distribution of the elderly aged over 65, with the population in the downtown of the Sanjiangkou belt not being as large as the population of children and women, but the population concentration in the suburban and rural areas is greatly higher than that of the children and women. The proportion of the elderly in unhealthy conditions is significantly higher in Fenghua, Ninghai, and Xiangshan counties, and their spatial distribution differs slightly from that of the elderly (Figure 3).
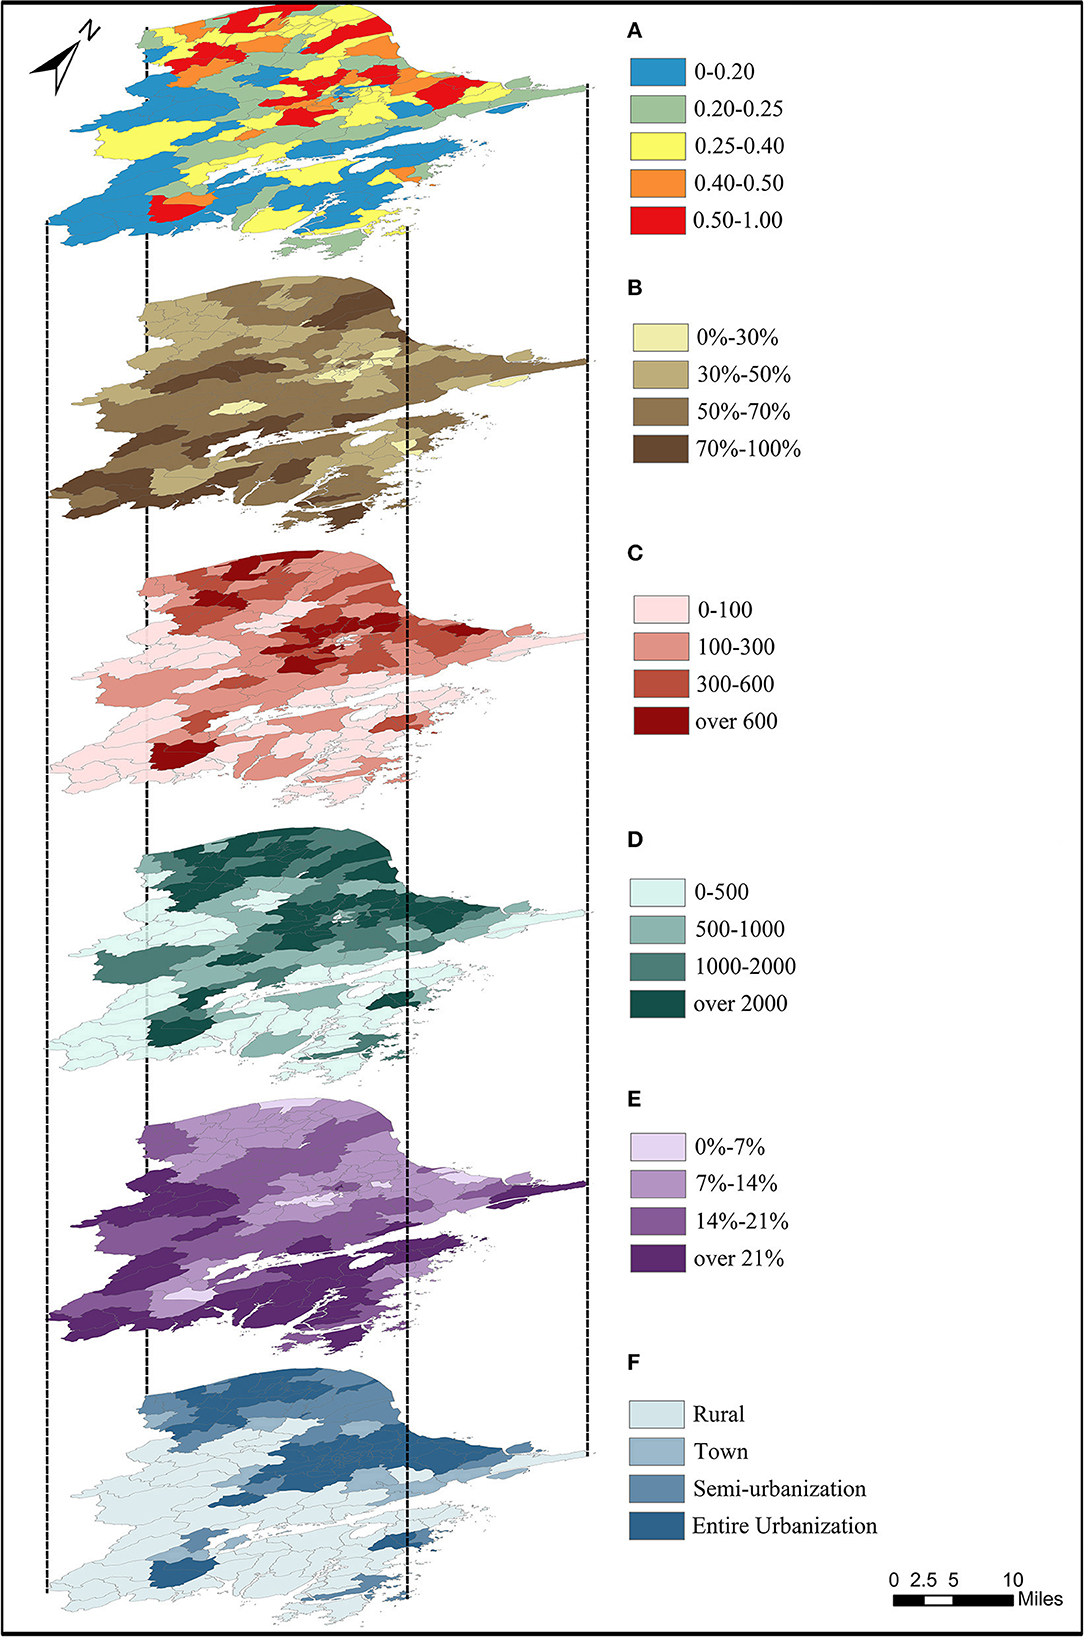
Figure 3. The exploded views of the HSD's characteristics in Ningbo. (A) Overall IHRSD. (B) Proportion of careless family. (C) Population of children aged 0–4 years. (D) Population of women childbreathing age. (E) Level of aging. (F) Level of urbanization.
3.2. Analysis factors of the HSD
The intensity of the risk factor on the IHRSD was measured by factor detection, and the larger the q-value, the greater the intensity of the risk factor on healthcare spatial deprivation. Based on formula (7), the detection results are shown in Table 4. Among the seven risk factors, the q-values of the healthcare spatial deprivation risk factor detection results in Ningbo are, aging level (ELD) (0.3711) > population density (P.D.) (0.3295) > road density (R.D.) (0.3114) > urbanization rate (U.R.) (0.2213) > river density (Ri.D.) (0.1700) > socio-economic status (S.E.) (0.1518) >DEM (0.1423). Socio-demographic attributes have the most significant effect on medical spatial deprivation, especially the level of aging and population clustering, followed by urban development level, while DEM as a natural condition has a more limited effect on medical spatial deprivation in Ningbo. China's healthcare system is an important part of the construction of the public service system, with basic, mandatory, and public welfare characteristics, so the influence of socio-economic status plays a less obvious role in the access of basic healthcare services.

Table 4. The factor detector result of HSD.
3.2.1. Ecological detector result of HSD
The GDM detects whether there is a significant difference in risk factors affecting medical spatial deprivation results in Ningbo through ecological detection. The test of sig. 0.05 indicates that there is a difference between the two factors influencing healthcare spatial deprivation; otherwise, it indicates that there is no significant difference. For the results of their ecological factor detection (Table 5), there is no significant difference between socio-demographic attributes, urban development attributes, and natural attributes in influencing HSD, indicating that the three types of factors play their own roles in influencing HSD, and that the influence of each type of factor on HSD is similar. There are significant differences between population density and aging degree, and the effects of socioeconomic level, water density, and DEM, and there is also a significant difference in the effect of deprivation between road density and DEM.
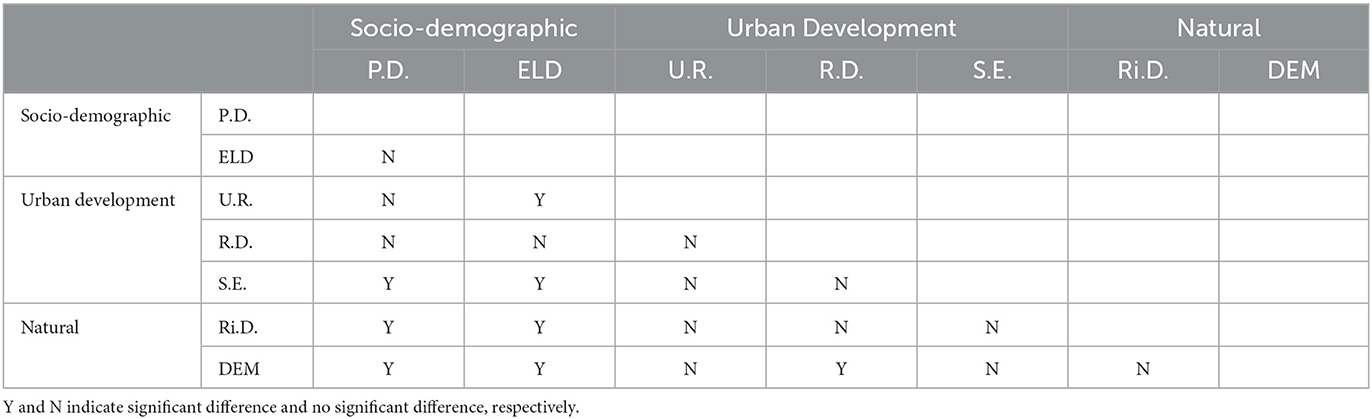
Table 5. The ecological detector result of HSD.
The impact of DEM on the spatial deprivation index of healthcare in Ningbo is small. The downtown, where economic development is faster and urbanization is higher, as well as the YuCi region, are located in areas with gentle topography. In the lower, flatter areas, economic development is faster, urbanization is more complete, and public healthcare service infrastructure is more comprehensive, but the population is also relatively dense. On the contrary, in the higher terrain of southwest Ningbo, the urban center is densely populated, while the surrounding towns and villages are sparsely populated; the overall level of medical services is relatively average, and there is a lack of high-grade general hospitals, but the differences between towns and villages are smaller and the deprivation level is lower, so the overall spatial deprivation index distribution pattern from the urban center to the suburbs is from high to low.
3.2.2. Interaction detector result of HSD
To detect whether there is an interaction between different risk factors in influencing medical spatial deprivation in Ningbo city, using the interaction detection method, the GDM results are shown in Table 6. The results show that there is a non-linear enhancement relationship(#) between population density and socio-economic status, and between socio-economic status and water network density, and a two-factor enhancement(*) between the rest of the factors. The interaction detection results show that the interaction of any two risk factors is greater than the single-factor effect. Therefore, the current problem of healthcare spatial deprivation in Ningbo is the result of the joint influence of different risk factors in interaction. Among them, the interaction of population density and aging level has the highest risk factor detection q-value of 0.5102 for medical spatial deprivation, and other interaction factors with greater influence are: population density and socioeconomic status (0.5017), population density and water network density (0.4824), aging level and road network density (0.4726).
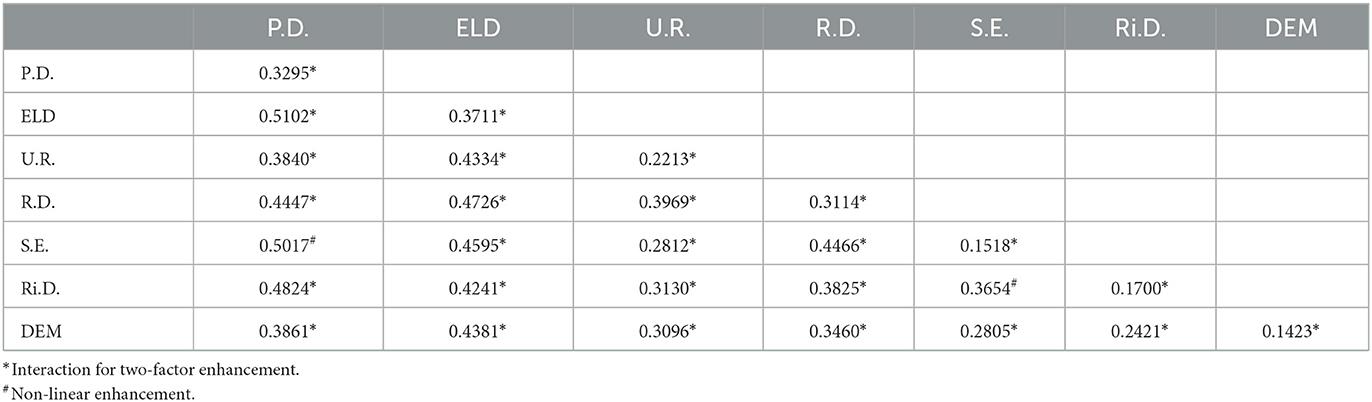
Table 6. The interaction detector result of HSD.
3.2.3. The accessibility and HSD
Road network density also varies considerably between districts and counties, with q-values ranging from 0.1 to 0.9, with some correlation to the spatial deprivation index in Zhenhai District, Xiangshan County and Yuyao County-level City. The distribution of the traffic road network in Ningbo is influenced by the topography and population distribution, and is concentrated in the central areas of downtown, and the urban-rural integration area of the YuCi region. Areas with high road network density have more convenient transportation, and the length and convenience of access to healthcare institutions are higher, which can alleviate to some extent the spatial deprivation caused by the uneven spatial distribution of healthcare services. Therefore, the healthcare spatial deprivation index will be appropriately reduced along the transport roads.
Based on formulas (4–6), the accessibility of healthcare institutions in Ningbo is derived from 2SFCA (Figure 4). The downtown of Ningbo has the best accessibility to healthcare institutions, followed by those located in the integrated urban-rural areas of the YuCi region, Jiulong Lake and Xipu Town and Jiaochuan subdistrict in Zhenhai District, Qi Jiashan and Xiaogang subdistrict in Beilun District, Jiangkou, Jinping and Yuelin subdistrict in Fenghua County-level City and the northern part of Xiangshan County. In the downtown, where accessibility is strong and transportation is available, distributed healthcare service institutions and multi-level medical service institutions provide a better environment for healthcare services, thus alleviating the deprivation problem of dense population distribution and a lack of resources per capita, effectively reducing the degree of medical spatial deprivation in the central urban areas, showing the characteristics of “strong accessibility-weak deprivation.” The accessibility of healthcare resources in the more populated peri-urban and strong towns/townships is relatively general. The level of spatial deprivation of healthcare is higher, especially for households and populations without private cars, and for populations in areas with less access to public transport, with an overall “medium accessibility—strong deprivation.” The overall picture is one of “medium accessibility—strong accessibility deprivation.” The southwestern part of Yuyao City, the southern part of Cixi City, the suburbs of Fenghua City and the southern part of Ninghai County present accessibility of medical and healthcare service institutions < 0.0026 and are in spatial deprivation of medical accessibility. In the areas of townships and villages that are deprived of the accessibility of medical institutions, the number of medical and healthcare institutions is small, the distance is long and the road traffic is inconvenient, but their population is also relatively small, and the differences between regions are small, so the overall degree of spatial deprivation is small, showing the characteristics of “weak accessibility-weak deprivation.”
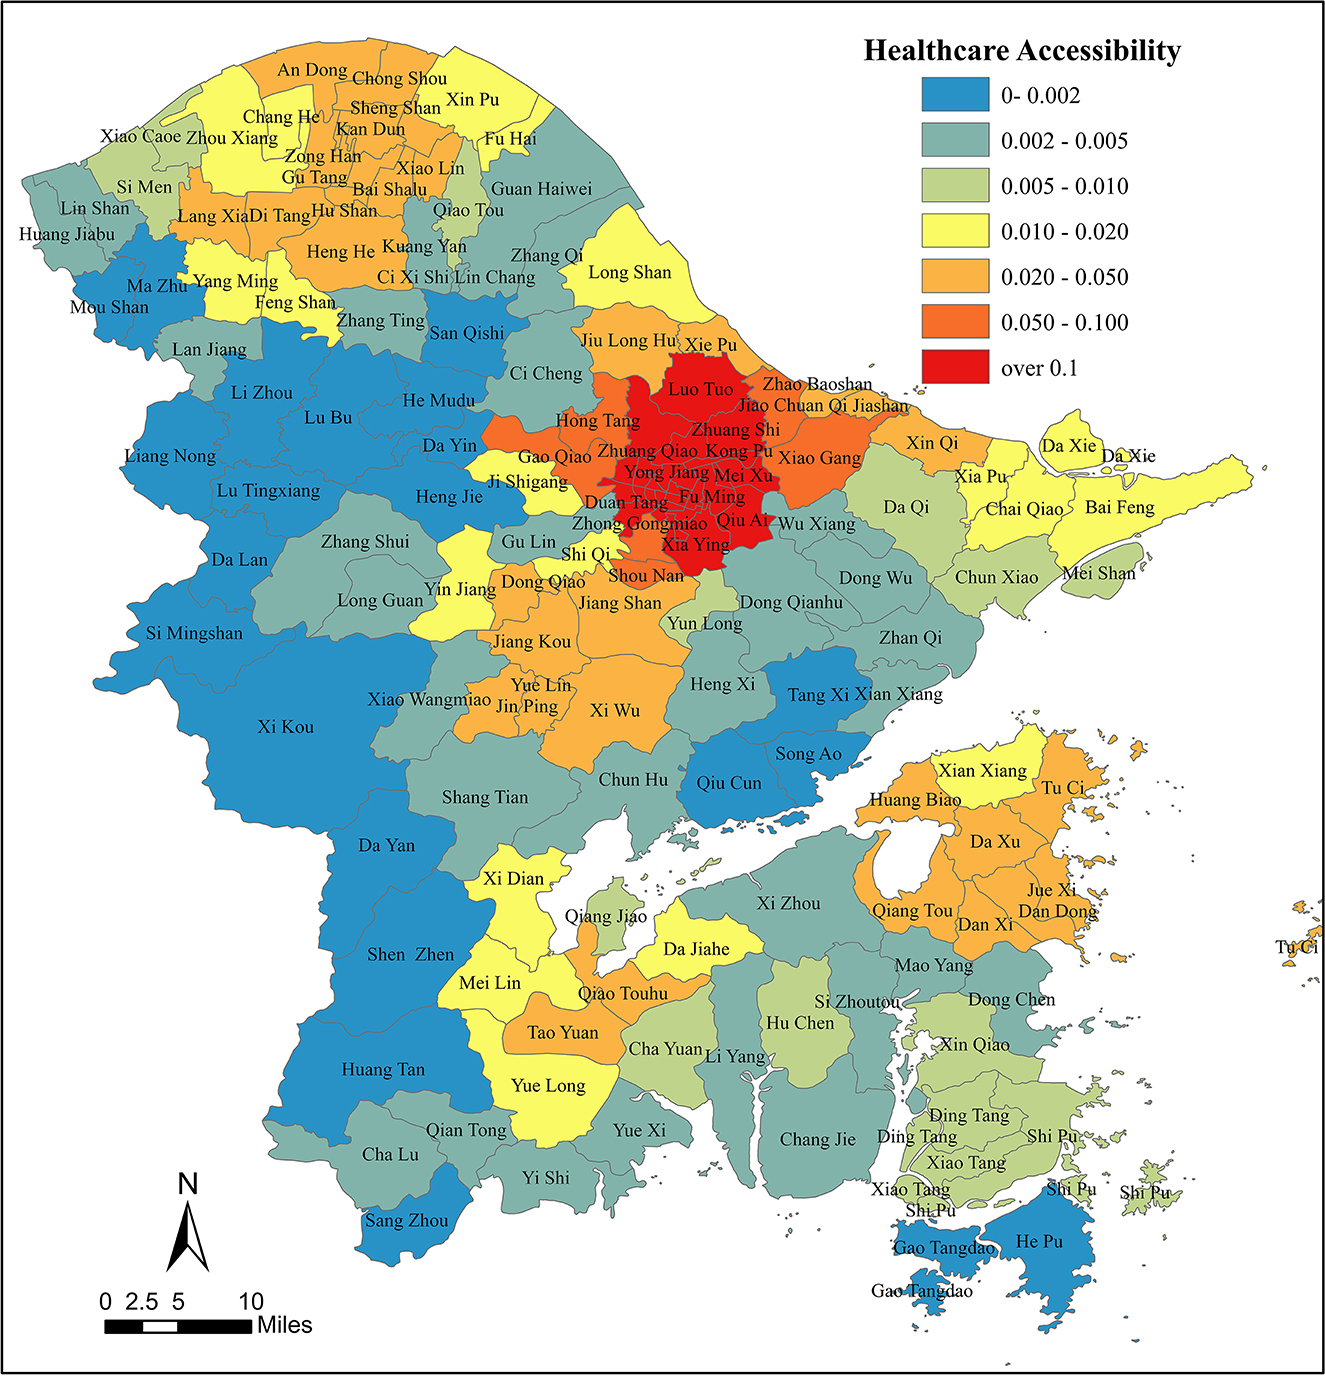
Figure 4. The accessibility of healthcare institutions in Ningbo.
4. Discussion
4.1. Rapid urbanization leads to healthcare space differentiation
In the process of rapid urbanization, the pattern of healthcare resources is obviously concentrated in urbanized areas, while rural areas lack them. And increased HSD arises from rapid changes in population and show up a peri-urban cluster. The rate of change in the allocation of healthcare resources located in peri-urban and developed towns cannot meet the population demand, which expands rapidly, and the development of public institutions is relatively lagging behind, leading to a more serious HSD phenomenon, consistent with the conclusion of Chunqin and Xuning (2014). Therefore, the construction of medical institutions has a lagging nature, especially in economically strong towns; it is more difficult to get the radiation influence from more urbanized and better medical areas, and healthcare spatial differences encounter bottlenecks.
The IHRSD distinguishes areas with the dual problem of high healthcare demand and low accessibility (i.e., high relative deprivation) from areas with low demand and good accessibility (i.e., low relative deprivation), which is in line with Field's (2000) IRD model. On the one hand, for the fair distribution of healthcare resources, a reasonable distribution based on area is required for the supply of public services based on population distribution. On the other hand, for the efficiency of resource utilization, the reasonable and effective use of limited healthcare resources requires a certain bias based on the distribution of the population. The downtown is densely populated and has a concentration of medical resources, which is consistent with the findings of Jin et al. (2019). As an early population center, the downtown has a better healthcare distribution and a tendency to absorb more resources. However, under rapid urbanization, the migration of population from the downtown and the immigration of population from the townships, has led to new population clusters in the peri-urban and developed towns, and this change has not been accommodated in the current layout of healthcare institutions, thus creating a strong HSD problem, as shown in Jin et al.'s (2019) study in Shenzhen.
Therefore, from the perspective of spatial heterogeneity, the urban center and urban fringe areas were associated with high levels of deprivation, and there is a significant negative linear correlation between the urbanization process and various disadvantages, which is partially consistent with the findings of Wan and Su (2017). There is a negative correlation between population density distribution and time to access healthcare resources in Ningbo, in line with the findings of Iyer et al. (2020). There are differences in healthcare equity and efficiency considerations between the peri-urban and rural areas, with a greater disadvantage, which is similar to the findings of Hu et al. (2019) and Field (2000). But due to the lower level of all conditions in these towns or rural areas, the IHRSD was relatively small, which is different from the findings of Field (2000). The relative spatial deprivation of medical care in Ningbo city shows a suburban deprivation pattern and an inverted U-shaped relationship between urbanization and deprivation, which is different from the conclusion of Wan and Su (2017).
The continuous population loss in remote areas has somewhat alleviated the problem of healthcare resource constraints and HSD in rural areas. The smaller IHRSD in rural areas reflects its lower spatial heterogeneity and the effectiveness of relevant compensation policies already in place. Setting up enough township hospitals and village healthcare clinics can effectively reduce medical spatial deprivation in rural areas, which is broadly consistent with the findings of Zheng et al. (2019). The IHRSD is smaller in both fully urbanized areas like downtown areas and rural areas, the overall HSD shows a peri-urban deprivation pattern rather than a single linear relationship, generating significant contradictory conflicts and deprivation in densely populated peri-urban areas relatively far from urban centers, differing from and progressing on previous studies. Township hospitals and village clinics can provide basic outpatient services to local villagers, admit non-emergency patients, play a bottom-level role in the hierarchical system, relieve pressure on hospitals, and improve the overall performance of the national healthcare system.
4.2. The vulnerable groups and HSD
The distribution of healthcare services tend to prioritize efficiency, concentrated in more urbanized areas, and for populations such as the elderly, young, and women of childbearing age, cities can provide more convenient services and living conditions (Qiu et al., 2022). Although the consideration of the distribution of healthcare resources increases equitable access to services (Iyer et al., 2020), it also objectively causes inequalities in healthcare by forcing some vulnerable groups to receive deprivation of healthcare space, in line with the findings of Huang et al. (2020), Székely and Novotný (2022), and Qiu et al. (2022). Ensuring accessibility, especially for the most vulnerable groups in the community, is an important component of achieving healthcare equity.
According to Field's (2000) study on primary health space deprivation, children aged 0–4 years and the elderly aged over 65 years are important groups vulnerable to HSD. This finding is also confirmed by adding the healthcare quality indicator, and compared with the group of women aged 15–64, fertile women 's vulnerability in the IHRSD is more pronounced. Fertile women always have a high demand for healthcare and medical resources, are influenced by general society's perceptions and habits, and tend to go to hospitals. Because there are fewer hospitals and cluster in the downtown, the healthcare spatial deprivation of women is high.
Children aged 0–4 years have the highest IHRSD coefficients, indicating that they have the most severe HSD. Children have a higher demand for hospital services such as intravenous injection, which require professional pediatricians, nurses, and professional equipment, so their choice of hospitals is relatively limited and the HSD is more significant. And most parents choose to take their children to general hospitals or even multiple hospitals, because of the subjective idea that “multiple hospitals are better.” Therefore, there is a need for targeted further support for children's hospitals and the construction of pediatric clinics.
Our study points out that the degree of aging in society is a key factor in HSD. The distribution criteria of existing medical and healthcare institutions are based on population, but the uneven population density leads to an uneven geographical distribution of the corresponding healthcare institutions, with a clear pattern of concentration toward densely populated areas. The relatively small proportion of unhealthy elderly in regions with a very large elderly population reflects that the current spatial location of healthcare institutions and resources in Ningbo is indeed skewed toward the elderly population, effectively increasing the healthcare service capability of regions with a large elderly population. However, the sparsely populated rural areas are severely aging, and have a high percentage of unhealthy elderly population, while the elderly have more demanding travel patterns, travel ranges, and more urgent medical needs. The resulting elderly population in these areas has difficulty accessing healthcare services at the same pace and quality as in urban areas, leading to HSD. Therefore, the distribution of healthcare resources in the city raises the need for distribution not only based on population size, but also regarding specific groups of people and specific areas. Thus, the advent of an aging society has led to an increase in demand for healthcare care, and the pursuit of quality healthcare has been heightened by a society with fewer children.
4.3. Accessibility and HSD
With the rapid combination of location allocation models and spatial analysis methods, the focus of related research has shifted from a greater focus on theoretical models for siting medical service institutions to the simultaneous development of theoretical and practical applications for spatial siting and layout optimization of healthcare institutions (Shao et al., 2022). Socioeconomic disadvantage is seen as an important health risk factor. Transportation availability and accessibility are important determinants of access to healthcare services. Healthcare accessibility is closely related to population density and socioeconomic level, with better medical accessibility in areas with higher population density and poor accessibility associated with low urbanization and dispersed population structure, corroborating the findings of Kotavaara et al. (2021).
Private cars increase people's ease of going out, which is reflected in their healthcare-seeking behavior. Under rapid urbanization, the overall socioeconomic status of the population is rapidly rising, and private car ownership is increasing. Private cars are faster than public transportation and have greater freedom, thus allowing for more access to and choice of healthcare services. And it promotes spatial and temporal compression in the development of the traffic system, making this advantaged segment of the population less likely to be deprived of space. However, for some groups, the extent to which the construction of a public transportation system improves access to healthcare may be limited by their inability to take advantage of this convenience, particularly for families without a private car in rural areas, and for the elderly over 65 and children aged 0–4 who cannot access healthcare services independently. There are significant regional differences in accessibility, especially in rural areas, which corroborate the findings of Kotavaara et al. (2021) and Field (2000). It is further concluded that the risks associated with transportation disadvantages contribute to the intensification of HSD for these populations (Benevenuto and Caulfield, 2020). Thus, the continued pressure to reduce the number of service institutions may further hinder these vulnerable groups to access to healthcare services and resources. In terms of public facility construction, improving the coverage of the 1 h-access circle by public transportation and strengthening the ability of public transportation to connect and access residential areas to healthcare institutions is one of the important ways to achieve the decentralization of healthcare resources and the equalization of healthcare services. Digital healthcare services (Jormanainen et al., 2019) may provide an appropriate solution to compensate for the lack of long-distance and public transport accessibility.
The inverted U-shaped relationship between healthcare accessibility deprivation and relative healthcare spatial deprivation is different from previous studies. In remote areas, there is a “low accessibility-low spatial deprivation” pattern, accessibility factors no longer contribute to spatial improvement in the region, but require further support and sinking of healthcare resources, institutions, and medical personnel. And mountainous areas, as regions with concentrated poverty and weak accessibility, do not show obvious relative deprivation of medical space, indicating that the construction of village access and urbanization have jointly promoted the level and capacity of reception services in mountainous areas. Under the condition of equalization of public services, people have equal access to services, and to a certain extent, it hinders the further widening of the gap between the rich and the poor. To achieve outcome equity, we need to focus on supporting disadvantaged areas and vulnerable groups.
4.4. Healthcare policy and HSD
In policy creation and execution, rationalizing the balance between quantity and quality of healthcare is a huge challenge. To encourage optimal resource utilization, the policy always allows the placement of healthcare resources in areas of high population density, so that more individuals have access to services in the same space, boosting the opportunity cost of access. Therefore, the Chinese hospital institution is a financially supported public organization, the setting of the hospital tends to be based on the amount and density of the population, with a tendency toward population agglomeration, largely based on the functional zoning of the urban space, concentrated in the downtown and its surrounding areas, and the distribution of the districts and counties is relatively consistent. Finance, high-quality medical resources, and medical skill are concentrated in hospitals as a result of the combined effect of numerous causes, resulting in uneven spatial distribution and spatial deprivation in terms of healthcare quality. The downtown's “siphoning” impact has increased the situation of “overcrowding in hospitals while clinics go unattended.” In the downtown, the problem of spatial deprivation has been alleviated, because the locations of medical resources have already taken into account the problem of population congestion and the general hospitals have a larger scope of service. However, in suburban areas, the population is rapidly overcrowded due to rapid urbanization, while the layout of medical resources cannot be adjusted in time, so the problem of spatial deprivation is seriously. Although there are few hospitals in the rural area, due to the relatively small population, the IHRSD is small, and the distribution of medical resources is relatively uniform, in line with the findings of Jin et al. (2019) on the accessibility of hierarchical hospitals in Shenzhen, China.
The IHRSDs of primary, hospital and overall show that different levels of healthcare institutions are set up with different considerations of equity and efficiency trade-offs, corroborating the findings of Stirbu et al. (2011), Terraneo (2015), and Hoebel et al. (2016). Primary healthcare system development reduces the HSD by enhancing efficiency, and primary healthcare institutions are set up by districts and communities to effectively serve the construction of medical spatial equalization. The primary healthcare service system is a “gatekeeper” (Qingyuan and Lili, 2022). It plays an important role in achieving spatial equity in healthcare and is also an important cornerstone of the hierarchical diagnosis and treatment system. In the era of the Internet, the network can help solve the problem of distance by further breaking through the barrier of geographical distance, accelerating spatio-temporal compression and alleviating part of the spatial deprivation problem due to “remote diagnosis and treatment,” etc.
Nowadays, the Chinese government develops a new healthcare service system, so-called “medical complexes,” which integrate general hospitals, community healthcare service centers, healthcare centers, community healthcare service stations, and village clinics into one. The medical complex utilizes the reputation and public trust of the general hospitals, integrates the services provided by all grades of healthcare institutions through technological and institutional improvements, and establishes “remote diagnosis and treatment” in the digital age, thereby expanding the scope of services provided by each general hospital, enhancing people's trust in and satisfaction with the services provided by primary healthcare institutions and reducing deprivation. Therefore, in order to build healthy cities and achieve healthcare equity, there is a need to enhance the role of primary healthcare in urban environments, strengthen urban primary healthcare, focus on healthcare equity, and target vulnerable groups for health promotion.
5. Conclusion
Using the framework of spatial deprivation, we make a comprehensive assessment of the HSD in the “flow space” of the population under rapid urbanization and improve the HSD research system. The IHRSD model chooses different healthcare supply indicators and populace request pointers, considers the healthcare institutions' quantity and quality, population size and socio-economic status, and spotlight on the elderly, young, and fertile-women gatherings to further develop the IHRSD system. The accessibility index provides a representation of spatial deprivation under the “flow space” and fills the gap in static research on medical spatial deprivation. The index differentiates the level of medical quality, considering the distribution of primary healthcare resources and the distribution of general hospitals, and fills the gap in the study of medical spatial deprivation, which is of reference value for the formulation of policies related to the optimization of medical and healthcare resource allocation. We utilize GDM for ecological and interaction detection of IHRSD, to derive the potential influencing factors of HSD in Ningbo. Subsequently, we reveal the measure of equity and efficiency of healthcare resources with Chinese characteristics. Furthermore, the outcomes will provide strong support for the update of the spatial distribution of healthcare services, the realization of quality healthcare resources sinking into regional balance, and the enhancement of urban resilience.
The IHRSD shows a pattern of peri-urban deprivation, and the less developed rural areas effectively improve the level of medical equity through a certain amount of excess healthcare resources and the reduction of population, alleviating the problem of HSD. A certain amount of excess healthcare resources and continuously promoting urbanization are effective ways to improve the dual structure of urban and rural areas and alleviate the gap in the uneven distribution of medical resources between urban and rural areas. The age and gender structure of the population are reflected in the healthcare space as different healthcare demands, and the attribution analysis through geographic detectors concludes that the spatial layout of the population has a greater impact on the level of healthcare spatial deprivation. By combining the accessibility method with the Thiel index and the IHRSD, healthcare supply and demand sides can be unified, and the realistic spatial layout of medical care, population layout and deprivation of medical care can be better reflected through a multivariate index system. The improvement of transport accessibility can effectively alleviate the phenomenon of HSD. Overall, HSD has multiple deprivation attributes, and requires multiple sectors participation, taking into account multiple factors such as demand for healthcare services, geographical distribution conditions, healthcare quality, etc., revitalizing existing healthcare resources, optimizing the spatial allocation of healthcare resources, meeting the individual needs of multiple populations, and planning healthcare institutions in a forward-looking and predictive manner and in an orderly manner. The location of medical institutions can better improve the uneven spatial distribution and spatial deprivation of medical institutions and contribute to the equalization of public services.
The IHRSD has regional limitations, and thus it require for targeted modifications in different regions and contexts. The IHRSD focuses on assessing the overall social situation, but in a people-centered context there is a need to pay more attention to deprivation within populations, for example, internal differences in the elderly population. And the IHRSD identifies urban-rural differences in spatial deprivation of health care in the context of rapid urbanization. Further study will focus on the intra-urban and intra-rural partial heterogeneity, and combined with questionnaires and other social research tools, individual subjective indicators such as medical satisfaction are incorporated into the IHRSD, thus making the indicators more humanized and localized.
Data availability statement
The original contributions presented in the study are included in the article/supplementary material, further inquiries can be directed to the corresponding author.
Author contributions
YQ: Conceptualization, Data curation, Formal analysis, Methodology, Validation, Visualization, Writing—original draft, Writing—review and editing. GQ: Supervision, Writing—review and editing, Conceptualization. TL: Supervision, Writing—review and editing. RM: Writing—review and editing.
Funding
This work was supported by Program of Ningbo University Donghai Academy [Grant Number DHST2023ZD01].
Conflict of interest
The authors declare that the research was conducted in the absence of any commercial or financial relationships that could be construed as a potential conflict of interest.
Publisher's note
All claims expressed in this article are solely those of the authors and do not necessarily represent those of their affiliated organizations, or those of the publisher, the editors and the reviewers. Any product that may be evaluated in this article, or claim that may be made by its manufacturer, is not guaranteed or endorsed by the publisher.
References
Allik, M., Brown, D., Dundas, R., and Leyland, A. H. (2016). Developing a new small-area measure of deprivation using 2001 and 2011 census data from Scotland. Health Place 39, 122–130. doi: 10.1016/j.healthplace.2016.03.006
Baraklianos, I., Bouzouina, L., Bonnel, P., and Aissaoui, H. (2020). Does the accessibility measure influence the results of residential location choice modelling? Transportation 47, 1147–1176. doi: 10.1007/s11116-018-9964-6
Benevenuto, R., and Caulfield, B. (2020). Measuring access to urban centres in rural Northeast Brazil: a spatial accessibility poverty index. J. Transport Geogr. 82, 102553. doi: 10.1016/j.jtrangeo.2019.102553
Bertin, M., Chevrier, C., Pelé, F., Serrano-Chavez, T., Cordier, S., and Viel, J-F. (2014). Can a deprivation index be used legitimately over both urban and rural areas? Int. J. Health Geograph. 13, 1–9. doi: 10.1186/1476-072X-13-22
Bixia, X., and Weiguang, Y. (2023). Changes in patient visits and associated determinants in primary healthcare settings in guangdong: a grey relational analysis. Chin. General Practice 26, 1965–1971.
Braveman, P. A., Cubbin, C., Egerter, S., Chideya, S., Marchi, K. S., Metzler, M., et al. (2005). Socioeconomic status in health research: one size does not fit all. Am. Med. Assoc. 294, 2879–2888. doi: 10.1001/jama.294.22.2879
Cabrera-Barona, P., Blaschke, T., and Kienberger, S. (2017). Explaining accessibility and satisfaction related to healthcare: a mixed-methods approach. Soc. Indicat. Res. 133, 719–739. doi: 10.1007/s11205-016-1371-9
Cabrera-Barona, P., Murphy, T., Kienberger, S., and Blaschke, T. (2015). A multi-criteria spatial deprivation index to support health inequality analyses. Int. J. Health Geograph. 14, 1–14. doi: 10.1186/s12942-015-0004-x
Carstairs, V. (1995). Deprivation indices: their interpretation and use in relation to health. J. Epidemiol. Commun. Health 49(Suppl.2), 3–8. doi: 10.1136/jech.49.Suppl_2.S3
Carstairs, V., and Morris, R. (1989). Deprivation and mortality: an alternative to social class? J. Public Health 11, 210–219. doi: 10.1093/oxfordjournals.pubmed.a042469
Chao, L., Xia, L., and Zhuohui, L. (2020). A study on the quality evaluation of medical services in urban public hospital based on DRGs. J. Macro-Qual. Res. 8, 42–54. doi: 10.13948/j.cnki.hgzlyj.2020.02.005
Chen, Z., Song, D., Du, Y., and Dong, L. (2023). Investigation on the spatial distribution of landslides in Sichuan Province, southwest China. Geomat. Natural Hazards Risk 14, 2232085. doi: 10.1080/19475705.2023.2232085
Chunqin, C., and Xuning, Q. (2014). The construction of techonology system for rural space layout optimization under the background of rapid urbanization. Chin. Agri. Sci. Bullet. 11, 62–66.
Deguen, S., and Zmirou-Navier, D. (2010). Social inequalities resulting from health risks related to ambient air qualityea European review. Eur. J. Public Health 20, 27–35. doi: 10.1093/eurpub/ckp220
Dewulf, B., Neutens, T., De Weerdt, Y., and Van de Weghe, N. (2013). Accessibility to primary health care in Belgium: an evaluation of policies awarding financial assistance in shortage areas. BMC Fam. Pract. 14, 122. doi: 10.1186/1471-2296-14-122
Dong, S., Pan, Y., Guo, H., Gao, B., and Li, M. (2021). Identifying influencing factors of agricultural soil heavy metals using a Geographical Detector: a case study in Shunyi district, China. Land 10, 1010. doi: 10.3390/land10101010
Farmer, J. C., Baird, A. G., and Iversen, L. (2001). Rural deprivation: reflecting reality. Br. J. Gen. Pract. 51, 486–491.
Field, K. (2000). Measuring the need for primary health care: an index of relative disadvantage. Appl. Geogr. 20, 305–332. doi: 10.1016/S0143-6228(00)00015-1
Gray, S. C., Edwards, S. E., and Miranda, M. L. (2013). Race, socioeconomic status, and air pollution exposure in North Carolina. Environ. Res. 126, 152–158 doi: 10.1016/j.envres.2013.06.005
Haan, M. N., Kaplan, G. A., and Syme, S. L. (1989). Socioeconomic Status and Health: Old Observations and New Thoughts. San Francisco, CA: Hentry J Kaiser Family Foundation.
Han, Y., and Chung, R. Y. N. (2022). The role of neighborhood social capital on health and health inequality in rural and urban China. Prev. Med. 156, 106989. doi: 10.1016/j.ypmed.2022.106989
Hanlon, P., Lawder, R. S., Buchanan, D., Redpath, A., Walsh, D., Wood, R., et al. (2005). Why is mortality higher in Scotland than in England and Wales? Decreasing influence of socioeconomic deprivation between 1981 and 2001 supports the existence of a ‘Scottish Effect'. J. Public Health 27, 199–204. doi: 10.1093/pubmed/fdi002
Hawthorne, T. L., and Kwan, M. P. (2012). Using GIS and perceived distance to understand the unequal geographies of healthcare in lower-income urban neighbourhoods. Geogr. J. 178, 18–30. doi: 10.1111/j.1475-4959.2011.00411.x
Hoebel, J., Rattay, P., Prütz, F., Rommel, A., and Lampert, T. (2016). Socioeconomic status and use of outpatient medical care: the case of Germany. PLoS ONE 11, e0155982. doi: 10.1371/journal.pone.0155982
Hu, P., Liu, Z., and Lan, J. (2019). Equity and efficiency in spatial distribution of basic public health facilities: a case study from Nanjing metropolitan area. Urban Policy Res. 37, 243–266. doi: 10.1080/08111146.2018.1523055
Huang, J., Wang, J., Bo, Y., Xu, C., Hu, M., and Huang, D. (2014). Identification of health risks of hand, foot and mouth disease in China using the geographical detector technique. Int. J. Environ. Res. Public Health 11, 3407–3423. doi: 10.3390/ijerph110303407
Huang, M., Luo, D., Wang, Z., Cao, Y., Wang, H., Bi, F., et al. (2020). Equity and efficiency of maternal and child health resources allocation in Hunan Province, China. BMC Health Serv. Res. 20, 1–10. doi: 10.1186/s12913-020-05185-7
Iyer, H. S., Flanigan, J., Wolf, N. G., Schroeder, L. F., Horton, S., Castro, M. C., et al. (2020). Geospatial evaluation of trade-offs between equity in physical access to healthcare and health systems efficiency. Br. Med. J. Glob. Health 5, e003493. doi: 10.1136/bmjgh-2020-003493
Jarman, B. (1983). Identification of underprivileged areas. Br. Med. J. 286, 1705–1709. doi: 10.1136/bmj.286.6379.1705
Jarman, B. (1984). Underprivileged areas: validation and distribution of scores. Br. Med. J. 289, 1587–1592 doi: 10.1136/bmj.289.6458.1587
Jianwei, D., Tielun, G., Yaxin, L., and Tianan, Y. (2018). Evaluation of public service quality in maga cites: a case of Beijing. East China Econ. Manag. 32, 49–57. doi: 10.19629/j.cnki.34-1014/f.171001001
Jin, M., Liu, L., Tong, D., Gong, Y., and Liu, Y. (2019). Evaluating the spatial accessibility and distribution balance of multi-level medical service facilities. Int. J. Environ. Res. Public Health 16, 1150. doi: 10.3390/ijerph16071150
Jinfeng, W., and Chengdong, X. (2017). Geodetector: principle and prospective. Acta Geograph. Sin. 72, 116–134.
Jormanainen, V., Parhiala, K., Niemi, A., Erhola, M., Keskimaki, I., and Kaila, M. (2019). Half of the Finnish population accessed their own data: comprehensive access to personal health information online is a corner-stone of digital revolution in Finnish health and social care. Finn. J. eHealth eWelfare 11, 298–310. doi: 10.23996/fjhw.83323
Joseph, A. E., and Bantock, P. R. (1982). Measuring potential physical accessibility to general practitioners in rural areas: a method and case study. Soc. Sci. Med. 16, 85–90. doi: 10.1016/0277-9536(82)90428-2
Joseph, A. E., and Pill, R. (1984). Accessibility and utilization: geographical perspectives on health care delivery. J. Royal Coll. General Practition. 34, 452.
Kabisch, N., Van den Bosch, M., and Lafortezza, R. (2017). The health benefits of nature-based solutions to urbanization challenges for children and the elderly—a systematic review. Environ. Res. 159, 362–373. doi: 10.1016/j.envres.2017.08.004
Kotavaara, O., Nivala, A., Lankila, T., Huotari, T., Delmelle, E., and Antikainen, H. (2021). Geographical accessibility to primary health care in Finland–Grid-based multimodal assessment. Appl. Geography 136, 102583. doi: 10.1016/j.apgeog.2021.102583
Kumar, R., Bilga, P. S., and Singh, S. (2017). Multi objective optimization using different methods of assigning weights to energy consumption responses, surface roughness and material removal rate during rough turning operation. J. Clean Prod. 164, 45–57. doi: 10.1016/j.jclepro.2017.06.077
Lanlan, X. (2021). From unfair to fairer: research progress of fairness in the medical treatment of rural residents. Jianghan Academic 40, 83–92. doi: 10.16388/j.cnki.cn42-1843/c.2021.05.008
Li, J., Chen, X., Han, X., and Zhang, G. (2020). Spatiotemporal matching between medical resources and population ageing in China from 2008 to 2017. BMC Public Health 20, 8976. doi: 10.1186/s12889-020-08976-z
Li, X., Song, J., Lin, T., Dixon, J., Zhang, G., and Ye, H. (2016). Urbanization and health in China, thinking at the national, local and individual levels. Environ. Health 15, 113–123. doi: 10.1186/s12940-016-0104-5
Lin, Y., Schootman, M., and Zhan, F. B. (2015). Racial/ethnic, area socioeconomic, and geographic disparities of cervical cancer survival in Texas. Appl. Geography 56, 21–28 doi: 10.1016/j.apgeog.2014.10.004
Lingling, W., Xiong, H., and Wan, S. (2020). KTQ accerditation and evaluation system of medical service quality. J. Xizang Minzu Univ. 41, 133–137.
Loignon, C., Hudon, C., Goulet, É., Boyer, S., De Laat, M., Fournier, N., et al. (2015). Perceived barriers to healthcare for persons living in poverty in Quebec, Canada: the EQUIhealThY project. Int. J. Equity Health 14, 1–11. doi: 10.1186/s12939-015-0135-5
Lopes, H. S., Ribeiro, V., and Remoaldo, P. C. (2019). Spatial accessibility and social inclusion: the impact of Portugal's last health reform. GeoHealth 3, 356–368. doi: 10.1029/2018GH000165
Lucas, K. (2012). Transport and social exclusion: where are we now? Transport Pol. 20, 105–113. doi: 10.1016/j.tranpol.2012.01.013
Luo, W., and Wang, F. (2003). Measures of spatial accessibility to health care in a GIS environment: synthesis and a case study in Chicago region. Environ. Plan. 30, 865–884. doi: 10.1068/b29120
Mao, L., and Nekorchuk, D. (2013). Measuring spatial accessibility to healthcare for populations with multiple transportation modes. Health Place 24, 115–122. doi: 10.1016/j.healthplace.2013.08.008
McGrail, M. R. (2012). Spatial accessibility of primary health care utilising the two step floating catchment area method: an assessment of recent improvements. Int. J. Health Geographics 11, 50. doi: 10.1186/1476-072X-11-50
McLennan, D., Barnes, H., Noble, M., Davies, J., and Dibben, C. (2011). The English Indices of Deprivation 2010. Tech. Rep. Department for Communities and Local Government.
Messer, L. C., Laraia, B. A., Kaufman, J. S., Eyster, J., Holzman, C., Culhane, J., et al. (2006). The development of a standardized neighborhood deprivation index. J. Urban Health 83, 1041–1062. doi: 10.1007/s11524-006-9094-x
Min, W., and Shuhao, L. (2018). Study on the measurement of economic high-quality development level in China in the New Era, J. Quantitative Technol. 35, 3–20. doi: 10.13653/j.cnki.jqte.2018.11.001
Ming, L., Bin, Z., and Yicheng, L. (2018). Analysis on development trend of macro-economy in Qinghai Province. Res. Dev. 6, 129–135. doi: 10.13483/j.cnki.kfyj.2018.06.019
Morris, R., and Carstairs, V. (1991). Which deprivation? A comparison of selected deprivation indexes. J. Public Health 13, 318–326.
Neutens, T. (2015). Accessibility, equity and health care: review and research directions for transport geographers. J. Transport Geography 43, 14–27. doi: 10.1016/j.jtrangeo.2014.12.006
Niggebrugge, A., Haynes, R., Jones, A., Lovett, A., and Harvey, I. (2005). The index of multiple deprivation 2000 access domain: a useful indicator for public health? Soc. Sci. Med. 60, 2743–2753. doi: 10.1016/j.socscimed.2004.11.026
Noble, M., Wright, G., Smith, G., and Dibben, C. (2006). Measuring multiple deprivation at the small-area level. Environ. Plan. A 38, 169–185. doi: 10.1068/a37168
Pampalon, P., Pamel, D., Gamache, P., and Raymond, G. (2009). A deprivation index for health planning in Canada. Chronic Dis. Canada 29, 178–191. doi: 10.24095/hpcdp.29.4.05
Pasetto, R., Sampaolo, L., and Pirastu, R. (2010). Measures of material and social circumstances to adjust for deprivation in small-area studies of environment and health: review and perspectives. Ann. Ist Super Sanita. 46, 185–197. doi: 10.4415/ANN_10_02_13
Prasad, A., Borrell, C., Mehdipanah, R., and Chatterji, S. (2018). Tackling health inequalities using urban HEART in the sustainable development goals era. J. Urban Health 95, 610–612. doi: 10.1007/s11524-017-0165-y
Qian, X., Wang, D., and Nie, R. (2021). Assessing urbanization efficiency and its influencing factors in China based on Super-SBM and geographical detector models. Environ. Sci. Pollut. Res. 28, 31312–31326. doi: 10.1007/s11356-021-12763-7
Qingyuan, Y., and Lili, Y. (2022). The application of urban health equity assessment and response tool (Urban HEART) and its implications to China. Chin. J. Health Policy 15, 54–61.
Qiu, N., Cheng, J., and Zhang, T. (2022). Spatial disparity and Structural inequality in disability patterns across Tianjin municipality: a multiple deprivation perspective. Habitat Int. 130, 102685. doi: 10.1016/j.habitatint.2022.102685
Rao, R., Yadava, V. J. O., and Technology, L. (2009). Multi-objective optimization of Nd: YAG laser cutting of thin superalloy sheet using grey relational analysis with entropy measurement. Optic. Laser Technol. 41, 922–930. doi: 10.1016/j.optlastec.2009.03.008
Runde, F., Xinhua, Z., and Degang, Y. (2023). Spatial equity healthcare resource in Xinjiang. J. Univ. Chin. Acad. Sci. 40, 69–78.
Shannon, C. E. (1948). A mathematical theory of communication. Bell. Syst. Tech. J. 27, 379e423. doi: 10.1002/j.1538-7305.1948.tb01338.x
Shao, H., Jin, C., Xu, J., Zhong, Y., and Xu, B. (2022). Supply-demand matching of medical services at a city level under the background of hierarchical diagnosis and treatment-based on Didi Chuxing Data in Haikou, China. BMC Health Serv. Res. 22, 1–12. doi: 10.1186/s12913-022-07762-4
Stirbu, I., Kunst, A. E., Mielck, A., and Mackenbach, J. P. (2011). Inequalities in utilisation of general practitioner and specialist services in 9 European countries. BMC Health Serv. Res. 11, 1–8. doi: 10.1186/1472-6963-11-288
Székely, V., and Novotný, J. (2022). Public transport-disadvantaged rural areas in relation to daily accessibility of regional centre: case study from Slovakia. J. Rural Stud. 92, 1–16. doi: 10.1016/j.jrurstud.2022.03.015
Tao, Z., and Cheng, Y. (2016). Research progress of the two-step floating catchment area method and extensions. Prog. Geogr. 35, 589–599.
Taylor, A., and Pettit, C. (2020). Are health services in New South Wales available where they are needed? Using AURIN to understand the equity of service distribution and future demand. Appl. Spat. Anal. Pol. 13, 1–25. doi: 10.1007/s12061-018-9282-6
Terraneo, M. (2015). Inequities in health care utilization by people aged 50+: evidence from 12 European countries. Soc. Sci. Med. 126, 154–163. doi: 10.1016/j.socscimed.2014.12.028
Tunstall, H., Mitchell, R., Gibbs, J., Platt, S., and Dorling, D. (2012). Socio-demographic diversity and unexplained variation in death rates among the most deprived parliamentary constituencies in Britain. J. Public Health 34, 296–304. doi: 10.1093/pubmed/fdr078
Wan, C., and Su, S. (2017). China's social deprivation: measurement, spatiotemporal pattern and urban applications. Habitat Int. 62, 22–42. doi: 10.1016/j.habitatint.2017.02.007
Whitehead, J., Pearson, A. L., Lawrenson, R., and Atatoa-Carr, P. (2019). How can the spatial equity of health services be defined and measured? A systematic review of spatial equity definitions and methods. J. Health Serv. Res. Policy 24, 270–278. doi: 10.1177/1355819619837292
Wu, R., Zhang, J., Bao, Y., and Zhang, F. (2016). Geographical detector model for influencing factors of industrial sector carbon dioxide emissions in Inner Mongolia, China. Sustainability 8, 149. doi: 10.3390/su8020149
Xingquan, X. (2018). A study on the evaluation of the quality of basic public services: taking the quality of basic medical service as an example. J. Macro-Qual. Res. 6, 44–54. doi: 10.13948/j.cnki.hgzlyj.2018.3.004
Yang, L., Yang, X., Wei, W., and Pan, J. H. (2020). Spatio-temporal evolution and influencing factors of water resource carrying capacity in Shiyang River Basin: based on the geographical detector method. Water Supply 20, 1409–1424. doi: 10.2166/ws.2020.057
Keywords: healthcare spatial deprivation (HSD), accessibility, Index of Relative Disadvantage (IRD), rapid urbanization, vulnerable groups
Citation: Qian Y, Qiao G, Li T and Ma R (2023) Measuring the healthcare spatial deprivation in multiple perspectives: a case study of Ningbo city. Front. Sustain. Cities 5:1260892. doi: 10.3389/frsc.2023.1260892
Received: 25 July 2023; Accepted: 30 August 2023;
Published: 18 September 2023.
Edited by:
Faisal Mumtaz, Chinese Academy of Sciences (CAS), ChinaReviewed by:
Pablo Cabrera-Barona, Latin American Faculty of Social Sciences Headquarters Ecuador, EcuadorAnzhelika Antipova, University of Memphis, United States
Copyright © 2023 Qian, Qiao, Li and Ma. This is an open-access article distributed under the terms of the Creative Commons Attribution License (CC BY). The use, distribution or reproduction in other forums is permitted, provided the original author(s) and the copyright owner(s) are credited and that the original publication in this journal is cited, in accordance with accepted academic practice. No use, distribution or reproduction is permitted which does not comply with these terms.
*Correspondence: Guanmin Qiao, cWlhb2dtQDE2My5jb20=