 Cherona Chapman*
 Jim W. Hall
- Department of Geography and the Environment, Environmental Change Institute, Oxford University, Oxford, United Kingdom
With global urban populations expected to reach 5 billion by 2030, large-scale urban development is required to support and sustain this growing populous. At the same time, city planners are facing the pressures of climatic changes, which forecast more intense rainfall events, further exacerbating the existing challenge of surface water flooding in urban locations. Sustainable drainage systems (SuDS) are one proposed solution to help alleviate such problems, yet much still remains to be known about their operation, performance and potential benefit provision beyond the neighborhood scale, or within a mixed-form development. Using a case study of the Cambridge to Oxford Arc (a region of England earmarked for extensive urbanization), development patterns of different extents and spatial layout were modeled. The Stormwater Management Model (SWMM) was then used to simulate surface water runoff conditions in these developments during a 1-in-10-year rainfall event. Whilst denser scenarios typically led to greater peak runoff rates and total runoff volumes, this was not always the case under some SuDS designs as the denser scenarios provided the opportunity for more SuDS provision. The proportion of different surface cover types had a strong influence of runoff volumes and rates (due to the different impermeable surface areas and SuDS provision), and since the different housing typologies offered different proportions under each development scenario, there was no single typology that showed the lowest or highest runoff volume across all scenarios. The findings of this study highlight the importance in a planning context of considering multiple typologies and their footprints of different surfaces to maximize the potential of the development design in achieving the development's goals.
Introduction
Urban planners have always faced the challenge of meeting multiple objectives in development plans—a challenge which is being intensified by pressures for urbanization, sustainability, and climate resilience (Xu et al., 2020). Global urban populations are expected to reach 5 billion by 2030, and to support such growth under current densities and designs, the total urban area must be triple that of 2000 (Felappi et al., 2020). The dilemma of balancing the need for residences and non-domestic buildings, whilst minimizing negative environmental and social impacts is often referred to as the “compact city paradox” (Artmann et al., 2019a), which encapsulates the tension between the two contrasting priorities.
The compact city, referred to as “smart growth” in the North American context, promotes high density, the use of brownfield sites, and infill development, and can support some elements of contemporary urban movements, such as walkable cities (Artmann et al., 2019b). However, through maximizing the use of space for urban developments, compact cities often see a loss of existing urban greenspace and limited green elements in the finished development (Bibri et al., 2020). The resultant increased soil sealing leads to decreased infiltration of rainwater and increased surface water runoff (which has implications for surface water flooding), as well as ecological and social consequence of greenspace and habitat loss (Boulton et al., 2020). It is anticipated these runoff dynamics will also be exacerbated in the future as climatic change leads to alterations in rainfall intensities and duration, with a general tendency toward more convective downpours in a warmer climate (Lee et al., 2018).
Conversely, the green city approach prioritizes urban greenspace and, more recently, the connectivity of these in ecosystem corridors, which typically leads to less dense settlements and a greater urban footprint (Artmann et al., 2019a). Thus, whilst offering benefits of urban greenspace within the city, it can be seen to have a greater sprawl than the compact alternative, infringing on greenbelt and other previously undeveloped areas (Echenique et al., 2012). Concerns have been raised over this, however, as areas affected by sprawl are typically large-scale greenspaces. Whilst the introduction of urban greenspace can help reduce any net greenspace loss, they are typically of a smaller area and cannot provide some of the ecosystem services offered by well-established, large-scale greenspace (Algador et al., 2012).
It is widely acknowledged that neither compact nor green cities offer the perfect solution for sustainable development (Echenique et al., 2012; Mouratidis, 2019; Boulton et al., 2020). Recent dialogues in planning, therefore, have looked to find a compromise between these two approaches, identifying how elements of the green city can be introduced to a compact form. For example, rather than being viewed as two contrasting and opposing approaches, Artmann et al. (2019a) argue that green and compact city movements can complement one another, and through careful balance can be fused to create a stronger approach to urban development—the smart-compact-green city. They highlight that space-efficient urban forms and green infrastructure are not mutually exclusive, with technologies such as green walls and green roofs being key examples of how such a fusion could work and offer assistance in tackling other problems such as surface water flooding. Nevertheless, as Algador et al. (2012) highlight, small-scale greenspaces alone are insufficient, and thus optimizing the design and location of cities and their greenspace elements is integral for achieving a range of ecosystem benefits at different scales (Davies et al., 2015).
In order to minimize the expansion of urban footprints, multi-functionality has widely been recognized as an important factor, with the more services provided by a given infrastructure, the fewer additional infrastructures required to provide the same range of services (Hansen et al., 2019). In such a vein, sustainable drainage systems (SuDS) are regularly considered as a good example of infrastructure that can provide essential functions (e.g., the removal of excess stormwater) as well as urban greenspace, which provides recreation, ecological and aesthetic benefits, whilst also integrating with active travel (walking and cycling) routes (see Jose et al., 2015; Fenner, 2017; Hunter et al., 2019). However, whilst there have been many studies that have looked to identify and quantify the co-benefits (such as greenspace provision) that these infrastructures provide, much of the focus has been on individual infrastructures and/or in a theoretical context (e.g., Alves et al., 2019). Whilst these offer beneficial insights into the range and extent of benefits that could be provided by a given infrastructure, little consideration is paid to the impacts one may have on the operation of another in a scheme that utilizes multiple infrastructure types, or how context-specific conditions may affect their operation. Zuniga-Teran et al. (2020) argue that these are two considerations fundamental to effective design and implementation of green infrastructure, with Haase et al. (2012) offering critical insight into how important an understanding of these synergies and trade-offs can be. Furthermore, where case studies have been employed, these often focus on small-scale developments, such as a single neighborhood, whereas for larger scale considerations are needed to better understand the wider interactions and cumulative impacts (McPhearson et al., 2016).
To explore these tensions, this study compares a range of urban designs that each utilize multiple SuDS infrastructures, and identifies the different implications these may have on runoff characteristics (and hence surface water flood generation) in a regional-scale development. In doing so, the benefits large-scale SuDS implementation can bring in an area of new-build development are quantified, in order to address the following questions:
• How do different proposed densities and spatial development patterns affect the potential areas and performance of different SuDS interventions?
• How does the variation of regional characteristics (such as slope and underlying soil conditions) affect the relative performance and benefits of different SuDS infrastructure?
• What implications does this have for planners in designing regional-scale developments involving SuDS?
Methodology
The multi-scale methodology involves (1) identification of possible large-scale patterns of urban development, given targets for total housing provision, using an urban density model (UDM); (2) use of “urban tiles” to represent how such development could look at the street-scale, whilst achieving target housing density values. These tile designs also included a range of sustainable drainage infrastructure (SuDS) interventions, tailored to the configuration of building development. (3) Rainfall-runoff modeling was then undertaken on the subsequent development design to assess surface water under the different development, urban design and SuDS provision scenarios. Figure 1 provides a graphic summary of the methodology process.

Figure 1. Flowchart showing overall methodology process.
Case study location
The Cambridge to Oxford corridor, located in south-east England (see Figure 2), is an area to the northwest of London encompassing the existing cities of Cambridge, Milton Keynes, and Oxford, and covering five counties (Berkshire, Buckinghamshire, Cambridgeshire, Northamptonshire, and Oxfordshire). It is recognized as an area of great economic potential, but these potentials are facing constraints from poor infrastructure development in the region, both in terms of transportation and housing (Infrastructure Transitions Research Consortium, 2020). Development of the region is therefore proposed, with the goal to maximize both the social and economic potential whilst exemplifying and promoting sustainable development [National Infrastructure Commission (NIC), 2019].
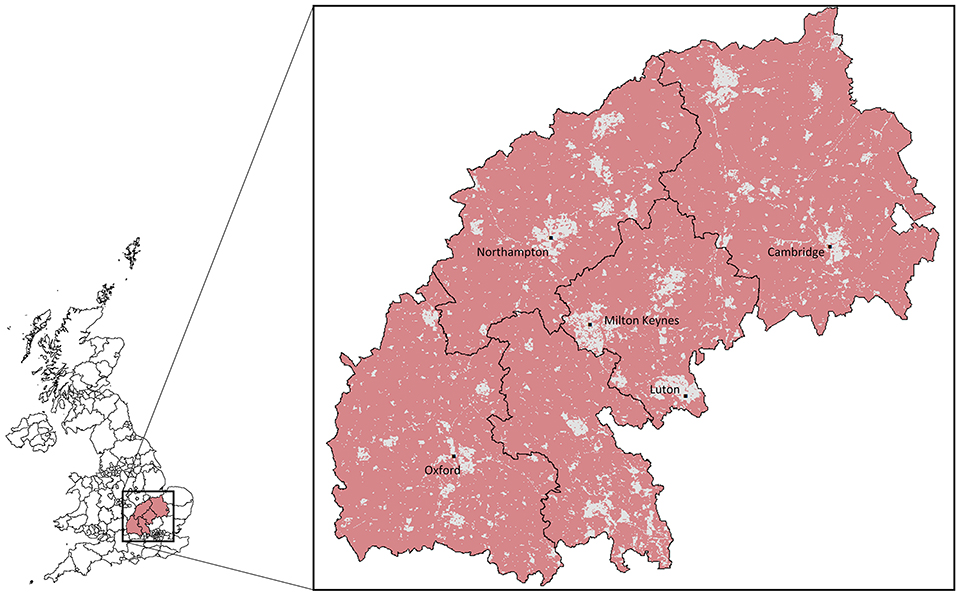
Figure 2. An outline map of the case study location showing existing urban development (gray).
One of the fundamental findings of a regional report [National Infrastructure Commission (NIC), 2019] is the lack of suitable, affordable, and sufficient housing, which is seen as a fundamental crux on which the success of the region relies. To counteract this and maximize economic potential, it is estimated 1 million new dwellings will be required by 2050, doubling current rates of development [National Infrastructure Commission (NIC), 2019]. Research into where these new homes should be located, and in what form, is still ongoing, granting the opportunity for sustainability to become a key cornerstone for consideration in the development. This vision for sustainable development is also supported by the government's 25 Year Environment Plan, which champions such actions, promoting the regaining and retention of good environmental health and investment in a future that benefits both the environment and the economy (DEFRA, 2018). Within the study area, these goals also align with those of localized plans and movements, such as the Oxfordshire Plan 2050 (Oxfordshire County Council, 2019).
Urban density modeling
The Open Urban Density Model (OpenUDM) is a spatial optimization tool for the creation of high resolution scenarios of heterogenous urbanization, subject to spatial attractors and constraints. It combines Mutli-Criteria Evaluation and Cellular Automata approaches, with the former assessing an area's suitability for development and the latter simulating conversion to urban land use based upon this (Ford et al., 2019; OpenUDM, 2022). At a 100 m grid scale, key features on the existing natural and built environment are identified, alongside the factors which will attract development and those which will constrain it. These included proximity to transport networks, the location of existing settlements, and sites of historic importance. Density constraints were also calculated to represent different scenarios of the development that could to occur, based upon proximity to urban centers and transport hubs. Sites for new development are then identified based upon target housing densities of the future scenarios (Mok et al., 2020). Outputs from OpenUDM represent the dominant type of development in each pixel for each scenario as 0 (no development), 1 (existing urban form), or 2 (new urban development), as well as quantifying dwelling densities for developed pixels.
Eight different future development scenarios for the Cambridge to Oxford corridor were simulated under UDM, and the outputs from these formed the basis of this study. The scenarios represented a rate of growth in the area of either 23,000 (23) and 30,000 (30) dwellings per year under a “green” (G) and “gray” (Y) set of development restrictions and following a new settlement (N) or existing settlement (E) expansion pattern. Specific development scenarios are hereafter referred to by a three-part abbreviation to indicate these parameter values—e.g., 23-G-E for the 23,000 dwellings per year expansion pattern under the green development restrictions (see Figure 3). “Gray” scenarios placed relatively more weight on the proximity of roads as a development attractor and relatively less weight to avoiding natural capital loss, whilst “green” scenarios placed more weight on proximity to railway stations and were additionally constrained by not developing in areas designated within a nature recovery network. New settlement scenarios focused development around proposed future railway stations, whilst expansion scenarios focused development near existing settlements and allowed some development on green belt land (Mok et al., 2020). The proposed rates of construction were based upon those required to meet target growth goals set out in the 2019 report on the corridor by the National Infrastructure Commission (NIC).
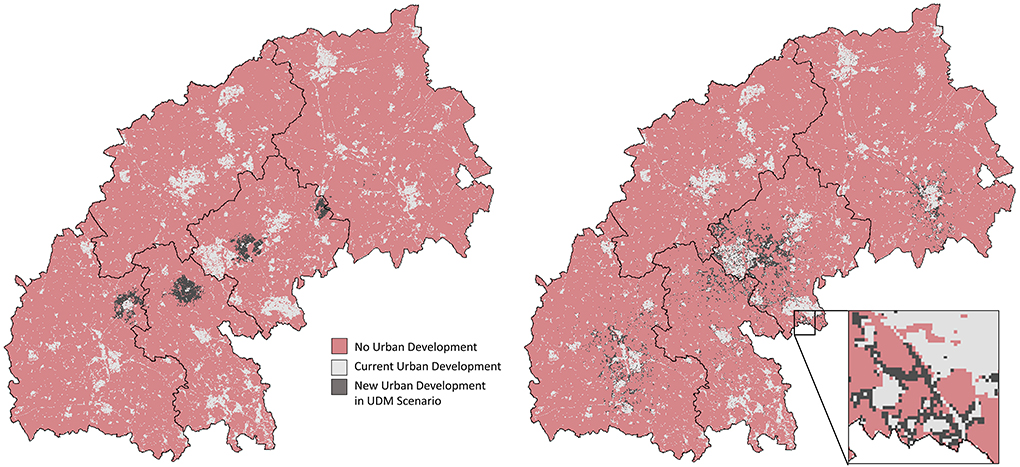
Figure 3. Two development scenarios investigated by the study: 23-G-E (left), 30-Y-N (right).
Urban tiles
Whilst there has been increasing analysis of building stock and its impacts upon resource consumption (Kavgic et al., 2010), many modeling approaches have relied on existing urban maps (thus not considering potential future urban forms) and/or had a limited appreciation of building variability. To overcome these challenges, Hargreaves (2015) developed an urban tiling approach, representing land use and building footprints at a residential-lot scale, based upon analysis from the English House Condition Survery (EHCS). These resultant 1-hectare tiles allow average densities from urban density models to be down-scaled to the lot-scale, including variation in roof areas and garden size, which have key implications for the development of localized, decentralized infrastructure (Hargreaves, 2015). As a result, this approach has been used in a variety of spatial urban modeling, including in consideration of alternative water supplies (see Hargreaves et al., 2019) and future energy scenarios (see Hargreaves et al., 2017; Ahmadian et al., 2021).
In order to better understand the land use changes and the potentials for SuDS interventions in the study scenarios, a range of urban tile designs were drawn up to spatially represent a theoretical layout for these urban developments. Urban environments are not homogenous spaces when it comes to urban form, and so to reflect this diversity, four combinations of different housing typologies were represented for each density. Each tile represented 1-hectare (for consistency with the pixel size of the UDM), and arranged the requisite houses, roads and pavements. The remaining space was assumed to be greenspace. Footprints for the built form elements were based upon design guidance from the Manual for Streets (Department for Transport, 2007) and the housing tiles developed by Hargreaves (2015). The latter was also used to inform density thresholds for each housing typology, allowing typical residence densities of different housing typologies to be appreciated. The resultant 16 urban design tiles can be seen in Figure 4. These were further subject to a range of SuDS designs (see Section SuDS design), generating a total of 40 different potential tile designs, examples of which are shown in Figure 5. Table 1 indicates the proportional coverage of these built form elements for each typology and density.

Figure 4. The urban tile layouts used in the modeling.
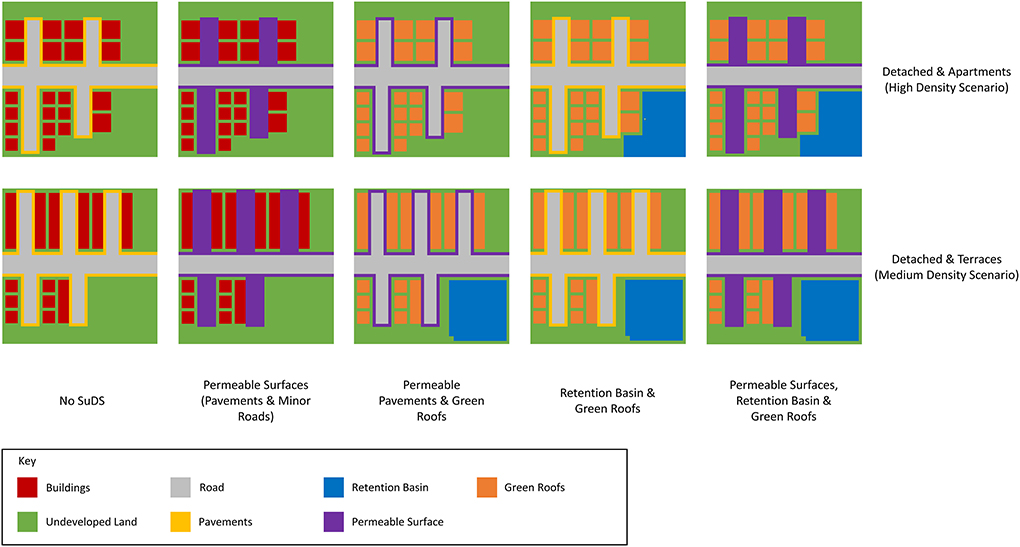
Figure 5. Example tiles for the five SuDS scenarios.
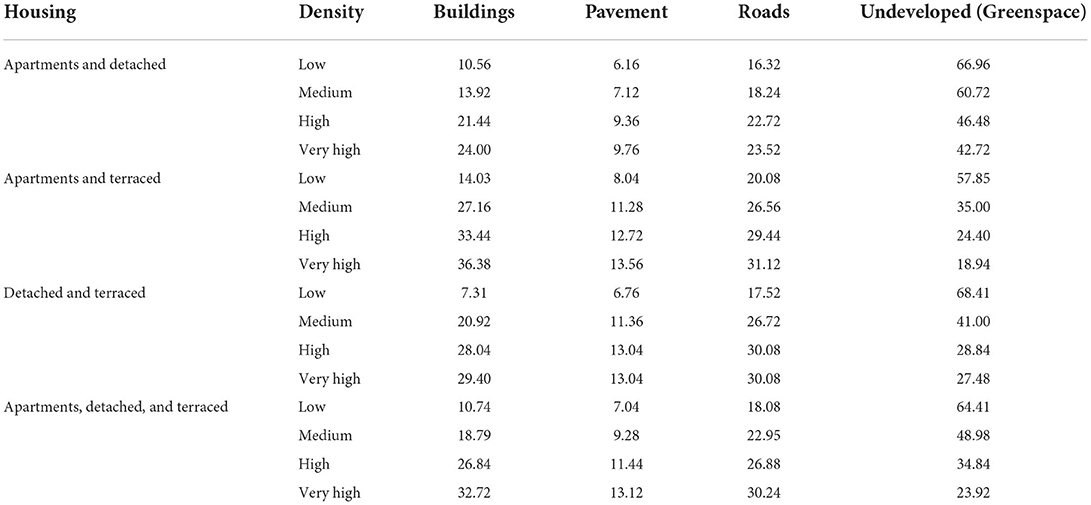
Table 1. Proportional area of tile covered by each surface area type (%) before SuDS were added.
These urban tile designs were assigned to each pixel of the UDM output for each scenario as follows. A blank tile (i.e., 100% greenspace) was assigned to each 0-value pixel. Housing densities for the 1-value and 2-value tiles were then obtained from the UDM. These housing densities were amalgamated into groups of similar values, and a selection of potential tiles assigned to each group (dependent on the number of dwellings provided by each tile design). Tiles were then randomly assigned to each 1- and 2-value pixel, but only from the selection of tiles in that pixel's dwelling number group. This allowed the resultant tiles assigned to better reflect the dwelling density whilst offering a variation among tiles of the same dwelling density. Counts of each tile type for the different development scenarios can be found in the Supplementary material.
SuDS design
To better understand how the use of SuDS in these development scenarios may influence stormwater runoff in the study region, five different SuDS scenarios were modeled for each. The five scenarios were: (1) no SuDS; (2) permeable surfaces on pavements and minor roads (PS); (3) permeable surfaces on pavements, and green roofs on residential buildings (PS+GR); (4) lot-scale retention ponds and green roofs on residential buildings (RB+GR); (5) permeable surfaces on pavements and minor roads, lot-scale retention ponds and green roofs on residential buildings (PS,RB+GR). Figure 5 illustrates these different scenarios under a given tile design.
A soil map for the study region was obtained from the National Soil Center (Cranfield University, 2021), and this used as a basemap to define the predominant soil type in each urban tile, which in turn defined drainage parameters for the tile (such as hydraulic conductivity). Each of the resultant scenarios (covering all combinations of development and SuDS scenarios) were modeled using the Environment Protection Agency's Stormwater Management Model (SWMM) under a 2-h duration, 1-in-10 year storm event. SWMM is a model noted by previous studies for its credibility in large-scale urban simulations even without observed data (Fu et al., 2019), and comparative sensitivity to imperviousness in relation to other rainfall-runoff models (Yazdi et al., 2019). A 1-in-10 year design storm was used as it represents a return period that is neither too frequent nor too rare and could thus be used to approximate the volumes of flow such infrastructure should be built to manage in order to prevent under- or over-design of systems.
Figure 6 illustrates a retention basin system in SWMM. Runoff from the study area is stored until the capacity is reached. The stored water is drained out via a drain, with the outflow rate varying dependent on stored water volume, pressure and outflow drain design (EPA, 2015). This outflow continues even after a rainfall event in order to drain the storage unit—for this study, the drain was considered to be at the bottom of the basin to allow complete draining of the basin post-rainfall event, although the model allows this to be altered to simulate permanent pools or ponds. The outflow drain, as with those in the other modeled SuDS infrastructure (where present), was modeled as draining into the undeveloped land within the tile. The size and design of these basins were based upon the area of otherwise undeveloped land in each tile and guidance from the CIRIA manual (2015) on sizing such features.
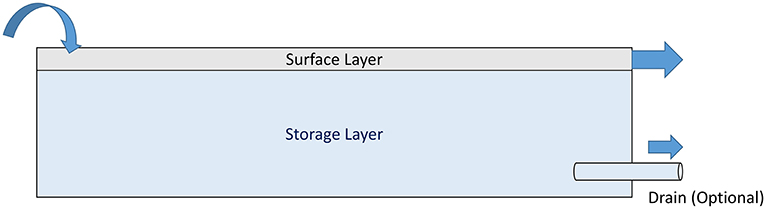
Figure 6. SWMM conceptualization of a retention basin system [adapted from EPA (2015)].
Further details on the model, including how the other SuDS infrastructure are simulated and parameters used, can be found in Chapman and Hall (2021) and Supplementary Table 1, respectively. As part of this modeling process, catchments for the study region were automatically delineated by the program, based upon a LIDAR composite digital terrain model (DTM) at 5 m resolution, sourced from the Ordnance Survey (Ordnance Survey, 2021).
Piped drainage requirements
To allow for comparison between SuDS and conventional piped drainage, requirements for the latter were estimated based on current design standards (Ministry of Housing, Communities and Local Government, 2010). However, pipes were not considered within the modeling, allowing for the appreciation of how SuDS may perform without this separate network, and to what extent they could alleviate (or eliminate) the requirement for a separate piped stormwater drainage network. For each tile, a main drainage pipe was located at the midpoint of each road, running the length of the road, and each building was connected to this via an additional pipe running perpendicular to the main pipe. An example tile with its proposed pipeline connections can be seen in Figure 7. To capture the required length across each development scenario, the lengths from each component tile were then summed.
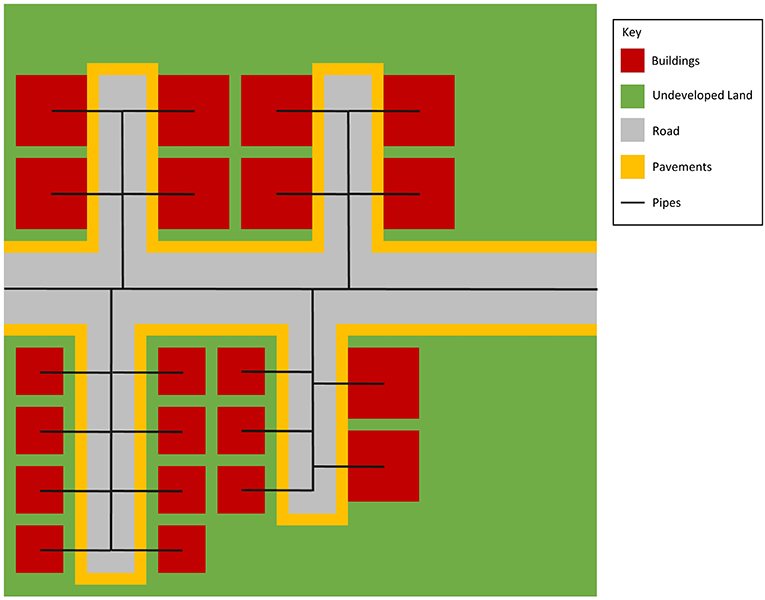
Figure 7. The simulation stormwater pipe network for a tile.
The optimum pipe diameter was computed according to Whitesides (2012):
where Do = optimal pipe diameter, Q = flow rate, vo = optimal flow velocity. Peak flow rate for the scenario, taken from the results of the SWMM runoff modeling, was used as the flow rate, and the optimum flow velocity was taken as 1.0 m/s, given that British drainage standards require a minimum flow rate of 1.0 m/s (Water UK, 2019) and drainage engineers INTECH GmbH (2021) state values will typically lie between 0.5 and 1.0 m/s. The equation only applies to Newtonian fluids, assumes flow is laminar and the velocity is continuous throughout the length of pipe (e.g., not significantly altered by pipe fittings, connectors, or other additional features; Whitesides, 2012).
Since the research was focused on stormwater, this piped system was treated as separate from the sewer network. However, in practice, the volume of stormwater not treated by SuDS in a storm event may be adequately captured by capacity in a combined sewer system, and future research should look to model this.
Results
Tile-scale
As would be expected, when modeled under the same rainfall conditions, the higher density tiles presented a greater peak runoff rate and total runoff volume, as seen in Figure 8. Within a given density group, the relative performance of each tile was dependent on housing type, and the consequent area of impermeable surfaces, with greater areas of impermeable surface generating a greater volume of surface runoff as less infiltration into the subsurface can occur. The relative impermeable areas for each housing scenario varied for each density scenario in line with their relative runoff performance.
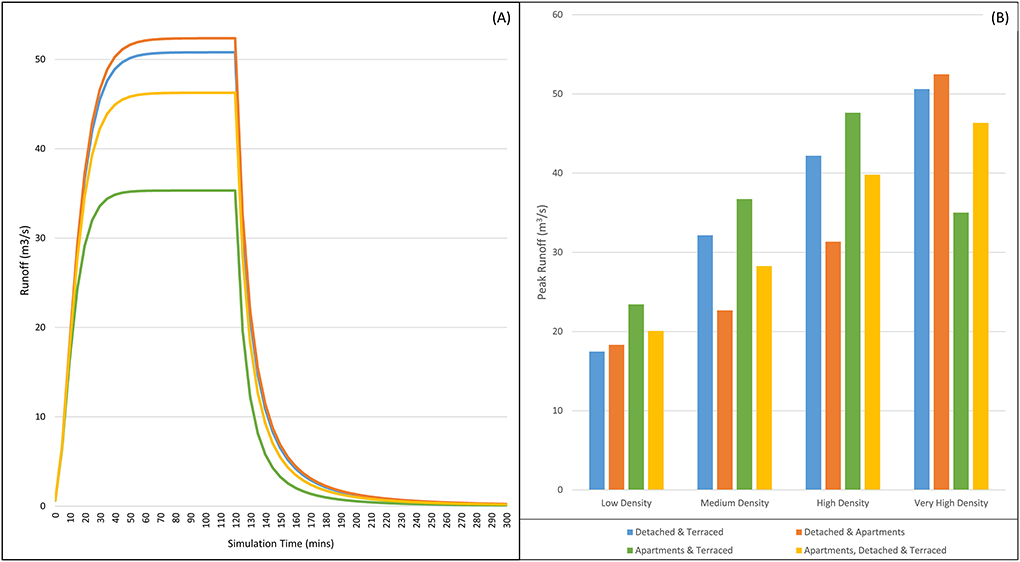
Figure 8. Runoff from a 1-in-10 year 2-h duration rainfall event in each of the tile configurations without SuDS infrastructure: (A) hydrograph of the very high density scenario; (B) peak discharges for the different housing typologies under the different density conditions.
This result highlights the importance of considering multiple housing typologies for a given project. Apartments are typically thought of as a compact solution to provide many residential units with a relatively small footprint. However, in each of the density groupings, apartments were present in the scenario with the greatest runoff volumes, and were not present in the scenario with the least runoff at low densities. Even for a specific typology, its relative performance cannot be assumed in relation to the other typologies—apartments and terraces, for example, generated the greatest runoff in the low, medium and high density cases, but the least runoff in the very high density case. This is because per building unit, apartments require the largest building footprint and area of other built elements (e.g., roads) of all the typologies. However, as each building unit can accommodate a greater population than the other housing typologies, as the population to be housed increases, fewer apartment units are required in comparison to the other typologies, offsetting the impact of this initially-large built form area requirement.
These findings suggest that planners should carefully consider the housing typologies used in developments of different densities, especially in areas particularly susceptible to surface water flooding, and look to consider how different combinations of typologies may perform relative to one another in a range of metrics that represent and balance the goals of a development (e.g., built-form footprints, surface runoff generation, greenspace provision). Some typologies have a relatively high building footprint, for example, suggesting green roofs will provide greater runoff reduction than those with a smaller proportional area. Furthermore, the impermeable area gained in a denser scenario can provide greater opportunity for SuDS development, reducing overall runoff—without roofs, for example, we cannot build green roofs, and if greater roof area is accompanied by a relatively small increase in other impermeable surfaces, it can offer greater runoff volume reduction (as seen with the Apartments and Terraced scenarios).
These proportional densities (see Table 1) vary with both housing typology and density, and thus case-by-case consideration is required so that different priorities can be balanced accordingly—a fact highlighted by Hargreaves et al. (2019) due to its key role in determining opportunities for sustainable infrastructure development. Additional projects within the development, such as wide-scale public transport or cycle network provision, may also impact this proportional surface type division, further affecting the suitability and impact of different urban designs.
Table 2, below, estimates the pipe diameter that would be required to fully capture the 1-in-10 year rainfall event under the different scenarios for each of the tiles. As would be expected, this patterning is closely related to the different proportional areas of land cover presented in each scenario, which determines the size of different SuDS implementations. For example, the detached and terraced housing tiles consistently require less additional piped drainage than the apartment and terraced tiles at a given density for the permeable surface scenarios due to their greater area of roads and pavements, and thus greater area of permeable surface. Furthermore, due to this role of proportional land cover, the different housing typologies perform differently under different SuDS combinations, dependent on which infrastructure (or lack of) the SuDS are constructed upon. There is no one typology which consistently outperforms all others in reducing piped drainage requirements, highlighting the importance of considering both housing and SuDS typologies and their interplay when designing developments.
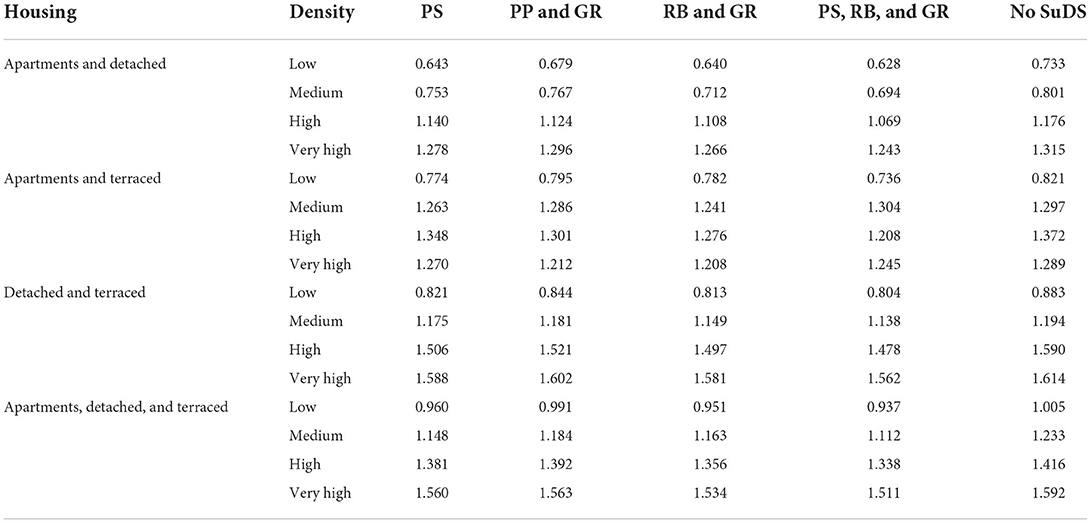
Table 2. Optimal pipe diameter (m) required under each SuDS scenario for the development tiles to fully capture a 2 h duration 1-in-10 year rainfall event.
Development density should also be considered during design since, as previously shown by Fu et al. (2019) and Xu et al. (2020), the relationship with runoff generation is not linear. Whilst on the whole, greater densities require greater piped drainage magnitudes to fully capture rainfall events due to increasing impermeable surface areas, there were some cases where denser scenarios required a smaller pipe diameter. When using green roofs and a retention ponds or green roofs and permeable pavements, the apartment and terraced housing typology saw its maximum pipe diameter requirements under the high density scenario. Similarly, when using all SuDS studied simultaneously, the same typology saw greater size requirements in the medium density than high density scenario, although maximum requirements were still seen in the very high density case. This is due to the minimal additional road infrastructure required between the two density cases to accommodate the increased residence numbers. Thus, the area of roofs (and therefore green roof SuDS) increases much more than the area of impermeable surface generating runoff, allowing greater volumes to be managed by SuDS in the denser scenario.
Arc-scale
Without any SuDS interventions, regardless of scenario, approximately 70,000 km of pipe will be required to manage stormwater runoff across the case study region (see Table 3). This figure only considers the new development areas and does not take into account lengths required to connect these new pipes to the existing network. By nature of the design, this unaccounted length is likely to be greater in new settlement scenarios than expansion. These figures are similar across the scenarios due to the design of the tiles, which see a length of pipe and road running across the center of the tile regardless of how far across the tile development spreads. Whilst in design this allows neighboring developed tiles to connect with one another infrastructure-wise, it means that estimated pipe requirements only differ dependent on the length of side roads and short building-to-road connections. In reality, the spatial organization of developments, particularly in low density scenarios, mean that this central road and pipe is not always required (such as in cul-de-sac developments), which would show greater variation between low and high density developments.
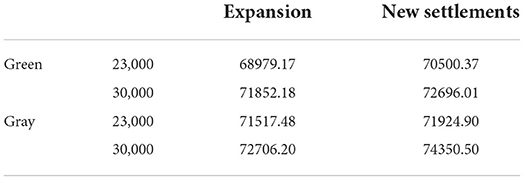
Table 3. Estimated length of pipes (km) that would be required for the new developments across the Arc in each scenario.
The true cost and extent of this piped system will depend also on the volumetric capacity the system is designed to take, which will influence the diameter of pipes used. Even if SuDS interventions used in a development are not the sole solution for stormwater management, they will lessen the capacity required for the pipe network, and thus reduce costs by reducing required pipe size. Given previous research and existing drainage developments, however, it is not implausible to suggest that single developments or neighborhoods could optimize their SuDS designs and thus not depend on a separate piped stormwater drainage network (e.g., Hodsons, 2019). If this were the case, an exceedance event during a large storm could be considered and appreciated within a combined sewer approach, taking advantage of the pipes already required for the sewerage system.
When we consider the different SuDS scenarios, each watershed delineated by the model shows a similar response pattern to a given SuDS scenario, albeit to a different extent dependent on watershed size and proportional developed area. Figure 9 shows the runoff profile from an example catchment under the five SuDS scenarios. Lag times and peak runoff rates depended both on how urbanized the catchment is, and the urban tiles assigned to any areas of new development within the catchment. As would be expected, the greatest peak runoff occurs where no SuDS are present. In this scenario, all the developed urban surfaces (i.e., building, roads, and pavements) are impermeable and so generate surface runoff during a storm event. Similarly, the PS,RB+GR scenario offers maximum SuDS implementation (within this research) and so gives the lowest peak runoff rate. Among the other three scenarios, varying proportions of the surfaces offer infiltration and/or storage, and so the total runoff generated is reduced.
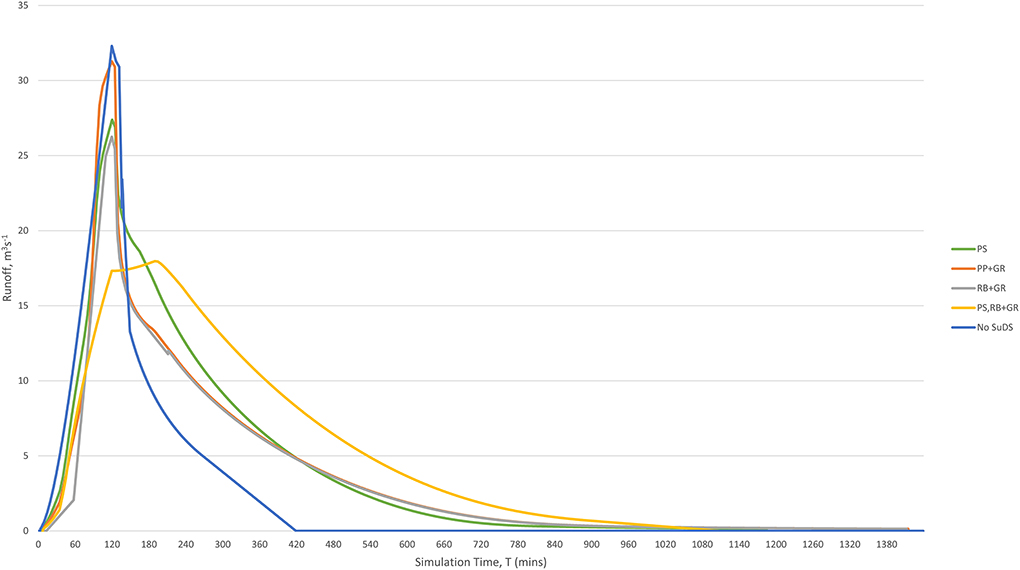
Figure 9. Runoff rate for a watershed in the study region under the different SuDS scenarios.
The scenarios which feature a retention basin (RB+GR and PS,RB+GR) offer a longer lag time than those without. The basin offers storage for a given capacity of water which would else be runoff, and this additional time represents the time taken for it to reach capacity. Following this, the rate of increase in runoff rate accelerates as a greater area of the catchment is generating surface runoff. It is important to note that there is still runoff during this initial lag time, however, as not all the catchment is drained by the retention basin feature. Simulations undertaken in this research show exceedance of the retention features within 85 min of the storm event starting. The design of these features, however, could be optimized to drain a smaller area of the catchment or offer a larger storage capacity, which could extend the time before exceedance.
The development approach also has an impact on the runoff response. As illustrated in Figure 10, the scenarios supporting a higher volume of housing exhibit a greater peak runoff rate, whilst there is little observable difference between the green and gray development scenarios in most watersheds. With smaller, more frequent storm events, however, this is likely to be more noticeable as SuDS are able to manage a greater proportion of the precipitation before saturation and runoff occurs. This pattern can be seen across both the catchments and SuDS scenarios. With more houses comes more development and thus a greater spatial extent of impermeable surfaces, generating more surface runoff during a rainfall event. Furthermore, whilst the green and gray development restrictions create different spatial distributions for the development at the study area scale, many catchments see little change in the extent of development between the two, and thus show little difference in runoff responses. Where this is not the case, the scenario with the greater proportion of developed tiles shows a greater peak runoff rate.
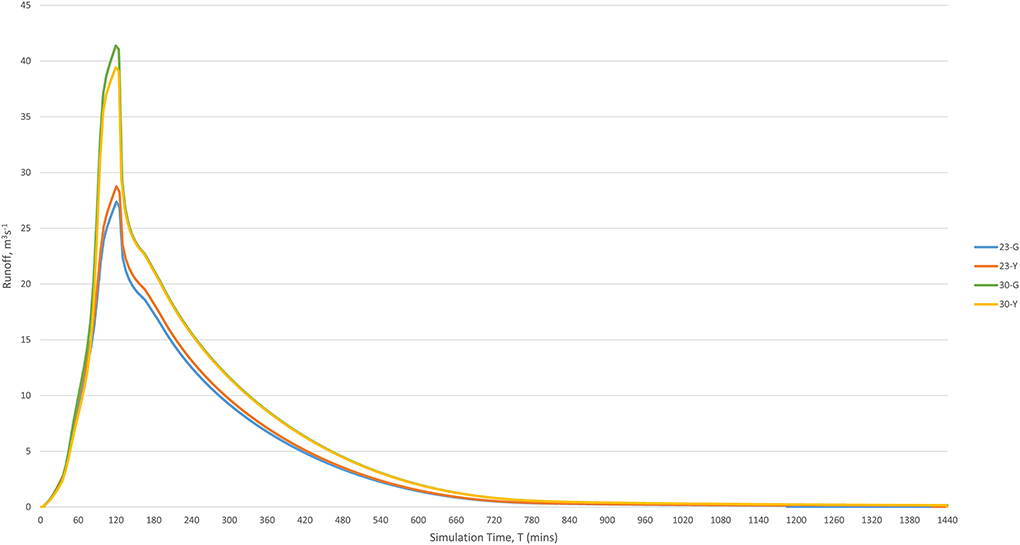
Figure 10. Runoff rate for a watershed in the study region under the PS scenario and different development approaches.
Conclusion
Facing challenges of urbanization and future climatic changes, the future of urban development is uncertain, with competing pressures favoring contrasting approaches. Urban population growth is expected to continue to rise in upcoming decades, and without a considered approach to managing and supporting the resultant urbanization, development could result in severe environmental consequences, such as urban sprawl and car-dependency (Boulton et al., 2020). There is still much debated as to the best-suited built form, and whilst many acknowledge that neither the Compact City nor Green City models are ideal, uncertainties still remain surrounding a suitable hybrid approach (Artmann et al., 2019a). Similarly, when it comes to urban drainage, whilst SuDS are considered a sustainable tool for stormwater management, different combinations of infrastructure offer different efficiencies in stormwater runoff management as well as differing co-benefits.
Using a proposed regional development as a case study, this paper simulated a range of potential urban development scenarios based on the outputs of an urban density model. These futures considered different scales of development (a growth of 23,000 or 30,000 houses), different planning forms (new settlement construction or existing settlement expansion) and different spatial restrictions (a “green” and “gray” scenario), as well as the introduction of different combinations of SuDS. SWMM was then used to simulate a 1-in-10 year storm event for the study area.
Higher density scenarios are generally predicted to result in greater runoff volume and peak runoff rate, but this was also affected by the impermeable surface area. Different housing typologies offered different building footprints at different densities, and thus a given typology did not consistently present the highest or lowest runoff volume for a given density. In fact, whilst yielding the highest runoff volume at low, medium and high densities, apartments and terraces yielded the lowest runoff volume at a very high density as the relative loss of permeable surfaces required to achieve the density increase was low, highlighting the importance of considering multiple typologies and their relative footprints over favoring a single approach. This echoes the findings of Hargreaves et al. (2019), who outlined the importance of such consideration when planning sustainable water supply systems, too.
The quantity of piped drainage network that would be required in each scenario to fully capture the simulated rainfall event was calculated. This, too, showed variation between housing typology and density. Whilst, on the whole, a greater building density required larger pipe diameters, this was not consistently the case due to relative increases in infrastructure supporting SuDS and impermeable surfaces, which allowed a greater proportion of the runoff to be captured by SuDS in higher density scenarios.
At the wider scale, it was observed that the larger scale developments saw a greater peak runoff than their lower scale counterparts due to the increased surface sealing by impermeable development across the area, whilst the planning type and spatial restrictions had a more spatially-diverse impact, only creating a significant difference where the extent of development differed greatly within the catchment between the two scenarios. Nevertheless, with the introduction of SuDS, all catchments in all development scenarios showed a reduction in the peak runoff rate as the infrastructure offered increased capacities for infiltration and storage. The extent of the reduction varied with SuDS combination and type, with the greatest impact in that which utilized all modeled infrastructure types.
The findings of this research highlights several key considerations when planning new developments, including (1) the impact of different typologies, densities and SuDS infrastructure on the proportional areas of different surface types, and the impacts/opportunities these may provide in terms of runoff; (2) the additional infrastructure requirements to connect more spatially diverse developments, and the impacts this may have on runoff; (3) how potential areas for SuDS may help reduce (or eliminate) the need for a separate stormwater drainage system, reducing infrastructure costs.
Data availability statement
The original contributions presented in the study are included in the article/Supplementary material, further inquiries can be directed to the corresponding author/s.
Author contributions
CC designed the presented study, performed the modeling and analysis, and wrote the article. JH supervised the work, providing critical feedback, and helping to shape the research, analysis and manuscript. Both authors contributed to the article and approved the submitted version.
Funding
This work was funded by EPSRC Award Reference: 1926802.
Conflict of interest
The authors declare that the research was conducted in the absence of any commercial or financial relationships that could be construed as a potential conflict of interest.
Publisher's note
All claims expressed in this article are solely those of the authors and do not necessarily represent those of their affiliated organizations, or those of the publisher, the editors and the reviewers. Any product that may be evaluated in this article, or claim that may be made by its manufacturer, is not guaranteed or endorsed by the publisher.
Supplementary material
The Supplementary Material for this article can be found online at: https://www.frontiersin.org/articles/10.3389/frsc.2022.922890/full#supplementary-material
References
Ahmadian, E., Sodagar, B., Bingham, C., Elnokaly, A., and Mills, G. (2021). Effect of urban built form and density on building energy performance in temperate climates. Energy Build. 236, 110762. doi: 10.1016/j.enbuild.2021.110762
Algador, D., Triviño, M., Cerdeira, J. O., Brás, R., Cabeza, M., and Araújo, M. B. (2012). Linking like with like: optimising connectivity between environmentally-similar habitats. Landscape Ecol. 27, 291–301. doi: 10.1007/s10980-012-9704-9
Alves, A., Gersonius, B., Kapelan, Z., Vojinovic, Z., and Sanchez, A. (2019). Assessing the co-benefits of green-blue-grey infrastructure for sustainable urban flood risk management. J. Environ. Manage. 239, 244–254. doi: 10.1016/j.jenvman.2019.03.036
Artmann, M., Inostroza, L., and Fan, P. (2019a). Urban sprawl, compact urban development and green cities. How much do we know, how much do we agree? Ecol. Indicat. 96, 3–9. doi: 10.1016/j.ecolind.2018.10.059
Artmann, M., Kohler, M., Meinel, G., Gan, J., and Ioja, I. C. (2019b). How smart growth and green infrastructure can mutually support each other — A conceptual framework for compact and green cities. Ecol. Indicat. 96, 10–22. doi: 10.1016/j.ecolind.2017.07.001
Bibri, S. E., Krogstie, J., and Karrholm, M. (2020). Compact city planning and development: emerging practices and strategies for achieving the goals of sustainability. Dev. Built Environ. 4, 100021. doi: 10.1016/j.dibe.2020.100021
Boulton, C., Dedekorkut-Howes, A., Holden, M., and Byrne, J. (2020). Under pressure: factors shaping urban greenspace provision in a mid-sized city. Cities 106, 102816. doi: 10.1016/j.cities.2020.102816
Chapman, C., and Hall, J. W. (2021). The influence of built form and area on the performance of sustainable drainage systems (SuDS). Future Cities Environ. 7, 5. doi: 10.5334/fce.112
Cranfield University (2021). Soils Data © Cranfield University (NSRI) and for the Controller of HMSO.
Davies, C., Hansen, R., Rall, E., Pauleit, S., Lafortezza, R., DeBellis, Y., et al. (2015). Green Infrastructure Planning and Implementation (GREEN SURGE). The Status of European Green Space Planning and Implementation Based on an Analysis of Selected European City-Regions, 1–134. doi: 10.13140/RG.2.1.1723.0888
DEFRA (2018). A Green Future: Our 25 Year Plan to Improve the Environment. Available online at: https://www.gov.uk/government/publications/nature-recovery-network/nature-recovery-network (accessed April 27, 2021).
Echenique, M. H., Hargreaves, A. J., Mitchell, G., and Namdeo, A. (2012). Growing cities sustainably – does urban form really matter? J. Am. Plan. Assoc. 78, 121–137. doi: 10.1080/01944363.2012.666731
Felappi, J. F., Sommer, J. H., Falkenberg, T., Terlau, W., and Kötter, T. (2020). Green infrastructure through the lens of “One Health”: a systematic review and integrative framework uncovering synergies and trade-offs between mental health and wildlife support in cities. Sci. Tot. Environ. 748, 141589. doi: 10.1016/j.scitotenv.2020.141589
Fenner, R. A (2017). Spatial evaluation of multiple benefits to encourage multi-functional design of sustainable drainage in blue-green cities. Water 9, 953–969. doi: 10.3390/w9120953
Ford, A., Barr, S., Dawson, R. J., Virgo, J., Batty, M., and Hall, J. W. (2019). A multi-scale urban integrated assessment framework for climate change studies. Comput. Environ. Urban Syst. 75, 229–243. doi: 10.1016/j.compenvurbsys.2019.02.005
Fu, X., Luan, Q., Wang, H., Liu, J., and Gao, X. (2019). “Application research of SWMM in the simulation of large-scale urban rain flood process - a case study of Yizhuang District, China,” in Sustainable Development of Water Resources and Hydraulic Engineering in China, eds W. Dong, Y. Lian, and Y. Zhang (New York, NY: Springer International Publishing), 251–260.
Haase, D., Schwarz, N., Strobach, M., Kroll, F., and Seppelt, R. (2012). Synergies, trade-offs, and losses of ecosystem services in urban regions: an integrated multiscale framework applied to the Leipzig-Halle region, Germany. Ecol. Soc. 17, 22. doi: 10.5751/ES-04853-170322
Hansen, R., Olafsson, A. S., van der Jagt, A. P. N., Rall, E., and Pauleit, S. (2019). Planning multifunctional green infrastructure for compact cities: what is the state of practice? Ecol. Indicat. 96, 99–110. doi: 10.1016/j.ecolind.2017.09.042
Hargreaves, A. J (2015). Representing the dwelling stock as 3D generic tiles estimated from average residential density. Comput. Environ. Urban Syst. 54, 280–300. doi: 10.1016/j.compenvurbsys.2015.08.001
Hargreaves, A. J., Cheng, V., Deshmukh, S., Leach, M., and Steemers, K. (2017). Forecasting how residential urban form affects the regional carbon savings and costs of retrofitting and decentralized energy supply. Appl. Energy 186, 549–561. doi: 10.1016/j.apenergy.2016.02.095
Hargreaves, A. J., Farmani, R., Ward, S., and Butler, D. (2019). Modelling the future impacts of urban spatial planning on the viability of alternative water supply. Water Res. 162, 200–213. doi: 10.1016/j.watres.2019.06.029
Hodsons (2019). Lamb Drove: Demonstrating SuDS with Permeable Paving. Available online at: https://www.paving.org.uk/lamb-drove-suds-monitoring/ (accessed March 23, 2021).
Hunter, R. F., Cleland, C., Cleary, A., Droomers, M., Wheeler, B. W., Sinnett, D., et al. (2019). Environmental, health, wellbeing, social and equity effects of urban green space interventions: a meta-narrative evidence synthesis. Environ. Int. 130, 104923. doi: 10.1016/j.envint.2019.104923
Infrastructure Transitions Research Consortium (2020). A Sustainable Oxford-Cambridge Corridor? Spatial Analysis of Options and Futures for the Arc. Available online at: https://www.itrc.org.uk/wp-content/uploads/2020/01/arc-main-report.pdf (accessed April 20, 2021).
INTECH GmbH (2021). Pipeline Design and Selection: Optimum Pipeline Diameter. Available online at: https://intech-gmbh.com/pipelines_calc_and_select/ (accessed August 24, 2021).
Jose, R., Wade, R., and Jefferies, C. (2015). Smart SUDS: recognising the multiple-benefit potential of sustainable surface water management systems. Water Sci. Technol. 71, 245–251. doi: 10.2166/wst.2014.484
Kavgic, M., Mavrogianni, A., Mumovic, D., Summerfield, A., Stevanovic, Z., and Djurovic-Petrovic, M. (2010). A review of bottom-up building stock models for energy consumption in the residential sector. Build. Environ. 45, 1683–1697. doi: 10.1016/j.buildenv.2010.01.021
Lee, J., Chung, G., Park, H., and Park, I. (2018). Evaluation of the structure of urban stormwater pipe network using drainage density. Water. 10, 1444. doi: 10.3390/w10101444
McPhearson, T., Pickett, S. T. A., Grimm, N. B., Niemelä, J., Alberti, M., Elmqvist, T., et al. (2016). Advancing urban ecology toward a science of cities. Bioscience 66, 198–212. doi: 10.1093/biosci/biw002
Ministry of Housing Communities Local Government. (2010). The Building Regulations 2010: Drainage and Waste Disposal. Available online at: https://assets.publishing.service.gov.uk/government/uploads/system/uploads/attachment_data/file/442889/BR_PDF_AD_H_2015.pdf (accessed April 19, 2021).
Mok, H., Russell, T., Virgo, R., Smith, A., Hall, J. W., and Ford, A. (2020). Future of the Oxford Cambridge Arc. Available online at: https://nismod.github.io/arc-udm-vis/index.html (accessed May 03, 2021).
Mouratidis, K (2019). Compact city, urban sprawl, and subjective well-being. Cities 92, 261–272. doi: 10.1016/j.cities.2019.04.013
National Infrastructure Commission (NIC) (2019). Partnering for Prosperity: A new deal for the Cambridge-Milton Keynes-Oxford Arc. Available online at: https://nic.org.uk/app/uploads/Partnering-for-Prosperty.pdf (accessed April 21, 2021).
OpenUDM (2022). Open Urban Development Model (OpenUDM). Available online at: https://github.com/geospatialncl/OpenUDM/ (accessed May 28, 2022).
Oxfordshire County Council (2019). Introducing the Oxfordshire Plan 2050. Available online at: https://oxfordshireplan.org/wp-content/uploads/2019/02/Introducing_the_Oxfordshire_Plan_Feb_2019.pdf (accessed April 27, 2021).
Water UK (2019). Sewerage Sector Guidance Appendix C. Available online at: https://www.water.org.uk/wp-content/uploads/2019/03/Appendix-C-to-draft-sewerage-Sector-Guidance-Design-and-Construction-Guidance.pdf (accessed August 24, 2021).
Whitesides, R. W (2012). Selecting the Optimal Pipe Size. Available online at: https://www.pdhonline.com/courses/m270/m270content.pdf (accessed September 20, 2021).
Xu, C., Rahman, M., Haase, D., Wu, Y., Su, M., and Pauleit, S. (2020). Surface runoff in urban areas: the role of residential cover and urban growth form. J. Clean. Product. 262, 121421. doi: 10.1016/j.jclepro.2020.121421
Yazdi, M. N., Ketabchy, M., Sample, D. J., Scott, D., and Liao, H. (2019). An evaluation of HSPF and SWMM for simulating streamflow regimes in an urban watershed. Environ. Modell. Softw. 118, 211–225. doi: 10.1016/j.envsoft.2019.05.008
Keywords: sustainable drainage systems (SuDS), urbanization, urban development, stormwater management, urban drainage
Citation: Chapman C and Hall JW (2022) The potential for sustainable drainage systems (SuDS) in a regional urbanization project. Front. Sustain. Cities 4:922890. doi: 10.3389/frsc.2022.922890
Received: 18 April 2022; Accepted: 29 June 2022;
Published: 04 August 2022.
Edited by:
Juan Pablo Rodríguez Sánchez, University of Los Andes, ColombiaReviewed by:
Jon Hathaway, The University of Tennessee, Knoxville, United StatesEdgar Antonio Barragán, Salesian Polytechnic University, Ecuador
Copyright © 2022 Chapman and Hall. This is an open-access article distributed under the terms of the Creative Commons Attribution License (CC BY). The use, distribution or reproduction in other forums is permitted, provided the original author(s) and the copyright owner(s) are credited and that the original publication in this journal is cited, in accordance with accepted academic practice. No use, distribution or reproduction is permitted which does not comply with these terms.
*Correspondence: Cherona Chapman, Y2hlcm9uYS5jaGFwbWFuQHNlaC5veC5hYy51aw==