 Zeineb Kassouk
 Hela Hammami
 Haithem Ismail2
- 1Lr GREEN-TEAM (Lr17AGR01), National Agronomic Institute of Tunisia, Carthage University, Tunis, Tunisia
- 2Centre National de la Cartographie et de la Télédétection (CNCT), Tunis, Tunisia
Coastal cities are desirable places to live and work which results in ongoing and increasing urbanization. In southern Mediterranean countries, coastal urbanization often occurs on croplands. This expansion is frequently on most productive croplands and emerges as an important sustainability concern. The aim of this study is to quantify urban growth over lands in Kelibia city, a coastal region in Tunisia that is one of the most threatened Mediterranean regions. We describe the changes in urban structures during the period of 2012–2016 by using Multi dates Pleiades images and using Otsu binary and sample-based Edge segmentation. Otsu segmentation showed higher accuracy than Edge segmentation method. Based on Otsu binary maps, urban areas were quantified in two dates. The results illustrated a dramatic increase of urban areas at the expense of agricultural land, maritime public domain (MPD) and hydraulic public domain (HPD). Analysis of parameters for urban sprawl quantification evaluated a sharp increase of urbanization rate, intensity, and dynamic degree. FRAGSTAT metrics described the change of landscape structure due to the increase of fragmentation pace, compactness degree, shape complexity, and proximity reduction. This significant urban change in extent and structure during a short temporal scale could be considered as a serious issue. For this reason, the implementation of systematic strategies for urban monitoring requires citizen awareness, law enforcement, and scientific supervision to mitigate land consumption, reduce flooding vulnerability, and to control the environmental impacts of urbanization.
Introduction
Mediterranean coastal areas are among the most affected by an overall expanse of urban area. Most of the future urban population and urban area expansion are forecast to take place in irrigated croplands, highlighting the potential competition for land between agricultural, coastal, and urban uses (Catalán et al., 2008).
The acquisition of human well-being and economic development requires urban transformations. The main government objectives are to manage, support, and to regulate different sectors to afford the accessibility to services for residents and promote an adequate environment for private investment (Shirazi and Falahat, 2012). In addition, among the most important conditioning factors of urban sprawl is the increase of population density; a future increase of population density was expected. The continuous development of urban indicators and mapping methods are well used in the analysis of urban expansion (Schwarz, 2010; Güneralp et al., 2020). This systematic evolution allows the uncontrolled urbanization to be managed.
Remote sensing and Geographical Information System (GIS) are used in analyzing the progression, pattern, and extent of urban sprawl and future patterns in fringe area using satellite images and spatial analysis (Zhou et al., 2011; Kuffer et al., 2021).
In this paper, an attempt has been made to quantify the urbanized areas and study the impacts of urban sprawl on landscape pattern change in Kelibia city in Northern of Tunisia. We try to quantify the urban expansion at over agricultural land, maritime public domain (MPD) and hydraulic public domain (HPD) from 2012 to 2016. We will describe the changes of urban landscape by estimating urban indicators.
Materials and Methods
Study Area
Kelibia city is in the Cap Bon coastal area, in the northeast of Tunisia, at 36° 50'51N and 11° 53'8 E. It is the third populated city in the governorate of Nabeul (more than 54,000 people) (Meddeb, 2014). The region is surrounded by the sea (in the east), high ranges of hills, mountains (in the north), and agricultural plains (in the west and south sides) and considered as a suitable region for agricultural investment (Kahloun, 2011) (Figure 1). Kelibia covers a total area of 125.7 km2 with 492.9/km2 population density. The demographic increase has intensified anthropogenic pressures on Cap Bon coastal areas by implementing touristic and industrial activities (BenSaid, 2014). Anarchic urban growth is accompanied by declining land-use efficiency, decreasing urban population densities, and loss of agricultural land. Other severe issues of uncontrolled urbanization are the aggravated development of urban infrastructures along the coastline by increasing the complexity of road networks (Belhedi, 1993).
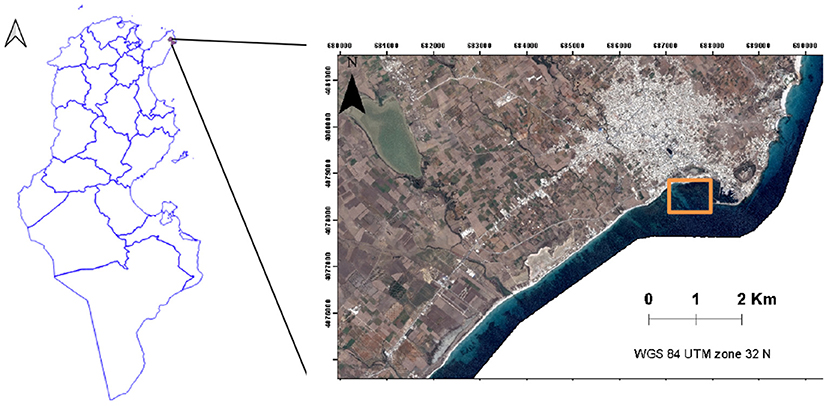
Figure 1. Location of the study area: Kelibia city (right) with regard to the government area boundary of Tunisia (left).
Since agricultural and touristic investments are the main human activities in Kelibia city, the buffer zones near agricultural land, maritime and hydraulic public domains have confronted intensive exploitation leading to the increase of flooding sensitivity. The boundaries of agricultural areas, MPD and HPD were used to delineate the borders of sea, rivers, and arable lands (Weslati, 2010).
Dataset and Pre-processing
In this study, we used two Pleiades 1A images acquired in March 27, 2012 and June 28, 2016. The used product is a pansharpened orthorectified color data at 0.5-meter resolution with four spectral bands (Panchromatic: 480–830 nm; Blue: 430–550 nm; Green: 490–610 nm; Red: 600–720 nm); Near Infrared: 750–950 nm. The Geometric correction and radiometric calibration are performed using the Orfeo Toolbox (OTB) (Lee et al., 2020).
The Mapping of Urban Sprawl
Spectral Indices Calculation and Thresholding
Remote sensing spectral indices and thresholding are retrieved from a sensor into indexed quantities useful for analyzing a target environment, isolating target features, and indexing those features into identifiable classes (Samsudin et al., 2016). Multispectral information and derivatives such as the spectral indices are essential to discriminate landscape elements.
Tow spectral indices were computed: The normalized difference vegetation index (NDVI) (Rouse et al., 1974) can be used to indicate relative density, or the amount, of the green vegetation present in the image. It can also be used to adapt this index to show the confidence levels with respect to the presence of vegetation. NDVI is computed using the red and near infrared bands (Equation 1).
The second index is the normalized difference water index (NDWI) (McFeeters, 1996) is used to differentiate water from the dry land or rather most suitable for waterbody.
The NDWI is computed using the green and near infrared bands (Equation 2).
We also applied a Principal Component Analysis (PCA) to Pleiades imagery data. This technique creates a smaller dataset from multiple bands, while retaining as much original spectral information as possible. The result is a set of uncorrelated image bands, called PC bands (Petrişor et al., 2012; Abiodun et al., 2017) (Figure 2).
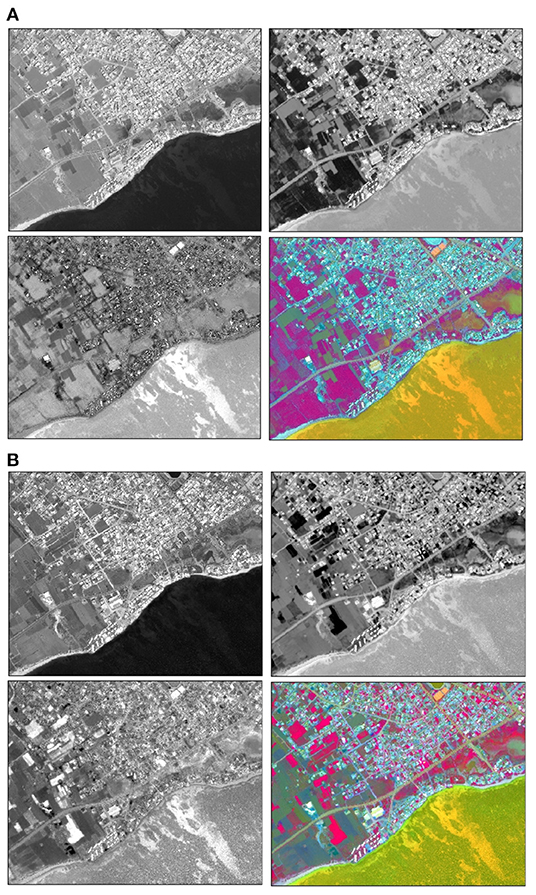
Figure 2. (A) The first three PCA component (image in gray tones) and the RGB (RED GREEN BLUE) composite image (PCA1/PCA2/PCA3) of 2012. (B) The first three PCA component (image in gray tones) and the RGB (RED GREEN BLUE) composite image (PCA1/PCA2/PCA3) of 2012. In both cases (A,B), the second PCA (PCA2) shows an evident spectral enhancement of the building expansion path. On the image this path is represented in white color. The RGB images represent the best information considering all elements of the image; Buildings are represented with indistinct color tones. Location sample is indicated by a red square in Figure 1.
Feature Extraction
Otsu Threshold Segmentation
Spectral indices are essential to discriminate landscape elements but are not sufficient. An effective delineation requires advanced feature computing able to discriminate objects that have similar spectral responses but different textures, shapes, and contexts.
Feature extraction from an image could perform by the image segmentation by dividing the image into distinct and self-seminar pixel group. Thresholding is a simple technique but effective method to separate objects from the background.
To find the optimal value for the global threshold, we use the Otsu algorithm which is a threshold-based segmentation algorithm proposed by Otsu in 1979 (Du et al., 2014). It is based in the image histogram to get a corresponding binary image relying on the greatest variance between the target and background class to determine the image segmentation threshold value (Bhandari et al., 2012).
Otsu thresholding was applied to separate a specific land cover from others based on the binary thresholding method. The relevant segmentation threshold is identified by determining the maximum between the variance of two classes (Estoque and Murayama, 2013). Binary thresholding were applied to NDVI and NDWI products.
Subsequently, the distinguishing between urban constructions and vegetated areas was carried out from binary thresholding NDVI maps.
In fact, by applying Otsu thresholding, highest values were assigned to vegetation and soil whereas the lowest NDVI values represent built-up areas. The Otsu threshold of 2012 NDVI image is 0.32 and that of 2016 NDVI image is 0.45.
Edge Segmentation
Secondly, we classify map using the object-oriented classification approach of PCA Image. This approach, firstly, segments the image into multiple homogeneous regions and performing corresponding operations on each homogeneous region (polygons). The segmentation technology has been widely used in the field of image classification, as it can simultaneously utilize spatial and spectral information of PCA image (Kaganami and Beiji, 2009; Kavzoglu and Tonbul, 2017; Dupuy et al., 2020). We used the Edge segmentation algorithm to discerned image in to regulate object boundaries. The edge scale was 75 for PCA images.
Segmented objects were classified based on their characteristics. Four classes are identified: vegetation, building, roads, and waterbodies by using maximum likelihood supervised classification. Built-up mapping is performed by using two different methods: binary thresholding and sample-based feature extraction. To assess the accuracy of the classified maps, we used 2000 ground polygons manually digitized on GoogleEarth®. Built-up class should involve residential, industrial, transport networks, and other urban infrastructures (Estoque and Murayama, 2015).
We calculate the overall accuracy that determines the percentage of accurately classified elements and kappa value reveals the possibility of mapping relevant evaluation (Congalton, 2004). Producer's accuracy is defined as the class similarity of a field observation point. The producer's, user's, and overall accuracy were determined.
The Urban Expansion at the Expense of Agricultural Land, Maritime Public Domain, and Hydraulic Public Domain
Since the unconscious urban expansion could increase the human pressure in hydraulic and costal, public areas, urbanization development within flood buffers should be examined (Palazón et al., 2018). According to the 25th article of (Code de l'aménagement du territoire, de l'urbanisme et de la construction en Tunisie, 2015), a distance of 15 m should be maintained from Hydraulic borders (HPD) to expand urban constructions. Turning to law imposed by the Coastal Protection and Planning Agency of Tunisia (APAL), the minimum buffer zone surrounding MPD should be 28 m. The urban expansion at the expense of agricultural lands is among the most threatened urbanization effects. As urban expansion was mapped, the built-up areas situated inside agricultural extents were calculated. Moreover, built-up areas located within the buffer zones of 15 m surrounding HPD and 28 m near MPD areas were estimated.
Analysis of Urban Expansion
Urban Indicators Expansion
To evaluate whether urban expansion was more likely in coastal areas, we used four quantified indicators relative the urban area extent.
- The average annual rate of change in the urban expansion (VT) defines yearly change of urban growth (Fan et al., 2017) (Equation 3).
where SB and SA represent the urban areas in two different dates, T is the study period.
- The annual average (AGP) points out the percent of impervious areas converted from other land cover types (Equation 4). It is the rate or amount of urban land expansion over a specific period (Güneralp et al., 2020).
where UEend and UEstart are, respectively, the urban areas at the end and beginning of the period.
- The annual expansion intensity index (B i, t +1) indicates non-built-up areas that have been endangered (Zhao-ling et al., 2007) (Equation 5).
where Ui, t + n, and U i, t are urban areas at spatial unit i at time t + n and t, Ti is the area of spatial unit i. The intensity of urban expansion might specify the strength of urban growth over a time period. The larger urban intensity is detected, the faster urbanization rates are faced.
Urban expansion intensity classification could qualify the speed of urban growth (Table 1).
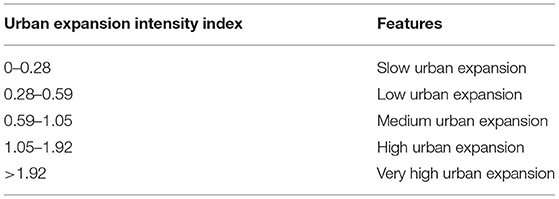
Table 1. Classification of urban expansion according to urban expansion intensity index.
Furthermore, the dynamic degree of urban expansion (K) is defined as the annual dynamic change of urban development on the basis of absolute volume (Fan et al., 2017) (Equation 6).
where Uib and Uia are urban areas at two time periods and T is time interval.
The dynamic degree of urban expansion is classified to describe the types of dynamic change (Table 2).
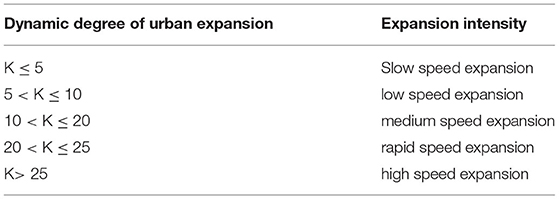
Table 2. Classification of urban expansion according to Dynamic degree of urban expansion.
Urban Structure
The excessive urbanization causes modification of urban landscape and might reduce spatial heterogeneity (Wu, 2012). Studying the distribution of urban patterns could reflect the intensity of human intervention and severity of land misuse. We used the FRAGSTAT software (Mc Garigal and Marks, 1995) compute landscape metrics for spatial distribution analysis by quantifying composition and configuration. The spatial metrics at landscape level can give overall information about landscape structure; however, class metrics study the pattern development of land cover classes at local scale (Estoque and Murayama, 2013). In this study, only the metrics at class level of built-up were examined because the maps illustrated the expansion of urban areas (Table 3).
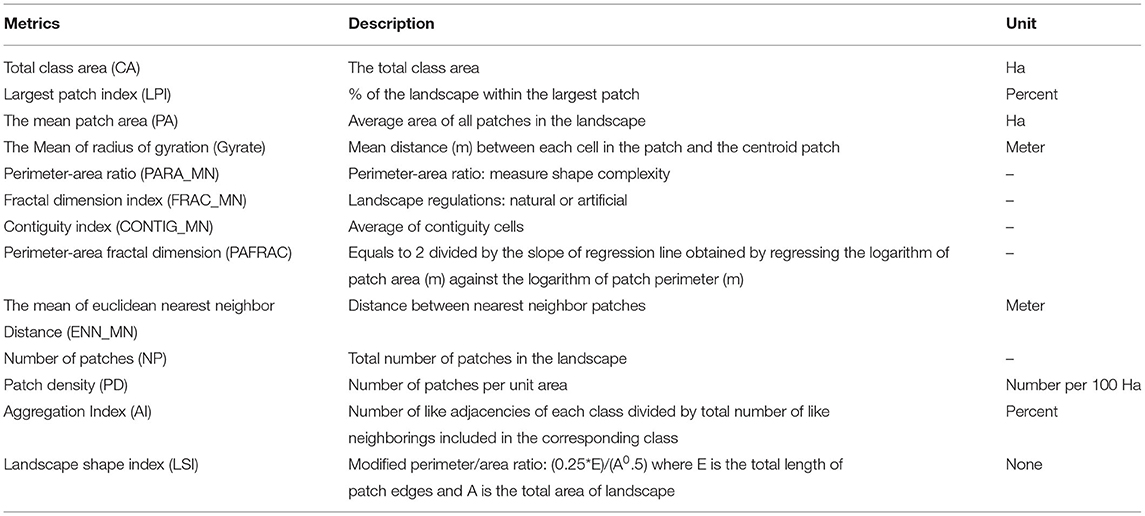
Table 3. Meanings and selection reasons of landscape metrics used in this study (Mc Garigal and Marks, 1995).
Metrics were classified based on their characteristics. In order to describe the area and edge, CA, LPI, and PA were selected. Gyrate was used to characterize the proximity of built-up class. Besides, the shape changes of urban areas were evaluated by PARA_MN, FRAC_MN, CONTIG_MN, and PAFRAC. In addition, the aggregation was assessed by ENN_MN, NP, PD, AI, and LSI. The diversity of landscape was examined by using the Patch Richness Density.
Results
Quantification of Urban Sprawl
Normalized difference vegetation index maps show that vegetation and soil have roughly similar range of values especially for 2016 Pleiades image (June). This might facilitate the detection of suitable Otsu threshold to separate built-up areas from other land cover. By masking vegetation and arable land, built-up areas were extracted. The obtained NDVI maps were reclassified to have only two classes: built-up and non-built-up areas (Figure 3).
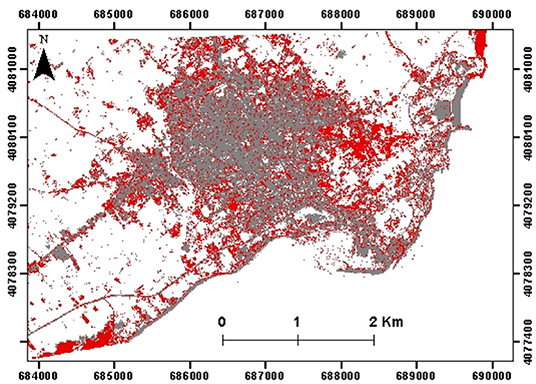
Figure 3. The urban change detection map of Otsu Threshold Segmentation method showing urban expansion of Kelibia city in 2016 (red) on the basis of the urban extent of 2012 (gray).
The Edge segmentation of PCA images allows delineation of buildings boundaries. Subsequently, the classification of spatial objects specified the urban extent (Figure 4).
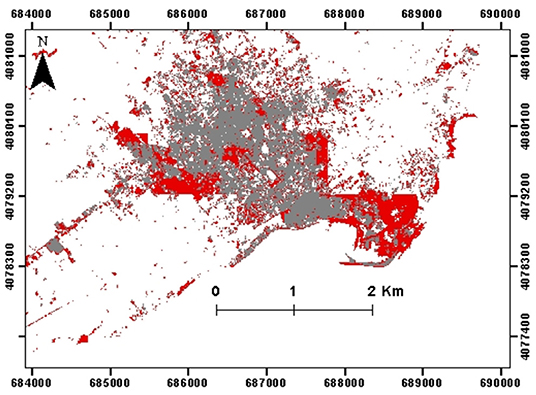
Figure 4. The urban change detection map of Edge segmentation method showing urban expansion of Kelibia city in 2016 (red) on the basis of the urban extent of 2012 (gray).
The results showed that both overall accuracy and kappa value parameters for Otsu threshold method are very high. Besides, the user's and producer's accuracies are >80% by applying the two techniques (Table 4). Because of low producer's accuracy, the misclassification of built-up class in segmented maps is observed.
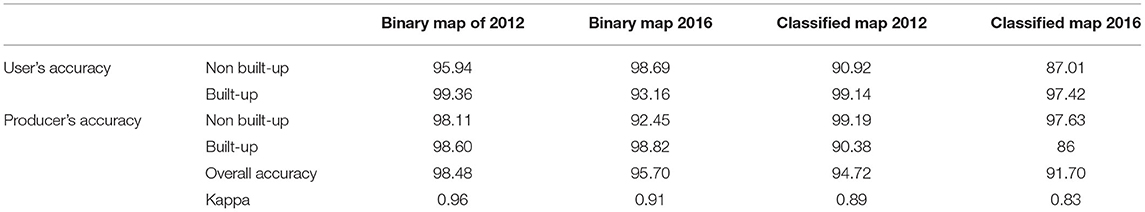
Table 4. Accuracy assessment of binary maps and classified maps.
The Kappa values and overall accuracy of binary maps produced by for Otsu threshold method are greater than the object-based classification results.
Many pixels are not classified or misclassified by using both classified methods because built-up features have specific textural characteristics and spatial properties such as compactness and contrast (Kong et al., 2006). The segmentation is not performed to extract road networks and the boundaries of urban constructions mixed with large green areas especially those are situated along the coastline. Moreover, many sparse vegetated lands that have similar shape to buildings are confused to built-up class. However, Otsu segmentation method focuses on the spectral response of spatial features, that's why binary-classified maps are more accurate. According to accuracy results, Otsu binary thresholding maps were considered.
Urban Expansion at the Expense of Agricultural Land, Maritime Public Domain, and Hydraulic Public Domain
In 2016, the urban area expanded by 65% from 2012. During this period, built-up areas over agriculture area are expanded by 400%. The same critical situation was observed within the buffer zones surrounding coastline and rivers. Indeed, the urban areas around hydraulic boundaries were doubled. The urban expansion near shoreline rose from 16 to 24 Ha during the period of study (Table 5).
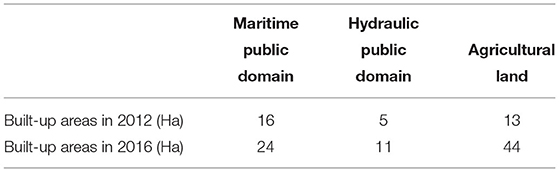
Table 5. Quantification of urban expansion at the expense of agricultural land, Maritime public domain and Hydraulic public domain.
Urban Indicators
The urban change rate is very significant over 4 years attaining 65%. The urban expansion intensity can quantify the speed of urban growth during the study period. It can be inferred the future direction of land cover changes. Note that the expansion intensity is higher than 1.92, denoting the highest speed of urban growth (Al-sharif et al., 2017). The dynamic degree specified the medium speed expansion over the whole period. The geometric percent of urban change reaching 13.34% aims to study the land cover conversion to urban area (Güneralp et al., 2020) (Table 6).
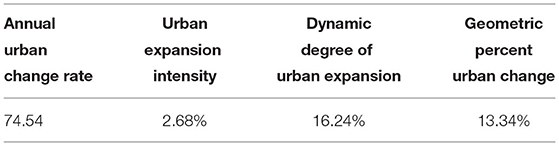
Table 6. Analysis methods for quantifying urban expansion over the period of 2012–2016.
The results illustrated that the total increase of urban areas during the selected period reached over 300 Ha (Table 7). The patch number and patch density reflect the high fragmentation degree during the period of study (Estoque and Murayama, 2013).
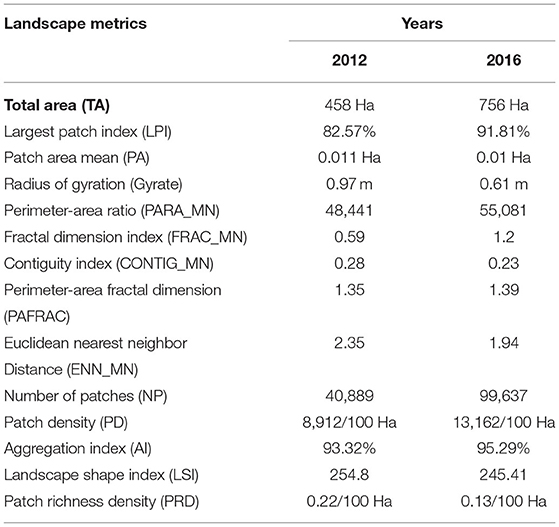
Table 7. Landscape metrics of urban areas in 2012 and 2016.
Results could be enhanced by NP increase of roughly 6,000 patches and PD increase of 4250.35 Ha from 2012 to 2016. LPI comes near to 100. The largest patch has increased. It means that the percentage of total landscape area included in largest patch has become higher.
Since PARA_MN increased sharply over 2012–2016, the shape complexity has reinforced. The slight rise of PAFRAC values informs that shape complexity of patch sizes has increased. As this index values reach roughly 1.4 and approaches to 2 than 1, the shape became highly convoluted. Additionally, the high LSI values specify the irregularity shape of built-up class because of the significant boost of total edge. Considering that the ranges of AI values are near 100, focal patches is clustered indicating high compactness of built-up class.
FRAC_MN confirmed the results of LSI. It was increased from 0.59 in 2012 to 1.2 in 2016 showing the shape irregularity and high exchange with neighboring areas (Tian et al., 2014). The decrease of Mean Patch Area during the 4 years highlights the transformation of other land cover types into artificial constructions. Since the diversity of patch types within landscape is reduced, patch richness within landscape is very limited. CONTIG_MN indicates the reduction of spatial connectivity of cells, showing the emergence and dispersion of urban expansion. Distance to neighboring patches (ENN_MN) (Zhou et al., 2011) and mean distance of all patches to the patch centroid (Gyrate) were reduced.
Discussions
Urban Sprawl Mapping
Since high spatial resolution facilitates the visualization of small-scale spatial elements in particular building (Fundisi and Musakwa, 2017), the urban sprawl of Kelibia city was mapped by using Pleiades images (Dupuy et al., 2020). By applying the two techniques: Otsu segmentation and feature extraction, the accuracy assessment indicated the proficiency of urban mapping. In this study, the results of binary thresholding are more accurate because the segmentation threshold was determined automatically from histogram (Kaganami and Beiji, 2009) whereas feature extraction method is based on defining edge segmentation threshold by users. Because of low spectral resolution of Pleiades data, it's difficult to define the suitable spectral indices for urban extraction as opposed to other satellite images that could delineate impervious areas by using multiple urban spectral indices (Estoque and Murayama, 2015). For this reason, the spectral index NDVI is used for eliminating the vegetated areas and bare land to quantify the urban expansion in the two different dates.
Urban Expansion at Expense of Public Zones
As can be seen from results, a sharp increase of building constructions was detected at the expense of arable land, MPD, and HPD areas. A similar view was noted by Palazón et al. (2018) that denoted human concession of coastlines. The problem is that planning design and urbanization norms should be reviewed, in particular the buffer zone surrounding the public domains. Buffering guidelines was dependent on the hydrological behavior and river structure (Macfarlane, 2014). In this context, Silva et al. (2006) clearly pointed out that studying the typology of water contact with city could be more efficient so as to diminish damage exposure. Another study claimed that adjusting urban design to flooding adaptation might be a systematic strategy (Mendez, 2014). Apart from, the agricultural land confronts emergence of urban constructions, which can be considered as serious issues in many countries (El Garouani et al., 2017).
Urban Fragmentation Indicators
A study by Al-Sharif et al. (2014) specified that the efficiency of urban expansion intensity could certainly study the urban development at larger temporal scale. The results of study period should be compared to expansion intensities during other time periods. Studying yearly trends of annual urban change rate in separated periods could give more importance to the examination of urban development. The urban expansion intensity indicated that Kelibia city faced a dramatic urban booming as opposed to urban development in other cities that increased by <1 (Fan et al., 2017).
The main purpose of using landscape metrics is landscape pattern analysis. By using spatial metrics, advantage and limitations were perceived. The area metrics are dependent on image resolution; the greater the spatial resolution of raster images was presented, the more important details could be recognized (Mc Garigal and Marks, 1995). In this study, the higher resolution of Pleiades image helps to quantify urban areas. Additionally, area is related to gain and extent of raster image. PAFRAC could be significant only if the linearity of log–log relationship between perimeter and area of patch ranges is presented. The implantation of this index should be avoided when the number of patches is very small (<10) and it's recommended to use this index with high size variability. In our case, the number of spatial units is very high. The limitations of NP consist of absence of information about area, pattern, and density. PD is associated with gain size and cell resolution of raster images.
The results indicated high fragmentation, compactness, and urban expanding. Housing demand and consideration of housing as a private sector could be taken into account as urban expansion simulators in several historical time periods (Stambouli, 1996). As population has magnified, societal demand of dwelling has augmented. Additionally, housing became a source of investment and residential property leading to emergence of urbanization movement (Weber and Puissant, 2003). Yet, Tunisia faced political transformations named Arab Spring in 2011. The main state objective was to provide essentially the security to population, that's why social and economic situations were aggravated (Zemni, 2017). The capacity of Tunisian state to control law enforcement has been disappeared gradually. Indeed, rules of urbanization and norms governing weren't respected by inhabitants due to lack of awareness (Stadnicki et al., 2014). The physical appearance of urban development has been changed creating opportunities for investing in urban stocks under conditions of state failure. According to the National Institute of statistics, the analysis of urban growth could be referred to social and economic development and political events. The socio-economic data of 2016 illustrated improvement of economic situation compared to that of 2012. In fact, the gross domestic product was enhanced; joblessness and percentage of poverty were reduced over years. The progress in multiple fields in particular tourism was originated from the stability of political situation after the national elections of 2014 (Cilliers et al., 2020).
Conclusion
The study investigated the use of Pleiades imagery in urban extend of Kelibia city over the period of 2012–2016. We used two approaches to classify urban area extension Otsu segmentation and Edge segmentation.
The Otsu thresholding algorithm is used to segment the roads and residential areas from the vegetation areas in remote sensing images. Thresholding maps were considered to calculated the urban development at the expense of arable land, MPD, and HPD.
The results revealed a dramatic increase during the period of study. The urban indicators quantified and described the differences of urban growth characteristics in two period of time 2012 and 2016. In fact, annual urban change rate, urban expansion intensity, dynamic degree of urban expansion, and geometric percent urban change quantified the increase of urban sprawl in Kelibia city. The FRAGSTAT metrics depicted area, shape, proximity, aggregation, and diversity of urban areas in 2012 and 2016. This significant urban development originated from political transformation in 2011 that simulated urbanization activities.
The results of this study describe only a snapshot at a specific time. Repeating the calculations at regular intervals in the future will allow any differences between urban sprawl in land and coastal area to be monitored as coastal and agricultural city to evolve. It will also allow the impact of planning policies, such as the Touristic Intensification Zones in coastal area, to be monitored in the context of promoting.
Data Availability Statement
The original contributions presented in the study are included in the article/supplementary material, further inquiries can be directed to the corresponding author/s.
Author Contributions
All authors listed have made a substantial, direct, and intellectual contribution to the work, and approved it for publication.
Conflict of Interest
The authors declare that the research was conducted in the absence of any commercial or financial relationships that could be construed as a potential conflict of interest.
Publisher's Note
All claims expressed in this article are solely those of the authors and do not necessarily represent those of their affiliated organizations, or those of the publisher, the editors and the reviewers. Any product that may be evaluated in this article, or claim that may be made by its manufacturer, is not guaranteed or endorsed by the publisher.
References
Abiodun, O. E., Olaleye, J. B., Olusina, J. O., and Omogunloye, O. G. (2017). Principal component analysis of urban expansion drivers in Greater Lagos, Nigeria. Nigerian J. Environ. Sci. Technol. 1, 156–168. doi: 10.36263/nijest.2017.01.0013
Al-sharif, A. A. A., Pradhan, B., and Abdullahi, S. (2017). “Urban sprawl assessment,” in Spatial Modeling and Assessment of Urban Form: Analysis of Urban Growth: From Sprawl to Compact Using Geospatial Data, ed B. Pradhan (Cham: Springer), 61–92.
Belhedi, A. (1993). L'urbanisation en Tunisie. Croissance urbaine, structuration hiérarchique et contenu fonctionnel. Rev. Tunis. Sci. Soc. 112, 11–50.
BenSaid, F. (2014). Tunisian coastal cities attractiveness and amenities Tunisian coastal cities attractiveness and amenities. Munich Personal RePEc Archive Paper No. 52961. Available online at: https://mpra.ub.uni-muenchen.de/52961/ (accessed January 23, 2022).
Bhandari, A. K., Kumar, A., and Singh, G. K. (2012). Feature extraction using Normalized Difference Vegetation Index (NDVI): a case study of Jabalpur City. Proc. Technol. 6, 612–621. doi: 10.1016/j.protcy.2012.10.074
Catalán, B., Saurí, D., and Serra, P. (2008). Urban sprawl in the Mediterranean?: Patterns of growth and change in the Barcelona metropolitan region 1993–2000. Landsc. Urban Plan. 85, 174–184. doi: 10.1016/j.landurbplan.2007.11.004
Cilliers, J., Welborn, L., and Kwasi, S. (2020). The rebirth Tunisia's potential development pathways to 2040. ISS North Africa Rep. 2020, 1–36. doi: 10.3389/frsc.2020.00043
Code de l'aménagement du territoire de l'urbanisme et de la construction en Tunisie. (2015). p. 78. doi: 10.10520/EJC-1fdf46fe06
Congalton, R. G. (2004). “Putting the map back in map accuracy assessment,” in Remote Sensing and GIS Accuracy Assessment, eds R. S. Lunetta and J. G. Lyon (Boca Raton, FL: CRC Press), 1–11.
Du, Z. Q., Li, W. B., Zhou, D. B., Tian, L. Q., Ling, F., Wang, H. L., et al. (2014). Analysis of Landsat-8 OLI imagery for land surface water mapping. Remote Sens. Lett. 5, 672–681. doi: 10.1080/2150704X.2014.960606
Dupuy, S., Defrise, L., Lebourgeois, V., Gaetano, R., Burnod, P., and Tonneau, J. P. (2020). Analyzing urban agriculture's contribution to a southern city's resilience through land cover mapping: the case of Antananarivo, capital of Madagasca. Remote Sens. 12:1962. doi: 10.3390/rs12121962
El Garouani, A., Mulla, D. J., Garouani, S. E., and Knight, J. (2017). Analysis of urban growth and sprawl from remote sensing data: case of Fez, Morocco. Int. J. Sustain. Built Environ. 6, 160–169. doi: 10.1016/j.ijsbe.2017.02.003
Estoque, R. C., and Murayama, Y. (2013). Landscape pattern and ecosystem service value changes: implications for environmental sustainability planning for the rapidly urbanizing summer capital of the Philippines. Landscape Urban Plann. 116, 60–72. doi: 10.1016/j.landurbplan.2013.04.008
Estoque, R. C., and Murayama, Y. (2015). Classification and change detection of built-up lands from Landsat-7 ETM+ and Landsat-8 OLI/TIRS imageries: a comparative assessment of various spectral indices. Ecol. Indicators. 56, 205–217. doi: 10.1016/j.ecolind.2015.03.037
Fan, Y., Zhu, X., He, Z., Zhang, S., Gao, J, Chen, F., et al. (2017). Urban expansion assessment in Huaihe river Basin, China, from 1998 to 2013 using remote sensing data. Land 2017:9281201. doi: 10.1155/2017/9281201
Fundisi, E., and Musakwa, W. (2017). Built-up area and land cover extraction using high resolution Pleiades Satellite Imagery for Midrand, in Gauteng Province, South Africa. Int. Arch. Photogramm. Remote Sens. Spatial Inform. Sci. ISPRS Arch. 42, 1151–1156. doi: 10.5194/isprs-archives-XLII-2-W7-1151-2017
Güneralp, B., Reba, M., Hales, B., Wentz, E., and Seto, K. (2020). Trends in urban land expansion, density, and land transitions from 1970 to 2010: a global synthesis. Environ. Res. Lett. IOP Publishing. 15:044015. doi: 10.1088/1748-9326/ab6669
Kaganami, H. G., and Beiji, Z. (2009). “Region-based segmentation versus edge detection,” in IIH-MSP 2009 - 2009 5th International Conference on Intelligent Information Hiding and Multimedia Signal Processing, 1217–1221.
Kahloun, H. (2011). Réaménagement portuaire et reconquête des jointures urbaines : regard sur le port de Kélibia (Tunisie) = Port Regeneration and Reclaiming the Urban Junctures'. Portus (où trouver cette revue?) 2011, no 21.
Kavzoglu, T., and Tonbul, H. (2017). “A comparative study of segmentation quality for multi-resolution segmentation and watershed transform,” in Proceedings of 8th International Conference on Recent Advances in Space Technologies, RAST 2017, 113–117.
Kong, C., Xu, K., and Wu, C. (2006). Classification and extraction of urban land-use information from high-resolution image based on object multi-features. J. China Univ. Geosci. 17, 151–157. doi: 10.1016/S1002-0705(06)60021-6
Kuffer, M., Grippa, T., Persello, C., Taubenböck, H., Pfeffer, K., and Sliuzas, R. (2021). Mapping the morphology of urban deprivation - the role of remote sensing for developing a global slum repository. 305–323.
Lee, K., Kiu, K., Lee, S., and Kim, Y. (2020). Determination of the normalized difference vegetation index (NDVI) with top-of-canopy (TOC) reflectance from a KOMPSAT-3A image using orfeo tool box (OTB) extension. ISPRS Int. J. Geo Inform. 9:257. doi: 10.3390/ijgi9040257
Macfarlane, D. (2014). Preliminary Guideline for the Determination of Buffer Zones for Rivers, Wetlands and Estuaries. Final Consolidated Report. WRC Report No TT 610/14. Water Research Commission, Pretoria.
Mc Garigal, K., and Marks, B. J. (1995). FRAGSTATS: Spatial Pattern Analysis Program for Quantifying Landscape Structure. Gen. Tech. Rep. PNW-GTR-351. U.S. Department of Agriculture, Forest Service, Pacific Northwest Research Station, Portland, OR.
McFeeters, S. K. (1996). The use of the Normalized Difference Water Index (NDWI) in the delineation of open water features. Int. J. Remote Sens. 17, 1425–1432. doi: 10.1080/01431169608948714
Meddeb, S. (2014). Etude d'évaluation Socioéconomique des Activités Maritimes en Tunisie. GEF: Governance and Knowledge Generation Socio-economic Evaluation of Maritime Activities Project.
Mendez, N. L. (2014). Adaptation to urban floods by planning and design guidelines for an adaptive management to urban floods and storm water use taking as a case study the city of Bilbao [Master's thesis]. KTH Royal Insitutie of Technology, Stockholm, Sweden.
Palazón, A., López, I., Bañón, L, and Aragonés, L. (2018). Concessions within the maritime-terrestrial public domain on the beaches of southeastern Spain. Ocean Coastal Manag. 161, 156–164. doi: 10.1016/j.ocecoaman.2018.05.011
Petrişor, A.-I., Iano, S, Lurea, D., and Văidianu, M. N. (2012). Applications of principal component analysis integrated with GIS. Proc. Environ. Sci. 14, 247–256. doi: 10.1016/j.proenv.2012.03.024
Rouse, J. W., Haas, R. H., Schell, J. A., Deering, D. W., and Harlan, J. C. (1974). Monitoring the Vernal Advancement and Retrogradation, (Greenwave Effect) of Natural Vegetation. NASA/GSFC Type III Final Report, Greenbelt, MD.
Samsudin, S. H., Shafri, H. Z. M., and Hamedianfar, A. (2016). Development of spectral indices for roofing material condition status detection using field spectroscopy and WorldView-3 data. J. Appl. Remote Sens. 10:025021. doi: 10.1117/1.JRS.10.025021
Schwarz, N. (2010). Urban form revisited-Selecting indicators for characterising European cities. Landsc. Urban Plan. 96, 29–47. doi: 10.1016/j.landurbplan.2010.01.007
Shirazi, M., and Falahat, S. (2012). Compact urban form, question or solution? Examining the compact city in the Middle Eastern context: challenges and opportunities. Int. J. Urban Sustain. Dev. 4, 246–259. doi: 10.1080/19463138.2012.694817
Silva, J. B., Serdoura, F., and Pinto, P. (2006). “Urban rivers as factors of urban (dis)integration,” in 42nd ISOCARP Congress, 14–18.
Stadnicki, R., Vignal, L., and Barthel, P. A. (2014). Assessing urban development after the “Arab Spring”: illusions, evidence of change. Built Environ. 40, 5–13. doi: 10.2148/benv.40.1.5
Stambouli, F. (1996). Tunis city in transition. Environ. Urban. 8, 51–65. doi: 10.1177/095624789600800117
Tian, Y., Jim, C. Y., and Wang, H. (2014). Assessing the landscape and ecological quality of urban green spaces in a compact city. Landsc. Urban Plann. 121, 97–108. doi: 10.1016/j.landurbplan.2013.10.001
Weber, C., and Puissant, A. (2003). Urbanization pressure and modeling of urban growth: example of the Tunis Metropolitan Area. Remote Sens. Environ. 86, 341–352. doi: 10.1016/S0034-4257(03)00077-4
Weslati (2010). Plages et urbanisation en Tunisie: des avatars de l'expérience du xxe siècle aux incertitudes de l'avenir. Rev Géogr Pays Méditerr. 35, 103–116. doi: 10.4000/mediterranee.4928
Wu, J. (2012). Landscape landscape ecology landscape ecology. Encycl. Sustain. Sci. Technol. 17, 5772–5785. doi: 10.1007/978-1-4419-0851-3_575
Zemni, S. (2017). The tunisian revolution: neoliberalism, urban contentious politics and the right to the city. Int. J. Urban Reg. Res. 41, 70–83. doi: 10.1111/1468-2427.12384
Zhao-ling, H. U., Pei-jun, D. U., and Da-zhi, G. U. O. (2007). Analysis of urban expansion and driving forces in Xuzhou city based on remote sensing. J. China Univ. Min. Technol. 17, 267–271. doi: 10.1016/S1006-1266(07)60086-8
Keywords: Pleiades, objected oriented approach, urban area, maritime hydraulic public, FRAGSTAT metrics
Citation: Kassouk Z, Hammami H and Ismail H (2022) Studying Sharp Changes of Urban Landscape: Concession Within Agricultural, Hydraulic, and Maritime Public Domain in Kelibia City, Northern Tunisia. Front. Sustain. Cities 4:900336. doi: 10.3389/frsc.2022.900336
Received: 20 March 2022; Accepted: 09 May 2022;
Published: 16 June 2022.
Edited by:
Mehdi Saqalli, UMR5602 Geographie de l'environnement (GEODE), FranceReviewed by:
Garth Myers, Trinity College, United StatesBachaer Ayed, National Engineering School of Sfax, Tunisia
Copyright © 2022 Kassouk, Hammami and Ismail. This is an open-access article distributed under the terms of the Creative Commons Attribution License (CC BY). The use, distribution or reproduction in other forums is permitted, provided the original author(s) and the copyright owner(s) are credited and that the original publication in this journal is cited, in accordance with accepted academic practice. No use, distribution or reproduction is permitted which does not comply with these terms.
*Correspondence: Zeineb Kassouk, emVpbmViLmthc3NvdWtAaW5hdC51LWNhcnRoYWdlLnRu
†These authors have contributed equally to this work and share first authorship