 Daniel A. Griffith

95% of researchers rate our articles as excellent or good
Learn more about the work of our research integrity team to safeguard the quality of each article we publish.
Find out more
ORIGINAL RESEARCH article
Front. Sustain. Cities , 23 May 2022
Sec. Urban Economics
Volume 4 - 2022 | https://doi.org/10.3389/frsc.2022.852090
This article is part of the Research Topic Urban Hierarchies in an Economic Transition To Sustainable Cities View all 5 articles
The sole well-recognized United States (US) urban hierarchy articulation essentially is outdated, even though selected recent work seeks to upgrade it. The primary goal of this paper is to update it in a definitive and comprehensive fashion. This paper describes the conceptual framework underlying such observed orderings, itemizes certain strengths and weaknesses of the existing articulation, and then posits a justifiable renovated US urban hierarchy. Next, recapped analyses expose both contiguity and urban hierarchy spatial autocorrelation components of the upper tiers of the 2020 US metropolitan area population rank size distribution. Noteworthy is that these descriptions entail positive-negative spatial autocorrelation mixtures. Inventoried output from the research efforts leading to this paper includes: a contemporary US urban hierarchy articulation that should prove serviceable for at least the next few decades; and, an apparatus providing a practical contribution for improving cultural, environmental, and social aspects of systems of cities through, for example, better cost containment and more efficient/effective delivery of urban public health services and utilization/consumption. The Earth's scientists need this category of tool to incorporate into methodology combating negative effects of globalization that materialize via spatial diffusion.
The spatial organization of subnational, national, and continental regions, as well as the entire globe, comprises local proximity relationships (e.g., spatial autocorrelation effects, promoting contiguity dependencies across geographic space) that interface with ordered finite sets of advantaged focal locations composing hierarchies, which promote leaps across geographic space via hierarchical autocorrelation dependencies. One such ordering dominating space economies pertains to urban hierarchies. Its treatment has a long and illustrious history, particularly with regard to the Christaller (1933) and Lösch (1940) urban economic conceptualizations falling under the heading of central place theory: the number, sizes, and spacings of cities constituting geographic networks of urban hierarchies in a geographic landscape. In other words, an articulation of an urban hierarchy for a system of cities. Yeates and Garner (1980, p. 68) furnish one of the earliest meaningful comprehensive urban hierarchy articulations, focusing on the United States (US) system of cities—it also integrates the Canadian urban system into an Anglo-American urban system. The foundation of their structure is work by, among others, Philbrick (1957) and Borchert (1967, 1972), who emphasize population, migration, transportation networks/flows, and commuting. Implicitly recognizing the rise and fall of such metropolitan areas as Buffalo (NY), Neal (2011) documents a revamping shift from population size to such functional geographic traits as transportation networks in determining the US urban hierarchy during the last century. Population density and commuting flows play an important role in uncovering urban hierarchies because the formulation of almost all operational urban area definitions include them. Furthermore, Phillips (1974) and Hansen (1975), among others, in combination emphasize the importance of journey-to-activities—e.g., work, shop, and recreate—when articulating an urban hierarchy. This is the vital background literature supplying a foundation for those variables considered in this paper as its narrative addresses its objective of updating the seminal Yeates-Garner US urban hierarchy. Clearly, numerous alternative hierarchy articulations are possible, given the subjective nature of its construction process, implying a need to more thoroughly study this topic.
Spatially autocorrelated data are one of several general classes of correlated data treated in statistics (Griffith, 2020). It is a fundamental property of geospatial data (e.g., Tobler's first law of geography), arising from similarities exhibited by nearby attribute values in geographic space attributable to the presence of an underlying common factor and/or spatial interaction among locations; in order words, regional collections of georeferenced data consistently lack exclusively random mixing.
Numerous publications attempt to explicate this spatial autocorrelation concept, with major efforts to do so inaugurated by Cliff and Ord (1973). Getis (2008) and Griffith (2012) furnish some history about it. Among others, Griffith (1987, 1992a, 2009, 2017, 2019) provides various more detailed descriptions and explanations of it in the context of quantitative geography, whereas Legendre (1993) and Sokal et al. (1998), for example, do so for it in the context of ecology, and Paelinck (2013) and Anselin and Li (2020), among others, elucidate it in the context of regional science/economics. Decades passed between its verbal awareness emergence, and then its conceptualization, and finally its quantification (Chun and Griffith, 2017). The Moran Coefficient (MC; Moran, 1950) is an extremely popular index used for this latter purpose, and forms the basis of the Moran eigenvector spatial filtering (MESF) methodology employed in this paper. Its formula may be written as follows, for some georeferenced random variable Y:
where n is the sample size (i.e., number of areal units/locations), Y is an n-by-1 vector of attribute values, yi, is the mean attribute value, superscript T denotes the matrix transpose operation, 1 is an n-by one vector of ones, I is an n-by-n identity matrix, C is an n-by-n spatial weights matrix with cell entry cij and comprising n n-by-1 binary 0–1 indicator variables in its simplest version: for convenience, the row and column headings are the same ordered sequence of areal units, a cell entry contains 1 if a row and a column areal unit are, and 0 if they are not, adjacent; thus, by construction, the diagonal of a spatial weights matrix contains only zeroes. In other words, each column indicator variable for matrix C indicates which row label areal units are neighbors of its column labeling areal unit, producing a matrix quantifying how an arrangement of areal units is tied together in geographic space. More sophisticated versions of this matrix contain inter-areal unit distances, or some other separation metric, in their cells. The values of MC range between rescaled extreme eigenvalues of its numerator matrix, (I−11T/n)C(I−11T/n), with its near-midpoint value of −1/(n−1) implying zero spatial autocorrelation, and are directly proportional to the nature and degree of the measured spatial autocorrelation gauged by an eigenvalue. Substantive critical values for |MCj/MCextreme| are ±0.25 for weak, ±0.70 for moderate, and ±0.95 for strong spatial autocorrelation. Most geospatial phenomena display moderate-to-strong positive spatial autocorrelation. Subsequent discussion supplies additional explication of this concept, which is an imperative construct for this paper.
MESF (see Griffith and Chun, 2021) builds upon the numerator matrix in equation (1), namely (I−11T/n)C(I−11T/n). Because this matrix is symmetric, its n eigenvectors are mutually orthogonal. Because it is doubly centered, a feature achieved by pre- and post-multiplying it by the multivariate statistics projection matrix (I−11T/n), its eigenvectors have zero mean, and hence all but the first one, which is proportional to the vector 1, are mutually uncorrelated. Each eigenvalue, λj, gauges the nature and degree of spatial autocorrelation latent in its corresponding eigenvector, Ej; its MC is (Tiefelsdorf and Boots, 1995). Each eigenvector has n elements, one for each location on a map, that form a map pattern exhibiting clusters of similar values (Griffith, 2021) in accordance with its latent spatial autocorrelation (Griffith, 1996). Moreover, this approach creates n synthetic variables from the way locations tie together with a spatial weights matrix, and uses them to filter spatial autocorrelation from regression residuals and then transfer it to a mean response in exactly the same way any regression covariates contribute to a non-constant mean. Subsequent discussion supplies additional explication of this methodology, which also is an imperative construct for this paper.
Griffith (2020) reviews the general categories of correlated data, from paired observations and repeated measures, through time series, spatial series, and more recently social network series. A weights matrix—analogous to the spatial weights matrix of spatial autocorrelation—densification accompanies this progression. Each of these groupings collaborates with mechanisms that induce correlation in individual observations. The preceding discussion identifies the following two generic sources for spatial series: common factors across a geographic landscape, and spatial interaction amongst locations. Their outcome is geographic areal unit synchronization and/or competition; the former mechanisms generate positive, whereas the latter generate negative, spatial autocorrelation. Contagion spatial autocorrelation arises from local spatial interaction (e.g., diffusion of diseases, and contending for market areas) and/or common factors channeling commonalities (e.g., soil types, house pricing). This is the focal spatial autocorrelation category addressed in most spatial statistical analyses. An additional mechanism parallels seasonal effects in times series analyses in certain ways, and involves a hierarchical pyramid structuring of areal units based upon some yardstick of privilege. One result is a bypassing of intervening geographic space separating certain correlated points of privilege because of their hierarchical statuses. Accordingly, spatial autocorrelation effects can jump or leap from place to place across a geographic landscape. Regional/national urban systems constitute hierarchies serving this role, and as such are an added spatial autocorrelation focal point of this paper.
The spatial weights matrices advanced in the preceding section take two distinct forms within this framework, one capturing contiguity and the other capturing hierarchy spatial correlation. Both may be defined in their simplest forms by the aforementioned 0–1 indicator variables. The contiguity matrix builds upon a mutually exclusive and collectively exhaustive surface partitioning, and contains a one when two areal unit polygons on this surface share a common boundary. This paper employs the rook definition of adjacency, requiring non-zero length shared boundaries (i.e., more than just a single point of contact). The hierarchy matrix buildings upon the prevailing urban system, and contains a one when a direct hierarchy link exists between two areal unit polygons. Some overlap exists between these two formulations because those areal units contiguous to a point of privilege areal unit are both its physical vicinity and its hierarchy proximity neighbors. Subsequent discussion, especially in Planar Contiguity Spatial Autocorrelation, adds to this description.
Sustainable urban spatial economics investigates safeguard reasons for economic activity concentration in and dispersion across interdependent networks of cities by emphasizing the roles of both spatial autocorrelation—contiguity as well as hierarchy based—and transport related distance factors—distance decay generated impedance as well as scale economies through intermediate goods/services production agglomeration—focusing on density and dispersal tendencies arising from this former geospatial data property and constrained by these latter friction of distance mechanisms. Expressly reigning national urban hierarchies are integral for maintaining sustainable cities into the future: better understanding their national/regional space economy roles tends to facilitate reductions in urban environmental damage and eradication of poor quality of urban life situations. As mentioned in the preceding introduction, and highlighted here by contagion and hierarchy spatial autocorrelation operators, population density tends to be a critical ingredient when defining metropolitan areas and urban systems. It arguably is one of the most commonly used covariates in social and behavioral science research, mirroring its prominence in definitions of what is urban. Either of its extremes (i.e., sparsity and over-crowding) compromises the sustainability of urban spatial economic landscapes.
The emergence of new, coupled with shifts among old and between new and old, population density geographic clusters partly drives the dynamics of an urban system, a transformation at least partially adhering to a rank-size rule describing urban population distribution, whose simplest specification may be stated as follows: a regional settlement size regularity given by the rth descending order ranked settlement (r = 1, 2, …, n) equaling r−γ times the population of the largest settlement, γ > 0 and ideally equal to 1 (Fonseca, 1988). Illustrating this urban system evolution, in the late 1700s, US eastern coast land near protected and deep bays as well as inland riverbanks furnished considerable locational privilege, sustaining and stimulating the growth of Philadelphia (PA), which dropped in rank from the largest to the 7th largest metropolitan area by 2020 as its relative locational advantages faded, Baltimore (MD), which increased from the 5th to the 3rd largest before plummeting to 20th place by—while being melded with the Washington, DC, metropolitan area long before−2020, Boston (MA), which began by being ranked 3rd but eventually declined to 10th place, and New York City (NY), counterexample to these trends, which displaced Philadelphia, eventually to become, and continue to be, the top ranked metropolitan region for more than two centuries. Other cities, such as Providence (RI), and Albany (NY), disappeared from the top 20 largest US cities group by the end of the 1800s, a century during which expanding railroad infrastructure engendered new settlements. Other cities, such as Chicago (IL), and San Francisco (CA), were established in the 1800s, and went on to become some of the largest US cities prior to and through 2020. Still others, such as Detroit (MI), and Pittsburgh (PA), after achieving top five rankings, precipitously declined, whereas Dallas and Houston (TX) emerged in the mid-1900s and continue to grow in the twenty-first century. Pittsburgh suffered the loss of steel manufacturing, removing much of its relative positional privilege as a near-optimal Weberian location point, motivating many corporate headquarters to abandon it. Although the rail network and other transshipment locational privileges fostered early Chicago and Buffalo growth, the US inter-state highway network expansion, much like its preceding century's railway grid's, severely eroded especially Buffalo's comparative advantages. Paralleling eastern coast privilege, ultimately western coast privilege, again arising from land alongside protected and deep bays as well as inland riverbanks, served as a growth generator for San Francisco, Los Angeles (CA), San Diego (CA), and Seattle (WA), among other cities. Part of the space-time dynamics described here (Madden, 1956, Figure 1, p. 239; Bettencourt and Zünd, 2020; Hackmann and Klarl, 2020) underscores that urban hierarchies tend to be in a constant state of fluxion. This feature combined with the lack of a consistent, long-standing precise definition for the conception of a US metropolitan area, an idea whose brainchild appeared in 1930 but it itself did not formally appear until around 1950 (Morrill, 2010, p. 1886), reinforces the notion that urban hierarchy construction is highly subjective in nature. The hierarchical structure presented in this paper is one of many possibilities, although a sizeable portion of its skeleton already enjoys universal acceptance. Nonetheless, its building edifice exploits social science principles to add more objective details to it. Furthermore, its demonstrated empirical utility through spatial autocorrelation analysis authenticates its consensus appeal.
A geographic system encompasses spatially separated prominent/privileged locations, spatial interaction among these locations, and physical connections between these locations that channel this spatial interaction. An accompanying urban hierarchy is a rank ordering of these locations by their prominence/privilege in terms of size plus functions (often military and/or administrative in ancient times, sometimes transshipment points in both time periods, and more economic today), organizable as a tree-like pyramidal structure, that insinuates reciprocal concurrences of their pairwise relationships mirrored in their spatial interactions and direct connection channels, establishing their ongoing complementarity, composition, support, collaboration, and nested dominance (Theo, 2010; Warf, 2010). Being an essential of human urbanization, the existence of urban hierarchies dates back millennia, characterizing early Mesopotamian, Indian, Chinese, Mediterranean, and Mesoamerican city systems (Erdosy, 1995; Clark, 2013). With western civilization emerging, the extent of the Roman Empire eventually embraced at least 1,388 identified urban sites, with an urban hierarchy headed by Rome (e.g., all roads lead to Rome). Studies focusing on this urban set address individual cities, groups of cities, and the entire settlement pattern of the Roman world (Hanson, 2017). With reference to pre-modern/medieval urban Europe, González et al. (2021) acknowledge the existence of urban hierarchies during that era, devoting the first part of their book to papers about Christaller (1933) and Lösch (1940) central place theory mentioned in the preceding introduction, which formalizes the conceptualization of an urban hierarchy in a spatial economic landscape, which at that time focused on inter-city trade. They also cast urban hierarchies within the context of political administration, a topic also explicitly considered by Christaller. In this same time period, China appears to have had urban sites numbering only in the 100s, with an urban hierarchy committed to political administration (Xu et al., 2018). Meanwhile, a functional typology of towns in India during this same time period appears to reflect that country's present-day urban hierarchy (Thakur, 1994).
The contemporary shift to central place theory conceptualizations refocuses many urban hierarchy articulations on economic functions, especially trade/retail and transportation ones. However, Krugman (1996), citing central place theory, evaluates the urban hierarchy construct coupled with the rank-size rule, concluding that an exponent of one, although consistently estimated (approximately) with decennial US urban system data, is plagued by mysterious properties (e.g., the underlying supporting population is infinite in size). Nevertheless, escorting this bridging of thinking into the modern world, Pooler (2000) argues that hierarchy is one of the most important concepts for furnishing an understanding of the real world. Within his general discussion, he stresses urban hierarchies, with special reference to, again, the provision of retail goods/services (i.e., central place theory), mental maps, migration (re spatial interaction), and quality of life (re sustainability). Echoing his sentiments, on the pages of a book about the general meaning of the word hierarchy, Pumain (2005) notes that quantifying urban places by their population size and functions was first suggested in only 1588, that most of the urban hierarchy literature examines national territories because their city systems are easiest to demarcate and make sense of (e.g., a consistent definition of a metropolitan area by some national government agency), and that central place theory furnishes a useful urban hierarchy conceptual framework. In addition, her dialogue about diffusion processes being hierarchical in nature, and as such generating jumps through space, particularly between distant large cities, supports the importance of the theme of this paper, namely periodically updating (with lucid, convincing justifications) empirical urban hierarchy articulations.
Transcending regional and national borders, and recognizing existing anecdotal and scholarly evidence attesting to urban hierarchy impacts upon the diffusion of disease, this section concludes by summarizing two world urban hierarchies. Verma et al. (2014) posit a three-tier hierarchy [core (n = 73), bridge, and periphery level locations] based upon the world network of airports, a perspective endorsed by Hall (2005); airline routes are unambiguous jumps through space. Of relevance here is their US cities hierarchical classification, which corroborates Miami's (FL) Level 1 position in Table 1, but raises questions about St. Louis (MO) being in Level 4/5. A weakness of airline traffic based taxonomies is the presence of historical inertia in an urban system that cultivates preservation while hampering change. Meanwhile, Díez-Pisonero et al. (2020) formulate the top five tiers of a world urban hierarchy containing 389 cities. Their pie chart type infographic inspired presentation portrays concentric circles for levels, and sectors for parts of the world (i.e., Asia, Europe, Latin America, North Africa and the Middle East, North America, Oceania, and Sub-Sahara Africa). Of relevance here is their US cities hierarchical classification based upon three categories of urban functions, tabulated as a bespoke reproduction in Table 1.
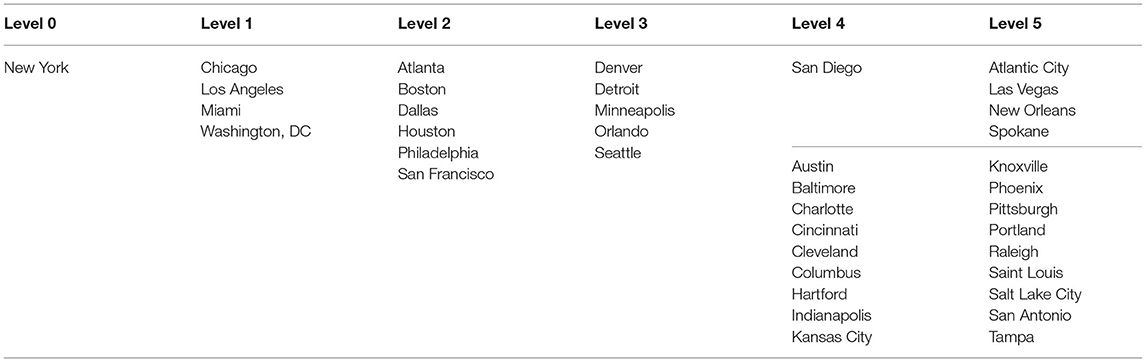
Table 1. Adapted from Figure 1 in Díez-Pisonero et al. (2020, p. 7).
In summary, urban hierarchies began a lengthy tacit extant. On the one hand, the word hierarchy did not appear until the 1300s, with its first recorded current meaning (i.e., ranked organization of items) appearing in the 1610s (https://www.etymonline.com/). On the other hand, the word urban did not appear until the early Seventeen century, and rarely was used before the 1830s (https://www.etymonline.com/). In terms of etymology, according to both a JSTOR1 search and his own claim, Smailes (1944) published the first juxtaposition of the words urban and hierarchy, in that order. In contrast, Christaller (1933) and Lösch (1940) explicate the exact same idea but employing different terminology: Christaller writes about L- or P-systems, whereas Lösch utilizes labels that include the words system and network. The indispensable concept of urban hierarchy took thousands of years to become formalized and verbalized, now offering new insights into space-time reality. Today spatial autocorrelation is expressible not only with regard to geographic contiguity dependencies, but also with regard to hierarchical geographic dependencies, although spatial scientists and practitioners often overlook/disregard this latter perspective. Therefore, spatial scientists routinely need to contemplate two different spatial weights matrices, one for each of these two distinct geographic structures. Griffith and Li (2021) demonstrate the importance of this transformative form of spatial analysis in their assessment of the geographic diffusion of COVID-19 across the US and across China. A fundamental difference between their work and that presented in this paper is that they had to translate their modernized top tier urban hierarchies into provincial/state, rather than city, hierarchies in order to match data release formats.
The ensuing subject matter amalgamates elements derived by design, retrieved from the historical record, and gleaned from existing applied literature.
Yeates and Garner (1980, p. 68) portray the US urban hierarchy based upon 1970 decennial census data (Figure 1). Griffith (1986, 1992b) adopted their articulation specifically to study the noncontiguous diffusion component of urban consumers' inflation as measured by the US consumer price index (CPI). Table 2 reports the top twenty metropolitan areas, by population, according to the 1970 and 2020 decennial census counts, reflecting the US urban system dynamics exemplified in Urban Hierarchies and Sustainable Cities. It also documents such ranking declines as Boston, Detroit, Philadelphia, and Pittsburgh, as well as such ranking ascensions as Dallas and Houston. The marginal 2010 metropolitan areas are St. Louis (departing the top 20 class), and Riverside (CA; entering the top 20 class). Cleveland (OH), Milwaukee (WI), and Pittsburgh already departed from the top 20 two-to-four decades ago.

Figure 1. The 84 metropolitan areas constituting the 1970 US urban hierarchy (after Yeates and Garner, 1980, p. 68).
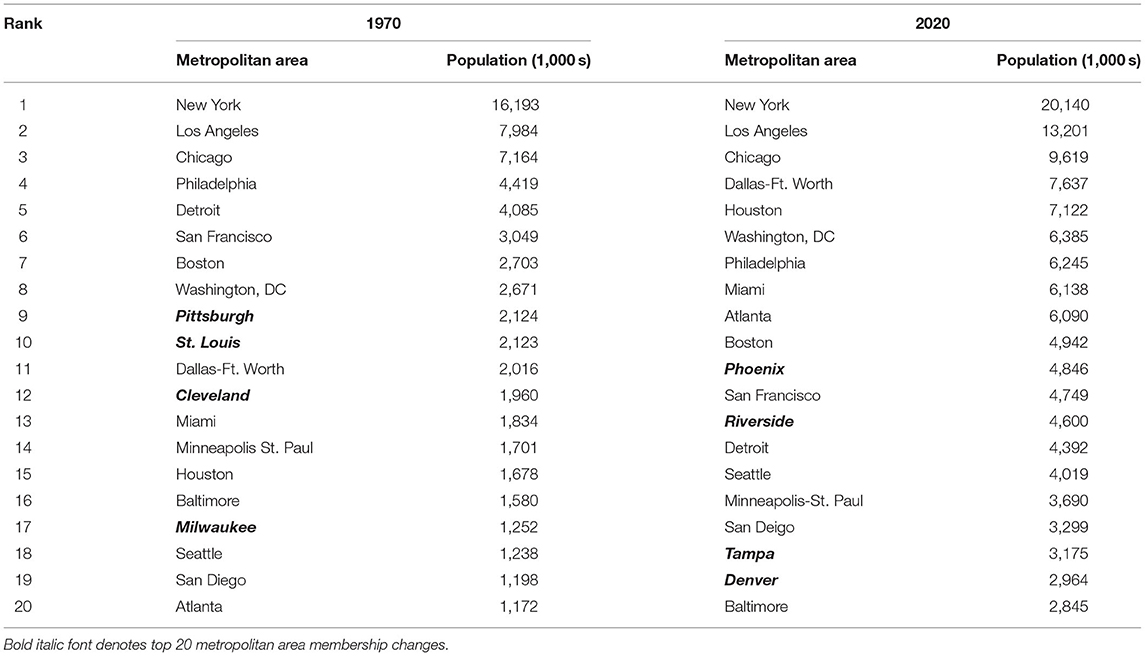
Table 2. The top 20 ranked US metropolitan areas in 1970 (Yeates and Garner, 1980) and 2020 (US Census Bureau, 2021).
Tables 1, 2 champion the removal of Detroit from, and the addition of Atlanta (GA), Dallas-Ft. Worth, and Miami, to, the prevailing 2nd hierarchy tier, updating the one appearing in Figure 1. Furthermore, after elevating New York City from Level 1 in Table 1, the combination of its Levels 1 and 2 become the members of this 2nd tier. These two tables advocate for Austin (TX), Charlotte (NC), Orland (FL), and Sacramento (CA), moving up, and Detroit dropping, one urban hierarchy level to Tier 3; Columbus (OH), Jacksonville (FL), Nashville (TN), Norfolk (VA), Providence, and San Antonio (TX), all show future promise for becoming members of the 3rd tier in the reconstituted tree structure. In keeping with this reorganization, Phoenix (AZ), moves up to the 3rd, and possibly even the 2nd, tier. Houston is a somewhat anomalous case like Phoenix, and arguable can remain assigned to the 3rd tier. Additional metropolitan areas meriting dropping a tier include Buffalo, Milwaukee, and New Orleans (LA; to 5/6). Because it continues to recover from Hurricane Katrina's catastrophic devastation, New Orleans at least temporarily remains in the 3th tier in this paper; presently, because of its pre-disaster status, its functional activities exceed its 2020 population rank, a situation that may well change in the future if this city fails to completely recover from its 2005 natural disaster experience. Fortunately, Griffith and Lagona (1998) show that spatial weights matrix analyses tend to be reasonably robust to a small number of misspecified linkages. Finally, Las Vegas (NV), and Riverside (in the Los Angeles branch), and San Jose (CA; in the San Francisco branch), are new entries in the schematic; Table 3 entries bolster these three contentions.
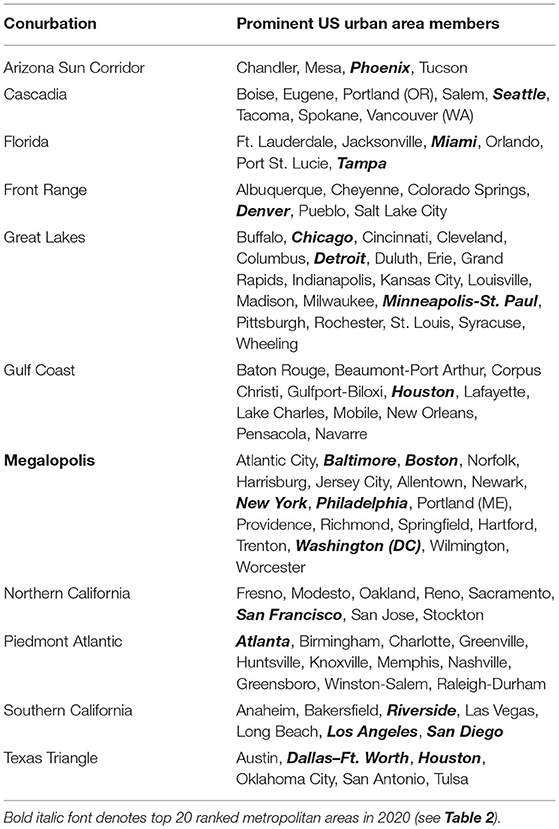
Table 3. Contemporary US conurbations (adapted from Hagler, 2009).
As Madden (1956, his Figure 1, p. 239) illustrates, the lower tiers of an urban hierarchy are the most volatile. The rise of Phoenix (Table 2) endorses this contention. Consequently, Tier 4/5 in Figure 1 exhibits substantial change with the elapsing of half a century. Top tier metropolitan areas now incorporate Newark (NJ; into New York City), Oakland (CA; into San Francisco), and Wilmington (DE; into Philadelphia). Metropolitan areas altogether leaving this tier include: Canton (OH), Charleston (WV), Chattanooga (TN), Harrisburg (PA), Madison (WI), Mobile (AL), Peoria (IL), Portland (ME), Scranton-Wilkes Barre (PA), Shreveport (LA), Spokane (WA), Syracuse (NY), Trenton (NJ), Utica (NY), Wichita (KS), and Youngstown (OH). The disappearance of Charleston and Youngstown from this tier is consistent with Pittsburgh recently disappearing from the top 20 largest metropolitan areas (Table 2). Besides the already mentioned three new Tier 3 entries (which compensate for the three absorbed Tier 4/5 urban places), replacing the remaining 16 of these lower tier metropolitan areas with the passing of time are: Baton Rouge (LA), Boise City (ID), Bridgeport (LA), Ft. Myers (FL), Colorado Springs (CO), Grand Rapids (MI), Greensboro (NC), Greenville (SC), Lakeland (FL), Little Rock (AR), McAllen (TX), Sarasota (FL), Oxnard (CA), Raleigh (NC), Stockton (CA), and Worcester (MA).
Gottmann (1957) proposes the emergence of a mega-urban area, which he named megalopolis, a conurbation materializing from the coalescing of nearby metropolitan areas. This geographic amalgamation constitutes the true meaning of a polycentric urban area (i.e., each member city is a subcenter of the whole metropolitan area that houses its own prominent point of privilege), with urban scholars at the time of Gottman apparently failing to appreciate that this conglomeration would be the first of eventually many inhabiting the US (Hagler, 2009) and elsewhere in the world (Ramos and Roca, 2015). Table 3 furnishes an overview of the 11 contemporaneous US conurbations. These metropolitan subsets render branches in the US urban hierarchy articulation, either reinforcing or modifying those appearing in Figure 1. A noteworthy feature of the taxonomy summarized in Table 3 is the already diagnosed more ambiguous status of both Phoenix and Houston. The former dominates a very small conurbation, whereas the latter spans two conurbations.
All preceding erudite sources agree that New York City is the single Tier 1 metropolitan area; it is the core of the original Megalopolis conurbation (Table 3). All preceding scholarly sources also agree that entries in Tier 2 include: Boston, Chicago, Los Angeles, Philadelphia, San Francisco, and Washington, DC. The more recent sources (i.e., Tables 2, 3) strongly advocate for inclusion of Atlanta, Dallas-Ft. Worth, and Miami, too. If nothing else, Phoenix and Houston are future member candidates for this tier; Phoenix conveys credible evidence for this shift, whereas Houston may not (e.g., Dallas-Ft. Worth is ascending, but New Orleans is descending in the US urban hierarchy, perhaps forfeiting its Gulf Coast conurbation dominance to Houston sometime in the future). In this paper, their assignments are to Tier 3, as is Detroit's (after suffering, for example, a rapid fall in ranking; Table 2). Las Vegas and Riverside are new additions to the upper urban hierarchy, shifting to Tier 3, whereas persisting contemporary 3rd tier metropolitan areas include: Baltimore, Cincinnati (OH), Cleveland, Denver (CO), Indianapolis (IN), Kansas City (KS/MO), Minneapolis-St. Paul (MN), Pittsburgh, Portland (OR), San Diego, Seattle, St. Louis, and Tampa (FL); Milwaukee drops from the 3rd to the 4/5 tier. Table 3 enumerated small conurbation magnitudes sanction these Denver, Minneapolis-St. Paul, and Seattle allocations; as the cores of distinct conurbations, both Denver and Seattle show future promise for eventually shifting to Tier 2, whereas Minneapolis-St. Paul more than likely will become more entrenched in the Great Lakes conurbation. This Great Lakes conurbation also raises another legitimate ambiguity: it classifies Rochester (NY) as one of its members, whereas Yeates and Garner (1980) classify Rochester as having a 4th tier direct link with New York City; here Rochester is retained with New York, but certainly has a strong potential of making a future switch to linking with Chicago instead. Meanwhile, recent additions to this tier from its immediate lower level include: Austin, Charlotte, Orlando, and Sacramento. Metropolitan areas constituting Tier 4/5, beyond the previously mentioned new entry of San Jose, include: Columbus, Jacksonville, Nashville, Norfolk, Providence, and San Antonio.
To conclude this section, the 84 newly identified 2020 metropolitan areas—which overlap to some degree with the 84 utilized earlier by Yeates and Garner (1980)—are some of the necessary ingredients for articulating an updated US urban hierarchy. One weakness of the older structure (Figure 1) is that it represents a purely nested structure. Christaller (1933), for example, drafts structures in which urban places at one level share those at lower levels, and are shared by those at higher levels (e.g., some proximate urban places enclosed by the Great Lakes and Megalopolis conurbations, such as Buffalo). The updated diagram also should embrace lateral linkages (e.g., Los Angeles and San Francisco, and Philadelphia and Washington, DC).
The following four dimensions, all inventoried in the preceding discussion, play a critical role in urban hierarchy articulation: population density (Figure 2A), spatial interaction (i.e., commuting and migration; Figures 2B–D), and transportation infrastructure (Griffith and Li, 2021; e.g., Figure 3A). Dobis et al. (2015) and Nelson and Rae (2016) furnish relatively up-to-date literature about these topics. Table 4 tabulates metropolitan area results based upon core population density as reflected by metropolitan agglomerated economic activities and built extents as well as human-made urban amenities and characteristics. Although much in this table agrees with the preceding discussion, a three-dimensional map of population density across the US (Figure 2A) furnishes testimony to dispute certain of its entries. Commuting visualizations (Figure 2B) provide further testimony supporting much of the preceding discussion, particularly at the Tier 4/5 hierarchical level. Supplementing these factors are migration flows visualizations (e.g., Figures 2C,D).
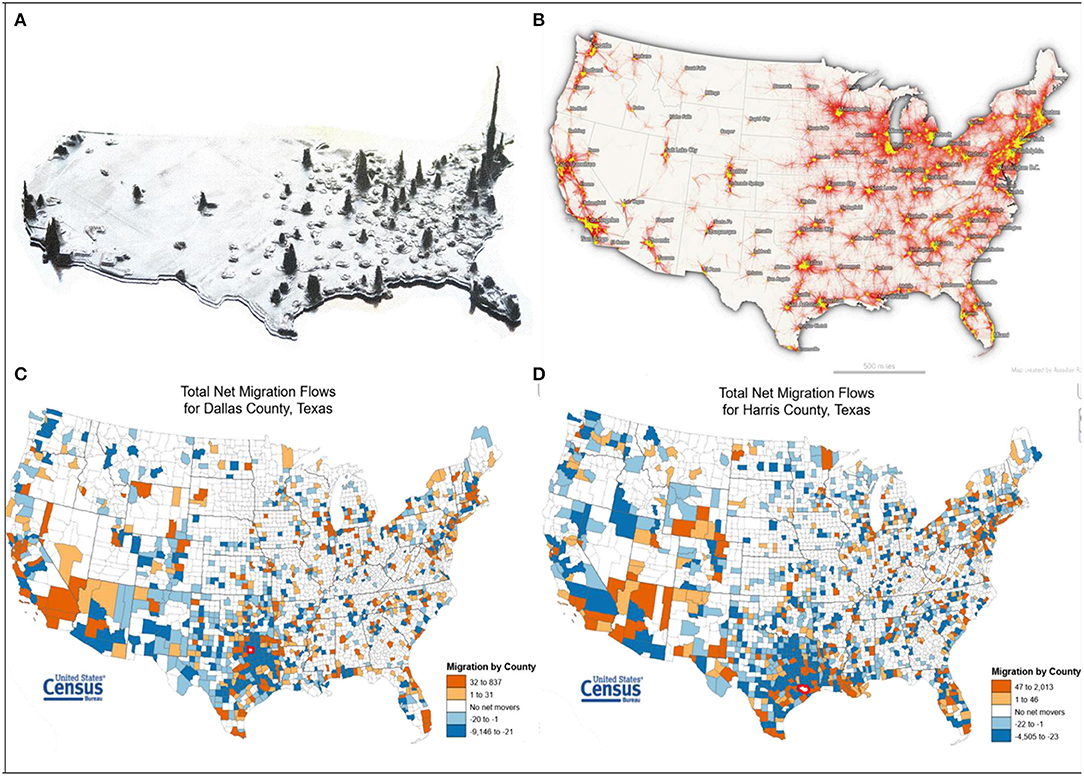
Figure 2. (Counter-clockwise) US population data. (A) A three-dimensional 2010 population density map (adapted from https://www.instructables.com/3D-Printed-US-Population-Map/). (B) 2006–2010 commuting patterns (adapted from https://www.flickr.com/photos/129567161@N06/21667504188). (C) 2015–2019 net migration, Dallas County, TX. (D) 2015–2019 net migration, Harris County, TX, the home of Houston (from https://flowsmapper.geo.census.gov/map.html).

Table 4. Adapted from Figure 2 and Table 1 of Dobis et al. (2015).
The Dwight D. Eisenhower Interstate and Defense Highways network (Figure 3A) supplies a prominent transportation infrastructure ingredient, one that has been documented as being transformative for the US spatial economy, as does the arrangement of major airports (Figure 3B), although, as already stressed, marked inertia affiliated with this latter infrastructure can foster a misleading locational prominence indicator at any given point in time.
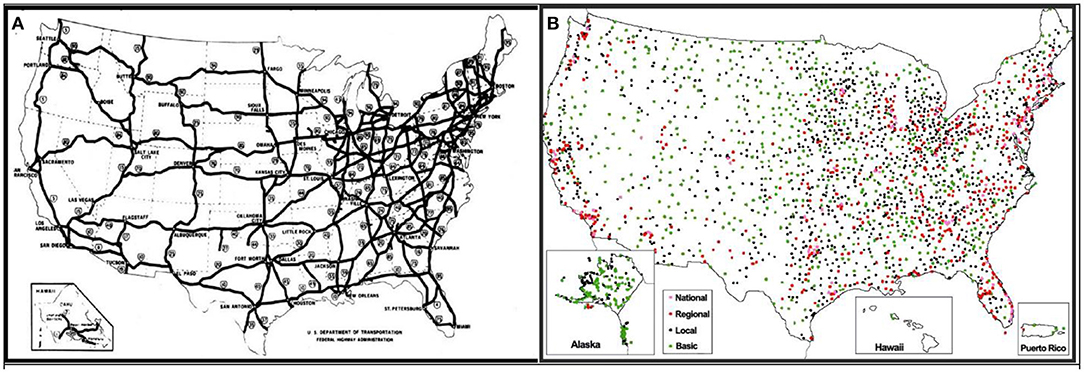
Figure 3. Important US national infrastructure. (A) The interstate highway system; adapted from the US Department of Transportation, Federal Highway Administration graphic https://www.fhwa.dot.gov/interstate/finalmap.cfm. (B) The airports arrangement portrayed with a four tier hierarchical classification; adapted from https://sites.google.com/site/aviationinamerica/_/rsrc/1418426552880/home/airline-commercialization-and-priv/Map.jpg.
The preceding inputs collectively argue for a new state-of-the-art US urban hierarchy, such as the one outlined in Figure 4. Both Tier 2 Chicago and Miami branch to Tier 3 Orlando and Tier 4 Jacksonville, whereas both Tier 1 New York City and Tier 2 Washington, DC, branch to Tier 3 Baltimore (re Table 3). In addition, these inputs imply the lateral or near-lateral (i.e., sideways with a single tier shift) linkages reported in Table 5. The set of 84 metropolitan areas has 3,485 possible pairwise linkages. The nested part of the devised updated urban hierarchy accounts for 165 of these links. The simultaneous branching accounts for three more of them (i.e., Jacksonville—Miami, Orlando—Miami, and Baltimore—Washington, DC). The lateral connections account for another 27 of these links, for a total of 195 urban hierarchy connections. In contrast, a Thiessen polygon planar surface partitioning of the coterminous US based upon the 84 metropolitan areas yields 202 adjacency links2, a few of which replicate some of the foregoing hierarchical linkages. As the sum of these numbers reveals, <12% of the potential links are consequential in the spatial organization of the US urban system.
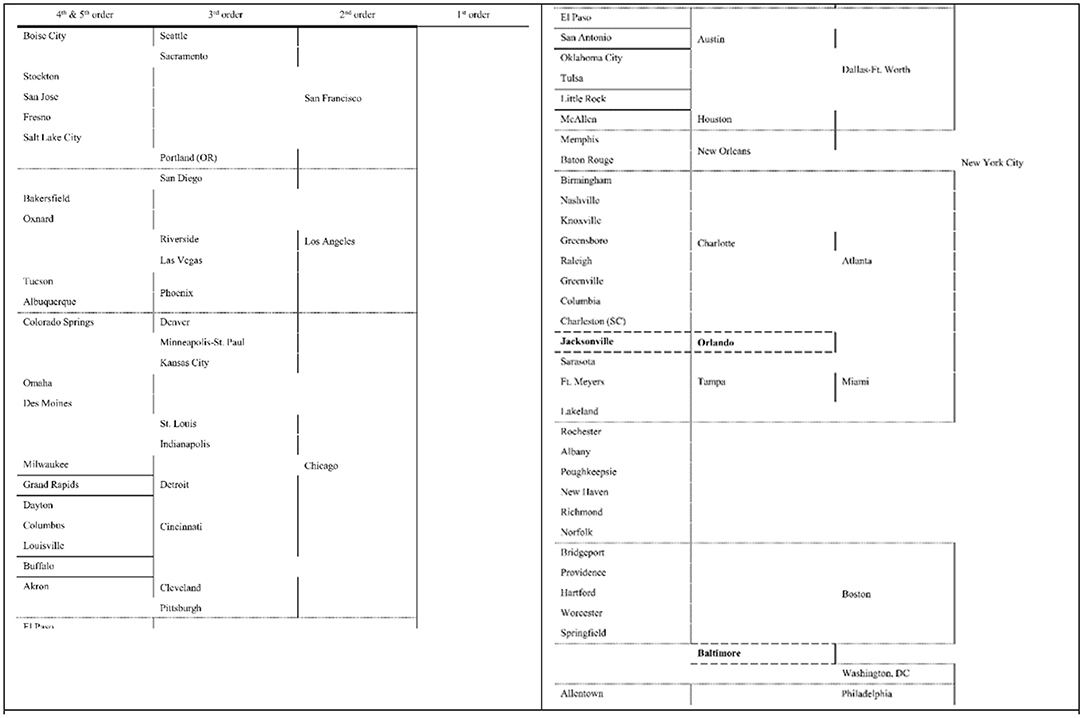
Figure 4. The 84 metropolitan areas constituting the updated 2020 US urban hierarchy; Honolulu (rank #54) was removed from the list because its location is not in the coterminous US. Bold font combined with wide dashed cell borders denote shared metropolitan areas.

Table 5. Lateral and near-lateral updated urban hierarchy linkages.
Figure 5 portrays urban catchment regions for these various hierarchical levels. Dobis et al. (2020) present a similar conceptualization, also identifying both an urban hierarchy and a planar surface partitioning of the coterminous US based upon pre-2020 decennial census data. Essential differences between their urban hierarchy and the one proffered in this paper include: their focus on purely contiguous and hierarchical interrelations among cities that ignore lateral interrelationships; their failure to acknowledge the emerging regional clusters of cities forming conurbations; and, the national dominance of New York City (e.g., their Figures 3, 4), handling it as though it is equivalent to other Tier 2 metropolitan areas, such as Philadelphia. Nevertheless, both analyses propagate a two-source spatial autocorrelation underpinning latent in certain geospatial data. Furthermore, both analyses disclose an historical dimension accounting for a sparser geographic distribution of settlements in the western part, and a denser geographic distribution of settlements in the eastern and mid-western parts, of the continent—both emblematic and a consequence of the nation's western expansion.
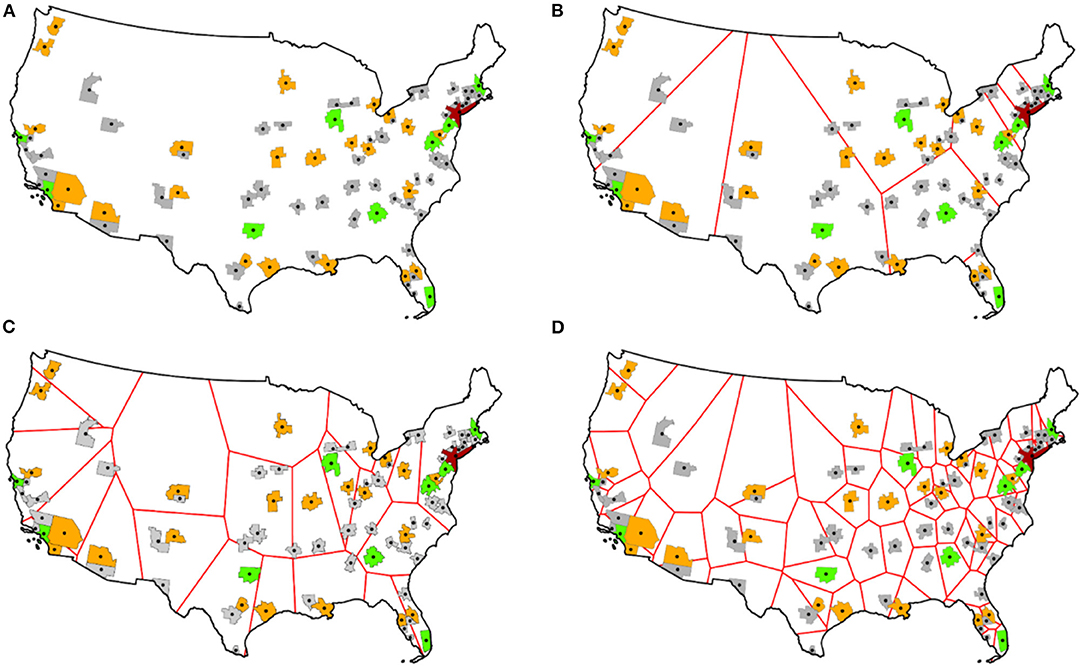
Figure 5. (Counter-clockwise rotation) urban catchment regions by hierarchical level demarcated with red boundaries; tier metropolitan membership is as follows: red denotes 1, green denotes 2, orange denotes 3, and gray denotes 4/5 (Figure 4). (A) Tier 1. (B) Tier 2. (C) Tier 3. (D) Tier 4/5.
A principal reason to establish urban hierarchy structures is for the understanding, explanation, and predictive insights they can provide. They are facets of the real world that, for example, govern diffusion of culture (e.g., MacDonald et al., 2021), diseases (e.g., Griffith and Li, 2021), inflation (e.g., Griffith, 1986, 1992b), innovations (e.g., Hägerstrand, 1953), language (Britain, 2008), multi-locational firms/franchises (Johnsen et al., 2021), and pollution (e.g., La Torre et al., 2021), to name a few ensnared phenomena. One conspicuous well-known finding conveyed by this paper is that these hierarchies are dynamic, changing through time and over space. This evolution is the rationale buttressing urban hierarchy updating efforts. Establishing a priori spatial autocorrelation expectations concretely expands this tool construction into the analytical realm.
Vining (1976), writing during the inaugural years in which Cliff and Ord (1973) popularized the spatial autocorrelation concept, appears to be the first to comprehend the presence of spatial autocorrelation in rank-size distributions: systematic rather than random fluctuations around a log-log straight (i.e., linear) trendline indicates its presence (Figure 6 verifies that random data scatter haphazardly about the rank-size rule trendline, whereas the observed 2020 US metropolitan data display Vining's systematic sinuosity3). Griffith (1978) expanded Vining's arguments specifically to embrace city size distributions, but failed to progress further with this theme because of a lack of well-articulated urban hierarchies—the Yeates and Garner (1980) diagram, absent from the first and second editions of their book, did not appear until 2 years later, with the release of their book's third edition. Not much has changed since then. In a more recent study of Chinese cities, Cheng and Zhuang (2012) comment that the rank-size rule exponent (i.e., γ) estimated with a spatial lag (i.e., autoregressive response) model specification renders a smaller value than its ordinary least squares (OLS) counterpart. More recently yet, using a similar spatial statistics approach, Bergs (2021) reports mixed results, uncovering significant but weak spatial autocorrelation for the US and German, but virtually zero spatial autocorrelation for the United Kingdom, urban system. The Slovenia—a former minor province of Yugoslavia—urban system furnishes conflicting outcomes: no significant spatial autocorrelation based upon population counts data, but significant spatial autocorrelation based upon nighttime lights satellite images. Collectively, his findings suggest the presence of a modest degree of spatial dependence in national urban systems. Bergs (2021, p. 6) also posits an appealing rationale for expecting spatial autocorrelation in city-size distributions: urban agglomeration economies essentially imply spatial autocorrelation in the geographic distribution of city ranks/sizes (i.e., the geographic distribution of large and small cities does not constitute a random mixture across their locations), potentially impacting the rank-size rule exponent (i.e., γ) at a national scale, resulting in the map pattern of such city sizes not necessarily being random, but rather spatially autocorrelated (i.e., partly correlated with the rank/size of their neighboring cities), in geographic landscapes.
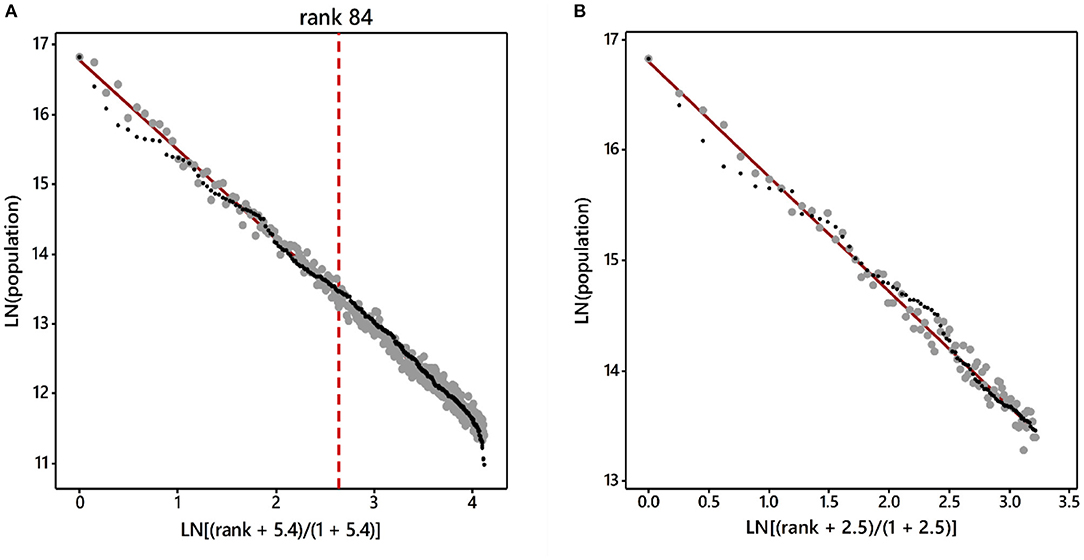
Figure 6. Rank-size rule scatterplot descriptions of the largest 2020 US metropolitan areas; the straight burgundy trendlines denote the theoretical rank-size rule, gray points denote simulated random normal (0, 0.12) data, and black points denote observed data. (A) 384 cities enumerated by the US Bureau of the Census; the translation parameter estimate is 5.4, the bivariate regression R2 is 0.992 (α = 0, β = 1; a = 0.23, b = 0.98), and = 1.29. (B) The 84 cities subset studied in this paper; the translation parameter decreases to 2.5, the bivariate regression R2 decreases to 0.987 (a = 0.36, b = 0.97), and = 1.04.
The implied MESF regression model specification here is
where, respectively, the cEk and uhEh are stepwise selected eigenvectors from the two candidate subsets of vectors for the contiguity and urban hierarchy pair of spatial weights matrices, and βk and βh are their respective accompanying regression coefficients. The eigenvector spatial filter (ESF) duo are cESF = for contiguity spatial autocorrelation, and uhESF = for hierarchical spatial autocorrelation. Because each of these terms centers on zero, and they are exponentiation powers in equation (2), if an jESF (j = c or uh) quantity is positive, its spatial autocorrelation inflates, whereas if an jESF quantity is negative, its spatial autocorrelation deflates, a ranking's impact upon the ith cities population; if an jESF quantity equals zero, spatial autocorrelation has no impact upon a city's ranking effects on its population. Because the two ESFs combine, they can either reinforce or offset each other. Their technical impact is to filter spatial autocorrelation out of the regression residuals, and transfer it to the mean response ranking effects.
Classical spatial autocorrelation analysis explores the clustering of (dis)similar attribute values in geographic space. It is a member of the correlated data family, with its history dating back to the beginning of the 1900s (Griffith, 2020). However, georeferenced data analyses accounting for spatial autocorrelation did not become fashionable until especially Cliff and Ord (1973) popularized the concept. The correlation structure to which they refer is built on planar (e.g., rook chess move polygon adjacencies) or near-planar (e.g., queen chess move polygon adjacencies) surface partitionings involving mutually exclusive and often collectively exhaustive sets of polygons (i.e., areal units, such as metropolitan areas). This neighbors structure is why spatial autocorrelation partners with contagion diffusion. In their dissemination efforts, Cliff and Ord catapulted a spatial weights matrix term to the forefront of regression, methodically synthesizing and theorizing what has become known as spatial (auto)regression.
In the novel MESF spatial statistics/econometrics development Griffith (2003) derived eigenfunctions of modified [i.e., the matrix term in the numerator of a MC4, which complements the Geary ratio (GR5 = ; Geary, 1954) as spatial autocorrelation quantifiers; Luo et al., 2017], rather than spatial lag variates calculated with, geographic weights matrices to account for spatial autocorrelation in regression. In the case of positive spatial autocorrelation, his synthetic variates capture global, regional, and local—see Figure 7 for illustrations of these notions—geographic clustering tendencies in maps (Griffith, 2021) with eigenvectors6, whereas the associated eigenvalues index the (nature and) degree of these vectors' spatial autocorrelation. One advantage of this MESF methodology is that eigenvectors become covariates in standard linear and generalized linear regression procedures, circumventing all of the numerical complications and complexities introduced to regression methodology and mathematical statistics by spatial lag terms [i.e., the random variable Y is on both sized of the equal (=) sign] in auto-model specifications. The Thiessen polygon surface partitioning for the 84 US metropolitan areas (Figure 5D) yields 20 positive contiguity eigenfunctions representing prominent positive spatial autocorrelation (i.e., a relative MCi/MCmax > 0.25, where MCi denotes the ith largest MC in the set of n = 84).
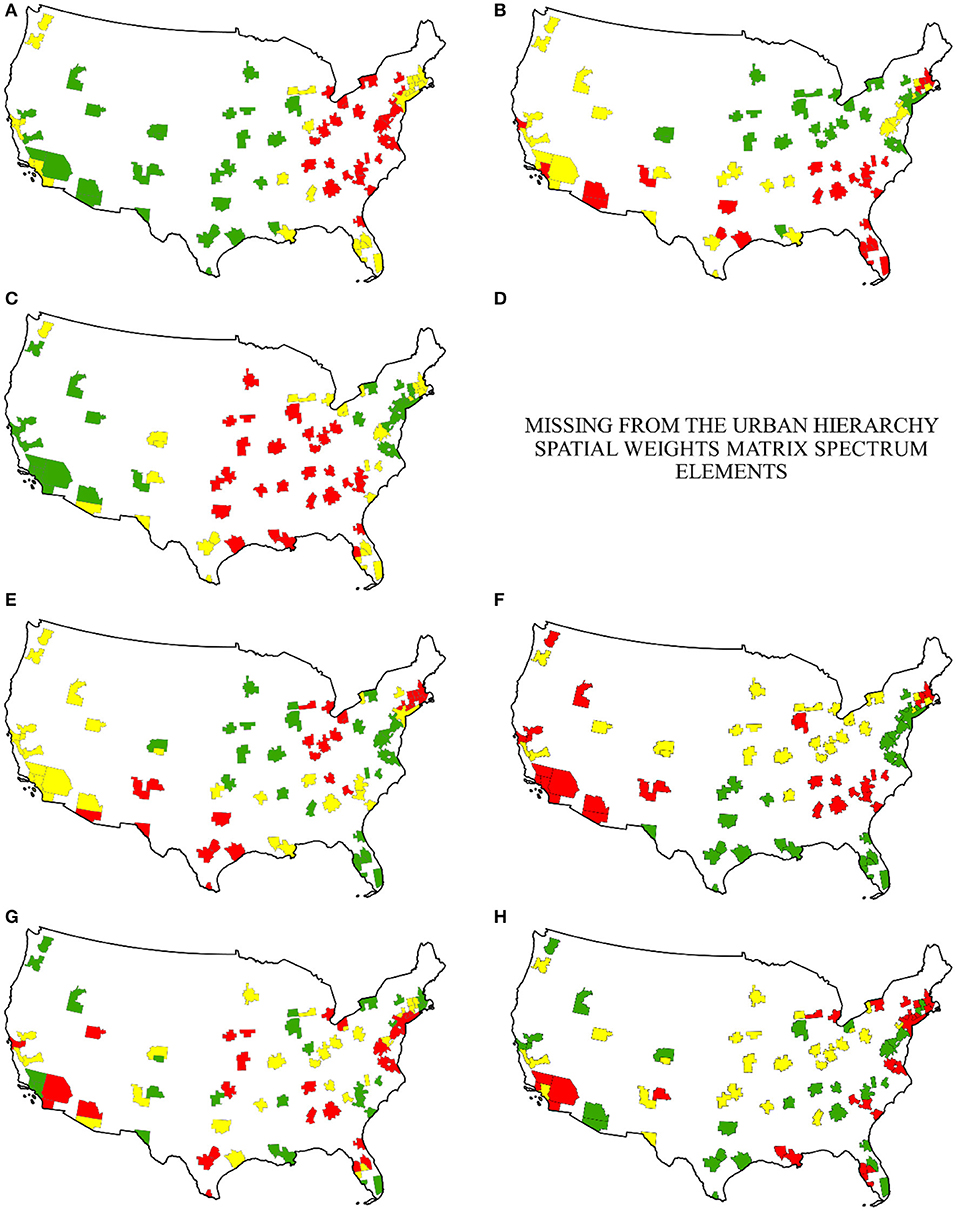
Figure 7. Selected positive spatial autocorrelation eigenvectors; sMC ≈ 0.07; substantive critical values are 0.25 for weak, 0.70 for moderate, and 0.95 for strong spatial autocorrelation. Left: from the contiguity spatial weights matrix. Left top (A) cE1 (global); MC = 1.10, GR = 0.13. Left top middle (C) cE2 (global); MC = 1.04, GR = 0.15. Left bottom middle (E) cE19 (regional); MC = 0.79, GR = 0.30. Left bottom (G) cE20 (local); MC = 0.31, GR = 0.63. Right top (B) uhE1; MC = 1.06, GR = 0.95. Right top middle (D) does not exist. Right bottom middle (F) uhE3; MC = 0.75, GR = 0.47. Right bottom (H) uhE12; MC = 0.28, GR = 0.51.
Figure 6 reflects that the upper tiers of the contemporary US urban hierarchy contain spatial autocorrelation, as do the complete set of 384 metropolitan areas. The modified contiguity spatial weights matrix for this geographic landscape (Figure 5D) has 20 prominent positive, and 30 prominent negative, spatial autocorrelation eigenvectors7. Of these candidates, two positive [i.e., cE1 (see Figure 7A) and cE3, which at least partially relate to the westward expansion historical inertia in the national US urban system8] and three negative (i.e., cE56, cE74, and cE81) vectors were selected from the candidate subset of 20 positive plus 30 negative spatial autocorrelation eigenvectors in a stepwise linear regression analysis (for a detailed discussion of MESF, see Griffith, 2003) to construct an ESF for the following reduced form of Equation (2):
The rank covariate was forced into the equation, and the 50 candidate eigenvectors were selected with a forward-backward iterative procedure. This constructed ESF is a mixture of positive (cESFp) and negative (cESFn) components (see Figures 9A,B; Griffith et al., 2021). All five of the selected vectors are markedly statistically significant. Their combined cESF (= cESFp + cESFn) produces a net MC = −0.01 (sMC ≈ 0.07) and GR = 1.16, erroneously suggesting an absence of spatial autocorrelation in the geographic distribution of urban population (counter to the Figure 6A graphical implication). By accounting for the presence of spatial autocorrelation, the rank translation parameter modestly increases from 2.5 to 2.6, whereas the exponent estimate modestly increases from 1.04 to 1.06. The log-log R2 value, which already is near its upper limit, increases by <1%. Nevertheless, the Figure 8A scatterplot and trendline reveal that adjusting for contiguity spatial autocorrelation tends to move the fitted log-population values closer to their trendline than are most of their corresponding observed values, while removing some of the sinuosity from the unadjusted point cloud scatterplots, especially in the smaller population sized metropolitan areas part of this scatterplot.
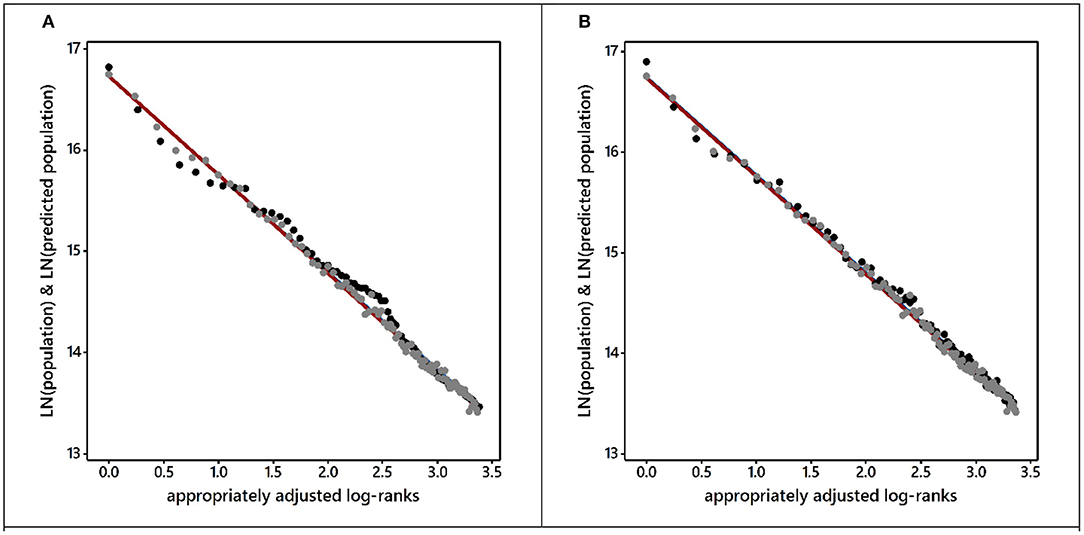
Figure 8. Rank-size rule scatterplot descriptions of the 84 largest 2020 US metropolitan areas; the straight burgundy trendlines denote the theoretical rank-size rule, gray points denote the spatially autocorrelated adjusted predicted, whereas the black points denote the observed, log-population values (see Figure 6B). (A) Spatial adjustment based solely upon the contiguity spatial weights matrix. (B) Spatial adjustment based solely upon the urban hierarchy spatial weights matrix.
The hierarchical spatial autocorrelation coexistence paramount to this paper pertains to clustering of (dis)similar attribute values in spatially structured (e.g., central place theory based) satellite location relationships across geographic space, in many ways paralleling the notion of seasonality in time series analysis.
Figure 9 corroborates the presence of conventional contiguity as well as hierarchical spatial autocorrelation in the upper tiers of the contemporary US urban hierarchy. The modified urban hierarchy spatial weights matrix for this geographic landscape, appearing in the numerator of the MC, has 12 prominent positive, and 19 prominent negative, spatial autocorrelation eigenvectors. Of these candidates, six positive (i.e., uhE2, uhE3, uhE6, uhE7, uhE9, and uhE10)—Figure 7F portrays uhE3–and six negative (i.e., uhE68, uhE70, uhE73, uhE75, uhE81, and uhE84) vectors were selected from the candidate subset of 12 positive plus 19 negative spatial autocorrelation eigenvectors in a stepwise linear regression analysis to construct an ESF that. again, is a mixture of both an uhESFp and an uhESFn component (see Figures 9C,D, 10B) to construct an ESF for the following reduced form of Equation (2):
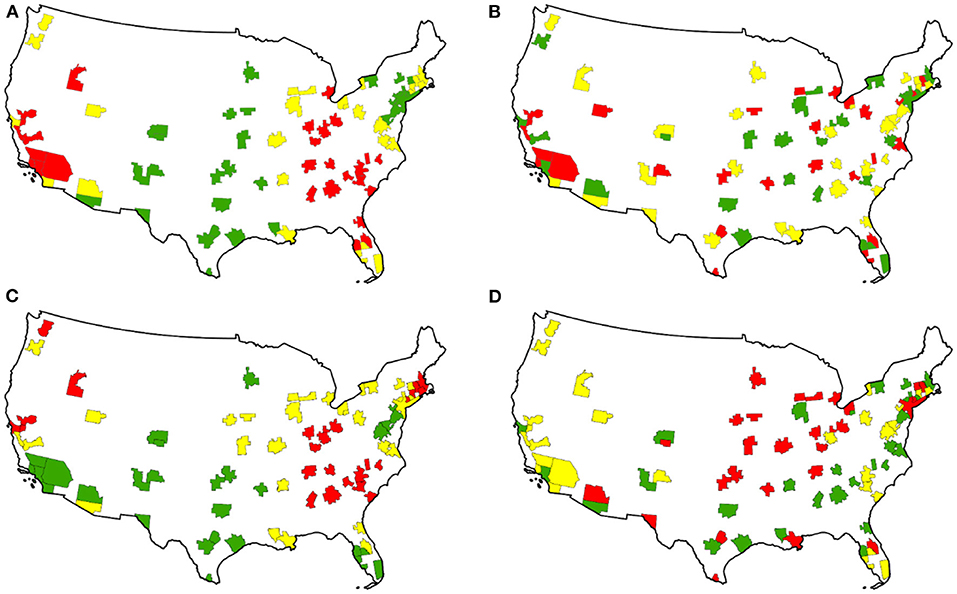
Figure 9. (Counter-clockwise) US 2020 upper hierarchy tiers rank-size rule ESF mixture component geographic distributions; red denotes relatively large, yellow denotes intermediate, and green denotes relatively small values. (A) Contiguity-based cESFp: MC = 1.03, GR = 0.17. (B) Contiguity-based cESFn: MC = −0.45, GR = 1.57. (C) Urban hierarchy-based uhESFp: MC = 0.64, GR = 0.50. (D) Urban hierarchy-based uhESFn: MC = −0.49, GR = 2.84. sMC ≈ 0.07; substantive critical values are 0.25 for weak, 0.70 for moderate, and 0.95 for strong spatial autocorrelation.

Figure 10. Rank-size rule scatterplot descriptions of the 84 largest 2020 US metropolitan areas; the straight burgundy trendlines denote the theoretical rank-size rule, gray points denote the spatially autocorrelated adjusted predicted, whereas the black points denote the observed, log-population values (see Figure 6B). (A) Spatial adjustment based upon the joint contiguity and urban hierarchy spatial weights matrices. (B) The two ESF components; black denotes positive spatial autocorrelation, and gray denotes negative spatial autocorrelation.
Again, the rank covariate was forced into the equation, and the 31 candidate eigenvectors were selected with a forward-backward iterative procedure. All 12 of these vectors are markedly statistically significant. Their composite uhESF produces a net MC = −0.16 (sMC ≈ 0.07) and GR = 2.13; unfortunately, the MC and GR render somewhat conflicting net degree, although consistent net nature, implications—the MC is statistically more powerful than the GR, favoring its implication. By accounting for the presence of hierarchical spatial autocorrelation, the rank translation parameter modestly increases from 2.5 to 2.9, whereas the exponent estimate modestly increases from 1.04 to 1.08. Once more, the log-log R2-value, which already is near its upper limit for an aspatial linear regression specification, increases by <1%. Nonetheless, the Figure 8B scatterplot and trendline reveal that adjusting for hierarchical spatial autocorrelation also tends to move the fitted log-population values closer to their trendline than are many of their corresponding observed values while removing some of the sinuosity from the unadjusted point cloud scatterplots, once more especially in the smaller population sized metropolitan areas part of this scatterplot. This outcome is similar to, although less effective than, that portrayed in the contiguity spatial autocorrelation outcome.
Given these results, reiterating a conclusion from Griffith and Li (2021), accounting for urban hierarchy spatial autocorrelation (i.e., geographic dependence jumps through space) matters when analyzing certain georeferenced data. One question of interest asks whether or not it operates in concert with, independently of, or counter to, contiguity spatial autocorrelation effects, the theme of the next section.
The preceding two sections present individual spatial autocorrelation source analyses, whereas this section presents a joint analysis of contiguity and urban hierarchy geographic structure specifications. This comparative contiguity-urban hierarchy spatial autocorrelation assessment commences with a summary of a canonical correlation analysis of the two sets of spatial weights matrix eigenvectors that, respectively, comprise 20 positive and 30 negative contiguity, and 12 positive and 19 negative urban hierarchy, vectors. Seven statistically significant dimensions (having null hypothesis probabilities <0.05) span these two synthetic datasets, with canonical correlations ranging from 0.956 to almost 1 (i.e., 0.9997). A redundancy analysis discloses that each of these data dimensions accounts for roughly 2–3% of the generalized variance of each dataset, the anticipated amount for spurious dimensions. The strongest correlations (ranging from ~0.3 to 0.6 in absolute value) between original eigenvectors and these pairs of canonical covariates almost exclusively occur for positive spatial autocorrelation components. Oddly, canonical variates #1 and #5 have positive and negative spatial autocorrelation couplings. The overall judgment based upon this empirical evidence is that the planar contiguity and the urban hierarchy spatial structures lack meaningful or conspicuous substantive common data dimensions overlap.
The separate regression analyses, respectively, unveil two positive and three negative contiguity, and six each of the urban hierarchy, spatial autocorrelation eigenvectors. A joint stepwise regression analysis relating to the full Equation (2), forcing the ranking covariate into the equation and iteratively selecting vectors from a combined candidate set of 81 (i.e., 20 + 30 + 12 + 19) eigenvectors, unveils three each for contiguity, and two and six for urban hierarchy, spatial autocorrelation. In the contiguity case, vectors cE12 and cE19 replace cE3, whereas cE67 replaces cE74. In the urban hierarchy case, uhE5 replaces uhE2, uhE3, uhE6, uhE9, and uhE10, whereas uhE69, uhE72, uhE77, and uhE82 replace uhE70, uhE73, uhE75, and uhE81. The total number of eigenvectors decreases from 5 + 12 = 17 to 14. By accounting for the presence of spatial autocorrelation, the rank translation parameter reverts back to a value close to that estimated for contiguity spatial autocorrelation, namely 2.5, whereas the exponent estimate decreases to 1.03. The log-log R2-value, which already is near its upper limit, increases by nearly 1%, almost the sum of its increases for the two individual analyses. The accompanying scatterplot more closely resembles Figures 8A,B. Furthermore, the accompanying spatial autocorrelation continues to be a positive-negative mixture (Table 6); these results, portrayed in Figure 10, deviate only modestly from their single individual spatial weights matrix counterparts (e.g., Figures 8A,B). This mixture shows a collective balancing of positive and negative spatial autocorrelation, with this balance also existing for the contiguity, but not the urban hierarchy, spatial weights matrix correlation by itself. Nevertheless, the individual ESF sources reveal both strong positive and negative spatial autocorrelation components for the contiguity as well as the urban hierarchy mechanisms.
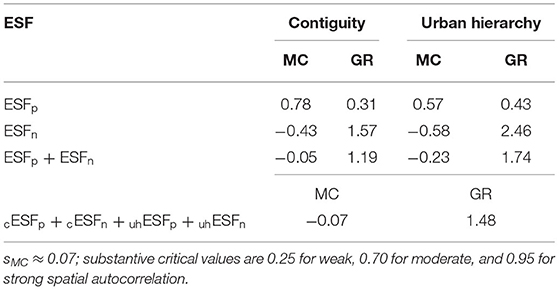
Table 6. Joint contiguity and urban hierarchy MESF analyses for 2020 US metropolitan area log-population, 84 largest places: Equation (2) results.
Figure 10B is of particular interest, depicting the relationships between the contiguity-urban hierarchy pair of positive and of negative spatial autocorrelation components. Both exhibit the same tendency, namely a weak negative correspondence, with the negative components showing far more dispersion from their trendline. The rather shallow slopes of the two regression lines imply contiguity and urban hierarchy spatial structure alone represent mostly different spatial autocorrelation information. This consequence is as expected: the slight overlap alludes to local contiguities that also are connected lower tier settlements in the urban hierarchy, whereas the distinct information refers to differences between physically contiguous and teleportative connections.
The preceding narrative raises a number of discussion points. In addition, the collection of six tables and 10 figures furnish a cogent summary of the content in this paper. Finally, this narrative points to some noteworthy conclusions and implications, some of which reflect on how results reported in this paper can contribute to important policy issues, expanding upon Urban Hierarchies and Sustainable Cities.
This paper presents a US urban hierarchy articulation (Figure 4) that updates its only widely disseminated earlier version by Yeates and Garner (1980; Figure 1), achieving the stated purpose appearing in the introduction (What Is Spatial Autocorrelation?). Rationales justify introduced revisions, with some of the invoked criteria signifying materialized technological change, as well as spatial dynamics, evolving geographic structures, and transformations through space and time. However, fifty years appears to be too infrequent for such updatings (e.g., see Table 2).
One overriding reason for undertaking this task was/is because accounting for any spatial autocorrelation attributable to hierarchical spatial organization seriously matters in many spatial analyses. Urban hierarchies are one of the few domineering latent systematic orderings in geographic landscapes that impact many geospatial phenomena in a non-ignorable way, as Griffith and Li (2021) illustrate for the diffusion of COVID-19—they draped non-urban geographic hierarchies on top of urban hierarchy scaffoldings (e.g., Figures 1, 4). Over the years, population density has proven to be an informative covariate for many social and behavioral science data analyses. Cliff and Ord's (1973) popularizing of contiguity spatial autocorrelation propelled it into a similar status. A goal of this paper is to thrust urban hierarchy spatial autocorrelation considerations into this same standing. Epidemiologist and spatial analysis practitioners, among others, stand to benefit from the US urban hierarchy operationalization reported in this paper—which should remain serviceable for a number of decades—that very often removes a grave misspecification from their analytical formulations. In doing so, it contributes to urban economic sustainability by helping to improve cultural, environmental, and social aspects of cities constituting a national/regional system through, for example, better cost containment and more efficient/effective delivery of urban public health services and utilization/consumption.
An annotated catalog of the six tables and 10 figures furnishes a useful overview of this paper. Figure 1 initiates the paper's narrative by providing a benchmark US urban hierarchy invented roughly four decades ago. It is the yardstick against which to compare a contemporary revision. It furnishes an initial framework to which urban places can be added, subtracted, or repositioned, according to historical changes, in order to transform it into its present-day version. Tables 1–4 inventory different selected city sets that contribute to these reformulation decisions. Table 1 contributes a current world perspective, Table 2 contributes an evolving geographical structures perspective, Table 3 contributes a megalopolis/conurbation perspective, and Table 4 contributes a national urban system perspective. Meanwhile, Figures 2, 3 visualize key elements for the new and improved US urban hierarchy: population density (Figure 2A), unfolding urban commuting fields (Figure 2B), local in- and out-migration (Figures 2C,D), national transportation infrastructure (Figure 3A)—whose transformational impacts on the US national space-economy is well-recognized, if not legendary—and the national airport network (Figure 3B). The original US urban hierarchy articulation portrays a purely nested structure. Particularly Löschian central place theory signals the presence of lateral linkages, such as those enumerated in Table 5. The collective result of Tables 1–5 and Figures 1–3 is the updated US urban hierarchy appearing in Figure 4. This is the formulation that spatial scientists should consider using into the near future, until history justifiably requires its renovation.
Figures 5–9, respectively, portray aspects of the US national geographical landscape with regard to the 80 largest US metropolitan regions in 2020. Figure 5 shows the urban catchment regions by hierarchical level. Figure 6 displays rank-size rule regression and scatterplot results comparing the 384 and 80 largest US metropolitan regions. Both highlight the sinuosity of the scatterplot vis-à-vis the linear regression line that is indicative of the presence of spatial autocorrelation. Figure 8 reveals how accounting for spatial autocorrelation helps to ameliorate this sinuousness. Figure 7 separately exhibits selected contiguity- and hierarchy-based positive spatial autocorrelation map patterns. These are the ingredients that mix together in linear combinations to form ESFs that account for spatial autocorrelation in the geographic distribution of urban phenomena across the US city system, achieving the linear trendline improvement disclosed by Figure 8. Unfortunately, these are partial, marginal analyses.
Table 6 and Figures 9, 10 pertain to the simultaneous effects of accounting for contiguity and urban hierarchy sourced spatial autocorrelation together. Both purveyors of spatial autocorrelation constitute positive-negative mixtures, and inject near-distinct supplemental statistical explanations. In summary, the graphical-plus-tabular story told here is one of the US urban hierarchy transformation that transpired during nearly half-a-century.
In conclusion, this paper illuminates a methodology for updating urban hierarchies. Future research needs to devote effort to attaining this end, not only for the US, but also for other countries. Future research also needs to extend the hierarchy articulated in this paper to more levels, incorporating all 384 metropolitan areas currently sanctioned by the US Bureau of the Census. This effort would allow findings like those reported in this paper to inform, for example, the demarcation of urban labor markets and central place type market areas (e.g., Dobis et al., 2015, portray somewhat perfunctory visualizations of these geographic entities). Figure 5 illustrates that such efforts require more than the top 80 metropolitan areas—too many large interstices exist with only the top 80 cities. Finally, future research needs to resolve some of the unknowns identified in this paper, such as a proper classification of Houston, New Orleans, Phoenix, and Rochester, and an effective procedure for integrating the airport network while accounting for its considerable historical inertia that harbors space-time transformation distortions such as Detroit's present metropolitan area prominence conundrum.
These aforementioned matters embrace vital societal and policy sustainability issues, such as those already mentioned concerning COVID-19 diffusion through an urban geography landscape. Given the prevailing nightmare of COVID-19, the prime topic is diffusion. Whereas, the current geographic spread of this virus is a pressing problem, one already acknowledged in this paper, sustainability of the urban environment requires a legitimate urban hierarchy articulation that supports a sound understanding of the diffusion of an entire suite of diseases (e.g., Ebola, measles, West Nile Virus). Besides the already mentioned propagation of price inflation through a space-economy, both governments and society often express a need to better understand the dissemination of information, ideas, and societal practices. Of course, many other phenomena would benefit from such an updated urban hierarchy, such as the already mentioned traditionally treated diffusion of innovations and cultural fades. A hallmark of sustainability is maintaining the present milieu without compromising the ability of future generations to do the same. Avoiding working with an obsolete urban hierarchy underwrites this end. In doing so, echoing a previous contention, it furnishes an apparatus providing a practical contribution for improving cultural, environmental, and social aspects of systems of cities through, for example, better cost containment and more efficient/effective delivery of urban public health services and utilization/consumption (e.g., via improved prediction of disease diffusion).
Publicly available datasets were analyzed in this study. These data can be found at: https://www.census.gov/library/visualizations/interactive/2020-population-and-housing-state-data.html.
The author confirms being the sole contributor of this work and has approved it for publication.
The author declares that the research was conducted in the absence of any commercial or financial relationships that could be construed as a potential conflict of interest.
All claims expressed in this article are solely those of the authors and do not necessarily represent those of their affiliated organizations, or those of the publisher, the editors and the reviewers. Any product that may be evaluated in this article, or claim that may be made by its manufacturer, is not guaranteed or endorsed by the publisher.
1. ^JSTOR (https://www.jstor.org/) provides a searchable digital archive of academic/scientific journal articles, books, and primary sources housing more than 12 million items spanning 75 disciplines (from African American Studies to Zoology). Its complete collections of more than 2,600 prominent scholarly journals in the humanities, social sciences, and natural sciences make content published as early as 1665 (Philosophical Transactions of the Royal Society) digitally available.
2. ^The US Bureau of the Census traverses Lake Michigan with an imaginary north-south divider, creating an adjacency between its east and west shores. Consequently, a Thiessen polygon partitioning of the coterminous US produces adjacency linkages between Grand Rapids, and Milwaukee, as well as between Chicago and Grand Rapids. Both of these illogical spatial dependency links were removed manually from the Esri ArcGIS-constructed contiguity-based spatial weights matrix.
3. ^The regression equation specification is as follows: Pi = P1/[(ri + δ)/(1 + δ)]γ + εi., where Pi and ri respectively denote the population and rank of the ith city, and εi is a random error term assumed to be N(0, σ2). Rankings were adjusted as follows: (ri + δ)/(1 + δ), where the nonlinear least squares regression estimated translation coefficient represents measurement error (i.e., integer rankings are surrogates rather than precise scales). This parsimonious adjustment ensures that the US urban system first ranked New York City's fit is exact. In addition, δ > 0 signifies that integer rankings are too large, shrinking them toward one (e.g., = 2.5 reduces the 84th rank to nearly 25, whereas = 5.4 reduces this ranking to nearly 14). In contrast, <0 stretches integer rankings, increasing their respective magnitudes. Finally, = 0 ignores the adjustment and preserves the original integer scale.
4. ^Glen (2016), “Moran's I: Definition, examples” from StatisticsHowTo.com: Elementary Statistics for the rest of us! https://www.statisticshowto.com/morans-i/. The MC is a cross-products measure of autocorrelation, with equation (1) being almost completely derivable by direct substitution of one of the two variables, X or Y, into the other's appearance in a Pearson product moment correlation coefficient. Univariate MC target values are its extremes determined by its spatial weights matrix (its upper bound often is around 1.2, whereas its lower bound often is around −0.6), and approximately its zero point. Its asymptotic standard error is (see Griffith, 2010); the 2 appears here because the spatial weights matrix contains both an A → B and a B → A connection for a pair of adjacent areal units A and B, a double-counting of connections.
5. ^The GR and MC are inversely related; it has the following three target values: close to 0 for positive, 1 for zero, and 2+ for negative spatial autocorrelation. As with the MC, the largest and smallest non-zero eigenvalues of its spatial weights matrix determine its two extreme values. The GR is a paired comparison squared differences of adjacent attribute values, which directly links it to the geostatistical semivariogram. Unfortunately, its standard error is a function of kurtosis, which complicates establishing its asymptotic counterpart (Luo et al., 2017).
6. ^Eigenvalue and eigenvector notation uses a post-subscript to denote their eigenfunction ascending rank order number (i.e., 1, 2, …, n) according to the eigenvalue magnitude, and a pre-subscript to denote the type of spatial weights matrix from which they were extracted (i.e., c denotes contiguity, and uh denotes urban hierarchy). Accordingly, all positive spatial autocorrelation eigenfunctions have post-subscripts at the beginning of a ranking (i.e., toward 1), and all negative spatial autocorrelation eigenfunctions have post-subscripts toward the end of a ranking (i.e., toward n).
7. ^Because they are n-by-1 vectors, E denotes eigenvectors. Their prefix subscripts c and uh respectively denote contiguity and urban hierarchy, whereas their suffix subscripts p, n, and j respectively denote positive, negative, and an ascending spatial autocorrelation ordered integer counter from the set {1, 2, …, n}.
8. ^The upper tiers of the US urban system concentrate in the eastern part of the country, which enjoys a much longer settlement history. East coast cities (e.g., Baltimore, New York, Philadelphia) entered the top 20 positions before the country's first national census in 1790. Many mid-western cities began entering this elite set in the mid-1800s (e.g., Chicago, Cleveland, Detroit, St. Louis). Many west coast cities (e.g., Seattle, Los Angeles, San Diego) began their entrance into this top group in the early 1900s. This chronology is a lagged version of the country's westward territorial expansion, with coterminous federal territory acquisitions completed prior to the US civil war (ca., 1853).
Anselin, L., and Li, X. (2020). Tobler's law in a multivariate world. Geogr. Anal. 52, 494–510. doi: 10.1111/gean.12237
Bergs, R. (2021). Spatial dependence in the rank-size distribution of cities – weak but not negligible. PLoS ONE 16, e0246796. doi: 10.1371/journal.pone.0246796
Bettencourt, L., and Zünd, D. (2020). Demography and the emergence of universal patterns in urban systems. Nat. Commun. 11, 4584. doi: 10.1038/s41467-020-18205-1
Borchert, J. (1972). American's changing metropolitan regions. Ann. AAG 62, 352–373. doi: 10.1111/j.1467-8306.1972.tb00868.x
Britain, D. (2008). “Chapter 4: Geolinguistics—diffusion of language,” in An International Handbook of the Science of Language and Society, Vol. 1, eds U. Ammon, N. Dittmar, K. Mattheier, and P. Trudgill (New York, NY: De Gruyter Mouton), 34–48.
Cheng, K.-M., and Zhuang, Y. J. (2012). Spatial econometric analysis of the rank-size rule for urban system: a case of prefectural-level cities in China's middle area. Sci. Geogr. Sin. 32, 905–912. Available online at: https://en.cnki.com.cn/Article_en/CJFDTOTAL-DLKX201208002.htm
Christaller, W. (1933). Die Zentralen Orte in Suddeutschland. Jena: Gustav Fischer Verlag; Translated by C. Baskin 1966 Central Places in Southern Germany. Englewood Cliffs, NJ: Prentice-Hall.
Chun, Y., and Griffith, D. (2017). “Measuring spatial dependence,” in International Encyclopedia of Geography, eds D. Richardson, N. Castree, M. Goodchild, A. Kobayashi, W. Liu, and R. Martson (New York, NY: Wiley), 1–7.
Clark, P. (2013). “Introduction,” in The Oxford Handbook of Cities in World History, ed P. Clark (New York, NY: Oxford University Press). doi: 10.1093/oxfordhb/9780199589531.001.0001
Díez-Pisonero, R., Gago-Garíca, C., and Ordóñez, J. (2020). Beyond global nodes and economic indicators in the evaluation of the world-system of cities. DIE ERDE J. Geogr. Soc. Berlin 151, 1–15. doi: 10.12854/erde-2020-425
Dobis, E., Delgado, M. S., Florax, R. J. G. M., and Mulder, P. (2020). Hierarchy and spatial contagion: population in American cities between 1990 and 2010. J. Econ. Geogr. 20, 397–418. doi: 10.1093/jeg/lbz012
Dobis, E., Delgadoa, M., Florax, R., and Mulderb, P. (2015). “The significance of urban hierarchy in explaining population dynamics in the United States,” in 2015 Agricultural and Applied Economics Association (AAEA) & Western Agricultural Economics Association (WAEA) Joint Annual Meeting, July 26–28. San Francisco, CA. Available online at: http://ageconsearch.umn.edu/record/~205869/files/Dobis_et_al_AAEA2015.pdf (accessed April 21, 2022).
Erdosy, G. (1995). “City states of North India and Pakistan at the time of the Buddha,” in The Archaeology of Early Historic South Asia: The Emergence of Cities and States, ed F. Allchin (Cambridge: Cambridge University Press), 99–122.
Fonseca, J. (1988). Urban Rank-Size Hierarchy. Ann Arbor, MI: Institute of Mathematical Geography, Monograph #8.
Geary, R. (1954). The contiguity ratio and statistical mapping. Incorp. Stat. 5, 115–141. doi: 10.2307/2986645
Getis, A. (2008). A history of the concept of spatial autocorrelation: a geographer's perspective. Geogr. Anal. 40, 297–309. doi: 10.1111/j.1538-4632.2008.00727.x
González, M. A., Crouzet-Pavan, E., and Zorzi, A, (eds.). (2021). Urban Hierarchy: The Interaction Between Towns and Cities in Europe in Late Medieval and Early Modern Times. Turnhout: Brepols Publishers. doi: 10.1484/M.SEUH-EB.5.113993
Gottmann, J. (1957). Megalopolis or the urbanization of the northeastern seaboard. Econ. Geogr. 33, 189–200. doi: 10.2307/142307
Griffith, D. (1978). Spatial Autocorrelation and the Rank Size Rule,” in The Canadian Association of Geographers Annual Meeting. London: University of Western Ontario.
Griffith, D. (1986). “Model identification for estimating missing values in space-time data series: monthly inflation in the U.S. urban system, 1977–1985,” in Transformations Through Space and Time, eds D. Griffith, and R. Haining (The Hague: Martinus Nijhoff), 309–319. doi: 10.1007/978-94-009-4430-5_16
Griffith, D. (1987). Spatial Autocorrelation: A Primer. Washington, DC, Association of American Geographers.
Griffith, D. (1992a). What is spatial autocorrelation? Reflections on the past 25 years of spatial statistics. l'EspaceGéographique 21, 265–280. doi: 10.3406/spgeo.1992.3091
Griffith, D. (1992b). “Model identification for estimating missing values in space-time data series: monthly inflation in the U.S. Urban System, 1977-1990,” in Economic Evolution and Demographic Change: Formal Models in Social Sciences, eds G. Haag, U. Mueller, and K. Troitzsch (Berlin: Springer-Verlag), 192–218. doi: 10.1007/978-3-642-48808-5_10
Griffith, D. (1996). Spatial autocorrelation and eigenfunctions of the geographic weights matrix accompanying geo-referenced data. Can. Geogr. 40, 351–367. doi: 10.1111/j.1541-0064.1996.tb00462.x
Griffith, D. (2003). Spatial Autocorrelation and Spatial Filtering: Gaining Understanding through Theory and Scientific Visualization. Berlin: Springer-Verlag. doi: 10.1007/978-3-540-24806-4
Griffith, D. (2009). “Spatial autocorrelation,” in International Encyclopedia of Human Geography, eds R. Kitchin, and N. Thrift (New York, NY: Elsevier), 396–402.
Griffith, D. (2010). The Moran Coefficient for non-normal data. J. Stat. Plan. Infer. 140, 2980–2990. doi: 10.1016/j.jspi.2010.03.045
Griffith, D. (2012). Spatial statistics: a quantitative geographer's perspective. Spat. Stat. 1, 3–15. doi: 10.1016/j.spasta.2012.03.005
Griffith, D. (2019). “Spatial autocorrelation,” in Geography (Oxford University Press). doi: 10.1016/B978-0-12-815043-6.00001-X
Griffith, D. (2020). A family of correlated observations: from independent to strongly interrelated ones. Stats 3, 166–184. doi: 10.3390/stats3030014
Griffith, D. (2021). Interpreting Moran eigenvector maps with the Getis-Ord G statistic. Prof. Geogr. 7, 447–463. doi: 10.1080/00330124.2021.1878908
Griffith, D., Agarwal, K., Chen, M., Lee, C., Panetti, E., Rhyu, K., et al. (2021). Geospatial socio-economic/demographic data: the masking of negative by, existence of mixtures of spatial autocorrelation in georeferenced data: part I and Part II. Trans. GIS. 72–87, 88–99. doi: 10.1111/tgis.12834
Griffith, D., and Chun, Y. (2021). “Spatial autocorrelation and spatial filtering,” in Handbook of Regional Science, 2nd edn., eds M. Fischer, and P. Nijkamp (Berlin: Springer-Verlag), 1863–1892. doi: 10.1007/978-3-662-60723-7_72
Griffith, D., and Lagona, F. (1998). On the quality of likelihood-based estimators in spatial autoregressive models when the data dependence structure is misspecified. J. Stat. Plan. Infer. 69, 153–174. doi: 10.1016/S0378-3758(97)00156-0
Griffith, D., and Li, B. (2021). Spatio-temporal modeling of initial COVID-19 diffusion: the cases of China and the United States. Geo Spat. Inform. Sci. 24, 340–362. doi: 10.1080/10095020.2021.1937338
Griffith, D. (2017). “FC-37-Spatial autocorrelation,” in Geographic Information Science & Technology Body of Knowledge, 4th Quarter, 2017 Edition, ed J. Wilson. Available online at: https://gistbok.ucgis.org/bok-topics/spatial-autocorrelation (accessed April 21, 2022).
Hackmann, A., and Klarl, R. (2020). The evolution of Zipf's law for US Cities. Reg. Sci. 99, 841–852. doi: 10.1111/pirs.12498
Hägerstrand, T. (1953). Innovationsförloppet ur Korologisk Synpunkt. Lund: Gleerup; Postscript and translation by A. Pred, with translation assistance by G. Haag 1967 Innovation Diffusion as a Spatial Process. Chicago: University of Chicago Press.
Hagler, Y. (2009). Defining U.S. Megaregions. New York, NY: Regional Plan Association. Available online at: https://s3.us-east-1.amazonaws.com/rpa-org/pdfs/2050-Paper-Defining-US-Megaregions.pdf (accessed April 21, 2022).
Hall, P. (2005). The world's urban systems: a European perspective. Glob. Urban Dev. Magaz. 1. Available online at: https://www.globalurban.org/Issue1PIMag05/Hall%20article.htm (accessed April 21, 2022).
Hansen, N. (1975). A Critique of Economic Regionalizations of the United States, IASA Research Report RR-75-03. Laxenburg: International Institute for Applied Systems Analysis (IIASA).
Hanson, J. (2017). An Urban Geography of the Roman World, 100 BC to AD 300. Oxford: Archaeopress. doi: 10.2307/j.ctv17db2z4
Johnsen, T., Caniato, F., and Miandar, T. (2021). “Chapter 14: the role of purchasing in the diffusion of sustainability in supply networks,” in Handbook of Sustainability-Driven Business Strategies in Practice, eds S. Markovic, C. Sancha, and A Lindgreen (Cheltenham: Elgar), 244–259. doi: 10.4337/9781789908350.00027
Krugman, P. (1996). Confronting the mystery of urban hierarchy. J. Jpn. Int. Econ. 10, 399–418. doi: 10.1006/jjie.1996.0023
La Torre, D., Liuzzi, D., and Marsiglio, S. (2021). Transfoundary pollution externalities: think globally, act locally? J. Math. Econ. 99, 102511. doi: 10.1016/j.jmateco.2021.102511
Legendre, P. (1993). Spatial autocorrelation: trouble or new paradigm? Ecology 74, 1659–1673. doi: 10.2307/1939924
Lösch, A. (1940). Die räumliche Ordnung der Wirtschaft: Eine Untersuchung über Standort, Wirtschaftsgebiete und internationalen Handel. Jena: Gustav Fischer Verlag; Translated by W. Woglom 1954. The Economics of Location. New Haven, CT: Yale University of Press.
Luo, Q., Griffith, D., and Wu, H. (2017). “Chapter 22: the moran coefficient and the geary ratio: some mathematical and numerical comparisons,” in Advances in Geocomputation: Geocomputation 2015—The 13th International Conference, eds D. Griffith, Y. Chun, and D. Dean (Berlin: Springer), 253–269.
MacDonald, K. F, Scherjon van Veen, E., Vaesen, K., and Roebroeks, W. (2021). Middle Pleistocene fire use: the first signal of widespread cultural diffusion in human evolution. Proc. Natl. Acad. Sci. U.S.A. 118, e2101108118. doi: 10.1073/pnas.2101108118
Madden, C. (1956). On some indications of stability in the growth of cities in the United States. Econ. Dev. Cult. Change 4, 235–252. doi: 10.1086/449715
Moran, P. (1950). Notes on continuous stochastic phenomena. Biometrika 37, 17–23. doi: 10.1093/biomet/37.1-2.17
Morrill, R. (2010). “Metropolitan area,” in Encyclopedia of Geography, Vol. 4, eds B. Warf (Thousand Oaks, CA: SAGE), 1886–1888.
Neal, Z. (2011). From central places to network bases: a transition in the U.S. urban hierarchy, 1900–2000. City Community 10, 49–75. doi: 10.1111/j.1540-6040.2010.01340.x
Nelson, G., and Rae, A. (2016). An economic geography of the United States: from commutes to megaregions. PLoS ONE 11, e0166083. doi: 10.1371/journal.pone.0166083
Paelinck, J. (2013). Spatial econometrics: a personal overview. Studia Ekon. 152, 106–118. Available online at: http://cejsh.icm.edu.pl/cejsh/element/bwmeta1.element.desklight-0f5e5305-afbd-47de-9dba-60b94f1e3c7b
Philbrick, A. (1957). Principles of areal functional organization in regional human geography. Econ. Geogr. 33, 299–336. doi: 10.2307/142362
Phillips, P. (1974). Newspaper circulation as a measure of metropolitan influence and dominance. Southeast. Geogr. 14, 17–25. doi: 10.1353/sgo.1974.0000
Pumain, D. (2005). “Chapter 7: alternative explanations of hierarchical differentiation in urban systems,” in Hierarchy in Natural and Social Sciences, ed D. Pumain (Dordrecht: Springer), 169–222. doi: 10.1007/1-4020-4127-6_8
Ramos, B., and Roca, J. (2015). “Megalopolis: an assay for the identification of the world urban mega-structures,” in The 55th European Regional Science Association (ERSA) Congress themed “World Renaissance: Changing roles for people and places,” 25-28 August (Lisbon). Available online at: https://www.econstor.eu/bitstream/10419/124709/1/ERSA2015_00736.pdf (accessed April 21, 2022).
Sokal, R., Oden, N., and Thomson, B. (1998). Spatial autocorrelation in a biological model. Geograp. Anal. 30, 331–354. doi: 10.1111/j.1538-4632.1998.tb00406.x
Thakur, R. (1994). Urban hierarchies, typologies and classification in early medieval India: c. 750–1200. Urban Hist. 21, 61–76. doi: 10.1017/S0963926800010701
Theo, L. (2010). “Urban hierarchy,” in Encyclopedia of Geography, Vol. 1, ed B. Warf (Thousand Oaks, CA: SAGE), 2949–2951.
Tiefelsdorf, M., and Boots, B. (1995). The exact distribution of Moran's I. Environ. Plan. A 27, 985–999. doi: 10.1068/a270985
US Census Bureau Population Division. (2021). 2020 Population and Housing State Data. Available online at: https://www.census.gov/library/visualizations/interactive/2020-population-and-housing-state-data.html (accessed April 21, 2022).
Verma, T., Araújo, N., and Herrmann, H. (2014). Revealing the structure of the world airline network. Sci. Rep. 4, 5638. doi: 10.1038/srep05638
Vining, D. (1976). Autocorrelated growth rates and the Pareto law: a further analysis. J. Polit. Econ. 84, 369–380. doi: 10.1086/260440
Warf, B. (2010). “Central place theory,” in Encyclopedia of Geography, vol. 1, ed B. Warf (Thousand Oaks, CA: SAGE), 380–382. doi: 10.4135/9781412939591.n146
Keywords: contiguity, rank-size rule, spatial autocorrelation, United States, urban hierarchy
Citation: Griffith DA (2022) The United States Urban Hierarchy: An Update. Front. Sustain. Cities 4:852090. doi: 10.3389/frsc.2022.852090
Received: 10 January 2022; Accepted: 28 March 2022;
Published: 23 May 2022.
Edited by:
Piyush Tiwari, The University of Melbourne, AustraliaReviewed by:
Vassilis Tselios, Panteion University, GreeceCopyright © 2022 Griffith. This is an open-access article distributed under the terms of the Creative Commons Attribution License (CC BY). The use, distribution or reproduction in other forums is permitted, provided the original author(s) and the copyright owner(s) are credited and that the original publication in this journal is cited, in accordance with accepted academic practice. No use, distribution or reproduction is permitted which does not comply with these terms.
*Correspondence: Daniel A. Griffith, ZGFncmlmZml0aEB1dGRhbGxhcy5lZHU=
Disclaimer: All claims expressed in this article are solely those of the authors and do not necessarily represent those of their affiliated organizations, or those of the publisher, the editors and the reviewers. Any product that may be evaluated in this article or claim that may be made by its manufacturer is not guaranteed or endorsed by the publisher.
Research integrity at Frontiers
Learn more about the work of our research integrity team to safeguard the quality of each article we publish.