 Claudia Montoya-Tangarife1*†
 Natalia Villamizar Duarte2†
 Felipe Jorquera Guajardo3†
 María F. Cardenas4†
 Tania Giraldo-Ospina5†
- 1Escuela de Ingeniería Forestal, Facultad de Ciencias, Ingeniería y Tecnología, Universidad Mayor, Santiago, Chile
- 2School of Architecture, Planning and Landscape, Faculty of Humanities and Social Sciences, Newcastle University, Newcastle upon Tyne, United Kingdom
- 3Facultad de Ciencias Ambientales - Centro EULA, Universidad de Concepción, Concepción, Chile
- 4Escuela de Planeación Urbano Regional, Facultad de Arquitectura, Universidad Nacional de Colombia, Medellín, Colombia
- 5Escuela de Arquitectura y Urbanismo, Facultad de Ingeniería y Arquitectura, Universidad Nacional de Colombia, Manizales, Colombia
The supply and demand of ecosystem services in urban areas depends, among other things, on the configuration and location of public spaces with vegetation and the access citizens have to them. Providing equitable access to urban services has been a top priority of public policy worldwide, but urban ecosystem services (UES) are not always considered when discussing urban services. Since access to UES may positively impact wellbeing and promote urban sustainability, we analyze accessibility to public spaces with different greening characteristics in four Latin American cities: Cartagena de Indias and Medellín (Colombia) Valparaíso (Chile) and Quito (Ecuador). We argue that considering distribution of, and accessibility to, public spaces with different greening characteristics provides insights for policymakers seeking to increase the potential provision of UES through public space. We classified existing public spaces into four categories using photointerpretation of high-resolution QuickBird satellite images: (1) tree predominance, (2) grass predominance, (3) hard zone predominance, and (4) bare soil predominance. We evaluated physical accessibility using spatial analysis of road networks, considering a walking distance that can be covered in different ranges of time. Our results show that three of the four cities have good accessibility to public spaces within 15 min. However, this distance increases when we focus on access to public spaces with vegetation and green areas (categories 1 and 2). This study contributes to research on ecosystem services by analyzing conditions of accessibility to public spaces which offer direct contact with nature and a potential supply of UES within urban areas. It also highlights the importance of conceiving and planning public space as direct providers of UES, an important aspect of improving environmental quality and positively impacting people's health and wellbeing.
Introduction
Ecosystem services (ES) offer a conceptual framework with a high potential to promote dialog and agreements between science, politics, and society that exhort searching for solutions to contemporary socio-environmental problems. In this sense, ES also offer a practical framework for the development of tools which are of great use for territorial planning and environmental management (Balvanera and Cotler, 2007; Daily et al., 2009; Nelson et al., 2009; Barral and Oscar, 2012; Logsdon and Chaubey, 2013; Langemeyer et al., 2016; Rusch et al., 2017). In this context, ES are currently a central theme in agendas and debates that promote territorial sustainability, as well as in actions aimed at achieving sustainable territorial development.
While a significant part of literature on ES initially focused on understanding the supply capacity of undeveloped/non-urban areas (Costanza et al., 1997; Daily, 1997), more recently we have seen the emergence of an interest in understanding ES present in urban areas or urban ecosystem services (UES). UES are understood as those ES provided by urban systems, particularly through green and blue infrastructure (Chen et al., 2020; Elderbrock et al., 2020; Barber et al., 2021; Rodriguez-Valencia and Ortiz-Ramirez, 2021), that is, natural and seminatural areas with vegetation and bodies of water. In a context of growing urbanization, UES are increasingly becoming relevant variables for the wellbeing and health of the urban population, and therefore emerging as a central aspect for territorial planning and achievement of urban sustainability (Hernández Aja, 2009; Huang et al., 2015; Yigitcanlar et al., 2015). Today, many cities are making tangible efforts to recover natural spaces near, and within, urban areas (United Nations, 2017).
Studies on the provision of UES through their green infrastructure have explored the role of nature in urban sustainability and spatial planning, demonstrating that the benefits provided by these ecosystems go beyond urban limits and have a close relationship with rural or peri-urban settings (Bai and Guo, 2021; Jaung et al., 2022). However, there are still many aspects to explore around the contributions of urban vegetation and urban green areas. Some of these aspects relate to the scale, distribution, and access to both vegetation and green areas, which in cities are located mainly in urban public spaces. Recent debates on sustainable development, climate adaptation, habitability and wellbeing, and the right to the city have recognized public space as an infrastructure capable of integrating social and environmental dimensions in urban contexts (Liu and Russo, 2021; Liu et al., 2021; Lonsdorf et al., 2021). Ultimately, this integration is an essential component of the transformation necessary to achieve the sustainable urban development goals.
Many cities have committed to increasing the provision and adequacy of public space as a strategy to improve both environmental and social conditions. When implementing these strategies, local governments face challenges characteristic of contemporary cities: availability of land and financing. Under the increasing pressure of urbanization, few cities today have the capacity to allocate large areas of land for public space. This has resulted in an expansive occupation of territory that moves the development of green areas to a secondary role. This is even more noticeable in Latin America, the most urbanized region in the world and where two of every ten urban inhabitants live in marginal areas, and one third of the urban growth has not been planned (UNDRR, 2021, p. 58–59). The second challenge that has impacted cities worldwide is that decisions about natural areas, vegetation, and landscape design are often determined by the financial and maintenance capacity of local governments. This has resulted in the planning and provision of small- and medium-scale public spaces that are widely distributed in the territories to improve access, but with a limited offering of vegetation and more natural elements, as we will show in our analysis. While this approach has an important impact in terms of social inclusion and improvement, it does not necessarily consider the capacity, or lack of capacity, of these public spaces as providers of UES.
Several authors have pointed out the positive impact that the UES have on the health and welfare of society (Horwitz and Finlayson, 2011; Coutts and Hahn, 2015; Chiabai et al., 2018; Subiza-Pérez et al., 2020). Others have emphasized that their provision and management is related to accessible public spaces (Thompson, 2002; Botequilha-Leitão and Díaz-Varela, 2020; Chen et al., 2020; Jaung et al., 2020; Priess et al., 2021). Considering that the supply and demand of UES depends, among other things, on the configuration, the location of public spaces with vegetation, and the accessibility that citizens have to them (Barber et al., 2021), we perform an analysis that measures accessibility to public space with distinct spatial configuration of vegetation in four urban areas.
Accessibility has become one of the most urgent urban challenges in recent decades. Providing equitable access to urban services (employment, schools, hospitals, green and recreational spaces, consumer goods, and the like) has been a top priority of public policy worldwide (Duranton and Guerra, 2017; Guzman and Oviedo, 2018; Pereira, 2019; Villamizar Duarte et al., 2020). From various perspectives, such as economic geography, housing, and transportation, the academic literature has placed accessibility at the center of our thinking about urban development (Geurs and Van Wee, 2004; Niedzielski and Eric Boschmann, 2014; Jin and Paulsen, 2018; Cui et al., 2019; Oviedo, 2021). The momentum achieved by academics in this field is consolidating what is currently known as the accessibility shift, where the emphasis is on access to urban resources (Levine et al., 2019). UES, however, are one of the urban services discussed less in accessibility debates.
Since access to UES positively impacts several dimensions of urban sustainability, such as environmental quality, urban quality of life, and health and wellbeing, we consider it is important to expand analysis of this area. After more than 2 years living with the COVID-19 pandemic, there is evidence that access to natural or seminatural spaces has a positive effect in both people's physical and mental health (Chiabai et al., 2020; Moreno et al., 2020; Ramírez-Ortiz et al., 2020). To further advance this debate, our research asks how accessibility varies between public spaces with different greening characteristics in four Latin American cities. We argue that considering distribution of, and accessibility to, public spaces with different greening characteristics provides valuable insights for policymakers.
Accessibility to public space and urban green areas (UGA) is inherently related to pedestrian mobility, which in turn varies according to the urban morphology, topography, and conditions of the infrastructure in general. Several studies of accessibility indicators exist where proximity, density, and sizes of UGA are calculated (Le Texier et al., 2018; Xie et al., 2018; Xing et al., 2020). However, there is still no consensus on the most effective method to analyze these measures (Dony et al., 2015). Distance between the demand points (population) and the nearest supply of UGA are often measured using three techniques: Euclidean, Manhattan, and network distance (Li, 2014; So, 2016). Our research uses network analysis, since it provides a more accurate measure by relying on a real infrastructure network (streets, sidewalks, etc.) and considering average travel speed.
This study compares conditions of accessibility to public spaces in four Latin American cities: two coastal cities (Cartagena de Indias, Colombia and Valparaíso, Chile) and two mountain cities (Quito, Ecuador and Medellín, Colombia). We compare different urban contexts to understand differential insights about potential of public space as providers of UES that can be enjoyed directly by the population. Direct provision of UES is a factor that contributes to physical and mental health (Jennings et al., 2016; Vidal et al., 2021) and potentially to social cohesion (Jennings and Bamkole, 2019; Dobbs et al., 2021; Luca et al., 2021). However, realizing these benefits depends to a great extent on the conditions of accessibility to public spaces with various functional types of vegetation.
This study contributes to research on UES by analyzing conditions of accessibility to public spaces which, within urban areas, offer direct contact with nature and a potential supply of UES. This analysis advances our knowledge about the impacts on effective reception of UES in citizens quality of life and wellbeing. Furthermore, it helps us understand urban characteristics (i.e., slope and road infrastructure) that facilitate or limit access to public space and their potential offer of UES. This study also contributes to the literature on accessibility by bringing attention to UES as a service whose accessibility is central to improve wellbeing and quality of life in cities. Finally, it contributes by providing evidence about conditions of accessibility to public spaces with distinct characteristics in four Latin American cities. This type of evidence is fundamental to support decision-making about evaluation and provision of UES within urban planning.
Materials and methods
To conduct our analysis, we selected cities with different topographic and geographical location, climate, size, population densities, urban structures, and supply of public space. These differential conditions are important to understand both the spatial configuration of vegetation within and accessibility to public spaces. Table 1 presents a general profile of each city, and Figure 1 shows the spatial distribution of public spaces.
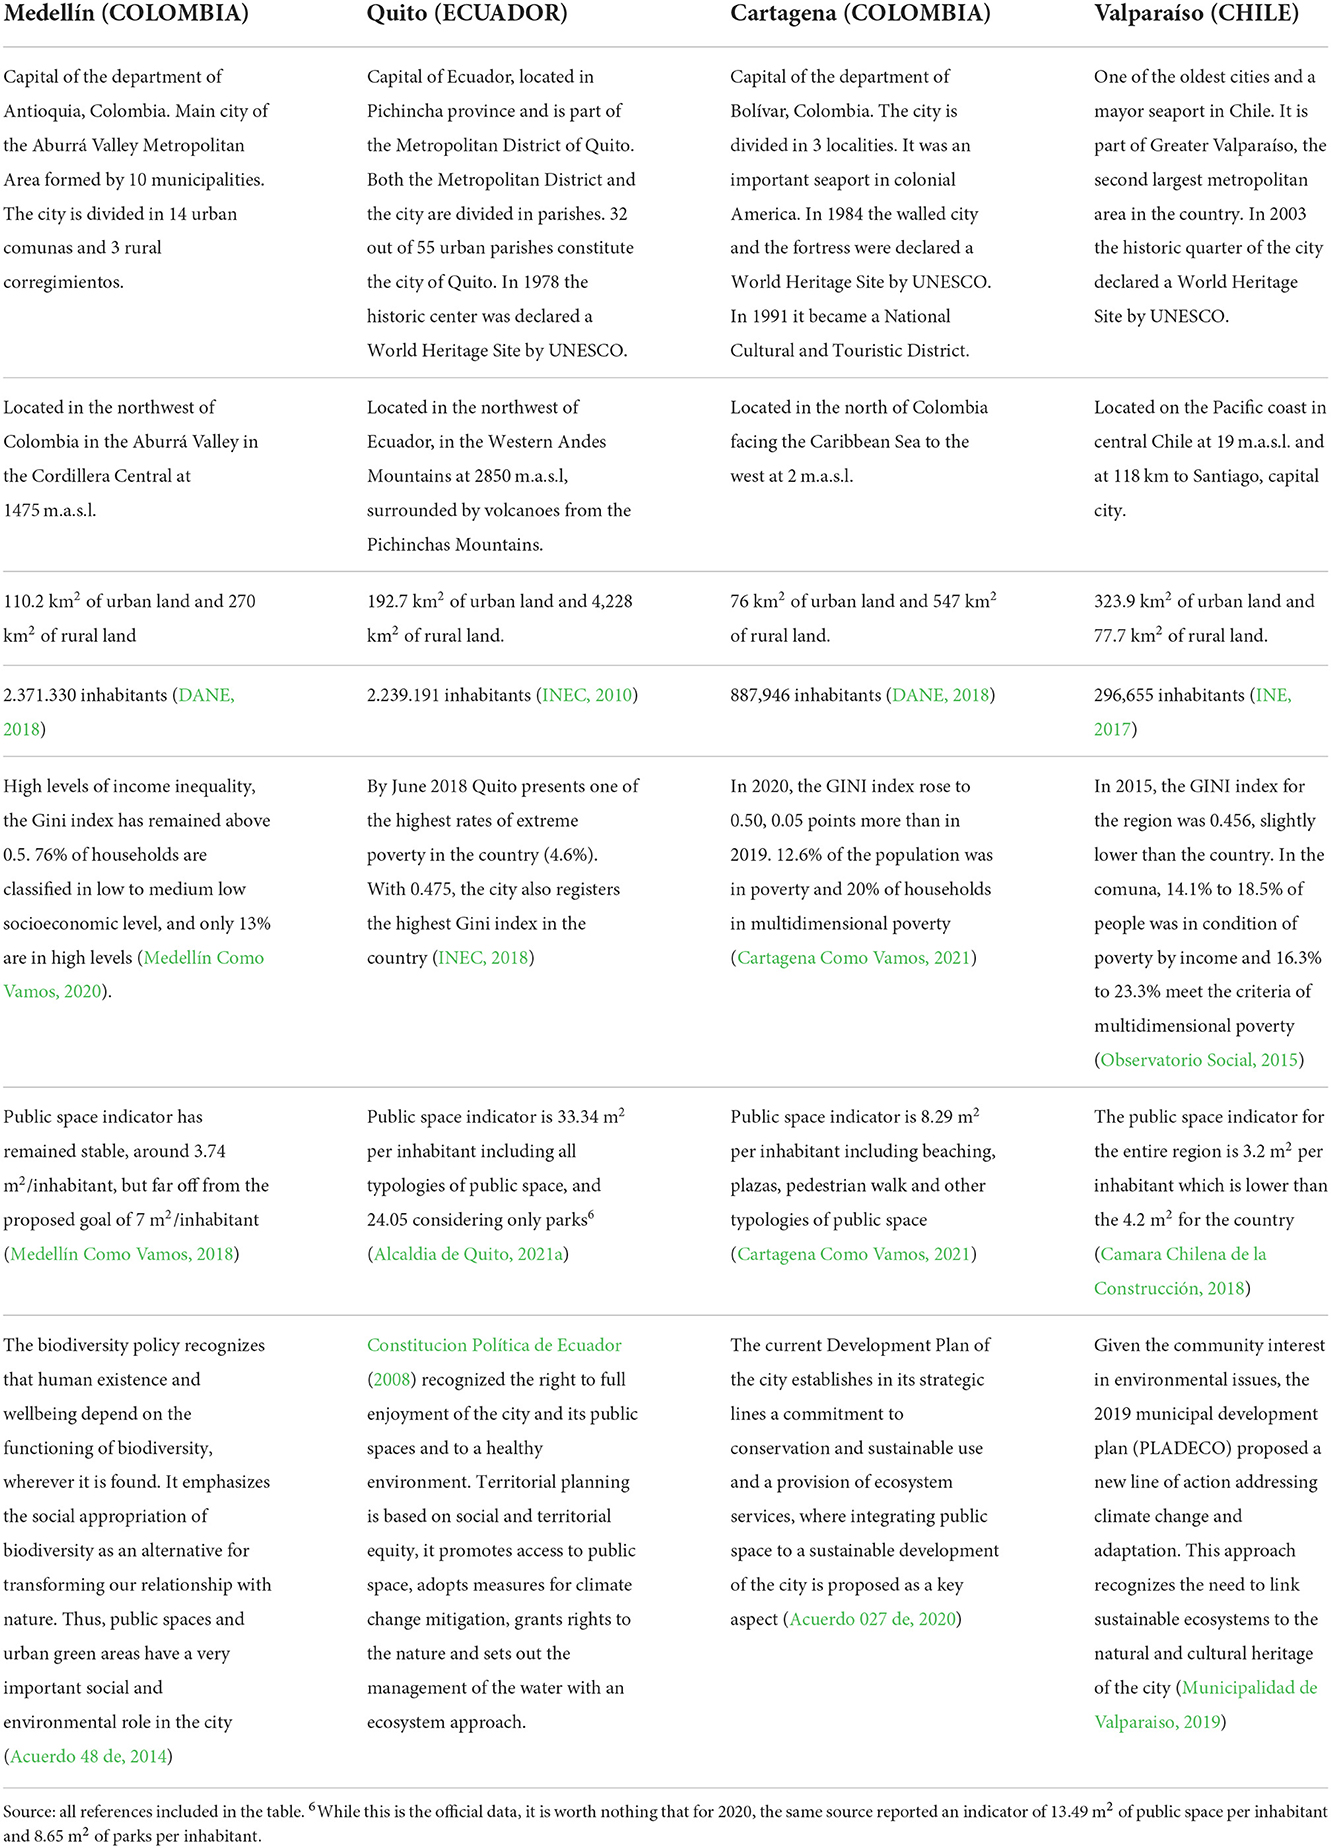
Table 1. Case studies: Cities' profile.
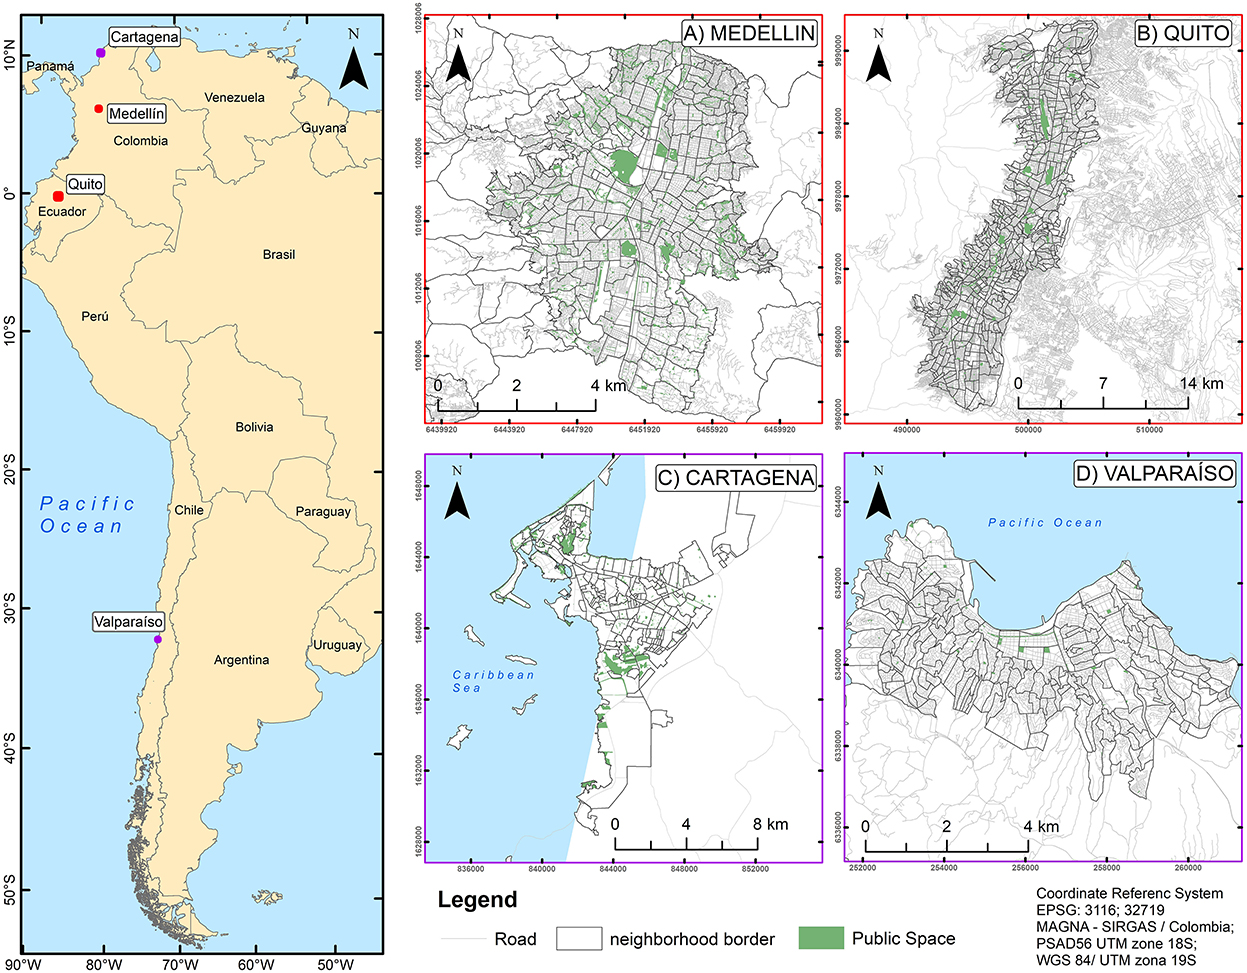
Figure 1. Case studies: Location and distribution of public spaces in (A) Medellín, (B) Quito, (C) Cartagena, and (D) Valparaiso. Source: Prepared by the authors based on (Decreto 0977 de, 2001; Acuerdo 48 de, 2014; Cárdenas et al., 2020; Alcaldia de Medellin, 2021; Alcaldia de Quito, 2021b; Alcaldia Mayor de Cartagena de Indias, 2021; Ministerio de Vivienda y Urbanismo de Chile, 2021).
Units of analysis
They correspond to open areas which public condition allows for free access to all the population and therefore to the potential UES offered by them. Although privately owned public spaces (POPS), such as clubs, reserves, and parks, also provide ES to the population, access to them is not guaranteed to all and therefore we disregard them as a potential source of UES. For the analysis, we only consider public spaces with areas over 5,000 m2. This threshold allows us to focus on public space that can house larger green areas and diverse types of vegetation that potentially increase the supply of associated UES.1 Compared to smaller green areas (<5,000 m2), they have greater environmental capacity to endure larger numbers of people and are potentially more accessible. These two characteristics are particularly important in high-density environments, such as Latin American cities.
To classify the selected public space in relation to their distinct spatial configuration of vegetation in the four cities, we identified functional categories according to the predominance of soil cover of in each public space (see Table 2).2 We used photointerpretation of high-resolution QuickBird satellite images obtained in Google Earth Pro and complemented it with. Google Street View for detailed verification.
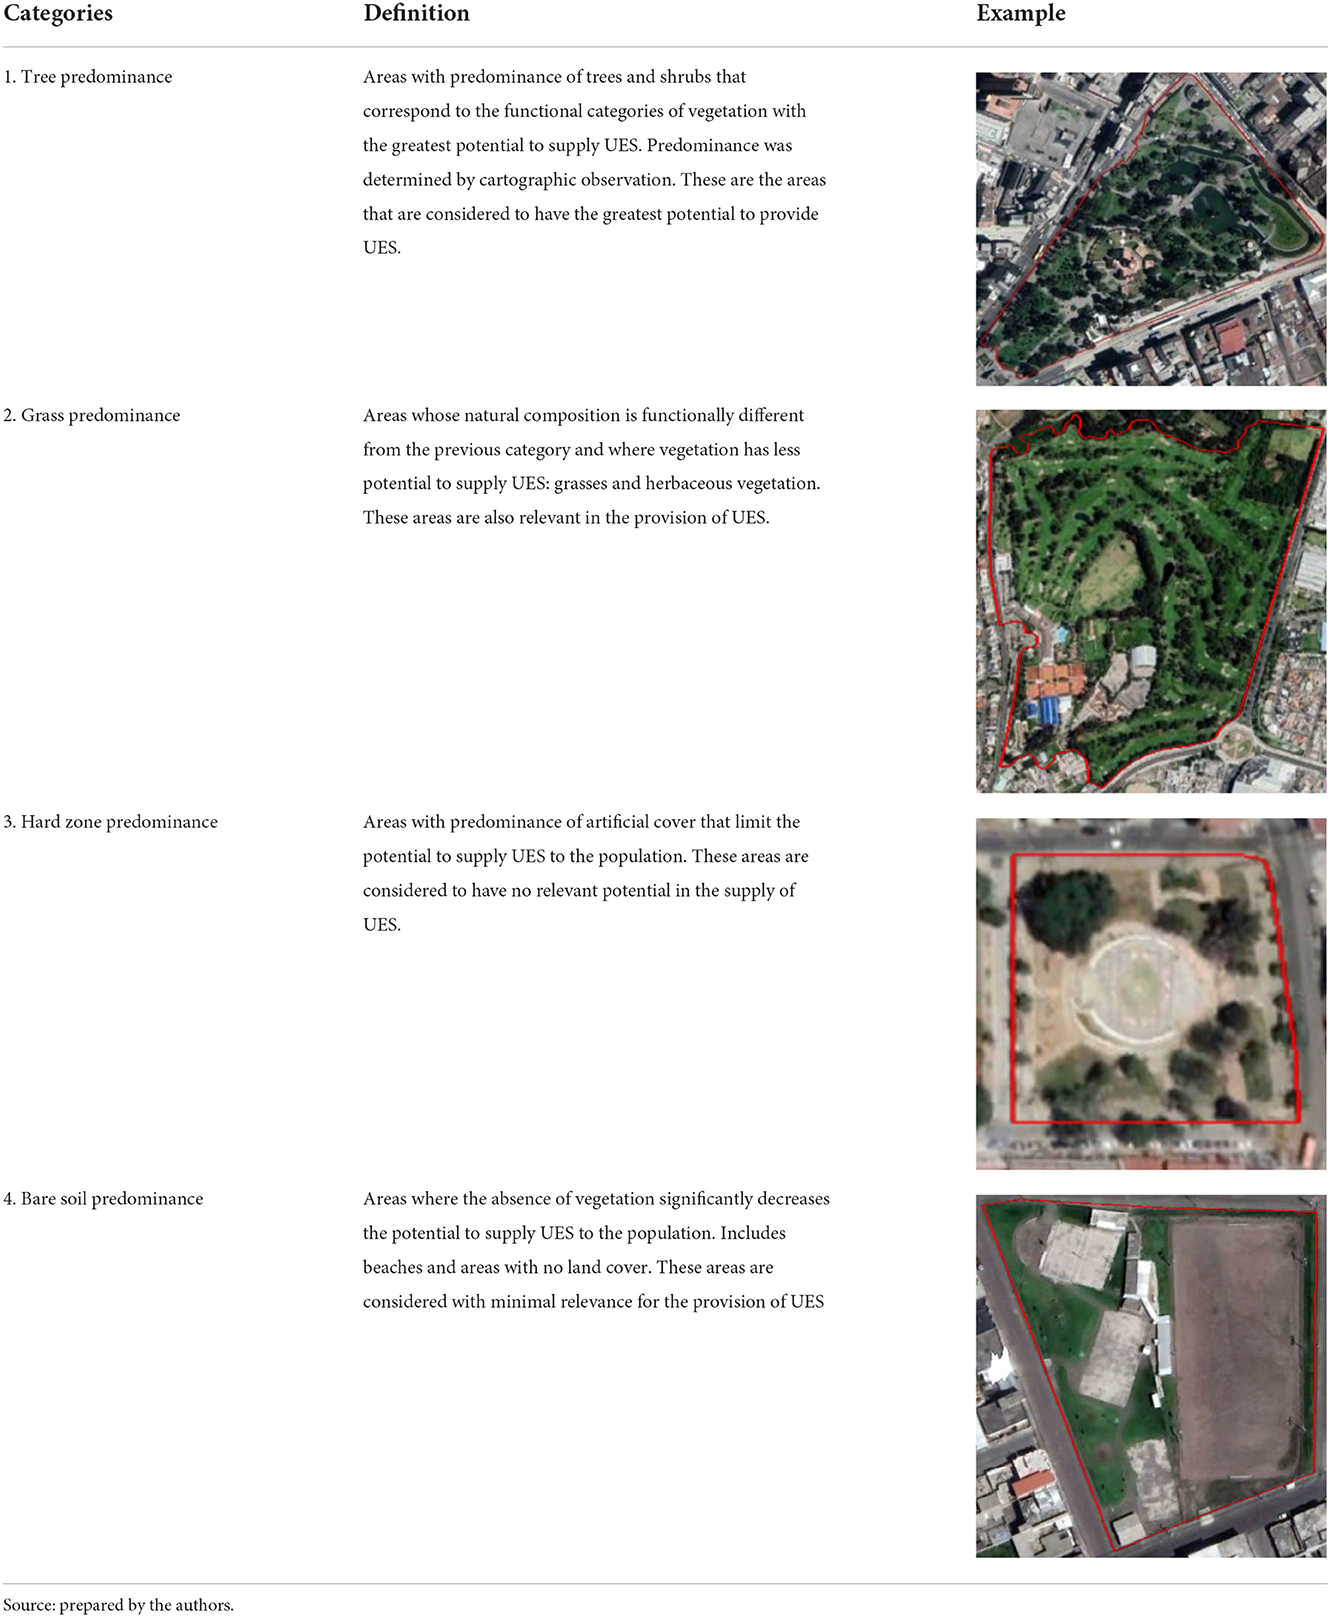
Table 2. Functional categories of public space.
Data sources and techniques
We used official sources of information for all four cities. In Medellín, we used data on public spaces, green areas, and road networks available in the 2014 Territorial Plan (POT)3 and the data updated by Cárdenas et al. (2020). In both Colombia cities: Medellín and Cartagena, we used demographic data available in the 2018 Census (DANE, 2018) and calculated the density of inhabitants per hectare we used population data at block scale. In Quito, we obtained data on public spaces, green areas, and the road network from the Geoportal of the Open Government of Quito (Alcaldia de Medellin, 2021). We use demographic data from the 2010 Census (INEC, 2010). Due to lack of official data at block scale, we calculated population density by neighborhood units. In Cartagena de Indias, we obtained data on public spaces and green areas obtained from the 2001 Territorial Plan (POT), and we updated it based on the information available at the Interactive Map of Cartagena (Alcaldia Mayor de Cartagena de Indias, 2021). In Valparaíso, we used public green areas identified in the Geoportal of the Ministry of Housing and Urban Planning (Ministerio de Vivienda y Urbanismo de Chile, 2021) and demographic data and road network compiled by the 2017 Census (INE, 2017). To calculate density, we used population data at block scale (smallest unit of analysis).
Analysis of accessibility to public spaces and urban green spaces
For the accessibility analysis, we used the Network Analysis feature from ArcGIS 10.8. We built a Geodatabase including public space classified by category, census data by the smallest unit analysis available in each city, and the road network. We calculated commute time of the population on foot and under normal conditions with an average speed of 4.5 km/h (Stepniak and Goliszek, 2017; Rojas et al., 2020). Given the distinct geographical and topographic conditions in each city, we incorporated the variable slope in the road network to estimate changes on pedestrian speed in relation to the topographic characteristic (Post et al., 2009; León and March, 2016) using an ALOS PALSAR Digital Elevation Model (DEM)4 (Figure 2). This information shows that reduced walking speed is not only common in mountain cities but also in coastal cities with hills, such as Valparaíso.
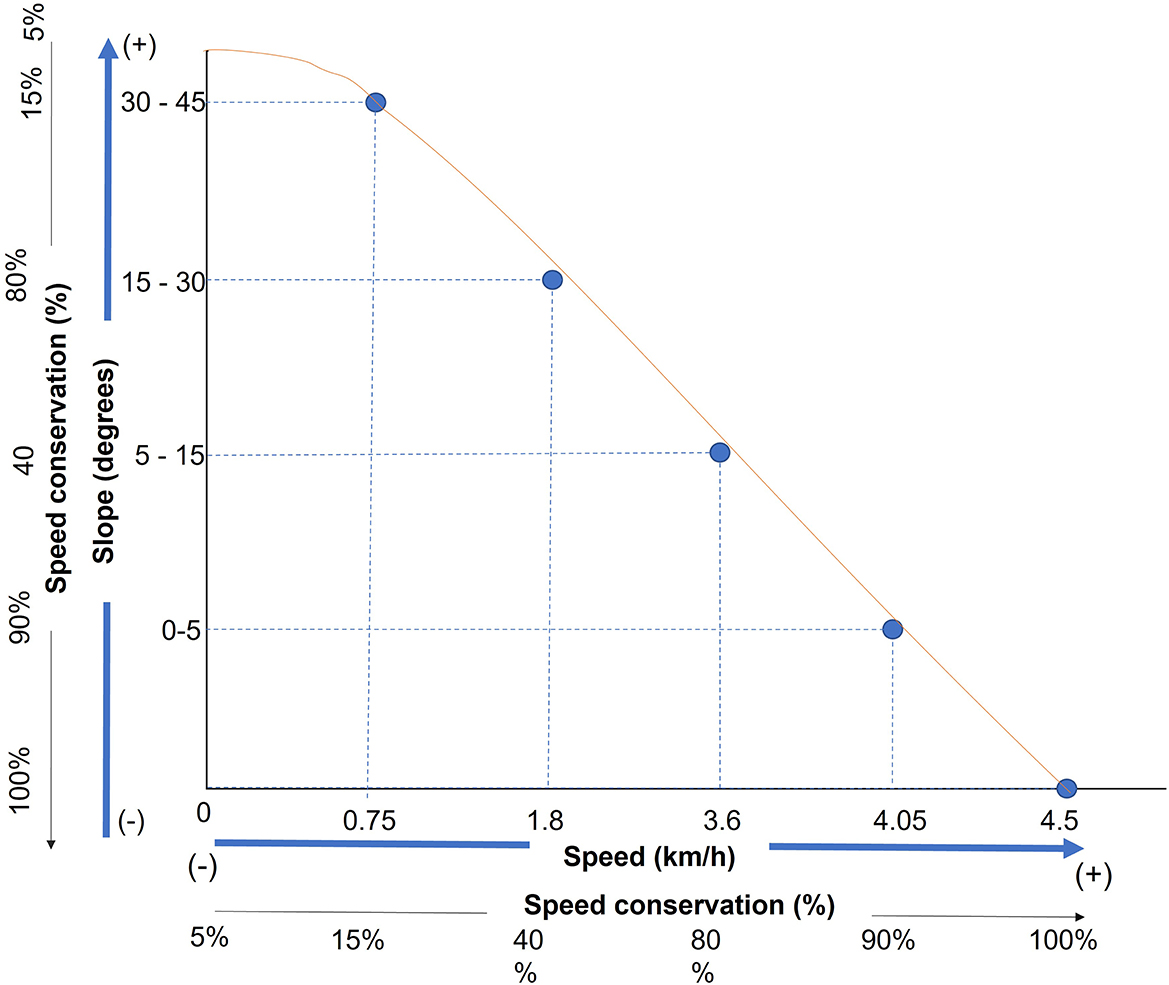
Figure 2. Decrease in travel speed estimated by changes slope. Source: Prepared by the authors based on Post et al. (2009).
The accessibility analysis was performed for all selected public spaces but presented separately for urban green areas (UGA), categories 1 (tree predominance) and 2 (grass predominance), which have greater potential to provide UES. We estimated the number of people with access to all public space and UGA in thresholds of 5 min using Kriging spatial interpolation This interpolation is a statistical model that includes autocorrelation, that is, the statistical relationships between the measured points, in the case of study related to accessibility times. In addition to its ability to produce prediction surface, it also provides measurements of certainty and accuracy of predictions. The resulting maps were cross-referenced with the maps of population densities. To compare differences of accessibility to public spaces and to UGA among the four cities, we performed a Kruskal–Wallis non-parametric analysis (Spurrier, 2003; Seefeld and Linder, 2007; Romero Villafranca and Zunica Ramajo, 2020). This analysis was complemented with Dunn's test to determine the difference between the four functional categories of public space in each city. Figure 3 presents a summary of our accessibility analysis.
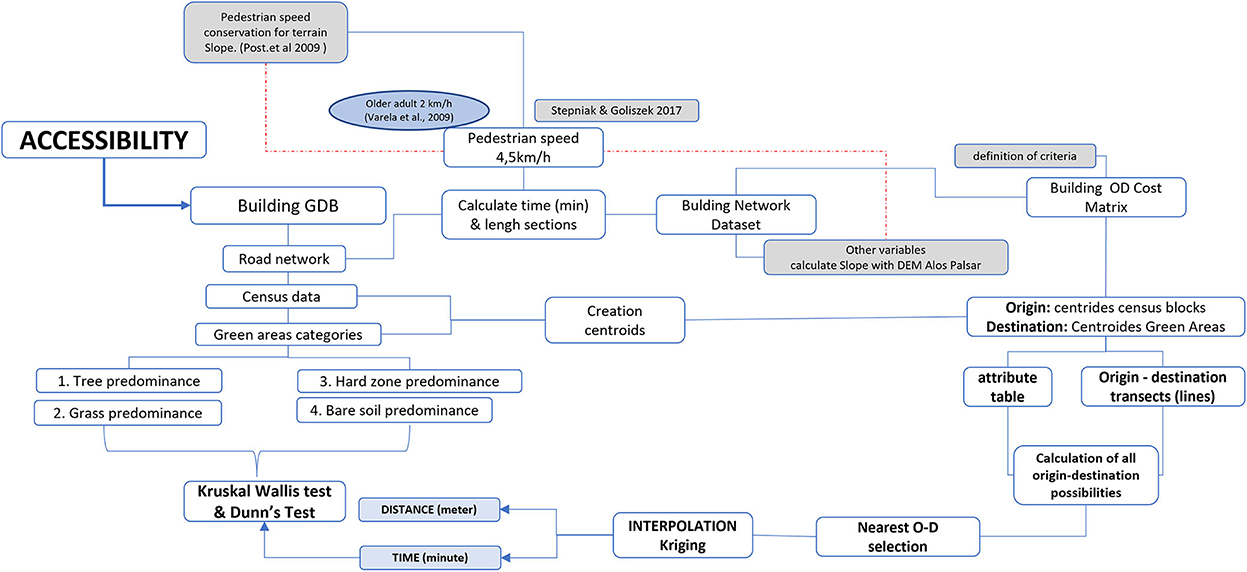
Figure 3. Summary of the accessibility analysis. Source: Prepared by the authors.
Results
This section presents the spatial distribution of public spaces, the spatial distribution of population densities, and the results of the accessibility analysis. In the latter, we differentiate between coastal and mountain cities to identify possible effects of topography on accessibility. We also separate the analysis into functional categories of public space that relate to the potential supply of UES.
Spatial distribution of public spaces in the four cities
In Medellín, public spaces are evenly distribution throughout the city, although a greater spatial concentration is observed in the western area where important open spaces such as the Atanasio Girardot Sports Unit, El Volador Hill, and Nutibara Hill are located. Public spaces occupy approximately 8% of the urban area (837 ha), but these include large areas corresponding with the “guardian” hills and the linear parks along the streams that drain toward the Medellín river that crosses the city from south to north (Figure 4A). Similarly, in Quito, public spaces are also distributed throughout the city and occupy approximately 10% of its urban area (1890 ha). The largest areas located in the north and center correspond with large parks, such as Bicentennial, Carolina, El Sena, the Panecillo Forest, and the Machángara River Park (Figure 4B).
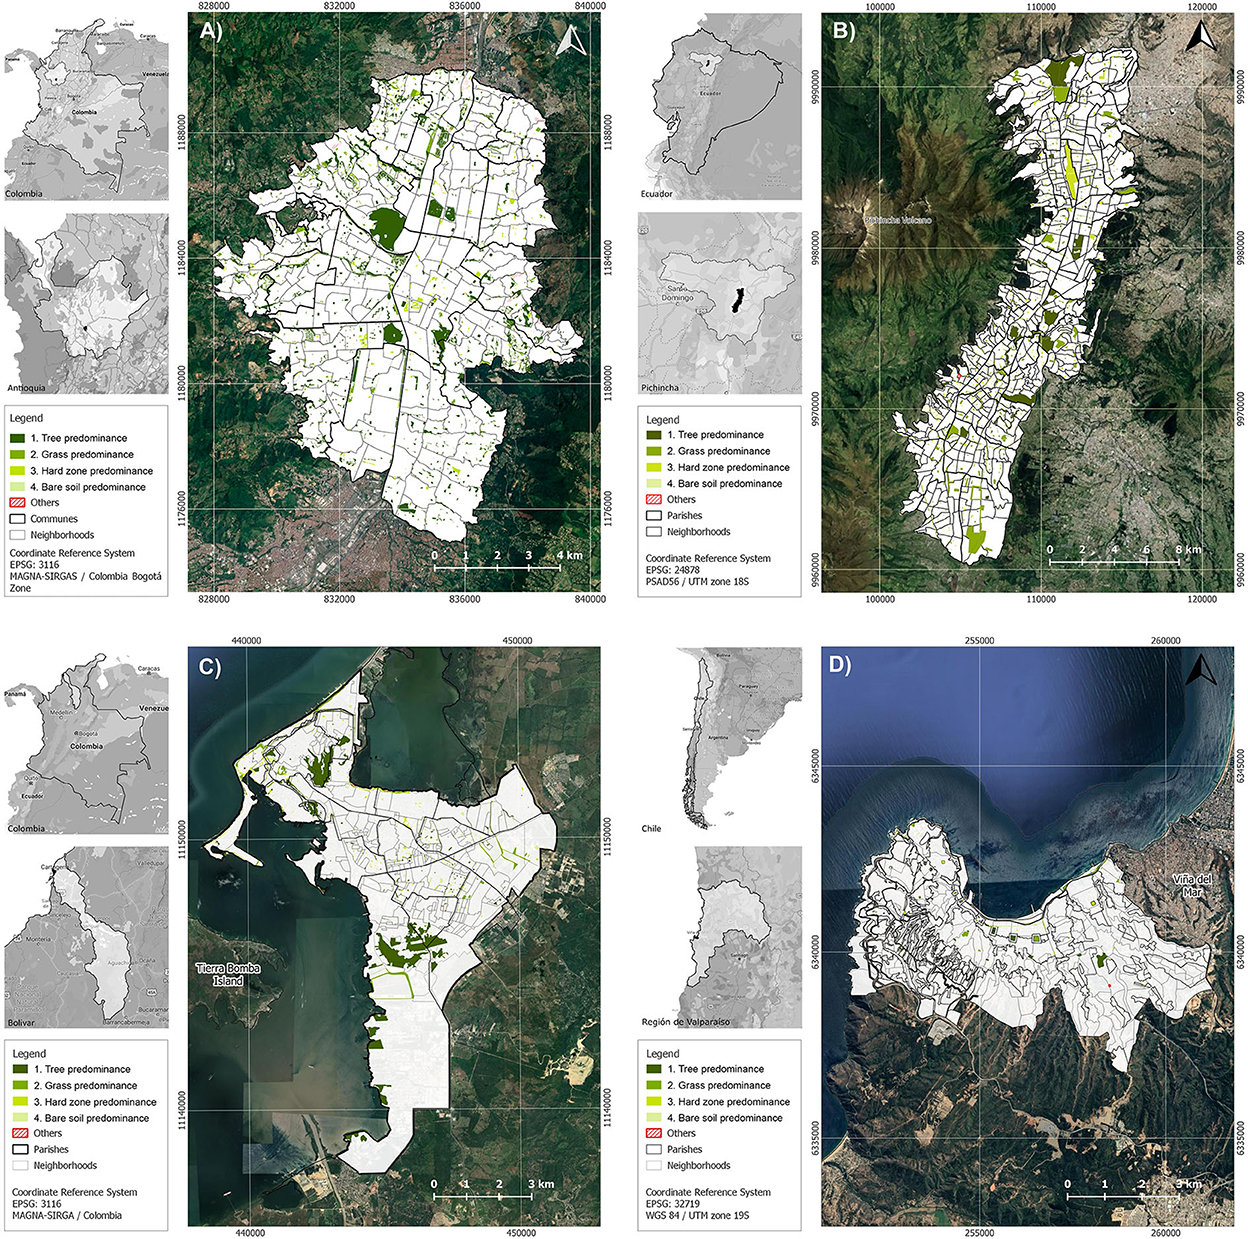
Figure 4. Categorized public spaces: Medellín (A), Quito (B), Cartagena (C), and Valparaíso (D). Source: Prepared by the authors based on (Decreto 0977 de, 2001; Acuerdo 48 de, 2014; Cárdenas et al., 2020; Alcaldia de Medellin, 2021; Alcaldia de Quito, 2021b; Alcaldia Mayor de Cartagena de Indias, 2021; Ministerio de Vivienda y Urbanismo de Chile, 2021).
Based on the functional categories assigned to public space, 79% of Medellin's public spaces correspond to category 1 (tree predominance) indicating a significant prevalence of this category over the others. The remaining 21% is divided in 10% in category 2 (grass predominance), 6% in category 4 (hard zone predominance), and 5% in category 4 (bare soil predominance). Considering this distribution, approximately 90% of public space in Medellin has a high potential for direct provision of UES (categories 1 and 2). In contrast, in Quito, there is no prevalence of one of the categories. However, categories 1 and 2 (with 42 and 41%, respectively) represent 83% of the public spaces which translated into high potential for direct provision of UES. In Quito, categories 3 and 4 have a significant lower representation (16 and 0.6%, respectively) than in Medellín.
In Cartagena and Valparaíso, the spatial distribution of public spaces presents significant differences by category. Two areas with large vegetal cover stand out in Cartagena, the Albornoz hills, and the Ciénaga Las Quintas. These are both are considered protected areas. Cartagena also has important public spaces along the coastline (Figure 4C). Overall, public spaces correspond to 8% of its urban area (627 ha). In contrast to the other three cities, Valparaiso stands out for the scarcity of public spaces. Only 1% of the urban area (approximately 33 ha) is considered public space. These correspond to a few parks, a beach, and some squares located along the Pedro Montt Avenue (Figure 4D).
Regarding the functional categories of the public spaces, Cartagena has approximately 69% of public spaces in category 1, 11% in category 2, 7% in category 3, and 13% in category 4. This distribution shows an important percentage of public space with predominance of the natural elements which suggest potential for direct provision of UES (categories 1 and 2). In Valparaíso, only 38% of public space are in category 1 29% category 2 which adds to 67% of all public space with higher potential for direct provision of UES. While this percentage does not seem significantly different from the other three cities, it is important to remember that in Valparaiso, only 1% of the urban area corresponds to public spaces. Categories 3 and 4 correspond to 14 and 19%, respectively.
Population densities in each city studied
A look at the population densities in the four cities (Figure 5) helped us to complement the analysis of distribution of public spaces by assessing the relation between availability of public space and population. In the four cities, more than half of the urban area corresponds low density areas [<180 people per hectare (pph)]. However, in Quito, Cartagena, and Valparaíso, this density range represents more than 70% of the area (72, 79, and 80%, respectively), while in Medellín it represents only 54%. In contrast, the mean densities (between 180 and 480 pph) are much more similar in the four cities, between 18 and 25% of their total area. The proportion of areas with high population densities (between 480 and 840 pph) presents a much more marked contrast. For example, 14.5% of Medellín's urban area correspond with high density while Cartagena only 4.5% and Quito 2.6%. In Valparaíso, high-density areas barely occupy 1% of the urban territory.
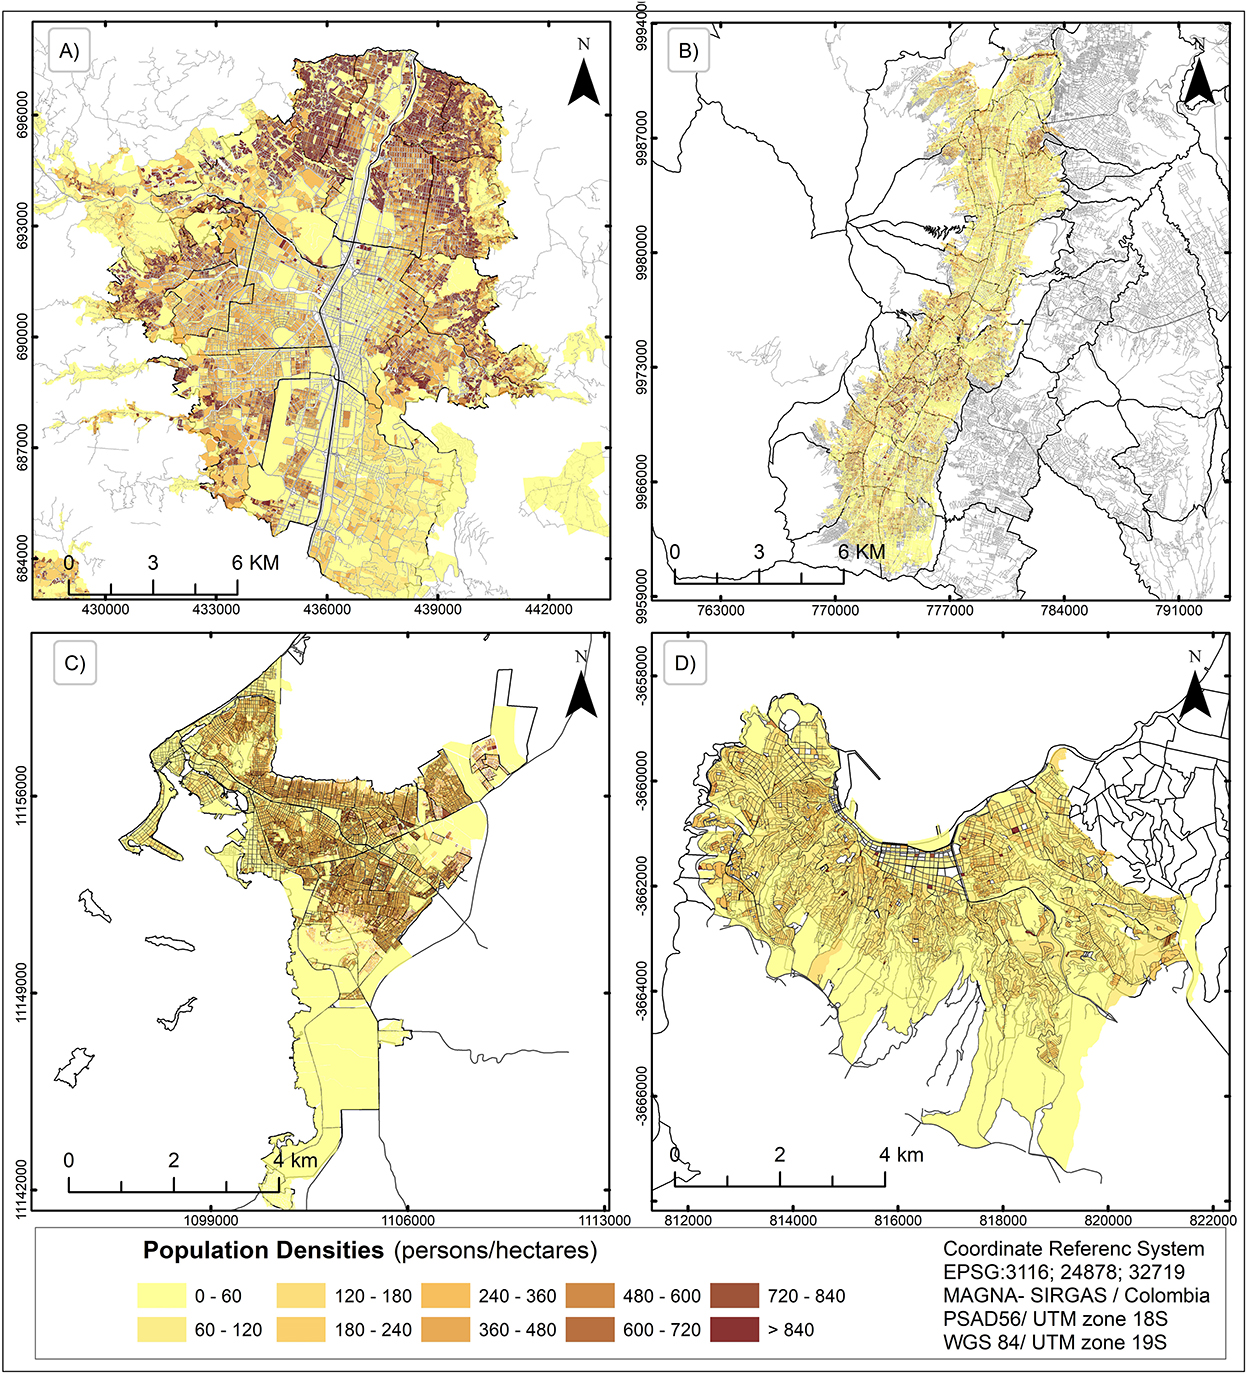
Figure 5. Population density: Medellín (A), Quito (B), Cartagena (C), and Valparaíso (D). Source: Prepared by the authors based on (INEC, 2010; INE, 2017; DANE, 2018).
While Medellín stands out for highest concentration of population (7% of its urban area has population densities >840 pph) in Quito, the other mountain city, we found four census blocks with more than 100,000 pph. Although these densities represent <1% of the city area, in absolute terms, these values that exceed, by far, the higher densities of the other four cities. In contrast, the areas with very high densities in Cartagena and Valparaíso are not representative since their total is almost zero.
Accessibility results
In the four cities, the population was included as a parameter to assess the degree of accessibility to public spaces. We present the results of accessibility to all public space of more than 5000m2 (categories 1, 2, 3, and 4) as well as UGA (Categories 1 and 2). Assessing accessibility to all public spaces is important because of the multiple benefits of proximity to public spaces (Rigolon, 2016; Rojas et al., 2020) including improving the living conditions of the population and health in general (Enssle and Kabisch, 2020). However, a separate observation of accessibility to UGA allows us to determine differential access to areas with potential for direct provision of UES, particularly of cultural and regulatory types. Benefits from direct provision may include reduction of heat islands, reduction of pollutants, scenic beauty, sport in contact with nature, among others (Young, 2010; Elderbrock et al., 2020). It is important to note that, although UGA potentially offer more ES than other categories of public space, the diversity, quantity, and quality of specific ES depend on the structural diversity of the vegetation present in each place.
This selected analysis of public spaces allows us to observe changes in the access of the population to spaces with greater capacity to provide ES in urban areas. As expected, by reducing the analysis to UGA (categories 1 and 2), areas and population with accessibility to these two categories are significantly reduced, especially in coastal cities. The detailed analysis below distinguishes between mountain and coastal cities. This distinction helps us to see differences in accessibility to public spaces and UGA in diverse topographies.
Mountain cities present high accessibility to public spaces. As shown in Figure 6, more than 60% of the total area in Medellin and Quito are under 15-min walk to a public space. In Medellin (Figure 6A), this percentage reaches 62%, much higher than the 8% located more than 30-min walking distance. The remaining 30% of the city is between 15- and 30-min walk to a public space. In Quito (Figure 6C), accessibility to public spaces increases significantly with 75% of the city located <15 min away from these areas and only 5% of the urban area at more than half an hour from a public space. The remaining 20% corresponds to range intermediate range of 15–30-min walk. In terms of population, this means that in Medellín, 4.6% of the population is located more than 30 min away from a public space and 76.8% live within 15-min walking distance. These results are similar in Quito, where only 4.1% of people are more than 30 min away and 81.4% are <15 min away from a public space.
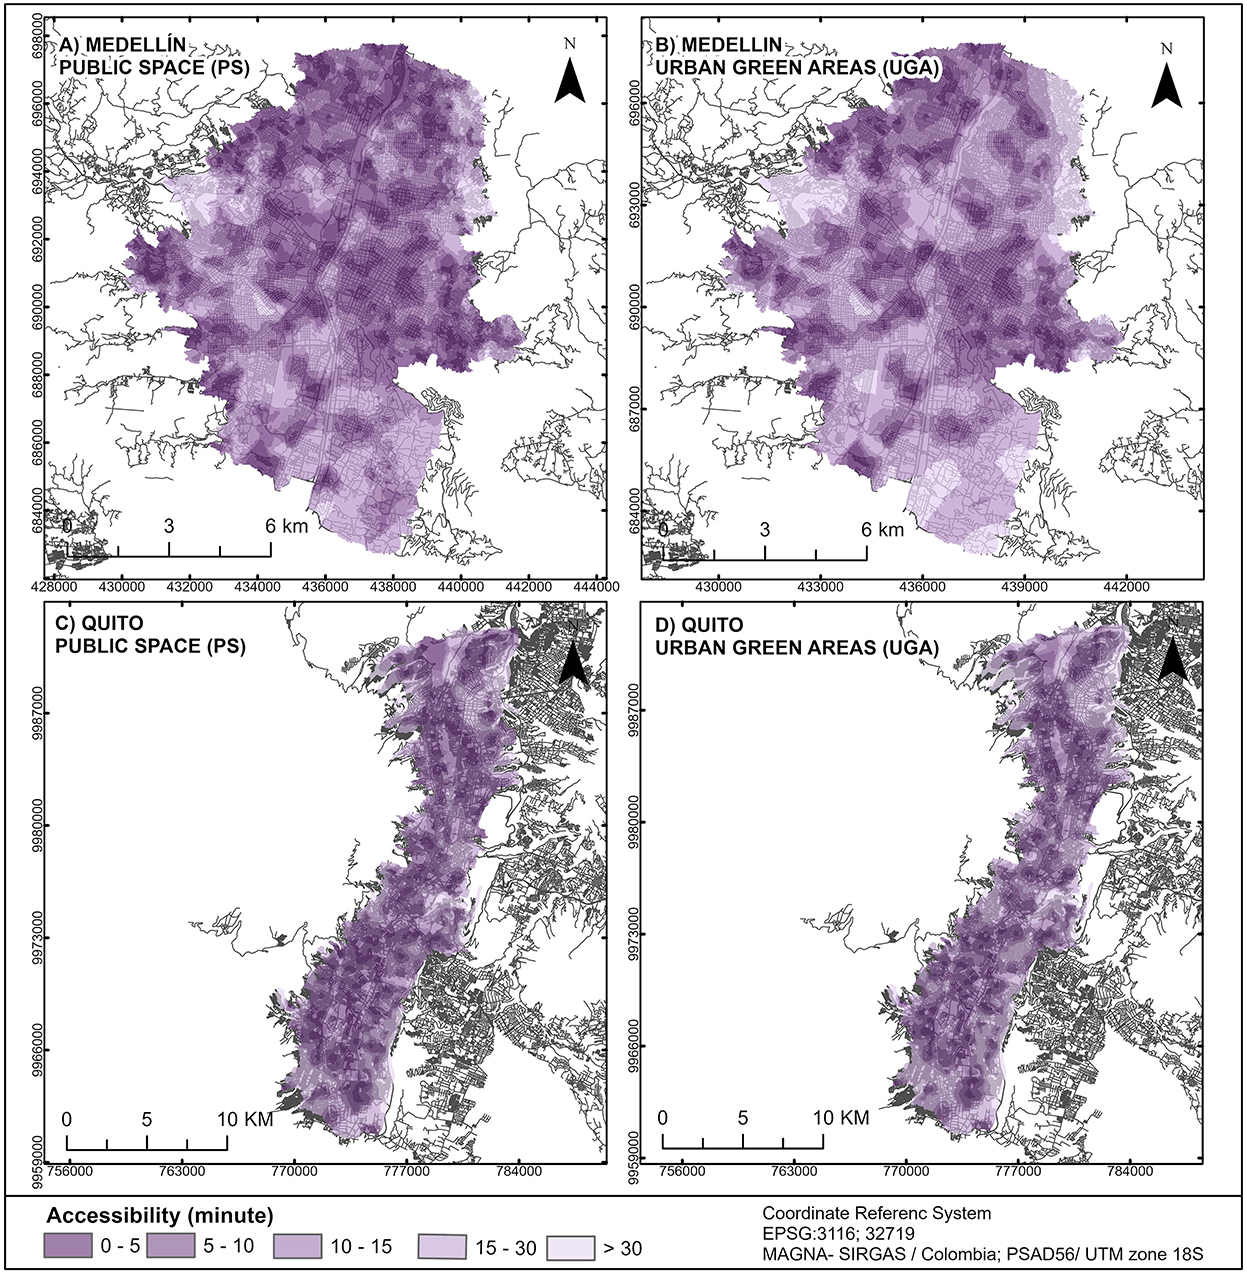
Figure 6. Accessibility to public spaces (left) and to UGA (right) in walking distance [minutes]: Medellin (A,B) and Quito (C,D), respectively. Source: Prepared by the authors.
Focusing the analysis on UGA (categories 1 and 2), there is better accessibility to areas with a trees and grass predominance in Quito with 65% of the city at <15 min on foot from any UGA (Figure 6D). This suggests that a significant percentage of population is more likely to access the UES associated with these areas. In Medellín, this percentage is reduced to 58% of the city area (Figure 6B). In terms of population, this variation translates into 70% of people living in Quito having access to any given UGA within <15-min walking distance vs. 73.8%, in the city of Medellín.
In the coastal cities, the differences between public spaces and UGA were also significant; therefore, it is difficult to assume any incidence of topography in the accessibility to these spaces. In Cartagena, 74% of the urban area is located <15-min walking distance from a public space, very similar to results from mountain cities. In contrast, in Valparaíso, only 22% of the city is <15-min walking distance from any given public space. Areas within 15- to 30-min walking distance to any public space present important but not dramatic differences in these two cities, with 20 and 33%, respectively. Finally, the area with access within more than 30 min to any public space shows a huge difference in these cities with 5% in Cartagena and 45% in Valparaíso (Figures 7A–C). In terms of population, these data suggest that 43% of the population in Valparaiso is located more than 30 min away from any public space. In Cartagena, only 3% of the population is located within this range, compared to 74% of the population that can access any public space in <15 min.
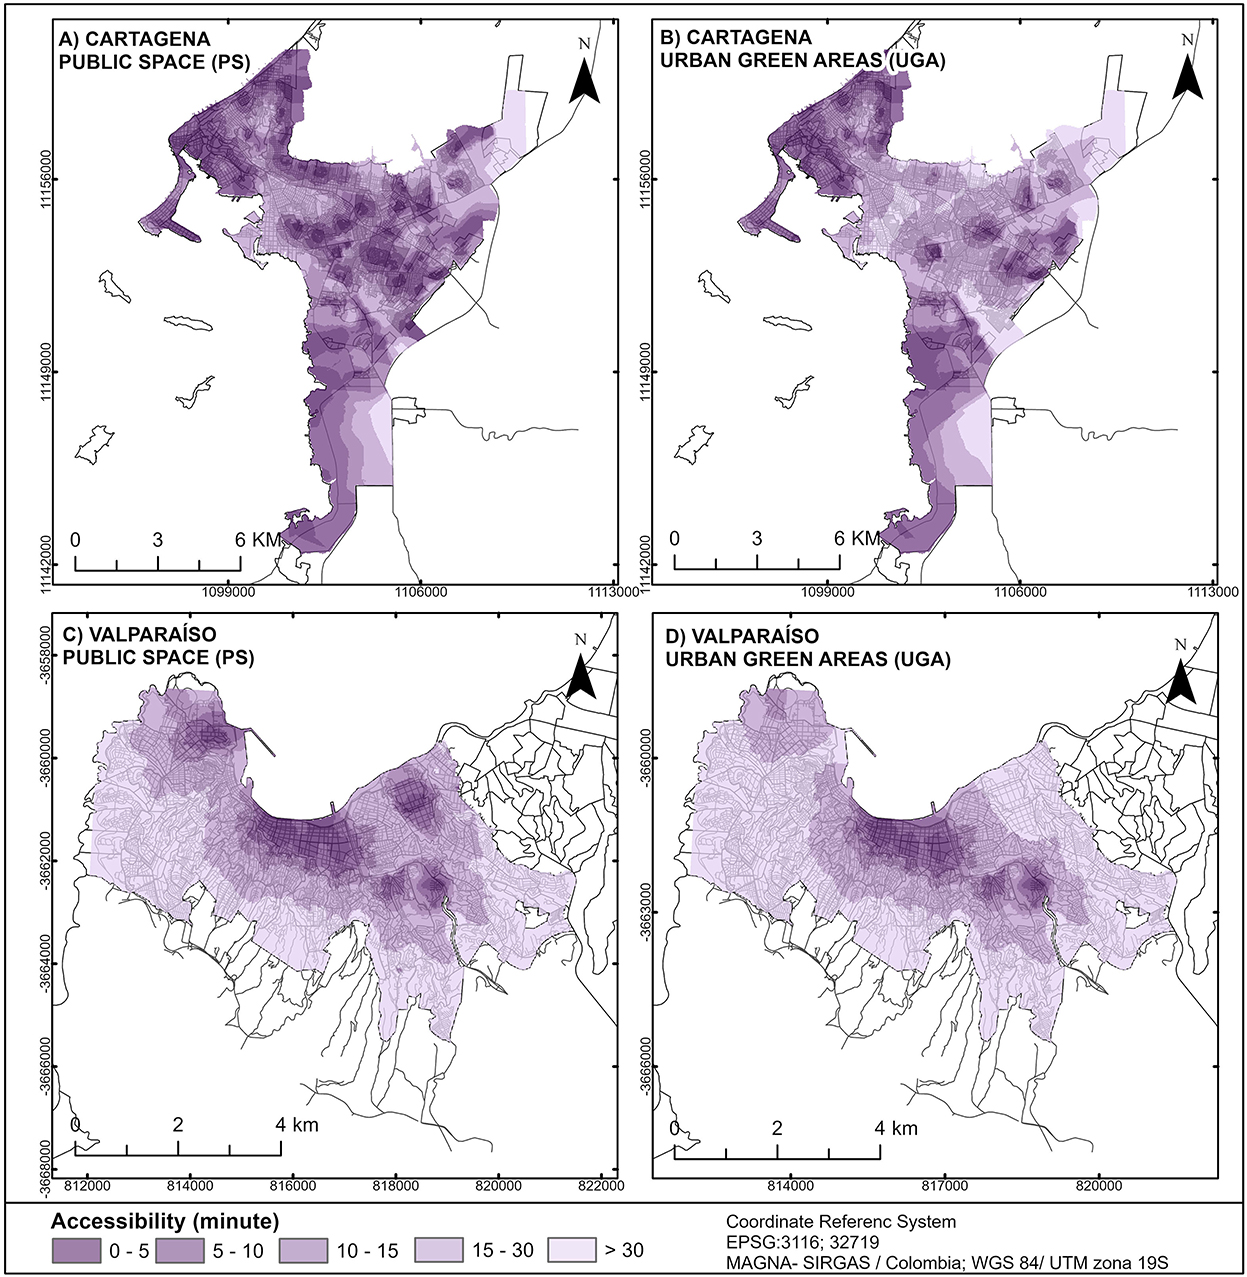
Figure 7. Accessibility to public spaces (left) and to UGA (right) in walking distance [minutes]: Cartagena (A,B) and Valparaiso (C,D), respectively. Source: Prepared by the authors.
Accessibility to UGA (categories 1 and 2) decreases significantly in the two cities. In Cartagena, 50% of the city has access to UGA within 15-min walking distance, while in Valparaíso this percentage reaches only 14% (Figures 7B–D). This result marks one of the main differences between the mountain cities and the coastal cities analyzed. In mountain cities, an important number of public spaces correspond to categories 1 and 2, while in coastal cities this percentage decreases significantly. This could be related to the fact that public spaces in coastal cities often correspond to the beaches or the immediate areas around them.
Comparative results
When comparing the ranges of time needed to access public spaces and UGA in the four cities (Figure 8), we found that for the 0- to 5- and 5- to 10-min ranges, access to all public spaces is greater than to UGA in all four cities. However, in Medellín, Quito, and Valparaiso, the differences are smaller than in Cartagena. This does not mean that accessibility to public spaces is similar in these three cities. As data show, in Valparaiso <15% of the population has access to public space and to an UGA between 0- and 10-min walking distance. This analysis also shows that there are cases in which access to UGA is greater than to all public spaces, but most frequently in accessibility ranges over 15 min (Medellín, Quito, and Cartagena). In Quito, this greater accessibility to UGA is also present in the range of 10 to 15 min. In Valparaiso, greater access to UGA only happens for ranges over 30-min walking distance.
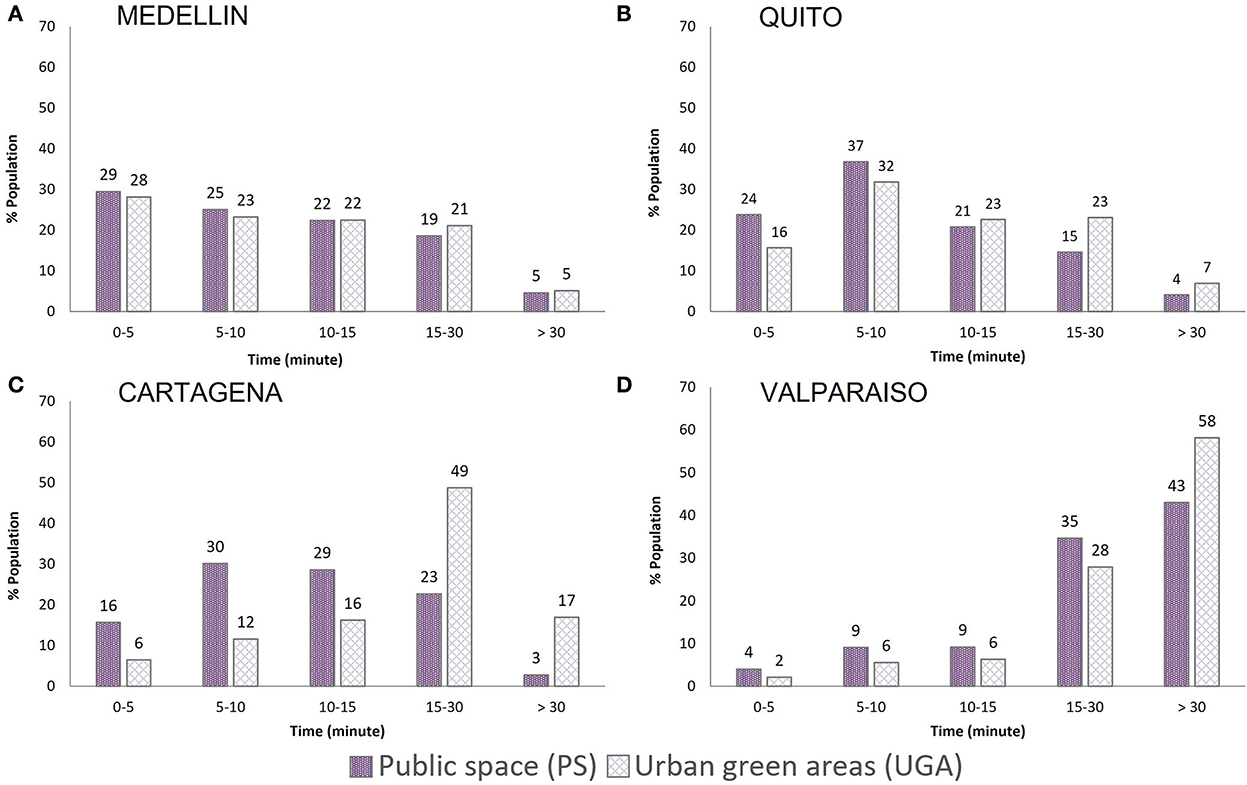
Figure 8. Percentage of population with access to public spaces and UGA: Medellín (A), Quito (B), Cartagena (C), and Valparaíso (D). Sources: Prepared by the authors.
This comparison shows that, in general, UGA are less accessible than public spaces; however, it also shows the differences in accessibility to UGA are less critical in the two mountain cities. In Medellín, particularly, an important percentage of population concentrates evenly in the ranges between 0 and 15 min. This is true also for Quito but here the highest percentage of population concentrate on the range between 5 and 10 min. These conditions change considerably for the two coastal cities, Cartagena and Valparaiso where the greater percentage of the population concentrates in the higher time ranges 15 to 30 min and over 30 min, with Valparaíso being the worst case.
To visualize the distribution of data described previously, we created a box plot (Figure 9) that shows differences between the four cities. With this visualization, we identified very dissimilar values and numerous outliers in the four functional categories. For mountain cities, the distributions have a low degree of dispersion and similar accessibility (similar medians, maximums, and minimums) in the first three categories. For coastal cities, the level of dispersion in all categories is higher. This demonstrates that there is greater spatial dispersion of UGA in coastal cities compared to mountain cities, which in turn increases the travel time needed to access any given UGA.
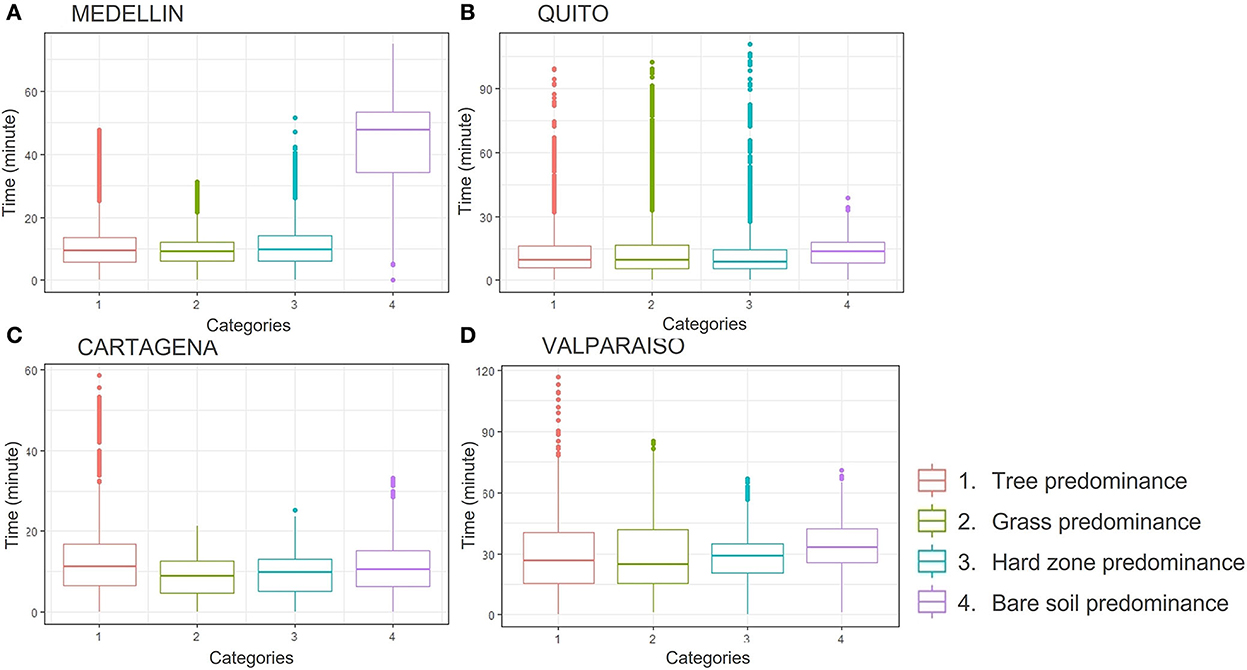
Figure 9. Accessibility by time ranges to public spaces and UGA: Medellín (A), Quito (B), Cartagena (C), and Valparaíso (D). Sources: Prepared by the authors.
To verify the previous results and to determine whether accessibility was different for four different UGA groups for each city, we conducted a Kruskal–Wallis H test. The test showed that there was a statistically significant difference in accessibility between the four groups in each city (Table 3). To complement this analysis and identify the difference between categories in each city, we conducted a Dunn test (Table 4).
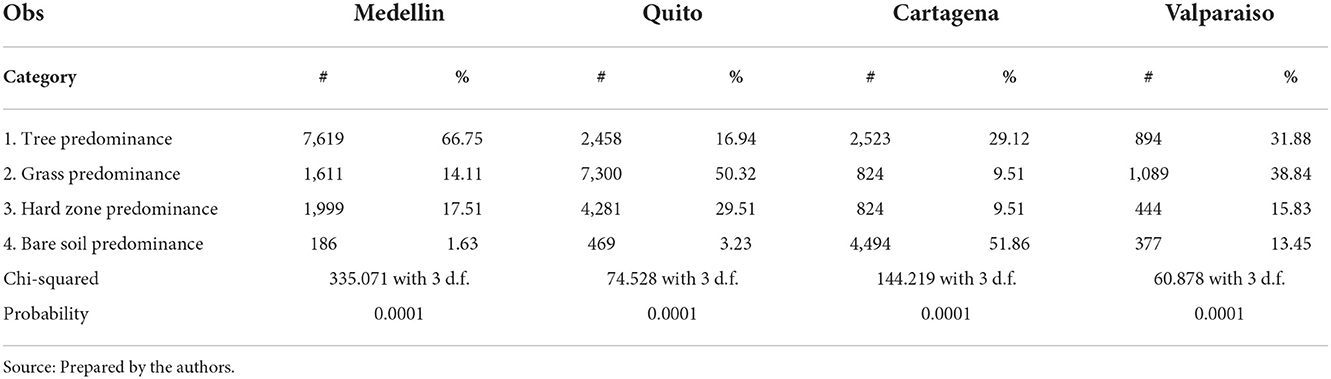
Table 3. Kruskal–Wallis H test for the four cities.
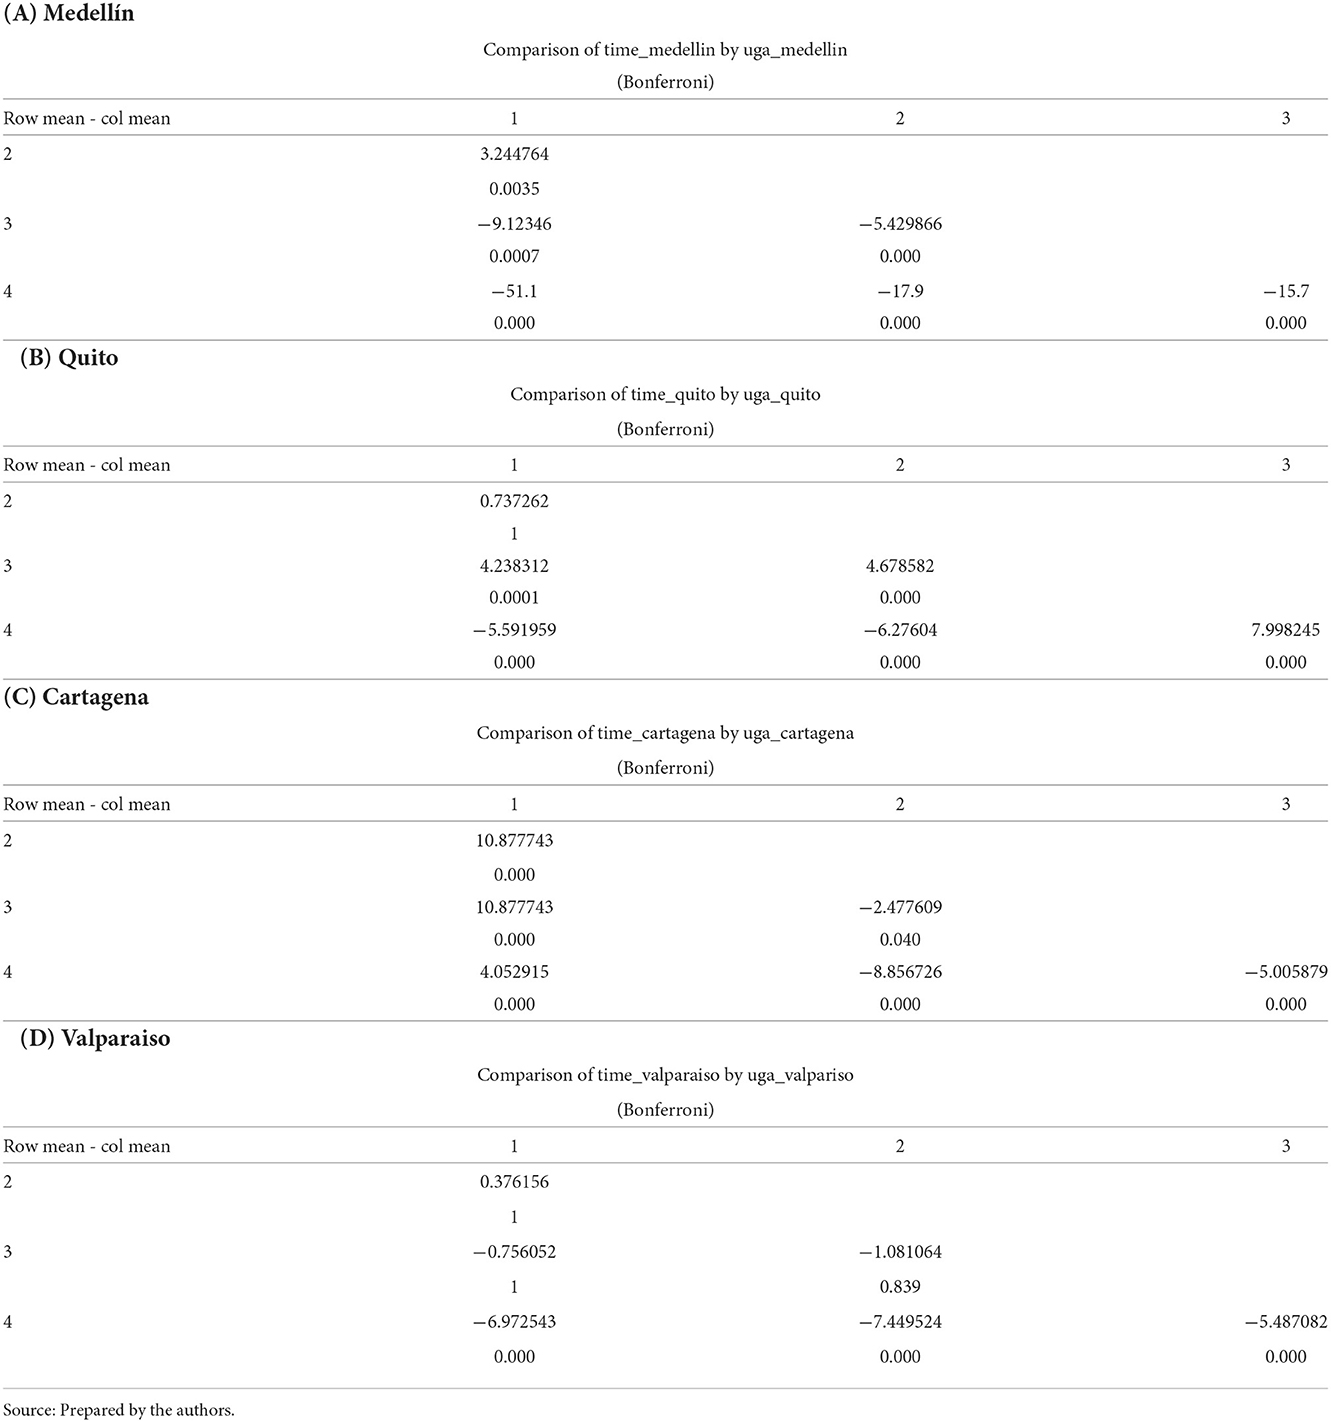
Table 4. Dunn's test for each city: Medellín (A), Quito (B), Cartagena (C), and Valparaíso (D).
These tests showed that in:
Medellín χ2(3, 11415) = 335.071, p < 0.0001; times were lower in the 2 category (Md = 8.96313) in comparison with the categories 1 (Md = 9.26915), 3 (Md = 9.74587), and 4 (Md = 47.5179).
Quito χ2(3, 14508) = 74.528, p < 0.0001; times were lower in the category 3 (Md = 8.698445) in comparison with the categories 1 (Md = 9.371748), 1 (Md = 9.530901), and 4 (Md = 13.31409).
Cartagena χ2(3, 8665) = 144.219, p < 0.0001; times were lower in the category 2 (Md = 9.039655) in comparison with the categories 3 (Md = 9.756983), 4 (Md = 10.49462), and 1 (Md = 11.27312).
Valparaiso χ2(3, 2804) = 60.878, p < 0.0001; times were lower in the category 2 (Md = 24.88799) in comparison with the categories 1 (Md = 26.70816), 3 (Md = 28.74393), and 4 (Md = 33.04135).
In contrast with the other three cities, in Valparaiso the evidence shows that there is no difference in the levels of accessibility between categories 1 and 2; 1 and 3; and 1 and 4.
Discussion
We have argued that considering distribution of, and accessibility to, public spaces with different greening characteristics is key to understand the potential of public space as providers of UES that can be enjoyed directly by the population. The literature has pointed out that UES contributes to physical and mental health (Jennings et al., 2016; Vidal et al., 2021) and potentially to social cohesion (Jennings and Bamkole, 2019; Dobbs et al., 2021; Luca et al., 2021). However, realizing these benefits depends to a great extent on conditions of accessibility. Our results show significant differences in accessibility to public spaces with different greening characteristics in four cities studied, that is, for each of the urban green areas in the cities and for each of the functional types analyzed (Categories 1, 2, 3, and 4) inside them. We found that in three of the four cities, more than three-fourth of the population is located within a15-min walking distance to some public space. This proportion indicates progress in terms of integration of these are key elements into the urban fabric. However, this progress is not evenly distributed in the city and is not present in all cities. We cross-referenced the patterns of accessibility with densities and found that the most densely populated areas are precisely the ones more distant to any given UGA and, therefore, the ones with most limited access to the UES potentially provided by these spaces.
For example, in Medellín and Quito, the majority of the population is <10-min walking distance from a public space which offers advantages in terms of improving quality of life, wellbeing, and environmental conditions (Martínez-Valdés et al., 2020; Rojas et al., 2020). In Cartagena and Valparaiso, distances to public spaces and UGA are greater, resulting in less access to the direct UES potentially provided by these spaces. Understanding these differences is important to inform urban policy striving to increase the potential provision of UES through public space and to unlock the environmental benefits associated with public spaces. At city level, a homogenous distribution of public space with structural diversity of the vegetation helps improve urban quality of life by diminishing pollutants and environmental noise, regulating temperature, among others (Pulighe et al., 2016). At social level, accessibility to these spaces ensures that the population realizes the resulting benefits to health, wellbeing, and social development (Jennings et al., 2016; Enssle and Kabisch, 2020; Vidal et al., 2021). This is particularly important in the Latin American urban context commonly characterized by dense urban areas and unplanned and spontaneous urbanization practices (Dobbs et al., 2018) with important deficiencies in terms of social and environmental infrastructures.
In Cartagena and Valparaiso, the two coastal cities, we observed that greater access to public spaces coincides with the most touristic areas, where there is also low population density. This indicates that this space is oriented toward visitors rather than local residents. In these cities, geographical and environmental conditions make the sea and beaches more visible than other natural elements, such as urban green. While more research would be needed to explore the potential of these spaces as providers of ES, these cities could consider the role that UGA and vegetation can play in terms of wellbeing and environmental quality. In contrast, in the mountain cities of Medellin and Quito, we saw a larger and more homogenous distribution of UGA. Accessibility, however, always diminishes considerably in peripheral areas. This could be related to the geographical location of mountainous cities and their environmental conditions, which effectively facilitate the presence of vegetation in these cities. However, it also could also be related to the management and implementation capacity of Medellin and Quito, two large Latin American cities that are committed to improve quality of life and promote sustainable development.5 Mountain cities can continue to strengthen their capacities to transform their territories by implementing nature-based solutions and other urban planning strategies addressing adaptation to climate change and resilience-building.
While the presence, proportion, structural diversity, and composition of vegetation within the public space and UGA are central to the potential offer of UES (De la Barrera et al., 2016), accessibility to these spaces in the city is determinant for their direct enjoyment. For example, access to spaces for sports and recreation can help release stress, contact with nature may influence individuals' state of tranquility, in addition being in nature is highly valued by the population (Misiune et al., 2021). However, even if many urban inhabitants have access to an UGA, not everyone will be able to enjoy their benefits to the same extent and with the same quality. Since the potential delivery of UES is limited to the number of people that can occupy a given space at the same time (Wei et al., 2015), it is important that local governments commit to increase the quantity and improve the quality of UGA. In addition, an extended and consistent distribution of UGA provides links to the peri-urban and rural environments of the cities, which guarantees better ecological conditions of the green infrastructure. Ensuring the continuity of the green infrastructures also ensures long-term benefits and a wider potential provision of UES in future.
If cities conceive and deliver networks of interconnected planned UGA, where diverse structural vegetation and native species are included, spatial and functional connectivity is provided, and accessibility is guaranteed, we will be moving toward more sustainable urban futures. However, as we have shown, there are cities and sectors within cities where UGA are located more than a 30-min walking distance which limits the opportunities of their population to have adequate direct access to UES potentially provided by these spaces. Many times, this adds to the precarious conditions of urban sector that already present greater deficit of urban services, greater environmental issues, and greater challenges to ensure quality of life and wellbeing for their inhabitants. Giving the lack of nearby public spaces, many cities have resorted to measures such as temporarily changing the use of streets to carry out sports or recreational activities, provision of pocket parks that in small residual areas, etc. Though important to improving quality of life, these alternatives do not provide UES because they are not associated with a natural offering (Gasca Moreno and Ávila Quijas, 2020; Rojas et al., 2020).
Ensuring widespread accessibility to public spaces and UGA is also a matter of equity. While high-income sectors can more easily access diverse ES associated with private natural areas, such as clubs, natural areas in residential complexes, etc.; most low-income sectors are forced to travel greater distances to access the UES potentially provided by some public spaces (Liu et al., 2021). Similarly, private green areas and non-public reserves are, de facto, sources of UES that provide ecological connectivity and bring benefits associated with ES of regulation obtained mainly through spatial transfer. However, they cannot offer the direct relation and potential UES that UGA provide to society. These situations show the importance of planning the provision of UES. Not only they can contribute to improving quality of life and promoting equity, but also support climatic adaptation for more sustainable cities.
Beyond the importance of planning, cities face the complexity of securing the production of UGA in densely populated and highly urbanized cities. This is very important in Latin America where access to UES in general is determined to a large degree by localization and income. As pointed out by Reyes Päcke and Figueroa Aldunce (2010), in Latin America, quality UGA are mostly located in high-income sectors or planned zones where spaces for these uses have been strategically reserved. In contrast, areas consolidated through informal and unplanned processes have typically bypass the provision of public spaces and green areas and even disregard restrictions of occupation in protected areas, such as riparian corridors. In the end, one of the greatest challenges for sustainable development in Latin American cities is to provide vegetated spaced and green areas capable of offering UES that will improve quality of life for people and environmental quality for the entire city. Facing this challenge requires long-term actions and planning committed to sustainability.
While our analysis focuses on the mobility of the population as means to access UES, it is worth noting that UES are not static and motionless. Spatial transfer of ES provided by UGA could supply areas beyond their physical boundaries that, without producing these services, receive their benefits (Fernández, 2019). This means that it is possible for the urban population of a sector to get some benefit from UGA without direct access to them. However, this transfer will depend on the physical condition of each UGA (area, shape, quantity, quality, and ecological connectivity of its vegetation), the distances to which the areas benefited are located, but, above all, of the functional type of vegetation (Fernández, 2019; Vidal et al., 2021). As regulating ES are among those that have higher possibilities of spatial transfer to indirect beneficiaries, planning natural elements within public spaces could strengthen the potential supply of these UES. Cultural ES, on the contrary, can only be received through direct access to the non-material benefits of nature. Therefore, ensuring its provision becomes essential to improve these services for citizens.
This study shows that associating UES to specific UGA requires very detailed information on various attributes that are complex to verify at city scale. However, at this scale, it is not possible to generalize about species, spatial arrangements, densities, or areas of vegetation required to supply one or more UES. Further research about increasing the potential provision of UES can include more detailed information about various dimensions that can strengthen comprehensive planning of the urban greening, for example, evaluation of land-use policies for provision of UGA and regulations about protection of areas with environmental value; studies about potential reintroduction of native species with floristic diversity and alternatives to establish internal and external ecological connections that could improve the supply of UES.
Some ways to improve the accessibility to UGA is to make them integral component of public space and environmental policies, to include them in climate actions and resilience plans, and to consider them when developing sustainable and active mobility strategies. For example, strategies such as the 15-min city (Moreno et al., 2020) propose public spaces as core service that need to be close to any residence, not always discussing their potential role in the provision of UES through adequate vegetation and green areas. Conceiving and planning public spaces as potential suppliers of UES is consistent with environmental principles of ecological connectivity, social principles of quality of life and wellbeing, and principles of active mobility. It is an opportunity to move toward a more sustainable urban development where a compact and diverse urban form (De la Barrera et al., 2016; Rodriguez-Valencia and Ortiz-Ramirez, 2021) meet the urgent needs of climate adaptation (Masson-Delmotte et al., 2021) and social equity.
UES is particularly important for those who have fewer resources and live in high density where public spaces are scarce. Our results show that cities, in general, are moving in the right direction to provide public space to the population. However, it is still necessary to increase provision and nearby access to UGA, particularly in the coastal cities. More detailed analysis of accessibility to different types of public space would be necessary to determine potential direct provision of UES based on functional categories. These analyses could be complemented with more precise data about environmental characteristics of these spaces and the actual ES associated with such characteristics. We believe that this line of research has a 2-fold potential. On the one hand, it opens the debate about the need for a more equitable provision of direct UES through public spaces. On the other hand, more evidence about UGA as providers of UES could inform urban planning and policy processes and help advance cities commitment with a more green, sustainable, and resilient urban future.
Concluding Remarks
Access to public space for leisure and recreation, and access to UGA are essential for the improvement of the wellbeing of the inhabitants (Loftness et al., 2009). Improving accessibility to UGA is an urgent task for sustainable urban planning (Barbosa et al., 2007; Gupta et al., 2016) and a way to ensure a distribution of the UGA that is equitable and connected with diverse natural elements both inside and outside the city. Governments should consider increasing the provision of green public spaces and promoting equal access to them to improve the wellbeing of the population. Yet, increasing the opportunities to enjoy a healthy environment also requires a better distribution of land uses and planning process committed to sustainability that considers alternative ways to ensures direct access ES in urban context.
We identified three limitations, mainly related to the methodology: (1) the sources of observation are limited only to the information provided by the satellite images available in Google Earth; (2) the classification of typologies of public spaces using satellite images does not permit detail sorting of the spatial configuration and composition of the functional types of vegetation; (3) It is not possible to be certain about current state of the urban infrastructure that was used for accessibility analyses; and (4) date of data on population varies broadly and is dependent on official census.
Overall, this work shows the importance of conceiving and planning public space as direct providers of UES. This requires rethinking the multifunctional role of these spaces, considering the provision, diverse configuration, and spatial distribution of the green elements within these spaces; and incorporating nature-based solutions in their design. The provision of UES is an important feature to improve environmental quality and positively impact people's health and wellbeing. Cities cannot continue relying solely on the UES provided by the peri-urban and rural areas. They must work to ensure the provision of UES on a small scale through public spaces that are accessible to all the urban population and that are connected to wider environmental networks contributing to our territorial sustainability.
Data availability statement
This study used publicly available datasets for the territorial analysis. For Valparaiso was retrieved from IDE Chile: https://www.ide.cl/index.php/informacion-territorial/descargar-informacion-territorial and Minvu: https://ide.minvu.cl/. For Medellin from https://www.medellin.gov.co/geomedellin/index.hyg. For Cartagena we retrieved data from https://midas.cartagena.gov.co. For Quito we retrieved data from Quito Geoportal, this website is not currently available online but all data retrieved will be made available by the authors, without undue reservation. For demographic data we use official census data. For Valparaiso, such data is available at https://www.ine.gob.cl. For Medellin and Cartagena, at https://www.dane.gov.co. For Quito, we use data from the 2010 Census (INEC, 2010). Due to lack of official data at block scale, we calculated population density by neighbourhood units. All information about the data is available in the manuscript.
Author contributions
CM-T, NV, FJ, and MC contributed to conception and design of the study. FJ organized the database, designed the accessibility analysis, and produced most cartography. TG-O completed the mapping and classification of all public spaces and produce some cartography. CM-T and MC wrote the first draft of the manuscript. CM-T, NV, FJ, MC, and TG-O wrote sections of the manuscript. CM-T and NV revised and complete the manuscript, read, and approved the submitted version. All authors contributed to the article and approved the submitted version.
Acknowledgments
We thank Juan Felipe Ortega Sapuyes, Mara Alejandra Abril Rendón, Yissel Natalia Gaviria Palacino, Juan David Franco, and Dave Boutcher.
Conflict of interest
The authors declare that the research was conducted in the absence of any commercial or financial relationships that could be construed as a potential conflict of interest.
Publisher's note
All claims expressed in this article are solely those of the authors and do not necessarily represent those of their affiliated organizations, or those of the publisher, the editors and the reviewers. Any product that may be evaluated in this article, or claim that may be made by its manufacturer, is not guaranteed or endorsed by the publisher.
Footnotes
1. ^The maximum yield that a given land cover can eventually have to supply a specific ES (Burkhard et al., 2012).
2. ^While one or more functional categories may be present in each public space, the category is assigned based on the predominant category.
3. ^POT stands for Plan de Ordenamiento Territorial in Spanish. This is the official land use and territorial planning instrument used by local governments in Colombia.
4. ^ALOS PALSAR DEM, from the Japan Aerospace Exploration Agency (JAXA), is one of the cartographic resources available to access spatial elevation information. In this case, the Hi-Res Terrain Corrected option 12.5 m was used. Download link https://search.asf.alaska.edu/#/.
5. ^Medellin, for example, is international known for its efforts in neighbourhood upgrading and the recovery of key environmental elements of the city such as the river and the occupied creeks. Quito recently committed to bring nature and society together through the redesign of public spaces and the reconfiguration of urban mobility in 55 km of the Avenida Panamericana Sur.
References
Acuerdo 027 de (2020). Available online at: http://concejodistritaldecartagena.gov.co/acuerdos-2020/ (accessed August, 2022).
Acuerdo 48 de (2014). Por medio del cual se adopta la revisión y ajuste de largo plazo del Plan de Ordenamiento Territorial del Municipio de Medellín y se dictan otras disposiciones complementarias, Acuerdo 48 (2014). Available online at: https://www.medellin.gov.co/irj/go/km/docs/pccdesign/SubportaldelCiudadano_2/PlandeDesarrollo_0_17/ProgramasyProyectos/Shared%20Content/Documentos/2014/POT/ACUERDO%20POT-19-12-2014.pdf (accessed August, 2022).
Alcaldia de Medellin (2021). GeoMedellin. Portal Geografico del Municipio de Medellin. Available online at: https://www.medellin.gov.co/geomedellin/index.hyg
Alcaldia de Quito (2021a). Gobierno Abierto, Sistema de Indicadores Distritales, Superficie de espacio público por habitante 2021. Gobierno Abierto Alcaldia de Quito. Available online at: http://sid.quito.gob.ec/SID.Front/ReporteIndicador?idIndicador=283 (accessed August, 2022).
Alcaldia de Quito (2021b). Quito Geoportal. Geoportal del Municipio del Distrito Metropolitano de Quito. Available online at: http://geoportal.quito.gob.ec/smiq/
Alcaldia Mayor de Cartagena de Indias (2021). MIDAS - Mapa Interactivo Digital de Asunto del Suelo. MIDAS. Available online at: https://midas.cartagena.gov.co
Bai, Y., and Guo, R. (2021). The construction of green infrastructure network in the perspectives of ecosystem services and ecological sensitivity: the case of Harbin, China. Global Ecol. Conserv. 27, e01534. doi: 10.1016/j.gecco.2021.e01534
Balvanera, P., and Cotler, H. (2007). Los servicios ecosistémicos y la toma de decisiones: retos y perspectivas. Gaceta Ecol. 84, 117–123. Available online at: https://www.redalyc.org/articulo.oa?id=53908512
Barber, A., Haase, D., and Wolff, M. (2021). Permeability of the city – physical barriers of and in urban green spaces in the city of Halle, Germany. Ecol. Indicators 125, 107555. doi: 10.1016/j.ecolind.2021.107555
Barbosa, O., Tratalos, J. A., Armsworth, P. R., Davies, R. G., Fuller, R. A., Johnson, P., et al. (2007). Who benefits from access to green space? A case study from Sheffield, UK. Landscape Urban Plan. 83, 187–195. doi: 10.1016/j.landurbplan.2007.04.004
Barral, M. P., and Oscar, M. N. (2012). Land-use planning based on ecosystem service assessment: a case study in the Southeast Pampas of Argentina. Agri. Ecosyst. Environ. 154, 34–43. doi: 10.1016/j.agee.2011.07.010
Botequilha-Leitão, A., and Díaz-Varela, E. R. (2020). Performance Based Planning of complex urban social-ecological systems: the quest for sustainability through the promotion of resilience. Sust. Cities Soc. 56, 102089. doi: 10.1016/j.scs.2020.102089
Burkhard, B., Kroll, F., Nedkov, S., and Müller, F. (2012). Mapping ecosystem service supply, demand and budgets. Ecol. Indic. 21, 17–29. doi: 10.1016/j.ecolind.2011.06.019
Camara Chilena de la Construcción (2018). Informe de Infraestructura Crítica para el Desarrollo 2018-2027. Camara Chilena de la Construcción. Available online at: https://cchc.cl/2018/icd (accessed August, 2022).
Cárdenas, M. F., Escobar, J. F., and Gutiérrez, K. (2020). Equidad territorial en Medellín: Espacio público, amenazas naturales y calidad del aire. Estudios Socioterritoriales. Rev. Geo. 27, 46. doi: 10.37838/unicen/est.27-046
Cartagena Como Vamos (2021). Informe de Calidad de Vida 2021 – Alertas de la Cartagena de Hoy. Alcaldía de Cartagena. Available online at: http://www.cartagenacomovamos.org/nuevo/wp-content/uploads/2021/09/Informe-Calidad-de-Vida-2021-Cartagena-C%C3%B3mo-Vamos.pdf (accessed August, 2022).
Chen, S., Wang, Y., Ni, Z., Zhang, X., and Xia, B. (2020). Benefits of the ecosystem services provided by urban green infrastructures: Differences between perception and measurements. Urban Forestry Urban Greening 54, 126774. doi: 10.1016/j.ufug.2020.126774
Chiabai, A., Quiroga, S., Martinez-Juarez, P., Higgins, S., and Taylor, T. (2018). The nexus between climate change, ecosystem services and human health: towards a conceptual framework. Sci. Total Environ. 635, 1191–1204. doi: 10.1016/j.scitotenv.2018.03.323
Chiabai, A., Quiroga, S., Martinez-Juarez, P., Suárez, C., García, D. E., Jalón, S., and Taylor, T. (2020). Exposure to green areas: Modelling health benefits in a context of study heterogeneity. Ecol. Econ. 167, 106401. doi: 10.1016/j.ecolecon.2019.106401
Constitucion Política de Ecuador (2008). Available online at: https://www.oas.org/juridico/pdfs/mesicic4_ecu_const.pdf
Costanza, R., D'Arge, R., Groot, D. E., Farber, R., Grasso, S., Hannon, M., et al. (1997). The value of the world's ecosystem services and natural capital. Nature 387, 253–260. doi: 10.1038/387253a0
Coutts, C., and Hahn, M. (2015). Green infrastructure, ecosystem services, and human health. Int. J. Environ. Res. Pub. Health 12, 9768–9798. doi: 10.3390/ijerph120809768
Cui, B., Boisjoly, G., El-Geneidy, A., and Levinson, D. (2019). Accessibility and the journey to work through the lens of equity. J. Trans. Geograph. 74, 269–277. doi: 10.1016/j.jtrangeo.2018.12.003
Daily, G. C. (1997). “Introduction: what are ecosystem services?” in Nature's Services: Societal Dependence on Natural Ecosystems, eds S. Postel, K. Bawa, L. Kaufman, C. H. Peterson (Washington, DC: Island Press), 1–10.
Daily, G. C., Polasky, S., Goldstein, J., Kareiva, P. M., Mooney, H. A., Pejchar, L., et al. (2009). Ecosystem services in decision making: time to deliver. Front. Ecol. Environ. 7, 21–28. doi: 10.1890/080025
DANE (2018). Censo Nacional de Población y Vivienda 2018, Colombia. Available online at: https://www.dane.gov.co/index.php/estadisticas-por-tema/demografia-y-poblacion/censo-nacional-de-poblacion-y-vivenda-2018 (accessed August, 2022).
De la Barrera, F., Reyes-Paecke, S., and Banzhaf, E. (2016). Indicators for green spaces in contrasting urban settings. Ecol. Indic. 62, 212–219. doi: 10.1016/j.ecolind.2015.10.027
Decreto 0977 de (2001). Available online at: https://vuc.cartagena.gov.co/documentos/normatividad/DECRETO_0977_de_2001.pdf (accessed August, 2022).
Dobbs, C., Hernández-Moreno, Á., Reyes-Paecke, S., and Miranda, M. D. (2018). Exploring temporal dynamics of urban ecosystem services in Latin America: the case of Bogota (Colombia) and Santiago (Chile). Ecol. Indic. 85, 1068–1080. doi: 10.1016/j.ecolind.2017.11.062
Dobbs, C., Vasquez, A., Olave, P., and Olave, M. (2021). “Cultural urban ecosystem services,” in Urban Ecology in the Global South, eds C. M. Shackleton, S. S. Cilliers, E. Davoren, and M. J. Du Toit (Berlin: Springer International Publishing), 245–264.
Dony, C. C., Delmelle, E. M., and Delmelle, E. C. (2015). Re-conceptualizing accessibility to parks in multi-modal cities: a Variable-width floating catchment area (VFCA) method. Landscape Urban Plann. 143, 90–99. doi: 10.1016/j.landurbplan.2015.06.011
Elderbrock, E., Enright, C., Lynch, K. A., and Rempel, A. R. (2020). A guide to public green space planning for urban ecosystem services. Land 9, 391. doi: 10.3390/land9100391
Enssle, F., and Kabisch, N. (2020). Urban green spaces for the social interaction, health and well-being of older people—An integrated view of urban ecosystem services and socio-environmental justice. Environ. Sci. Policy 109, 36–44. doi: 10.1016/j.envsci.2020.04.008
Fernández, I. C. (2019). A multiple-class distance-decaying approach for mapping temperature reduction ecosystem services provided by urban vegetation in Santiago de Chile. Ecol. Econ. 161, 193–201. doi: 10.1016/j.ecolecon.2019.03.029
Gasca Moreno, C. T., and Ávila Quijas, A. O. (2020). La ciudad y el espacio público: La diversidad fragmentada. Alteridades 59, 59. doi: 10.24275/uam/izt/dcsh/alteridades/2020v30n59/Gasca
Geurs, K. T., and Van Wee, B. (2004). Accessibility evaluation of land-use and transport strategies: review and research directions. J. Trans. Geo. 12, 127–140. doi: 10.1016/j.jtrangeo.2003.10.005
Gupta, K., Roy, A., Luthra, K., and Maithani, S. (2016). GIS based analysis for assessing the accessibility at hierarchical levels of urban green spaces. Urban Forestry Urban Green. 18, 198–211. doi: 10.1016/j.ufug.2016.06.005
Guzman, L. A., and Oviedo, D. (2018). Accessibility, affordability and equity: assessing ‘pro-poor’ public transport subsidies in Bogotá. Trans. Policy 68, 37–51. doi: 10.1016/j.tranpol.2018.04.012
Hernández Aja, A. (2009). Calidad de vida y medio ambiente urbano. Indicadores locales de sostenibilidad y calidad de vida urbana. Rev. INVI 24, 65. doi: 10.4067/S0718-83582009000100003
Horwitz, P., and Finlayson, C. M. (2011). Wetlands as settings for human health: incorporating ecosystem services and health impact assessment into water resource management. BioScience 61, 678–688. doi: 10.1525/bio.2011.61.9.6
Huang, L., Wu, J., and Yan, L. (2015). Defining and measuring urban sustainability: a review of indicators. Landscape Ecol. 30, 1175–1193. doi: 10.1007/s10980-015-0208-2
INE (2017). CENSO 2017. Productos estadísticos, demográficas y vitales Chile. Instituto Nacional de Estadísticas de Chile. Available online at: http://www.censo2017.cl/descargue-aqui-resultados-de-comunas/ (accessed August, 2022).
INEC (2010). Censo de población y vivienda 2010 Ecuador. Instituto Nacional de Estadísticas y Censos. Available online at: https://www.ecuadorencifras.gob.ec/base-de-datos-censo-de-poblacion-y-vivienda-2010/ (accessed August, 2022).
INEC (2018). Reporte de pobreza y desigualdad. Instituto Nacional de Estadística y Censos. Available online at: https://www.ecuadorencifras.gob.ec/documentos/web-inec/POBREZA/2018/Junio-2018/Informe_pobreza_y_desigualdad-junio_2018.pdf
Jaung, W., Carrasco, L. R., Richards, D. R., Shaikh, S. F. E. A., and Tan, P. Y. (2022). The role of urban nature experiences in sustainable consumption: A transboundary urban ecosystem service. Environ. Dev. Sust. 4, 1–21. doi: 10.1007/s10668-021-02071-y
Jaung, W., Carrasco, L. R., Shaikh, S. F. E. A., Tan, P. Y., and Richards, D. R. (2020). Temperature and air pollution reductions by urban green spaces are highly valued in a tropical city-state. Urban Forestry Urban Green. 55, 126827. doi: 10.1016/j.ufug.2020.126827
Jennings, V., and Bamkole, O. (2019). The relationship between social cohesion and urban green space: an avenue for health promotion. Int. J. Environ. Res. Public Health 16, 452. doi: 10.3390/ijerph16030452
Jennings, V., Larson, L., and Yun, J. (2016). Advancing sustainability through urban green space: cultural ecosystem services, equity, and social determinants of health. Int. J. Environ. Res. Pub. Health 13, 196. doi: 10.3390/ijerph13020196
Jin, J., and Paulsen, K. (2018). Does accessibility matter? Understanding the effect of job accessibility on labour market outcomes. Urban Stud. 55, 91–115. doi: 10.1177/0042098016684099
Langemeyer, J., Gómez-Baggethun, E., Haase, D., Scheuer, S., and Elmqvist, T. (2016). Bridging the gap between ecosystem service assessments and land-use planning through multi-criteria decision analysis (MCDA). Environ. Sci. Policy 62, 45–56. doi: 10.1016/j.envsci.2016.02.013
Le Texier, M., Schiel, K., and Caruso, G. (2018). The provision of urban green space and its accessibility: Spatial data effects in Brussels. PLoS ONE 13, e0204684. doi: 10.1371/journal.pone.0204684
León, J., and March, A. (2016). An urban form response to disaster vulnerability: improving tsunami evacuation in Iquique, Chile. Environ. Plann. Design 43, 826–847. doi: 10.1177/0265813515597229
Levine, J., Grengs, J., and Merlin, L. A. (2019). From Mobility to Accessibility: Transforming Urban Transportation and Land-Use Planning. Ithaca, NY: Cornell University Press.
Li, X. (2014). Planning City Green Space Locations For Public Access: A Capacitated Location-Allocation Modeling Approach [Doctor of Philosophy, Cornell University]. Available online at: https://ecommons.cornell.edu/handle/1813/38949?show=full (accessed August, 2022).
Liu, D., Kwan, M. P., and Kan, Z. (2021). Analysis of urban green space accessibility and distribution inequity in the city of Chicago. Urban Forestry Urban Green. 59, 127029. doi: 10.1016/j.ufug.2021.127029
Liu, O. Y., and Russo, A. (2021). Assessing the contribution of urban green spaces in green infrastructure strategy planning for urban ecosystem conditions and services. Sust. Cities Soc. 68, 102772. doi: 10.1016/j.scs.2021.102772
Loftness, V., Aziz, A., Choi, J., Kampschroer, K., Powell, K., Atkinson, M., et al. (2009). The value of post-occupancy evaluation for building occupants and facility managers. Int. Buildings Int. 1, 249–268. doi: 10.3763/inbi.2009.SI04
Logsdon, R. A., and Chaubey, I. (2013). A quantitative approach to evaluating ecosystem services. Ecol. Modelling 257, 57–65. doi: 10.1016/j.ecolmodel.2013.02.009
Lonsdorf, E. V., Nootenboom, C., Janke, B., and Horgan, B. P. (2021). Assessing urban ecosystem services provided by green infrastructure: golf courses in the Minneapolis-St. Paul metro area. Landscape Urban Plann. 208, 104022. doi: 10.1016/j.landurbplan.2020.104022
Luca, D. E., Langemeyer, C., Vano, J., Baró, S. F., and Andersson, E. (2021). Adaptive resilience of and through urban ecosystem services: A transdisciplinary approach to sustainability in Barcelona. Ecol. Soc. 26, art38. doi: 10.5751/ES-12535-260438
Martínez-Valdés, V., Silva Rivera, E., and González Gaudiano, E. J. (2020). Parques urbanos: un enfoque para su estudio como espacio público. Intersticios Soc. 19, 67–86. doi: 10.55555/IS.19.277
Masson-Delmotte, V., Zhai, P., Pirani, A., Connors, S. L., Péan, C., Berger, S., et al. (2021). Summary for policymakers. In Climate Change 2021: The Physical Science Basis. Contribution of Working Group I to the Sixth Assessment Report of the Intergovernmental Panel on Climate Change. Cambridge: Cambridge University Press.
Medellín Como Vamos (2018). Informe de Calidad de Vida 2018. Available online at: https://www.medellincomovamos.org/informe-de-calidad-de-vida-de-medellin-2018 (accessed August, 2022).
Medellín Como Vamos (2020). Informe de Calidad de Vida 2020. Available online at: https://www.medellincomovamos.org/system/files/2021-09/docuprivados/Documento%20Informe%20de%20Calidad%20de%20Vida%20de%20Medell%C3%ADn%202020.pdf (accessed August, 2022).
Ministerio de Vivienda y Urbanismo de Chile (2021). GeoportalMinvu. Available online at: https://ide.minvu.cl
Misiune, I., Julian, J. P., and Veteikis, D. (2021). Pull and push factors for use of urban green spaces and priorities for their ecosystem services: Case study of Vilnius, Lithuania. Urban Forestry Urban Greening 58, 126899. doi: 10.1016/j.ufug.2020.126899
Moreno, C., Wykes, T., Galderisi, S., Nordentoft, M., Crossley, N., Jones, N., et al. (2020). How mental health care should change as a consequence of the COVID-19 pandemic. Lancet Psychiatry 7, 813–824. doi: 10.1016/S2215-0366(20)30307-2
Municipalidad de Valparaiso (2019). Plan de Desarrollo Económico 2019-2030. Available online at: https://web.municipalidaddevalparaiso.cl/municipio/pladeco/ (accessed August, 2022).
Nelson, E., Mendoza, G., Regetz, J., Polasky, S., Tallis, H., Cameron, D. R., et al. (2009). Modeling multiple ecosystem services, biodiversity conservation, commodity production, and tradeoffs at landscape scales. Front. Ecol. Environ. 7, 4–11. doi: 10.1890/080023
Niedzielski, M. A., and Eric Boschmann, E. (2014). Travel time and distance as relative accessibility in the journey to work. Annal. Assoc. Am. Geo. 104, 1156–1182. doi: 10.1080/00045608.2014.958398
Observatorio Social (2015). Encuesta de caracterización socioeconómica nacional CASEN Region de Valparaiso. Gobierno de Chile, Ministerio de Desarrollo Social. Available online at: http://observatorio.ministeriodesarrollosocial.gob.cl/storage/docs/fichas-regionales/2015/Valparaiso.pdf (accessed August, 2022).
Oviedo, D. (2021). Making the links between accessibility, social and spatial inequality, and social exclusion: a framework for cities in Latin America. Adv. Trans. Policy Plann. 8, 135–172. doi: 10.1016/bs.atpp.2021.07.001
Pereira, R. H. M. (2019). Future accessibility impacts of transport policy scenarios: equity and sensitivity to travel time thresholds for bus rapid transit expansion in rio de janeiro. J. Trans. Geograp. 74, 321–332. doi: 10.1016/j.jtrangeo.2018.12.005
Post, J., Wegscheider, S., Mück, M., Zosseder, K., Kiefl, R., Steinmetz, T., et al. (2009). Assessment of human immediate response capability related to tsunami threats in Indonesia at a sub-national scale. Nat. Hazards Earth Syst. Sci. 9, 1075–1086. doi: 10.5194/nhess-9-1075-2009
Priess, J., Pinto, L. V., Misiune, I., and Palliwoda, J. (2021). Ecosystem service use and the motivations for use in central parks in three european cities. Land 10, 154. doi: 10.3390/land10020154
Pulighe, G., Fava, F., and Lupia, F. (2016). Insights and opportunities from mapping ecosystem services of urban green spaces and potentials in planning. Ecosyst. Serv. 22, 1–10. doi: 10.1016/j.ecoser.2016.09.004
Ramírez-Ortiz, J., Castro-Quintero, D., Lerma-Córdoba, C., Yela-Ceballos, F., and Escobar-Córdoba, F. (2020). Mental health consequences of the COVID-19 pandemic associated with social isolation. Colomb. J. Anesth. 48, 4. doi: 10.5554/22562087.e930
Reyes Päcke, S., and Figueroa Aldunce, I. M. (2010). Distribución, superficie y accesibilidad de las áreas verdes en Santiago de Chile. EURE 36, 89–110. doi: 10.4067/S0250-71612010000300004
Rigolon, A. (2016). A complex landscape of inequity in access to urban parks: a literature review. Landscape Urban Plann. 153, 160–169. doi: 10.1016/j.landurbplan.2016.05.017
Rodriguez-Valencia, A., and Ortiz-Ramirez, H. A. (2021). Understanding green street design: evidence from three cases in the U.S. Sustainability 13, 1916. doi: 10.3390/su13041916
Rojas, C., De la Fuente-Contreras, H., Díaz-Muñoz, S., Rueda-Seguel, I., Olguín-Carrillo, N., and Gallardo, M. (2020). Caminando a los parques urbanos: calidad y acceso público. AUS 28, 69–77. doi: 10.4206/aus.2020.n28-09
Romero Villafranca, R., and Zunica Ramajo, L. R. (2020). Metodos estadisticos para ingenieros. Available online at: https://elibro.net/ereader/elibrodemo/129644 (accessed August, 2022).
Rusch, V. E., Rusch, G. M., Goijman, A. P., Varela, S., and Claps, L. (2017). Los servicios ecosistémicos como soporte para la toma de decisiones ambiental y socialmente sustentables. Ecol. Austral 27, 162–176. doi: 10.25260/EA.17.27.1.1.295
Seefeld, K., and Linder, E. (2007). Statistics Using R with Biological Examples. Available online at: https://cran.r-project.org/doc/contrib/Seefeld_StatsRBio.pdf (accessed August, 2022).
So, S. W. (2016). Urban Green Space Accessibility and Environmental Justice: A GIS-Based Analysis in the City of Phoenix, Arizona [Data set]. Los Angeles, CA: University of Southern California Digital Library (USC.DL).
Spurrier, J. D. (2003). On the null distribution of the Kruskal–Wallis statistic. J. Nonparametr. Stat. 15, 685–691. doi: 10.1080/10485250310001634719
Stepniak, M., and Goliszek, S. (2017). “Spatio-temporal variation of accessibility by public transport—the equity perspective,” in The Rise of Big Spatial Data, eds I. Ivan, A. Singleton, J. Horák, and T. Inspektor (Berlin: Springer International Publishing), 241–261.
Subiza-Pérez, M., Vozmediano, L., and San Juan, C. (2020). Green and blue settings as providers of mental health ecosystem services: Comparing urban beaches and parks and building a predictive model of psychological restoration. Landscape Urban Planning 204, 103926. doi: 10.1016/j.landurbplan.2020.103926
Thompson, C. W. (2002). Urban open space in the 21st century. Landscape Urban Planning 60, 59–72. doi: 10.1016/S0169-2046(02)00059-2
UNDRR (2021). Regional Assessment Report on Disaster Risk in Latin America and the Caribbean. United Nations Office for Disaster Risk Reduction (UNDRR). Available online at: https://www.undrr.org/publication/undrr-roamc-regional-assessment-report-disaster-risk-latin-america-and-caribbean-rar (accessed August, 2022).
United Nations (2017). The New Urban Agenda. Available online at: http://habitat3.org/the-new-urban-agenda/ (accessed August, 2022).
Vidal, D. G., Teixeira, C. P., Dias, R. C., Fernandes, C. O., Filho, W. L., Barros, N., et al. (2021). Stay close to urban green spaces: Current evidence on cultural ecosystem services provision. Eur. J. Pub. Health. 31, ckab120048. doi: 10.1093/eurpub/ckab120.048
Villamizar Duarte, N., Oviedo, D., and Ardila Pinto, A. M. (2020). “Urban mobility and social equity: an introduction,” in Urban Mobility and Social Equity in Latin America: Evidence, Concepts, Methods, ed B. H. Region (Bingley: Emerald Publishing Limited), 1–10.
Wei, Y., Huang, C., Lam, P. T. I., and Yuan, Z. (2015). Sustainable urban development: a review on urban carrying capacity assessment. Habitat Int. 46, 64–71. doi: 10.1016/j.habitatint.2014.10.015
Xie, B., An, Z., Zheng, Y., and Li, Z. (2018). Healthy aging with parks: Association between park accessibility and the health status of older adults in urban China. Sust. Cities Soc. 43, 476–486. doi: 10.1016/j.scs.2018.09.010
Xing, L., Liu, Y., Wang, B., Wang, Y., and Liu, H. (2020). An environmental justice study on spatial access to parks for youth by using an improved 2SFCA method in Wuhan, China. Cities 96, 102405. doi: 10.1016/j.cities.2019.102405
Yigitcanlar, T., Dur, F., and Dizdaroglu, D. (2015). Towards prosperous sustainable cities: a multiscalar urban sustainability assessment approach. Habitat Int. 45, 36–46. doi: 10.1016/j.habitatint.2014.06.033
Keywords: ecosystem services (ES), urban public spaces, spatial accessibility, environmental quality and wellbeing, comparative analysis
Citation: Montoya-Tangarife C, Villamizar Duarte N, Jorquera Guajardo F, Cardenas MF and Giraldo-Ospina T (2022) Accessibility to public spaces: Boosting ecosystem services in urban areas in four Latin American cities. Front. Sustain. Cities 4:796122. doi: 10.3389/frsc.2022.796122
Received: 15 October 2021; Accepted: 18 October 2022;
Published: 01 December 2022.
Edited by:
Francisco De La Barrera, University of Concepcion, ChileReviewed by:
Steve Polasky, University of Minnesota Twin Cities, United StatesJames Kevin Summers, United States Environmental Protection Agency (EPA), United States
Copyright © 2022 Montoya-Tangarife, Villamizar Duarte, Jorquera Guajardo, Cardenas and Giraldo-Ospina. This is an open-access article distributed under the terms of the Creative Commons Attribution License (CC BY). The use, distribution or reproduction in other forums is permitted, provided the original author(s) and the copyright owner(s) are credited and that the original publication in this journal is cited, in accordance with accepted academic practice. No use, distribution or reproduction is permitted which does not comply with these terms.
*Correspondence: Claudia Montoya-Tangarife, Y2xhdWRpYS5tb250b3lhQHVtYXlvci5jbA==
†ORCID: Claudia Montoya-Tangarife orcid.org/0000-0001-7085-2805
Natalia Villamizar Duarte orcid.org/0000-0001-9754-6357
Felipe Jorquera Guajardo orcid.org/0000-0003-1854-2994
María F. Cardenas orcid.org/0000-0002-1804-6280
Tania Giraldo-Ospina orcid.org/0000-0002-7643-8565