 Paschalin Basil
 Gladys Nyachieo
- 1Institute for Development Studies, University of Nairobi, Nairobi, Kenya
- 2Faculty of Social Sciences and Technology, Multimedia University of Kenya, Nairobi, Kenya
Introduction: Walking and cycling as a form of active travel offer an opportunity for individuals to engage in physical exercises while performing a functional journey. Notwithstanding, the large proportion of the population relying on non-motorized transport (NMT), namely walking and cycling, has not been prioritized. At a time when lifestyle health challenges such as obesity and other non-communicable diseases are on the rise, walking and cycling would provide a window of opportunity and potentially provide exercise and thus improve the general health and wellbeing of the population. More than 75% of total daily trips made by Africa's low-income population are made by walking, compared with 45% by the more affluent people. Walking and cycling, considered low-carbon emission modes of transport, not only enhance urban quality but also boost social cohesion. Despite these potential gains, poor NMT infrastructure systems, low integration with the other modes of transport, and non-committal by law enforcement to protect pedestrians and cyclists still define the NMT ecosystem.
Methods: This study used descriptive methods to explore the barriers to and citizen perceptions of walking and cycling in Kenya's capital, the Nairobi Metropolitan area.
Results and discussion: Poor or absence of proper NMT infrastructure systems, safety concerns due to poor planning, lack of targeted policies as well as low or no capacity to ride a bicycle are among the predominant factors that undermine the use of NMT in Nairobi. However, a majority of citizens find no positive link between walking and/or cycling and poverty, a significant deviation from some prior studies and report.
Recommendations: Other than scaling up walking and cycling facilities, this study strongly recommends the use of participatory city frameworks to support NMT research, transport policy, and the needs of those already using walking and cycling as active modes of transport.
Introduction
Globally, walking and cycling have increasingly gained a lot of focus – both in developed and developing countries. This is particularly due to their wide use by majority of the world population especially the bottom 60. More than 75 percent of total daily trips made by Africa's poor are by walking, compared 45 percent by the more affluent (African Commute, 2018). When the poor use motorized transport, most of them rely on public transport or motorcycle taxis. In some instances, walking and cycling are associated with low-carbon functionality with the potential to enhance the quality of urban life and societal cohesion (UNEP, 2018). According to Wimbardana et al. (2018), the pedestrian environment is multi-dimensional and the road side environment subjects the pedestrians to a set of factors that significantly affect the perception of comfort, safety and convenience. In the attempt to provide better transport facilities, road engineers fail either to make provision for pedestrian facilities on the road side or compromise safety (Rankavat and Tiwari, 2016).
The Global Status Report on Road Safety (World Health Organization, 2018), links road infrastructure to fatal and serious injuries in road collisions. Improvements to the road infrastructure are critical to improving overall road safety. For instance, the lack of a footpath or a safe pedestrian crossing presents a major risk for death and injury to pedestrians. Therefore, poor quality of walking and cycling infrastructure for active modes of transport sends a message that pedestrians and cyclists are not welcome in the urban environment (ITDP and UN HABITAT, 2018).
The COVID-19 pandemic has had a considerable impact on active travel, and an increasing number of people have turned to walking and cycling (Goetsch and Quiros, 2020; Department of Transport, 2021). In England, a survey carried out between May and September 2020 showed that 34% of cyclists reported cycling more and 38% of those who walk as a means of transport reported walking more than before the COVID-19 outbreak (Department of Transport, 2021). The COVID-19 pandemic has continued to shape and reshape our cities in many ways. The shift has brought some visible changes, for instance; local air pollution has dropped by up to 60% globally (Goetsch and Quiros, 2020).
Progressively, African nations and cities are adopting non-motorized transport (NMT) policies. Currently, Ethiopia, Kenya, and Uganda have NMT policies, which advocate for a safe, comfortable, and quality environment for pedestrians and cyclists. For example, the Nairobi City County NMT Policy of 2017 aims at increasing mobility and accessibility, increasing transport safety, improving amenities for NMT, increasing the recognition and image of NMT in Nairobi County, and ensuring that adequate funding/investment is set aside for NMT infrastructure. Nairobi County allocated 20% of its construction budget to NMT infrastructure in 2018 (Nairobi Metropolitan Services, 2020).
African countries are gradually recognizing transport policy and acknowledging it as vital in enhancing walking and cycling. For a sustainable transport system, these policies have recognized that active modes are affordable, accompanied with health benefits, and reduce air pollution in urban cities. The policies are expected to benefit existing users and they will encourage new users to begin walking or cycling as a reaction to the improved infrastructure (ITDP and UN HABITAT, 2018).
In Nairobi, where nearly fifty percent (50%) of all daily trips are made by walking and cycling, investing in non-motorized transport (NMT) infrastructure is not receiving the needed focus. Yet, NMT provides an alternative pathway for the city (Odhiambo, 2021). As pointed out earlier, half of the trips in Kenya are made by walking and cycling and private vehicles make only 15 per cent of the trips. That not notwithstanding, infrastructural needs of the majority are not given priorities. For decades, plans throughout the city for new roads construction and upgrades have only partially provided physical infrastructure for non-motorized users (UNEP, 2018).
Urban mobility challenges in Kenya, just like in other developing countries, are enormous. For example, the road infrastructure is majorly designed for Motorized Transport (MT) with little attention is given to Non-Motorized Transport (NMT). The inaccessibility of the NMT network, lack of integration with the other modes of transport, and poor enforcement of laws designed to protect pedestrians and cyclists have been reported in major cities of Nairobi, Accra, Cape Town, and Addis Ababa (Mitullah and Makajuma, 2009; Mitullah and Opiyo, 2012; Ogendi et al., 2013).
With rapid urbanization, the rising demand for mobility will be met primarily by Non-Motorized Transport (NMT) as the most affordable option for the large section of the population. For the majority of people in developing countries, the only viable and available mobility options are walking, cycling, and public transport. Yet, with deteriorating, or non-existent infrastructure systems for NMT and public transport, these low-carbon modes are becoming increasingly unsafe (Badveeti and Mir, 2019). The quality of the pedestrian environment is critical in encouraging people to choose walking over driving (Southworth, 2005). According to Saelens et al. (2003), factors such as topography, residential density, urban form, connectivity, and the provision of sidewalks have a strong relationship with walking as a mode of active travel. Similarly, Lee and Moudon (2004) concur that walking happens primarily in neighborhood streets and in public facilities, and that the characteristics of such places influence the degree to which they are considered safe, comfortable and attractive for walking.
These arguments are supported by the tenets of the new urbanism theory. According to Katz (1993) in the new urbanism perspective, further emphasized by Morales et al. (2011), the community supports public space over private space. Therefore, the aspect of linking the design of the buildings and public spaces as well as land use scale, the road network system and how community operates are important. The theory suggests that although urban areas face a myriad of problems, planners can still proceed from the reality of these conditions and needs to explore and research the direction to solve these problems. This is against the backdrop of an increasing popularity of automobiles that will continue to promote the development of sub-urbanization. Unfortunately, there is little attention on planning (Vanderschuren et al., 2022) and budgeting for sustainable active transport. The majority of the resources are geared towards motorized transport as compared to non-motorized transport. Further, inadequate planning and prioritization of active transport modes have resulted in high injury and death rates especially for pedestrians.
Without proper infrastructure, features such as cycle lanes and sidewalks that ensure the safety of the NMT users further expose them to risk of injury and death. Therefore, the prioritization of the provision of affordable and safe public transport as well as facilities for safe walking and cycling remains a top agenda (World Health Organization, 2018).
According to global status report on road safety in 2018 by World Health Organization (World Health Organization, 2018), approximately 1.3 million people die each year as a result of road traffic crashes. From previous and current global status reports and various research undertakings, it has been shown that Road Traffic Deaths (RTDs) are severe on vulnerable road users, pedestrians, cyclists and riders of motorbikes and their passengers. These account for a staggering 46% of global traffic deaths (World Health Organization, 2009, 2018). About 93% of the world's fatalities on the roads occur in low- and middle-income countries. Nearly three quarters (73%) of such deaths occur among young males under the age of 25 years and are almost 3 times as likely to be killed in a road traffic crash as female counterparts.
The global status reports also identified RTDs as the leading cause of death for people between 5 and 29 years of age. An increase in average speed is directly related both to the likelihood of a crash occurring and to the severity of the consequences of the crash. For example, every 1% increase in mean speed produces a 4% increase in the fatal crash risk and a 3% increase in the serious crash risk. The death risk for pedestrians hit by car fronts rises rapidly (4.5 times from 50 km/h to 65 km/h).
Kenya's National Transport and Safety Authority (NTSA), in a status report on road safety released in 2020, reports that the country recorded 3572 fatalities, 6938 serious injuries and 5186 slight injuries as at December 2019. The recorded numbers have been a major concern for the various parties (Kelly, 2018). The general explanation on this has to do on the collection of data and the categorization of accident data. NTSA seemingly adopts a dead-on-the-spot for fatality report; no follow up is done with hospitals to determine which injuries led to death. This is contrary to international recommended standard of reporting which considers RTDs within a 30-day window (World Health Organization, 2018). Despite NMT being the most popular means of transport in Nairobi, key challenges related to poor infrastructure and air quality, safety of users, and congestion are conspicuous (Odhiambo, 2021). Thus, this study examined a range of barriers and perceptions to walking and cycling in selected sites in the Nairobi cosmopolitan area.
Despite NMT being the most popular means of transport in Nairobi, key challenges related to poor infrastructure and air quality, the safety of users, and congestion are conspicuous (Odhiambo, 2021). Thus, this study examined a range of barriers to and perceptions of walking and cycling in selected sites in the Nairobi cosmopolitan area.
Research aim
The overall aim of the research was to examine the barriers to and perceptions of walking and cycling and how they influence people's decisions to walk or to cycle in urban areas.
Methodology
The study adopted a descriptive survey design that utilizes surveys to gather data on divergent subjects. This approach yields quantitative data and targets to discern the extent to which diverse situations can be attained among the various subjects (Creswell and Creswell, 2017). Descriptive research has the advantage of precisely and systematically describing a phenomenon and answering the questions of what, where, when, and how and can use a wide variety of research methods.
Nairobi Metropolitan area was purposively selected due to its characteristics, for example, having a mix of high- and low-income areas as well as having areas with NMT interventions and other areas without NMT interventions. The metropolitan area comprises the capital city—Nairobi, and the surrounding counties of Kajiado, Kiambu, Machakos, and Murang'a. However, the study focused on sites proximate to Nairobi city because they have areas with infrastructure for both MTs and NMTs.
The particular selected sites of data collection were as follows: the lower Central Business District (CBD) (Landhis Road, River Road, and Kirinyaga Road). In addition, upper CBD (Moi Avenue, Kenyatta Avenue, and Harambee Avenue) and Outer Ring Road in the Eastlands area in Nairobi are outside the CBD but are still within the Metropolitan area. Ongata Rongai (Kajiado County) and Ruiru (Kiambu County) were selected to represent areas outside the city limits. All the study sites comprised areas with and without NMT interventions. For example, Ruiru has MNT interventions and Ongata Rongai has none.
The study utilized the convenience sampling technique—a non-probabilistic form of sampling where samples are obtained based on the availability at the moment in time and the nearest convenient location to the researcher (Edgar and Manz, 2017). In this study, it was adopted as it was the most feasible sampling technique for the study due to the nature of the population. In addition, it was necessary to interview the participants at the sites at that time. This constituted their natural environment as they walked or cycled. The study sample was 137 respondents. Interpretive findings.
Interpretive findings
Background information
Individual characteristics include socio-demographics, ability to use a mode, and ownership or availability of modes and facilities that affect to what extent active modes are utilized (Ton et al., 2019).
Gender of respondent
Study participants were in almost equal proportions between men and women (49.6 and 50.4%, respectively), providing a better representation of gendered-based perspectives. Participants' ages ranged from 19 to 62 years, with a mean age of 32.9 years.
Research on how sex and bicycle ridership interact when assessing perceived barriers has been scarce in the existing literature. For two reasons, it is important to look at these interactions as they relate to perceived barriers (Fowler et al., 2017). Specifically, women and non-riders are more concerned about the dangers of motorized vehicles (Wang et al., 2011). Women prefer greater separation from motorized traffic among commuter cyclists, who are willing to travel further for these facilities. As a result, women and non-frequent/non-bicyclists are more likely than men and regular riders to perceive accidents as a barrier to riding bicycles.
Education level
The majority of the participants (48.2%) had secondary education, while 39.4% had tertiary education. There were just 11.7 % with primary education, and only one respondent indicated that they had no formal education at all.
Participants with physical disabilities (PWDs) limiting their mobility were 5.8%, while the rest (94.2%) reported no challenges with mobility. This is because most physically challenged persons for one reason or the other are rarely found walking on the roads or using NMT. This is one of the reasons most of them were not reached for input in various interventions unless they were to be targeted. This means that their valuable contributions to road or mobility interventions are missed most of the time.
Occupation
The majority of the respondents (72.3%) were in informal occupations as compared to those in formal occupations 27.7%.
Furthermore, the study results indicated that 45.3% of the respondents were self-employed, while 39.4% were employees. The remaining were either active students, retired, housewives, unemployed, or volunteers.
Mode of transport used
The study found that the respondents used a variety of modes of transport for their mobility needs. Slightly more than half of them (53.3%) utilized public service vans, known as matatus, while 21.9% of them indicated that they walk to their destinations. Those who reported having cycled were only 8.8%.
The high percentage of people using matatus may be attributed to the nature of activities people engaged in on a particular day or the distance between their place of work and residence. Matatus are generally more available, and one would decide to use them if all the other options are not viable. Walking comes second, while cycling comes third as the common mode of transport. The decision to walk or cycle could be affected by a number of factors including the availability of a bicycle and the ability to ride or walk, but it could be influenced by the presence of walking infrastructure and an environment that is safe and secure. Although it was not identified as a significant mode of transport in this study, boda bodas are still widely used in Nairobi. They are described as a form of motorcycle taxi mode of transport that originated in the early 1960s at the Kenya–Uganda border, hence the name (Mkutu and Mkutu, 2019). A study in Seattle on what motivates people to walk or cycle found that what motivates high-income people is not the same as what motivates low-income people (Langston, 2016).
Car or bicycle ownership
On car or bicycle ownership, 26 of the 137 respondents interviewed indicated that they owned a bicycle (19.0%), while 18 respondents (13.1%) were car owners. Two respondents (1.5%) owned both a bicycle and a car. The majority of the respondents (66.4%) owned neither a car nor a bicycle. Car or bicycle ownership does not necessarily mean that one will never be a pedestrian. Those who own either or both a car and a bicycle also prefer walking at some point. However, car or bicycle ownership may imply less walking among affluent city dwellers.
Walking and cycling infrastructure in Nairobi
The NMT policy for Nairobi City County (2015) cited a number of challenges facing NMT in the city, which included insufficient NMT infrastructure, lack of safety when using pedestrian facilities, inaccessibility, discomfort while using NMT facilities, and lack of policy implementation (Nairobi City County, 2015); thus, this study sought to examine how the users felt about the facilities for NMT.
That not notwithstanding, the infrastructural needs of the majority are not given priority. The built or spatial attributes including physical infrastructrures, as has been illustrated in the Netherlands (Ton et al., 2019), play a significant in shaping people's choice of walking and cycling in a particular route. For decades, plans throughout the city for new road construction and upgrades only partly provided physical infrastructure for non-motorized users (UNEP, 2018).
The participants were asked to rate the walking facilities (i.e., walkways, pedestrian crossings, and shelters from weather) in their locality. Table 1 offers an understanding of participants' walking and cycling experiences through their rating of available facilities.
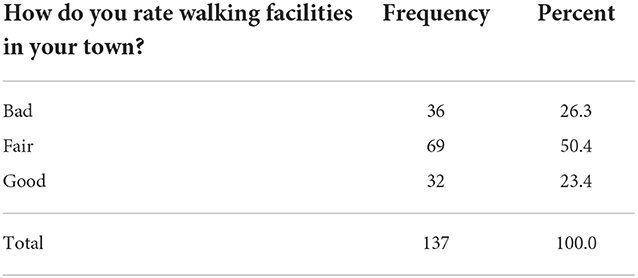
Table 1. Walking facilities.
Regarding other considerations, nearly 53.3% of the respondents adopt matatu (Table 2), approximately 66.4% neither own a bicycle nor a car (Table 3), nearly 69.3% do not believe the cycling facilities are fit for purpose (Table 4), and 41.6% of the respondents occasionally feel safe while walking or cycling (Table 5).
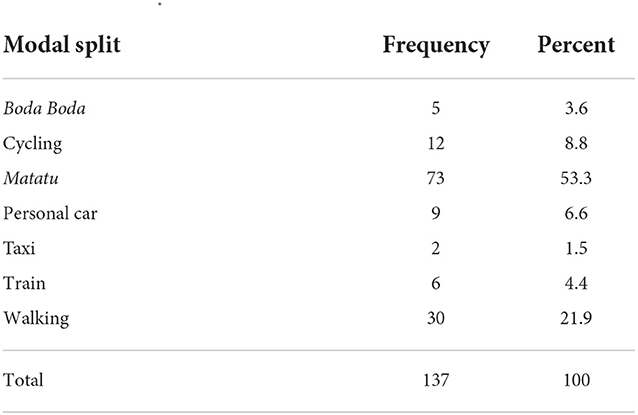
Table 2. Modal split.

Table 3. Car and bicycle ownership.
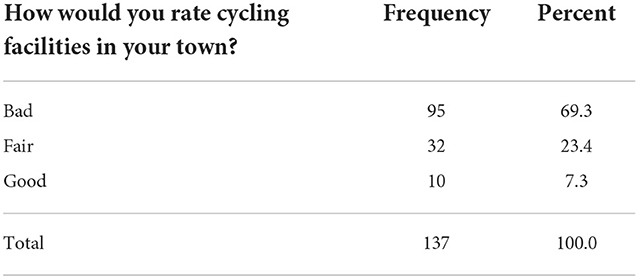
Table 4. How would you rate cycling facilities (lanes, parking slots) in your town?
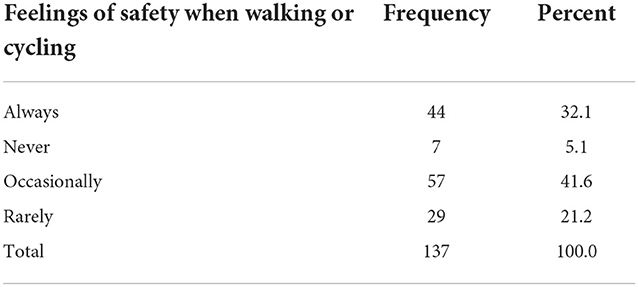
Table 5. Safety in walking or cycling.
On asking how the respondents rated the walking facilities, more than half of the respondents (50.4%) considered the walking facilities (walkways, pedestrian crossings, and shelters from weather) as fair. The remaining 23.4 and 26.3% considered the facilities either good or bad.
The quality of walking facilities
On cycling facilities, most of the respondents (63.3%) considered cycling facilities as bad, 23.4% thought it was fair, and only 7.3% considered them to be good. This may suggest that the cycling experience may be worse than the walking experience for most people. This could be because cycling facilities are largely absent in most parts of the metropolitan area. As intimated by Mitullah and Opiyo (2017), appropriate frameworks are therefore needed to support the walking and cycling facilities in Nairobi.
Safety while walking and cycling
In the current study, participants were asked whether they felt safe walking or cycling. The majority (57%) indicated they felt safe occasionally. About 32% felt safe always with 21.2% rarely feeling safe. A paltry 5% never felt safe walking or cycling as illustrated in Table 6. The literature indicates that the biggest barrier to walking and cycling is their safety concerns linked to car traffic on intersecting routes.
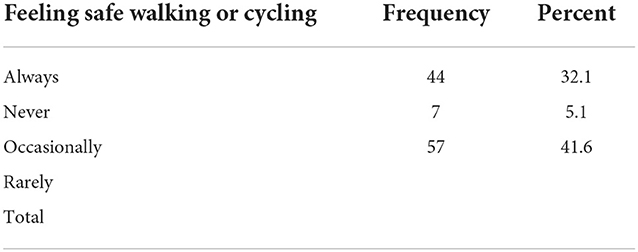
Table 6. Safety while walking or cycling.
The literature further indicates that safety is one of the key barriers to the adoption or rejection of active modes of transport (Thornton et al., 2011; Phillips et al., 2018). Most people opt not to ride bicycles because they perceive it to be dangerous. The British Social Attitudes Survey on “Public Attitudes to Transport” found that 61% of respondents felt that it is too dangerous for them to cycle on the roads. This statistic rose to 67% for “non-cyclists” (people who had not ridden a bike at least once in the previous 12 months) and fell to 48% for “cyclists” (people who had ridden a bike at least once in the previous 12 months) (The Department for Transport, 2014). A study conducted in Nairobi on the analysis of non-motorized travel conditions on the Jogoo Road focusing on NMT operating conditions on the corridor found that the conditions were not very conducive in terms of safety, convenience, and security of road users (Mitullah and Makajuma, 2009). These factors discourage the adoption of active transport.
According to the Jogoo Road study, the roadway capacity gets extremely constrained because matatus (paratransit) invade the sidewalk as well as the over-speeding motorists compromising the safety of pedestrians and cyclists. Over-speeding motorists during off-peak hours have also made the roadway difficult to cross by pedestrians.
Ensuring safety while walking or riding
Regarding which actions pedestrians and cyclists took to keep safe while walking, the majority of the respondents (36.5 and 35.8%) indicated that they would change sidewalks or cycle lanes from one side of the street to the other and leave their places of work early before the night falls. Nearly 26.1% of the participants require assisted walking or cycling whereby about 5% of them would totally avoid moving out due to their safety concerns. These statistics have over-arching implications and may as well represent a majority of the population living and walking and/or working in Nairobi. It also brings to the fore the lack of deliberate focus on improving walking and cycling infrastructures within the city, as shown in Table 7.
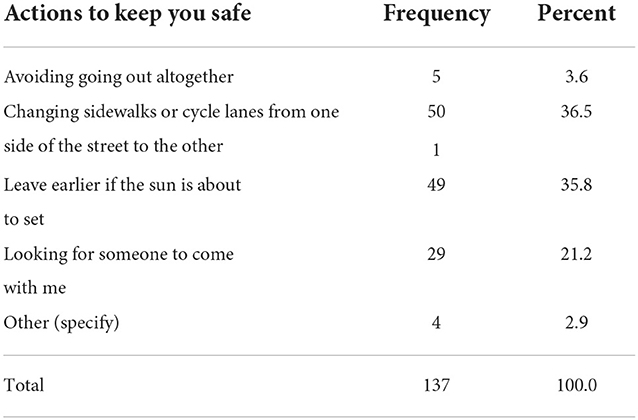
Table 7. Which of the following are you likely to engage to keep yourself safe when walking or cycling in the city?
Among the vulnerable road users, pedestrians are the most affected by this lack of proper attention to transport infrastructure systems in Nairobi. Safety issues are, therefore, of importance when addressing the issues of NMT. The global status report on road safety (World Health Organization, 2018) indicates that more than half of the global traffic deaths are among pedestrians, cyclists, and motorcyclists who are still too often neglected in road traffic system design in many countries. Kenya's situation (NTSA, 2020) mirrors the global image of the casualties and fatalities of road users as illustrated in Figure 1.
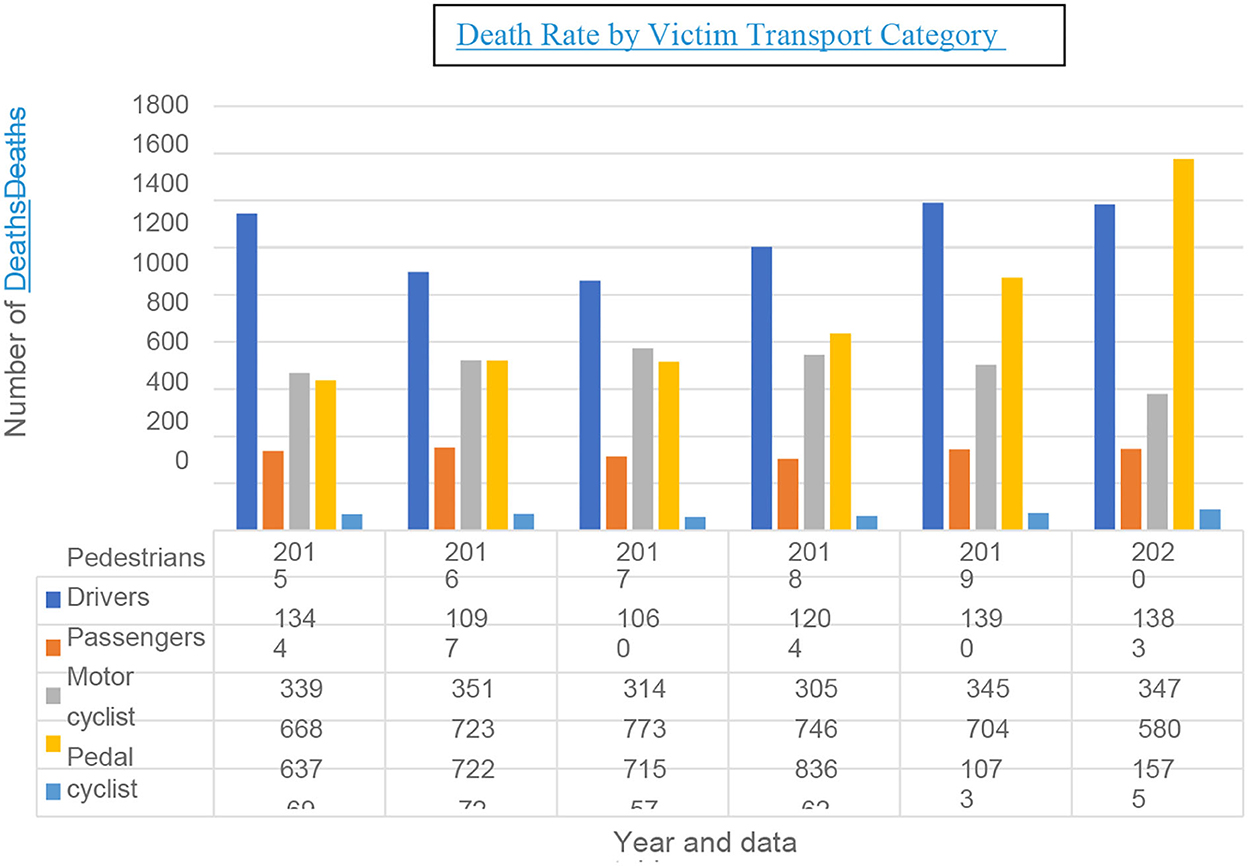
Figure 1. Comparative statistics of road fatalities for different road users in Kenya. NTSA data compiled by authors in 2021.
Walking and cycling experience
The study investigated the walking and cycling experience of the respondents. Cycling and/or walking experience, in this case, was conceptualized in the form of pleasurability, as defined in the case of Freetown, Sierra Leone (Oviedo et al., 2021), by the route's esthetics (natural environment) and comfort (route facilities). In this case, the respondents were specifically asked whether it was easy or not to walk and/or cycle in their different localities. As shown in Table 8 obtained from the study, the respondents were indifferent in their response to this question - necessitating further research to find out what the participants understood in the concept of ease to walk or cycle.
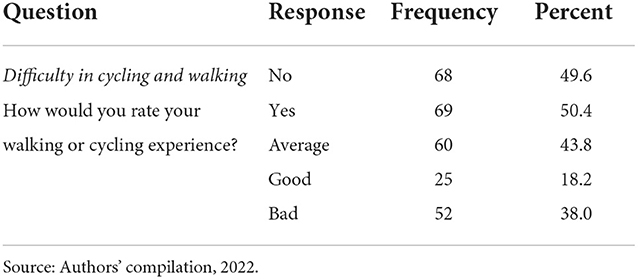
Table 8. Is it easy to walk or cycle here?
Regarding the rating of their walking experience, the majority of the respondents (nearly 43.8%) rated their walking and cycling experience as average, 38% as good, and 18% did not find their experience any good. This study attributes the good walking experience to the presence of NMT infrastructure in study areas, such as Ruiru and upper Nairobi CBD—a clear indication of the need for more infrastructure interventions that support walking in Nairobi and its environs. For example, integrating walking infrastructure into the broader Nairobi urban planning infrastructure as well as rolling up innovative safety mechanisms for the same would be critical. This is especially in readiness for the technology-aided and evolving nature of micromobility across the world (Bigazzi and Wong, 2020).
Walking and cycling experience by place/locations
The study sought to find out the walking and cycling experience by place or location, and the study locations were five: two city points (CBD upper and lower) Outer Ring Road, Ongata Rongai, and Ruiru.
The majority (45.2%) of those interviewed in lower CBD Nairobi reported their experience to be average. It was 29% who reported a good walking and cycling experience, while 25.8% reported a bad one. For the upper CBD, more (56.3%) respondents reported an average walking experience as compared to those in the lower CBD. Surprisingly, only 31.3% of the respondents reported a good experience. For Outer Ring Road, 38.1% reported a good experience, 28% reported a bad experience, and 33.3% reported an average experience. For Ongata Rongai, 38.7% reported an average experience, 45.2% reported a good experience, and 16.1% reported a bad experience. In Ruiru, where the majority of the respondents (50%) reported their walking and cycling to be good, the average was 40.9%. Only 9.1 % reported a bad experience. This may be attributed to the walking and cycling interventions (Table 9).
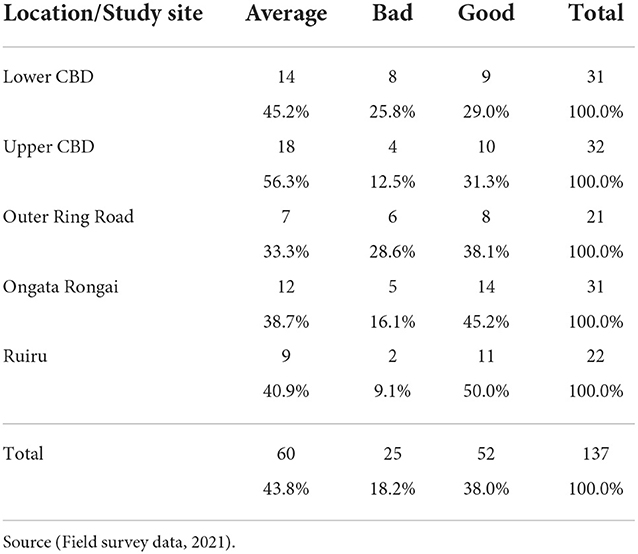
Table 9. Location of interview by walking and cycling experience.
Perceptions on walking and cycling
Non-motorized transport is seen as a low-status alternative. According to the National Department of Transport and the Council for Scientific Research (CSIR), “No one wants to be associated with poverty” (Mashiri et al., 2013). In addition, previous research has shown that the use of cars is based on a colonial legacy of associating motorized transportation with education, affluence, and elevated status in society. Furthermore, building mega highways and increasing motorization is seen as growth and development. However, this is not the case with our study. The study further sought to examine how people perceived walking, and a good majority of the respondents (84.7%) indicated that they did not think walking was a preserve for the poor and is underpinned by many factors (some intrinsic) not considered in this study. Only 15.3% perceived walking to be for the poor. This is illustrated in Table 10.
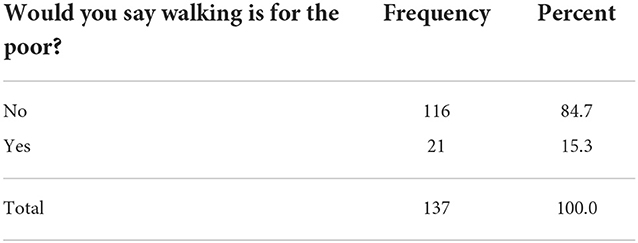
Table 10. Would you say walking is for the poor?
Majority of the respondents (71.5%) admit they do not cycle not because they do not know how to do so but as a result of other reasons (Table 11) while 62.8% of them attribute their inability to cycle to lack of bicycle (Table 12).

Table 11. Tell me whether the following is true or false. I do not cycle because I do not know how to cycle.
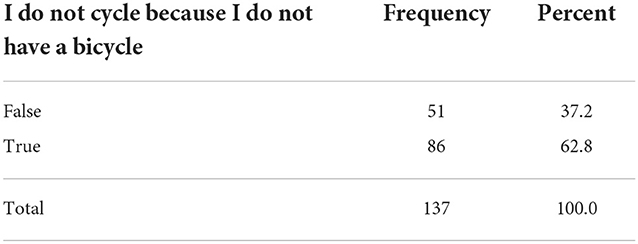
Table 12. Tell me whether the following is true or false. I do not cycle because I do not have a bicycle.
Cycling and gender
In trying to find out whether cycling was considered only/primarily for men, the study posed this question “would you say cycling is for men.” A majority of the respondents (86.1%) responded in the negative (Table 13).

Table 13. Cycling and gender.
According to Law (1999), daily mobility is powerfully shaped by gender. On average, women travel more than men and make shorter trips than men (partly because they tend to work closer to home than men) (Crane, 2007; Scheiner et al., 2011). A proper understanding of the specific gender history is therefore critical in minimizing mobility-related issues (Ferrucci et al., 2016).
Lack of capability as a barrier to cycling
Exploring whether capability was a barrier to cycling, the study presented a true or false question about cycling, “I do not cycle because I do not know how to cycle.”
The majority of the responses were false, meaning that they did not fail to cycle because they did not know how to ride but for probably other reasons. Another question on cycling and having a bicycle followed this question. The study sought to find out whether people did not ride because they did not have a bicycle. They did not have to own a bicycle to ride. The study found that the majority of the respondents (62.8%) did not cycle because they did not have a bicycle.
Conclusion and recommendations
From the study findings, it is apparent that the prevalence of NMT or its lack thereof in Nairobi is accompanied by barriers to its widespread uptake and various citizen perceptions toward its use. As barriers to and challenges for NMT, lack of proper infrastructure, safety due to poor planning, lacking policy to support the development of appropriate walkways and bicycling facilities, and low or no capacity to ride a bicycle are among the predominant factors that undermine the use of NMT. For example, the road infrastructure within the Nairobi Central Business District (CBD) was majorly designed for MT; therefore, little attention was given to NMT. This trend has yielded a scenario, where ideas to solve the mobility needs of the poor are concentrated around public transport. Similarly, poor citizens perceptions of walking as being the preserve for the poor and only for a particular gender may limit the use of NMT system in Nairobi. Instead, walking and cycling are considered low-carbon modes that are found to be affordable and flexible and can enable a majority of the people in low- and middle-income countries to participate and make a contribution to the economy and community. This is notwithstanding the co-benefits to health and contributions to access to education, healthcare, and other social services, especially in urban areas (UNEP, 2018).
In light of the findings, the study recommends that it is essential to invest in modern road equipment and traffic management in Nairobi in order to mitigate traffic congestion and transport service problems Nairobi (African Development Bank, 2013) that are shown to inhibit the use of walking and cycling in. There is, therefore, a need to arrive at a balanced provision of traffic infrastructure for both MT and NMT through participatory city frameworks and in ways that meet the transport needs of all. In regard to road safety rules and regulations, specifically for liability and safety concerns, it is essential to look into how the regulations influence the perception of pedestrians as they are key users of the sidewalks (Bahari et al., 2013).
It was also found that the walkways and cyclist lanes significantly contribute to the safety of pedestrians and cyclists. The study, thus, recommends that vehicles, pedestrians, and cyclists be separated by sidewalks and cyclist lanes to enhance pedestrian and cyclist flow. Therefore, it is important to invest in and improve the sidewalks, pedestrian crossings, and cyclist lanes in order to improve mobility, accessibility, safety, and security of all road users.
Currently, there are inconsistencies around NMT research, policy, and practice. For example, NMT research and policy are not translated into practice to include NMT needs in new road projects. Is it a lack of tools and/or capacity to do so? Or have our policymakers become NMT planners? Where do these there three meet? As Cooke et al. (2022) indicate, NMT infrastructure is not always prioritized. When one buys a car, he or she becomes important in the prioritization and allocation of street space. In Nairobi, buying a car is akin to you buying the street! In order to change this in favor of walking and cycling in Nairobi, effective planning, design, and implementation should be influenced by appropriate data such as route user frequency. Furthermore, policymaking should be cognizant of citizen perception as it may influence or derail the acceptance and adoption of walking and cycling as active modes of transport for many in Nairobi. Until every road user and their needs are considered important, integration of walking and cycling into the design, planning, and implementation of urban infrastructure remains not just important but urgent as well.
Data availability statement
The original contributions presented in the study are included in the article/Supplementary material, further inquiries can be directed to the corresponding authors.
Ethics statement
Ethical review and approval was not required for the study on human participants in accordance with the local legislation and institutional requirements. The patients/participants provided their written informed consent to participate in this study.
Author contributions
All authors listed have made a substantial, direct, and intellectual contribution to the work and approved it for publication.
Conflict of interest
The authors declare that the research was conducted in the absence of any commercial or financial relationships that could be construed as a potential conflict of interest.
Publisher's note
All claims expressed in this article are solely those of the authors and do not necessarily represent those of their affiliated organizations, or those of the publisher, the editors and the reviewers. Any product that may be evaluated in this article, or claim that may be made by its manufacturer, is not guaranteed or endorsed by the publisher.
References
African Commute. (2018). The African Commute: City Transport Trends. ASME ISHOW / IDEA LAB. Available online at: https://medium.com/impact-engineered/the-african-commute-city-transport-trends-cf369e5106bd
African Development Bank (2013). Nairobi Outer Ring Road Improvement: Kenya-Project Appraisal Report. Kenya: OITC Department.
Badveeti, A., and Mir, M. S. (2019). Non-Motorized Transport (NMT) user safety guidelines in urban areas of developing countries. Int. J. Innov. Technol. Explor. Eng. 9, 22783075. doi: 10.35940/ijitee.B7555.129219
Bahari, N. I., Arshad, A. K., and Yahya, Z. (2013). “Assessing the pedestrians' perception of the sidewalk facilities based on pedestrian travel purpose,” in 2013 IEEE 9th International Colloquium on Signa, Processing and its Applications.
Bigazzi, A., and Wong, K. (2020). Electric bicycle mode substitution for driving, public transit, conventional cycling, and walking. Transport. Res. Part D: Transport Environ. 85, 102412. doi: 10.1016/j.trd.2020.102412
Cooke, S., Ryseck, B., Siame, G., Nkurunziza, A., Molefe, L., and Zuidgeest, M. (2022). Proximity is not access: A capabilities approach to understanding non-motorized transport vulnerability in African cities. Front. Sustain Cities. 4, 811049. doi: 10.3389/frsc.2022.811049
Crane, R. (2007). Is there a quiet revolution in women's travel? revisiting the gender gap in commuting. J. Am. Plan Assoc. 73, 298–316. doi: 10.1080/01944360708977979
Creswell, J. W., and Creswell, J. D. (2017). Research Design. SAGE Publications Inc. Available online at: https://us.sagepub.com/en-us/nam/research-design/book255675 (accessed December 25, 2022).
Department of Transport UK. (2021). National Travel Attitudes Study: Wave 4 (Final). Available online at: https://assets.publishing.service.gov.uk/government/uploads/system/uploads/attachment_data/file/956170/national-travel-attitudes-study-wave-4-final.pdf
Edgar, T. W., and Manz, D. O. (2017). “Chapter 4—exploratory study,” in Research Methods for Cyber Security, eds T. W. Edgar and D. O. Manz (Boston, MA: Syngress), 95–130.
Ferrucci, L., Cooper, R., Shardell, M., Simonsick, E. M., Schrack, J. A., and Kuh, D. J. (2016). Age-related change in mobility: Perspectives from life course epidemiology and geroscience. Gerontol. A. Biol. Sci. Med. Sci. 71, 1184–1194. doi: 10.1093/gerona/glw043
Fowler, S., Berrigan, A., and Pollack, K. M. (2017). Perceived barriers to bicycling in an urban U.S. environment. J. Pubic Transp. 4, 474–480. doi: 10.1016/j.jth.2017.04.003
Goetsch, H., and Quiros, T. P. (2020). COVID-19 Creates New Momentum for Cycling and Walking. We Can't Let It Go To Waste!. Available online at: https://blogs.worldbank.org/transport/covid-19-creates-new-momentum-cycling-and-walking-we-cant-let-it-go-waste
ITDP UN HABITAT. (2018). Streets for Walking & Cycling: Designing for Safety, Accessibility, and Comfort in African Cities. Available online at: https://unhabitat.org/sites/default/files/2020/06/streets-for-walking-and-cycling.pdf
Kelly, K. J. (2018). WHO: Kenya road deaths four times higher than NTSA reported. Daily Nation. Available online at: https://www.nation.co.ke/news/Kenya-road-deaths-grossly-underreported–WHO/1056-4893792-ve7d07z/index.html (accessed December 13, 2018).
Langston, J. (2016). What Motivates People to Walk and Bike? It Varies by Income. Available online at: https://www.washington.edu/news/2016/01/06/what-motivates-people-to-walk-and-bike-it-varies-by-income/ (accessed December 25, 2022).
Law, R. (1999). Beyond ‘women and transport': towards new geographies of gender and daily mobility. Prog. Hum. Geogr. 23, 567–588. doi: 10.1191/030913299666161864
Lee, C., and Moudon, A. V. (2004). Physical activity and environment research in the health field: Implications for urban and transportation planning practice and research. J. Plann. Literat. 19, 147–181. doi: 10.1177/0885412204267680
Mashiri, M., Maphakela, W., Chakwizira, J., and Mpondo, B. (2013). “Building a sustainable platform for low-cost mobility in South Africa,” in SATC 2013 (Pretoria). 198–212.
Mitullah, W., and Makajuma, G. (2009). “Analysis of non-motorized travel conditions of the Jogoo Road corridor in Nairobi,” in Fourth International Conference on the Future of Urban Transport: Access and Mobility for the Cities of Tomorrow, Göteborg.
Mitullah, W., and Opiyo, R. (2017). “Institutional Framework for Walking and cycling provision in Cape Town, Dar es Salaam and Nairobi,” in Non-motorized Transport Integration into Urban Transport Planning in Africa. New York, NY: Routledge.
Mitullah, W. V., and Opiyo, R. (2012). Mainstreaming Non-Motorised Transport (NMT) in Police and Planning in Nairobi: Institutional Issues and Challenges. Available online at: http://erepository.uonbi.ac.ke/handle/11295/38801
Mkutu, K., and Mkutu, T. R. (2019). Public health problems associated with “boda boda” motorcycle taxis in Kenya: the sting of inequality. Aggress. Viol. Behav. 47, 245–252. doi: 10.1016/j.avb.2019.02.009
Morales, P., Solis, J., Trillo, A., Garcia, S., and Carolina, F. (2011). Qualitative analysis of sustainable vertical dwelling in Nuevo Leon, Mexico. J. Green Build. 6, 58–72. doi: 10.3992/jgb.6.1.58
Nairobi City County. (2015). Non-Motorized Transport (NMT) Policy for Nairobi. Available online at: http://www.kara.or.ke/Nairobi%20NMT%20Policy%20Popular%20Version.pdf
Nairobi Metropolitan Services (NMS). (2020). Promoting Non-Motorized Transport in Nairobi: A Study on Users, Safety, and Infrastructure Trends. Available online at: https://www.google.com/url?sa=t&rct=j&q=&esrc=s&source=web&cd=&ved=2ahUKEwiMiuTHprr8AhX5TKQEHQQhAdMQFnoECDkQAQ&url=https%3A%2F%2Fwww.africaportal.org%2Fdocuments%2F21526%2FCDKN-NMT-Report-WEB.pdf&usg=AOvVaw14wZziInpLJPm-qfYYjaFg
NTSA (2020). National Transport and Safety Authority (NTSA). [Online]. Available online at: http://www.ntsa.go.ke/index.php?option=com_contentandview=articleandid=237 (accessed Retrieved March 01, 2020).
Odhiambo, E. (2021). Promoting Non-motorized Transport in Nairobi: A Study on Users, Safety and Infrastructure Trends. Climate and Development Knowledge Network (CDKN). Available online at: https://www.africaportal.org/publications/promoting-non-motorized-transport-nairobi-study-users-safety-and-infrastructure-trends/
Ogendi, J., Odero, W., Mitullah, W., and Khayesi, M. (2013). Pattern of pedestrian injuries in the city of Nairobi: implications for urban safety planning. J. Urban Health 90, 849–856. doi: 10.1007/s11524-013-9789-8
Oviedo, D., Okyere, S. A., Nieto, M., Kita, M., Kusi, L. F., Yusuf, Y., et al. (2021). Walking off the beaten path: Everyday walking environment and practices in informal settlements in Freetown. Res. Transport. Bus. Manage. 40, 100630. doi: 10.1016/j.rtbm.2021.100630
Phillips, D., Mohammed, S., Rantanen, K., Bury, J., Sayers, E., Forsyth, E., et al. (2018). NatCen Social Research | Cycling and Walking Safety: A rapid evidence assessment of the latest research evidence.
Rankavat, S., and Tiwari, G. (2016). Pedestrians perceptions for utilization of pedestrian facilities- Delhi, India. Transport. Res. Part F: Traffic Psychol. Behav. 42, 495–499. doi: 10.1016/j.trf.2016.02.005
Saelens, B. E., Sallis, J. F., and Frank, L. D. (2003). Environmental correlates of walking and cycling: Findings from the transportation, urban design, and planning literatures. Ann. Behav. Med. 25, 80–91. doi: 10.1207/S15324796ABM2502_03
Scheiner, J., Sicks, K., and Holz-Rau, C. (2011). Gendered activity spaces: trends over three decades in Germany. Erdkunde. 65, 371–387. doi: 10.3112/erdkunde.2011.04.04
Southworth, M. (2005). Designing the walkable city. J. Urban Plann. Develop. 131, 246–257. doi: 10.1061/(ASCE)0733-9488(2005)131:4(246)
The Department for Transport. (2014). British Social Attitudes Survey 2013: Public Attitudes Towards Transport. Available online at: https://assets.publishing.service.gov.uk/government/uploads/system/uploads/attachment_data/file/326097/british-social-attitudes-survey-2013.pdf (accessed December 25, 2022).
Thornton (2011). “Produced a report for the Department for Transport in July 2011,” in Climate Change and Transport Choices.
Ton, D., Duives, D. C., Cats, O., Hoogendoorn-Lanser, S., and Hoogendoorn, S. P. (2019). Cycling or walking? Determinants of mode choice in the Netherlands. Transp. Res. A Policy Pract. 123, 7–23. doi: 10.1016/j.tra.2018.08.023
UNEP. (2018). Kenya Prioritizes Non-Motorized Transport to Enhance Road Safety. UNEP.Available online at: http://www.unep.org/news-and-stories/blogpost/kenya-prioritizes-non-motorized-transport-enhance-road-safety
Vanderschuren, M., Newlands, A., and Wheeldon, A. (2022). Improving non-motorized transportation provision in a socially inclusive way—the case of cape town. Front. Sustain. Cities 4, 339. doi: 10.3389/frsc.2022.775339
Wang, W., Attanucci, J., and Wilson, N. (2011). Bus passenger origin-destination estimation and related analyses using automated data collection systems. J. Pubic Transp. 14, 131–150. doi: 10.5038/2375-0901.14.4.7
Wimbardana, R., Tarigan, A.K., and Sagala, S. (2018). Does a Pedestrian environment promote walkability? auditing a pedestrian environemnt using the pedestrian envronmental data scan instrument. J. Reg. City Plann. 29, 57. doi: 10.5614/jrcp.2018.29.1.5
World Health Organization. (2009). Road Safety in Ten Countries: Kenya. World Health Organization.Available online at: https://www.who.int/violence_injury_prevention/road_traffic/countrywork/rs10_kenya_en.pdf (accessed December 25, 2022).
World Health Organization. (2018). Global Status Report on Road Safety 2018. Geneva: World Health Organization.Available online at: https://www.who.int/publications-detail-redirect/9789241565684
Keywords: perceptions, walking, cycling, barriers, active travel, health and wellbeing
Citation: Basil P and Nyachieo G (2023) Exploring barriers and perceptions to walking and cycling in Nairobi metropolitan area. Front. Sustain. Cities 4:775340. doi: 10.3389/frsc.2022.775340
Received: 13 September 2021; Accepted: 11 November 2022;
Published: 07 February 2023.
Edited by:
Tathagata Chatterji, Xavier University, IndiaReviewed by:
Andrea Garfinkel-Castro, The University of Utah, United StatesJapheths Onyango Ogendi, Maseno University, Kenya
Copyright © 2023 Basil and Nyachieo. This is an open-access article distributed under the terms of the Creative Commons Attribution License (CC BY). The use, distribution or reproduction in other forums is permitted, provided the original author(s) and the copyright owner(s) are credited and that the original publication in this journal is cited, in accordance with accepted academic practice. No use, distribution or reproduction is permitted which does not comply with these terms.
*Correspondence: Paschalin Basil, UGFzY2hhbGluLmJhc2lsQHVvbmJpLmFjLmtl; Gladys Nyachieo, Z255YWNoaWVvQG1tdS5hYy5rZQ==
†These authors have contributed equally to this work