 Yongwan Chun
 Kamyoung Kim
94% of researchers rate our articles as excellent or good
Learn more about the work of our research integrity team to safeguard the quality of each article we publish.
Find out more
ORIGINAL RESEARCH article
Front. Sustain. Cities, 29 November 2022
Sec. Urban Economics
Volume 4 - 2022 | https://doi.org/10.3389/frsc.2022.1013465
This article is part of the Research TopicUrban Hierarchies in an Economic Transition To Sustainable CitiesView all 5 articles
South Korea has experienced a dramatic economic change since the Korean War. Its economic structure has developed from one with a primary industry-centric in the 1950s to a manufacturing or service-centric structure. The economic development has been accompanied by a steady growth of population specifically in urban areas. In addition, economic development also has triggered changes in its population distribution and, ultimately, its urban system. The purpose of this paper is to investigate changes in the urban system in South Korea using two approaches, which are primacy indices and spatial interaction indices. While the primacy indices focus on the population sizes of cities, an investigation with spatial interaction allows an examination of linkages among cities. The results show that the Korean urban system had a primacy structure in which Seoul dominates until the 1990s, after which this primacy structure of the city weakened. The spatial interaction patterns show that many cities have developed in large metropolitan areas and are highly interconnected with each other. But this new development has dominantly occurred still in the Seoul metropolitan area. These results present that urban developments have been highly concentrated in peripheral areas of Seoul that are still in the Seoul metropolitan area, with the dominance of the metropolitan area getting stronger over time.
Cities in an urban system constantly interact with and are connected with other cities in various forms including invisible networks such as information flows as well as visible infrastructure such as road networks (Bretagnolle et al., 2009). Modern cities are dependent on one another, their functional connections emerge, and they continuously change through interactions with other cities. In other words, an urban system forms a structural relationship among cities through interactions (Hutchison, 2010, p. 935). These structural characteristics of an urban system have been commonly examined with three approaches, which are rank-size regularities, central place theory, and interaction between urban places (Coffey, 1998). While the rank-size rule furnishes a tool to examine a hierarchical structure of an urban system with a relationship between the population sizes and the ranks of cities (Zipf, 1949), central place theory evaluates a hierarchical structure based on centrality measures and functions of cities for economic services such as goods (Christaller, 1966). Both approaches have a common aspect that they identify an urban system using city components such as population or their functions. However, the population size or the centrality of a city is still mutually associated with other cities in an urban system, which are often geographically nearby or have strong interactions. For example, a severe housing problem in a very densely populated city can be resolved with development of a residential area in nearby cities. Also, the functions of a city, such as employment, shopping, and leisure, can be highly influenced by the size of populations in nearby cities, because people can willingly travel to another city across city borders. Therefore, an investigation of an urban system only based on city characteristics without considering their connections can provide only a partial understanding. An examination of interactions among cities, such as commuting, can enhance understanding of the relationships among the cities and further provide additional insight into an urban system. Also, although the strength of interactions is related to the size and the economic characteristics of cities, they cannot be fully explained by them. Even though two cities have an equivalent population size, one city with strong functional connections is likely to have a greater level of external interactions than a self-sufficient city. Therefore, city sizes and interactions among cities are complementary factors in understanding an urban system.
However, empirical research on urban systems in the literature often focuses on either city components or interactions. Research on the Korean urban system has been conducted in the same manner. Many studies examine whether cities in South Korea follow the rank-size rule (Kim, 1973, 2011a,b; Kwon, 1998; Park and Kim, 2004; Lee, 2017) using Zipf's model. These studies discuss that its urban system was not much developed and showed a close distribution to the rank-size rule until the Korean War. Since the 1960s, it went through remarkable urban growth along with industrialization of its economy. This strengthened its primacy with increasing concentrations of population in Seoul, which is the largest city in the country. However, since mid-sized cities have grown in the 1990s and after, their primacy has tended to weaken.
On the other hand, other studies, focusing on connections among cities, examine their hierarchical structure using interaction data such as telephone call volumes (Yang, 1979), passenger bus services (Lee, 1990; Choi and Park, 2013), financial transaction networks (Choi, 1993), and commodity flows (Yoon and Hwang, 2012). These studies show that regardless of the data type, Seoul, the primate city, has heavy connections with other cities across the county and stays at the top of the urban hierarchy. Furthermore, its centrality has gradually strengthened, and sub-networks are formed around Seoul and some other large regional cities. The hierarchical structure of the city connections is closely related to their population sizes, but Seoul takes a more dominant role than one inferred from its population size. In contrast, regional cities stay at a lower hierarchy than one based on their population sizes. In the literature, commuting (or journey-to-work) data from its national census are widely used. Some studies investigated spatial interactions at the metropolitan level (Kwon, 2001; Jang and Moon, 2012; Noh et al., 2012), and others identified a linkage structure among cities within a specific metropolitan area (Sung et al., 2007; Son, 2013; Kim, 2014). Because the Korea National Statistical Office releases commuting data at its division level separately (it has a total of eight divisions), the commuting dataset does not include flows between cities in different divisions, which are assumed to be negligible. Hence, the analyses in the studies have focused on a specific metropolitan area instead of the entire county. This limitation of the national census data can make research on its urban system at the national scale insufficient. Not surprisingly, an investigation of the urban system often does not well address a (dis)similarity between urban structures identified based on, respectively, urban population sizes and spatial interaction. In sum, although city sizes and spatial interactions are complementary to each other in understanding the urban system, studies failed to sufficiently consider these two aspects together.
This paper investigates how the Korean urban system has developed from both aspects (that is, population sizes and spatial interactions) using two datasets, population data from its quinquennial census from 1955 to 2020, and commuting data from its decennial census from 2000 to 2020. This investigation is anticipated to describe its urban hierarchy structure and its temporal changes. In addition, the two approaches with population sizes and spatial interactions would provide complementary evidence for its urban system, which can lead to a better understanding of its urban system. In this paper, the urban system based on population sizes is examined at the city scale and the functional urban area scale with primacy indices, whereas spatial interaction indices that measure the strength, structure, and symmetry of linkages are utilized to investigate the characteristics of linkages among cities in the urban system. Finally, a cluster analysis is performed using both population sizes and a dominance index for linkages to identify a hierarchical structure in the urban system in South Korea.
The temporal trends of the urban systems in South Korea are investigated with two approaches, which are urban primacy patterns based on the population sizes of cities and interactions among cities. First, the urban primacy based on populations is examined with the urban rank-size distribution. The urban rank-size rule can be expressed as
where r denotes the ranks of cities in descending order based on their population sizes, Pr. P1 denotes the population size of the most populous city and q is a parameter, which is commonly estimated with linear regression after taking the logarithm on both sides of Equation (1). That is, the log-linear equation can be written as
The parameter q value for the perfect rank-size rule by Zipf (1949) is one, and a q value that is greater than 1 generally indicates an urban primacy pattern. Its urban primacy pattern is further examined with four other indices, which are defined with a ratio of the largest city population to the populations of other cities. The Urban Primacy index uses the total population of all cities (i.e., ), and the Two City index uses the second largest population (i.e., ). Ginsburg index uses the population sum of the second, third, and fourth largest cities (i.e., ), and Mehta (1964)'s Four City index uses the population sum of the four largest cities (). After Jefferson (1939), these relatively simple primacy indices have been utilized in the geography literature to examine the primacy structures of counties (e.g., Linsky, 1965; Rosen and Resnick, 1980; Ades and Glaeser, 1995; Galiani and Kim, 2008).
Second, spatial interactions among cities have been examined with five spatial interaction indices. The five indices are dominance index (DII), entropy index (EI), node symmetry index (NSI), relative strength index (RSI), and link symmetry index (LSI). While DII, EI, and NSI are measured at the node level of a network, RSI and NSI are measured at the link level. Limtanakool et al. (2007) present a framework to explore an urban system using these indices and examine urban systems in France and Germany. Also, they investigate the urban system in the Netherlands (Limtanakool et al., 2009). The DII indicates the importance of a node and is defined as
where and denote the inflow to nodes i and j, respectively (j = 1, …, J). That is, it is defined as the ratio of inflows to node i to the mean of the inflows for all nodes. The EI represents a degree that the magnitudes of interactions among cities are equal across all links. It ranges from 0 to 1; while 0 indicates interactions are concentrated to one link, 1 indicates all links have the same magnitude. The EI can be calculated as
where pl indicates the proportion of flows for link l to the total number of flows in a network (l = 1, …, L). The EI can be measured at each node similarly, which measures a level of evenness among all inflows to node j. That is, , where pij denotes the proportion of incoming flows to node j from node i (i = 1, …, I). The NSI indicates the symmetric pattern between the total inflow and the total outflow at node i. It is calculated as
where denotes the outflow from node j. The NSI ranges from −1 to 1. While 0 represents symmetry, −1 and 1 represent asymmetry with extremely negative and positive net flows, respectively.
The RSI and the LSI are measured at a link level. The RSI is a relative measure for each link to the total sum for all links. It can be expressed as
where Fij represents a flow from node i to node j. The RSI ranges from 0 to 1. The LSI measures a level of symmetry for flows between a pair of nodes. It can be expressed as
An LSI value of 0 indicates an extreme asymmetric flow pattern, which means interactions occur in one direction. Whereas 1 indicates a symmetric flow pattern between two nodes (an equal volume of flows for the two directions between two nodes).
After the Korean War caused damage to most of the infrastructure in the country, the Korean government developed and executed the Five-Year Economic Development Plan for economic reconstruction and recovery in 1962. This led to rapid growth of its economy and, subsequently, substantial urban growth and fundamental changes in the urban system. From the 1960's to the mid-1990's, the Korean economy continuously grew at an average annual rate of 8% or higher (Figure 1). Based on the rapid economic growth, Korea has transitioned its economic structure from an agricultural-centric, through an industrial-centric structure, and, further, to a post-industrial structure after the 1990's. In 1955, its economic structure had 46.1% of the primary sector, 15.1% of the secondary sector, and 38.8% of the tertiary sector. As such, agriculture, forestry, and fisheries had the largest share of the economy. Its economic structure changed quickly along with its growth. In 1990, the primary sector accounted for 8.4%, whereas the secondary and tertiary sectors accounted for, respectively, 40.2% and 51.4%; it reached the peak of its industrialization level. Since the 1990's, the proportions of the primary and secondary sectors have gradually decreased. In 2020, the proportion of the primary sector was only 2.0%, and the proportion of the secondary sector also decreased to 35.5%. This shows that Korea has experienced a de-industrialization process since the 1990s.
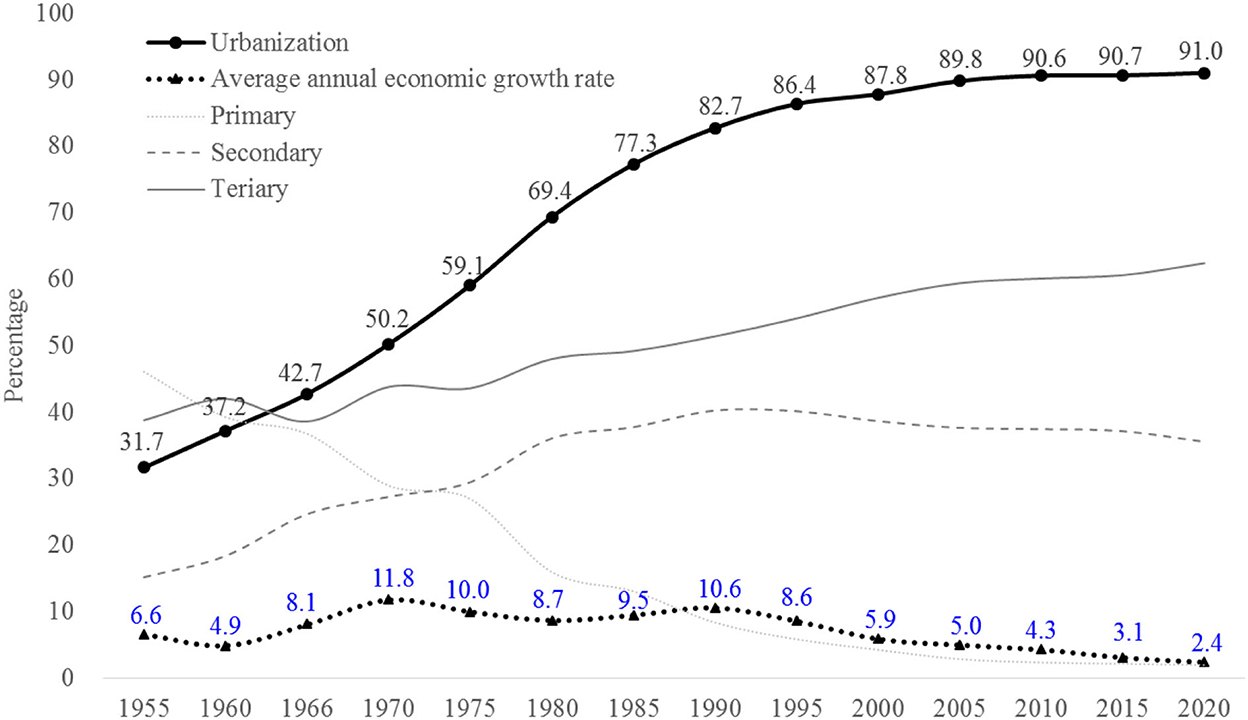
Figure 1. Average annual economic growth and urbanization rates during 1955–2020. Data sources: Economic Statistics System (https://ecos.bok.or.kr/) and Korean Statistical Information Service (https://kosis.kr/).
Figure 2 presents the distributions of the urban populations in 1960 (just before industrialization began in earnest) and in 2020 (the most recent census year). In 1960, the urbanization rate was only 37.2%, and Seoul was ranked as the top city with 2.445 million population, followed by Busan with 1.164 million population. Only one more city (Daegu) had more than half a million population, and the five other cities had more than 100,000 population. All other cities were of small size and would be considered local centers. Figure 2A shows that urban development was relatively weak and the population concentration in specific cities was relatively weak in 1960. Figure 2B portrays the population distribution in 2020 with an urbanization rate of 91.0%. Overall, its urban population grew considerably and, in particular, the population growth in the Seoul metropolitan area and the Busan metropolitan area is noticeable. Also, these two metropolitan areas have greater populations than other areas. Totally eight cities have one million or greater population in these two metropolitan areas: five cities in the Seoul metropolitan area and three cities in the Busan metropolitan area. This domination of these two metropolitan areas in urban population distribution is a result of a growth pole strategy centered around Seoul and Busan (The Korean Urban Geographical Society, 1999, p. 63).

Figure 2. Population distributions in Korea: (A) 1960 and (B) 2020.
The dynamics of the overall urban system change are examined with the relationship between the sizes and the ranks of the cities that have a population of 20,000 or greater at 5-year intervals from 1955 to 2020. Figure 3 presents the rank-size relationships of the cities on the log scale, for only selected years (10-year interval from 1960 to 2020). From 1960 to 1990, the rank-size curves are in parallel with increasing y-intercept values, generally, showing a pattern of population growth in all cities. But the growth of large cities is slightly greater than small cities, so the slopes of the curves are slightly steeper. The rank-size relationship shows a different pattern after 1990. Between 1990 and 2020, the population in the largest city (Seoul) stagnated or declined slightly, while the population growth in other large- or medium-sized cities was remarkable. The population growth in medium-sized cities is affected by the policy that integrated an urban area with surrounding rural areas (urban-rural integrated cities).

Figure 3. Rank-size distribution of Korean cities.
Specifically, 45 cities were integrated with their surrounding hinterlands for two main purposes: (1) efficient management of social issues such as water and sewage, transportation, and environment, and (2) balanced developments between urban and rural areas. The growth of medium-sized cities has continued since 2000. In particular, most cities in the Seoul metropolitan area (SMA) recorded a high population growth. For example, the population of Yongin increased 2.8 times from 386,124 in 2000 to 1,066,975 in 2020. With the growth of medium-sized cities, the slope of the rank-size curve became less steep. Summarizing the rank-size relationship shown in Figure 3, the Korean urban system showed a trend of strengthening its primacy until the 1990 and weakening its primacy structure thereafter.
To quantitatively examine the change of the primacy in South Korea, the q coefficient in the rank-size rule formula was estimated with linear regression without intercept [see Equation (2)]. Table 1 reports the estimated q coefficient values along with other urban primacy index values. The q coefficient in 1955 was 1.080, and the urban distribution system was close to a rank-size distribution (that is, the value was close to 1). Then, the q coefficients gradually increased and the largest value is observed for 1990 (1.261), which indicates the peak of its primacy. It can be explained by the fact that Seoul had its largest population in 1990. Since 1990, the q coefficients have continuously decreased, which indicates that the primacy of the urban system has weakened. Note that the R2 values for the regression estimates and the number of cities are reported in the appendix (Table A1).

Table 1. Changes in q coefficients and urban primacy indices (city scale).
Whereas the estimated q coefficients show that its primacy peaked in 1990, other urban primacy indices indicate its peak occurred in 1970. The Urban Primacy index, which is the ratio of a top-rank city's population to the total urban population (Ternent, 1976), increased from 1955 to 1970, and then monotonically decreased. The expected value of this index varies slightly depending on the number of cities under the condition of the perfect rank-size rule (i.e., q = 1). The expected value for 1955 with the smallest number of cities (67) is 0.208, and the expected value for 1985 with the greatest number of cities (156) is 0.178. The expected Urban Primacy index value in 1970 (when it has the largest value) is 0.188 with 113 cities. An Urban Primacy index value that is greater than the expected value indicates that an urban primacy tendency is stronger. All of the Urban Primacy index values in Table 1 are greater than the expected values, which indicates that primacy constantly appears in the Korean urban system. However, the trend has greatly weakened in recent years.
The Two City index represents the ratio of the first city population to the second city population and its expected value under the perfect rank-size rule is two (Marshall, 1989). A large value indicates a strong primacy tendency. All years except 1955 have a value of two or greater. The index value increases sharply until 1970 and then some fluctuations are observed. Nevertheless, it consistently maintains a high value. This pattern is different from the other indices that experience a noticeable decrease since the 1970. Ginsburg index (or the Four City index) uses the ratio of the largest city population to the sum of the second, third, and fourth city populations (Ginsburg, 1961). Under the perfect rank-size rule (q = 1), its expected value is 0.923, and a large value indicates a strong primacy. In 1955, the index value (0.848) is less than the expected value, which indicates no primacy in the urban system. But it increases rapidly after 1955 and reaches 1.535 in 1970. It decreases slightly until the 1990's but still has a relatively large number. When the urban-rural integrated cities were formed in 1995, the index value decreases considerably because the populations of the second, third, and fourth largest cities increased considerably. Finally, Mehta's Four City index, which is a modification of the Ginsburg index, uses a fraction of the population size of the largest city to the sum of the top four largest cities (Berry, 1961; Mehta, 1964; Richardon, 1977). Its expected value is 0.480 under the perfect rank-size rule. A large index value indicates a strong primacy tendency. These values are also greater than the expected values except for 1955, and the changing pattern is the same as that of the other indices. Unlike the Ginsburg index, its year-to-year deviation is relatively small because this index has the largest city population in the denominator.
Despite that the peaks indicated by the rank-size rule and the primacy indices do not match, the results suggest that the urban system in South Korea has developed toward a primacy distribution along with its industrialization and rapid economic growth until 1990. Then, the primacy trend weakened, and it gets closer to the rank-size rule (Lee, 2017). The growth of medium-sized cities is a major source for the change of the primacy structure, and it is largely concentrated on the SMA. For example, the average population growth rate in 2020 for the cities in the SMA is 29.02%, which is about 10% points higher than other cities (19.26%). Accordingly, the average ranking of the cities in the SMA rose to 33.03 in 2020 from 38.60 in 1995. The growth of these cities is closely related to the suburbanization of Seoul (Lee and Lee, 2008). This suburbanization is related to the development of “new towns” since the 1980 near Seoul to improve housing issues (i.e., housing shortage and house price increase). Specifically, the new towns were developed in five areas in Phase One (1989) and nine areas in Phase Two (2003) in the SMA, which, respectively, provided about 300,000 and 600,000 new housing units (e.g., Jun, 2020, p. 4). Then, a plan for Phase Three at seven areas in the SMA was announced in 2018. Most cities that experienced rapid urban growth during this period are located where these new towns were developed. With this suburbanization of Seoul, the volume of interactions between Seoul and its surrounding cities increased considerably. Compared to 1990, outflow commuting from Seoul to the surrounding areas increased by 74.4% (336,486 → 586,733 person/day), and inflow commuting to Seoul increased by 112.0% (669,752 → 1,419,800 person/day)1 by 2020. Accordingly, the growth of the cities that have a tight functional linkage to Seoul has greatly contributed to weakening the primacy level of the urban system in South Korea.
Additionally, the rank-size analysis is conducted for larger units than cities. Because the rank-size model is greatly affected by the number of cities and their sizes, a change of observational units can lead to different analysis results. That is, the rank-size rule is not free from the modifiable areal unit problem. While studies focus on varying definitions for cities or their functions rather than administrative boundaries (Malecki, 1980; Rozenfeld et al., 2011; Gomez-Lievano et al., 2012; Veneri, 2016; Budde and Neumann, 2019), larger areal units are used to reflect the functional expansion of some largest cities into their nearby cities. For example, the suburbanization of Seoul can be at least partially by the increase in commuting from/to Seoul as described in the previous paragraph. That is, it is expected that the development of satellite cities around a primate city can lead to a decrease in its primate level, despite its urban functions reaching satellite cities. In addition, Lee and Ahn (2005) present that new towns in the SMA still depend on Seoul for high-level consumer products, entertainment, and medical services. Veneri (2016) also discusses that defining a city based on economic and functional linkages rather than administrative boundaries can better reflect the actual size of a city. Following Veneri (2016), the rank-size rule was applied to the 18 functional urban areas (FUAs) using commuting data, which were demarcated in Noh et al. (2012). Table 2 presents the q coefficient values and urban primacy index values using the populations of the 18 FUAs from 1995 to 2020, for which the primary has weakened at the city scale. Note that the corresponding R2 values are 0.9998 or higher (see Table A2). Not only the q coefficient values but also all three urban primacy indices constantly increase, which indicates a strengthened primacy. This can be explained by the concentrations of population and core functions in the SMA despite the “balanced development policy” of the Korean government since the 2000 (Lee and Lee, 2019). While the population of Seoul decreased by 9.67% in 2020 from 1990, the population of the SMA increased by 40.12% during the same period. Currently, more than half of the population (50.25% as of 2020) as well as employment (51.15% as of 2019) are concentrated in the SMA.

Table 2. Changes in q coefficients and urban primacy indices (FUAs scale).
The analysis of the FUAs presents a potential weakness of the rank-size rule for the Korean urban system. The rank-size rule considers only the population sizes and their ranks. That is, it does not consider any other functional relationships. Cities tend to be highly interconnected in a contemporary urban system and their functions often reach beyond their administrative boundaries. So, an analysis of functional linkages among cities (which can be represented with spatial interaction such as commuting, population migration, and logistics flow) can be complementary to the rank-size rule. The next section discusses the urban system in Korea based on commuting.
Investigations on interactions among cities in South Korea had been limited due to data availability before commuting surveys were conducted in the 1990 census of the country (Kim, 1997). The Census Commuter Survey, which is based on a 10% sample, collects commuting data at the SI/GUN level (administrative units compatible with cities and townships). Statistics Korea makes the data available to the public at the division level; each division is formed with some highly interconnected SI/DOs (administrative units compatible with provinces). The flow data furnish the amount of flow data among sub-area (i.e., SI/GUN) within each division. Note that interactions crossing the division boundaries are not available (Noh et al., 2012). Despite this potential limitation, the data have been extensively used in urban studies because of their high reliability, such as demarcating metropolitan areas (Kwon, 2001; Jang and Moon, 2012; Noh et al., 2012) and analyzing urban linkages and their strengths within a specific metropolitan area (Sung et al., 2007; Son, 2013; Kim, 2014). However, few attempts have been made to measure the strength, structure, and symmetry of interactions among cities at the national scale. This section aims to examine interactions among cities in the Korean urban system and possibly to present a clustering structure. In addition, it examines how (dis)similar the relative importance of cities based on spatial interaction is with one based on population sizes. This comparison of these two results about urban hierarchy can reveal which cities are relatively self-sufficient or functionally dependent on other cities. A high level of functional dependency within a metropolitan area can support a statement that functional urban areas would be more appropriate for the rank-size rule analysis than administrative boundaries.
Table 3 presents the summary statistics of spatial interaction index measures from 2000 to 2020. The RSI shows a continuously decreasing tendency. The decreases in mean and standard deviation imply that the flows have been dispersed more evenly across all links and, in turn, the connectivity gets stronger, considering the increase of the total commuting volume (from 3,380,792 in 2000 to 5,098,272 in 2020). Also, the number of links with non-zero commuting increased from 2,318 in 2000 to 3,240 in 2020; this indicates that new commuting patterns have emerged. The decomposition of the RSI values between the SMA and non-SMA shows that the RSI values for the SMA are considerably higher and the RSI values for the non-SMA are quite below the national average. Figure 4 shows the spatial distribution of the RSI values for links as well as dominance index values for cities. Note that the RSI values for the links are the sum of the RSI values for the corresponding two directional links to avoid a visual complexity of a directed flow map. Also, only links with an RSI value of 0.001 or greater are displayed on the map due to the same reason. In the maps, several metropolitan areas can be noticeably identified with a high volume of commuting, and the connections among cities within the metropolitan areas have been strengthened over time. While other metropolitan areas have some major links only between their central city and hinterlands, the cities in the SMA form very complex connections: that is, not only with Seoul but also among other cities. The RSI share of the cities in the SMA increased from 72.4% in 2000 to 73.6% in 2020. Given that the total population in the SMA is slightly over 50%, the functional dependence among the cities within the SMA is noticeably high. The complexity and strength of the connections in the SMA have gotten gradually stronger. The number of links whose undirected RSI values are 0.001 or greater increased from 85 in 2000 to 101 in 2020, whereas the number of links in non-SMA decreased from 55 to 54.

Table 3. Descriptive statistics of spatial interaction indices (2000–2020).
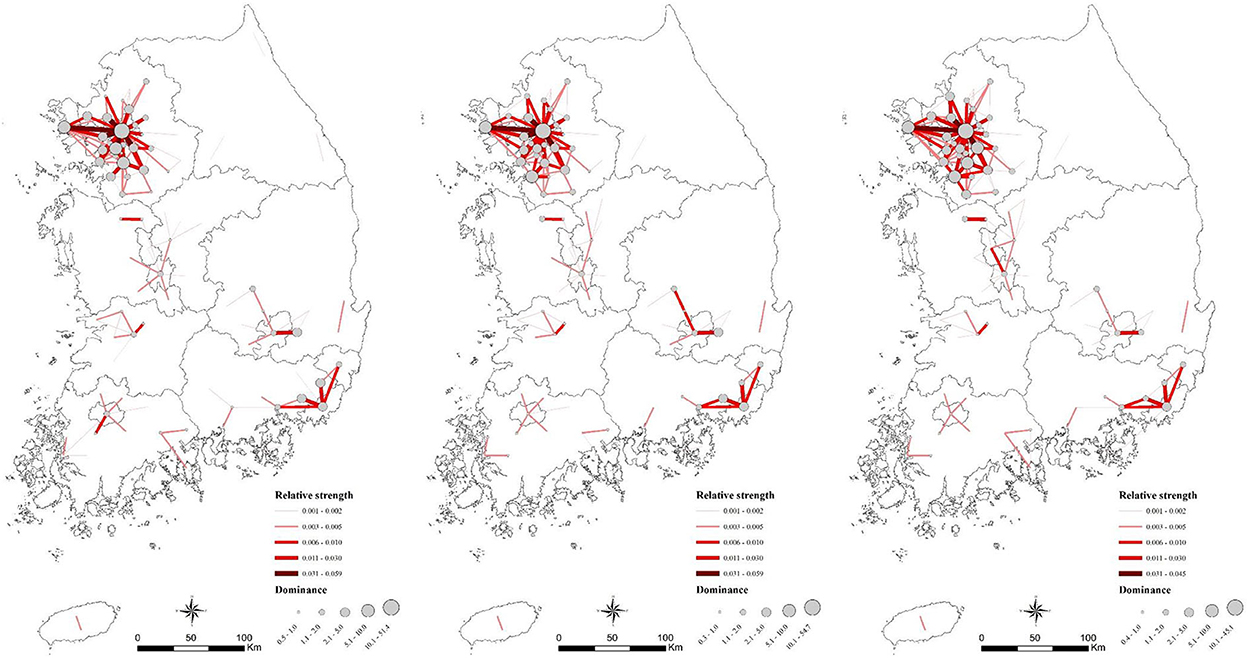
Figure 4. Relative strength and Dominance (2000, 2010, 2020). Note that only links where the sum of RSI of in- and outflow is ≥0.001; Only nodes with DII ≥0.5.
The change trends and the patterns of DII for the cities are generally similar to those of RSI. The DII values for the SMA are noticeably higher than the overall average (which is one), and non-SMAs have a value less than 1. It means that the cities in the SMA have a larger inflow of commuting. The medians and the standard deviations indicate that the concentration of commuting in some cities intensified between 2000 and 2010, and weakened slightly thereafter. Out of the 162 SI/GUNs, only 34 in 2000, 34 in 2010, and 38 in 2020 had an above-average DII value. In particular, the DII values for Seoul are 51.36 in 2000, 54.73 in 2010, and 45.11 in 2020, which are overwhelmingly high compared to other cities; the second largest DII value in any year does not exceed 10. Although the DII value for Seoul recently decreased slightly, the dominance of the SMA is consistently strong. The proportion of DII in the SMA cities increased from 72.47% in 2000 through 73.58% in 2010 to 73.71% in 2020. Figure 4 shows that cities with high DII values are clustered in the SMA. Compared to the previous period, the DII values of the SMA cities increased clearly, whereas non-SMA cities have a stagnant or decreasing trend. The DII results suggest that the urban system in South Korea has a mono-centric characteristic because of Seoul's overwhelming dominance, although the trend has recently weakened. The overall tendency is that the Korean urban system is quite far from a fully polycentric state. If the scope is restricted only to the SMA, the result shows that the SMA has a poly-centric spatial structure.
The EI values are between 0.665 and 0.716, indicating that the interactions are distributed among the links to some extent in the urban system. In addition, the continuously increasing EI values may suggest that the urban system gets more deviated from its mono-centric structure. The means of EIi are between 0.38 and 0.43. They are relatively stable until 2010 and increased thereafter. In other words, the concentration of inflow commuting in some cities has weakened since 2010. This trend is more prominent in the SMA. As shown in Figure 5, the overall EIi values increased largely between 2010 and 2020, and the variation across the divisions also decreased considerably. In particular, clusters with high EIi values (0.56 or greater) in the south of the SMA became more prominent. In other words, commuting interactions get more dispersed among the cities and, consequently, the connections among the cities have got stronger. The increasing patterns of EI and EIi may suggest that its hierarchical structure gets more relaxed and has gradually moved away from the mono-centric structure.

Figure 5. Distribution of entropy index (2000, 2010, 2020).
The NSI values that are greater than 0 indicate that incoming flows are prevailing over outcoming flows. This points out that commuting-inducing functions are relatively concentrated in some cities rather than evenly distributed across all cities. Until 2010, the asymmetry of the commuting flows intensified, but it tends to get weakened thereafter. The difference between the SMA and non-SMA is observed. The SMA has a value between −0.025 and −0.066, indicating that the commuting flow is relatively balanced, whereas non-SMA has a value between 0.183 and 0.292, indicating a high level of asymmetry. This may indicate that employment opportunities are more evenly distributed in the SMA, whereas the function is more concentrated in some large cities in non-SMA. The LSI values show a similar tendency to NSI. Overall, the ratio between incoming and outgoing flows gets more balanced, and it is more apparent in the SMA. For example, the means of the LSI values for the SMA are 0.823 in 2020 and higher than non-SMA. These symmetry indices also may suggest that the Korean urban system gradually gets more deviated from its mono-centric form, and the cities in the SMA lead this trend.
The spatial interaction-based index values have spatially and temporally autocorrelation patterns. Table 4 reports Moran's I values for the three calculated spatial interaction index values excluding the two symmetry indices. The Moran's I values for DII and EII are computed based on connectivity among the 162 areal units (see Figure 5), where the Moran's I values for RSI are calculated with the 26,244 (=162 × 162) flows among the 162 areal units. The network neighbors are defined with the Kronecker sum of the spatial weights matrix; that is,
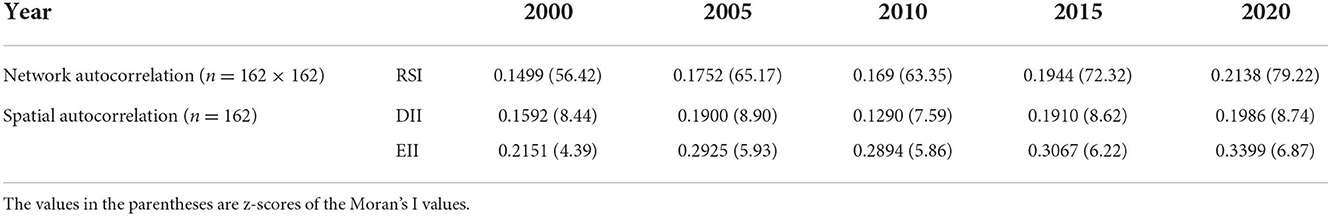
Table 4. The levels of spatial autocorrelation and network autocorrelation in spatial interaction index values.
where C denotes a spatial weights matrix among the 162 areas, I denotes an identity matrix, and ⊗ denotes Kronecker product. Details about network neighbor structures can be found in Chun (2008) and Chun and Griffith (2011). The results show that the DII and EII values have a significant level of spatial autocorrelation throughout all years. This confirms the map patterns of the EII values in Figure 5. Also, Moran's I values for the RSI values indicate that the RSI values are highly autocorrelated in the network flow structure for all years. One potential issue is that the presence of spatial and network autocorrelation may potentially have an impact on the index value calculations. For example, Griffith et al. (2022) argue that entropy index values can be also influenced by spatial autocorrelation. That is, such index values can be inflated or deflated when observed values are spatially autocorrelated. Table 5 shows that the values of RSI, DII, and EII are highly correlated for those years. These results may indicate that the structures did not have a dramatic change over the years.

Table 5. Temporal correlation of the spatial interaction index values.
In sum, the spatial interaction-based indices show the following patterns. First, the values of dominance, entropy, and link symmetry have gradually increased toward one; second, the node symmetry is closer to 0; and, third, the variability of relative strength measured for links has decreased. These trends may signal that the urban system gets more deviated from a mono-centric system and has developed closer to a poly-centric form. Nevertheless, these index values are still far from ones that represent a typical poly-centric state and, hence, it is sensible to understand that the Korean urban system is in a transitional (or intermediate) stage. Meanwhile, the SMA leads the transition from a mono-centric to a poly-centric urban system. Within the SMA, the urban system is much closer to a poly-centric system than the national level. The SMA has stronger interactions, a high level of complexity and symmetry, and a relatively low level of hierarchy.
An urban hierarchy in South Korea is investigated with both population sizes and spatial interactions. Among the five indices for spatial interaction, DII is directly related to a hierarchical structure among cities. The other two indices for cities (i.e., EIi and NSI) are associated with flows: the evenness of incoming flows and the balance of incoming and outgoing flows, respectively. Table 6 shows Spearman's rank correlation coefficients between the population sizes and the DII values for cities (excluding townships) used for the rank-size rule analysis. The non-parametric correlation is used because Seoul has overwhelmingly large values for its population and DII. Whereas the original DII formulation does not include intra-flows, additional DII values are calculated with intra-flows for comparison purposes. A high positive correlation is observed between the population sizes and the original DII values; the value ranges between 0.665 and 0.753. This indicates a disagreement between the rankings of the population sizes and the DII values, at least for some cities. In contrast, a near-perfect correlation is observed when intra-flows are included in the calculation of DII. That is, when intra-flows are considered, the ranking of DII becomes very similar to that of the population sizes.

Table 6. Rank correlation between population and DII.
Figure 6 presents the relationships with breakdown groups between the SMA and non-SMA. The difference between them is clear without intra-flows. Seoul has the highest value for both population size and DII. The SMA cities tend to have a similar or higher rank for their DII than their population sizes. In contrast, most cities in non-SMA have a lower DII ranking than their population rankings. On the other hand, when intra-flows are included, the DII values are almost perfectly correlated to the population size regardless of region. These may indicate that the SMA cities are functionally well-connected to and highly dependent on each other. That is, their inflow commuting has a larger volume than what their population size indicates. In contrast, non-SMA cities have relatively weak connections, so their inflow commuting is small compared to their population size. In other words, they are relatively independent or self-sufficient for residential and employment functions within a city.

Figure 6. Scatterplot between population sizes and DII (2020).
The rank correlation coefficients in Table 6 gradually increase over time. The main reason is that the population growth in South Korea is concentrated in cities with a high dominance; specifically, this trend was noticeable for cities in the SMA. In other words, many cities in the SMA have grown considerably and have strong spatial interactions with each other. This may provide support for the feasibility of using alternative boundaries (instead of administrative boundaries) in the rank-size rule analysis. That is, functional urban areas that are identified with functional connections can be more appropriate for Zipf's model.
A hierarchical clustering analysis with the ward's method is conducted to explore the urban structure using both the population sizes and the DII values. From the hierarchical clustering output (e.g., dendrogram), the result with six clusters was chosen to utilize the goodness of variance fit (GVF, e.g., Jenks and Caspall, 1971). That is, the GVF values, that are combined for the two variables, flatten out at the point with six clusters. Figure 7 presents the hierarchical clustering results for the years 2000 and 2020 with six clusters each. These maps show two noticeable changes in the urban system. First, the urban system has become more mature during the 20 years. Whereas the number of cities with the fourth order or above was only seven in 2000, that number increased to 20 in 2020. This may indicate that the polarized urban structure with a few high-order cities and many low-order cities gets gradually relaxed as medium-sized cities emerged. Second, the distribution pattern of high-order cities became clearer. High-order cities are distributed along with an axis connecting Seoul and Busan (Seoul-Daejeon-Daegu-Busan) and another connecting Seoul and Gwangju (Seoul-Daejeon-Jeonju-Gwangju). These cities are well connected to a major transportation network (i.e., highways and high-speed railways), which would contribute to their development. In addition, high-order cities are intensively concentrated in metropolitan areas, especially Seoul and Busan metropolitan areas. This distribution pattern indicates that the transport connections and functional dependencies within the metropolitan areas are potential factors for the urban hierarchy change.

Figure 7. Hierarchy of Korean cities (2000 and 2020).
This paper examines changes in the urban system in South Korea after the Korean War using the population sizes of cities and spatial interactions among them. The analysis results show that the Korean urban system had a primacy structure in which Seoul dominates and its primacy level increased until the 1990's. This phenomenon can be explained by its rapid economic growth and the population increase in Seoul during the period. Its primacy structure has weakened thereafter with the emergences of new medium-sized cities. One noticeable pattern of the new developments is that the cities are greatly concentrated in the Seoul Metropolitan Area, which was accelerated by the new town policy by the Korean government that led to the development of satellite cities around Seoul. This results in a heavy concentration of population and other resources in the metropolitan area, in which a large volume of daily life activities (including commuting) occur across city boundaries in the metropolitan area. The rank-size analysis based on the 18 aggregated functional urban areas confirms the concentrations to the metropolitan area. The analysis results using spatial interaction-based indices suggest that the cities have experienced strong interactions among them and a dependency level on large cities (i.e., Seoul and Busan) has weakened. That is, more interactions have emerged among medium-sized cities. However, the new interaction pattern has dominantly occurred among cities in the Seoul Metropolitan area.
Based on these analysis results, it may be concluded that the urban system in South Korea has deviated from a mono-centric structure that Seoul dominates, but it is now heavily dominated by the Seoul Metropolitan area. This may indicate that some urban functions of Seoul have been dispersed to near cities and this has led to a heavy concentration of population and resources in the metropolitan area. The hierarchical structure among cities based on population sizes and spatial interaction sizes also confirms this pattern.
This paper has some limitations. First, due to the data availability, the analysis of the spatial interaction is limited to years after 2000. Hence, its temporal coverages do not match that of the primacy index analysis. Also, spatial interactions between cities in different divisions are not available in the dataset; however, most of them are likely to have 0 or a trivial volume. Second, commuting volumes are used as a spatial interaction measure. While commuting is a representative measure, other interaction measures such as shopping and telecommunication volumes may reveal other aspects of spatial interactions. An investigation with such spatial interaction measures would merit future studies. Third, this paper utilizes conventional non-spatial statistical techniques for the data analyses. However, recent studies indicate a demand for spatial statistical methods. For example, Griffith (2022) shows that spatial autocorrelation has an impact on a rank-size analysis with a case study for the US metropolitan areas. Also, Griffith et al. (2022) present a method to account for spatial autocorrelation for entropy measures. Future research using spatial statistical methods would merit further investigations of the urban hierarchical structure.
Publicly available datasets were analyzed in this study. This data can be found here: Economic Statistics System (https://ecos.bok.or.kr/) and Korean Statistical Information Service (https://kosis.kr/).
All authors listed have made a substantial, direct, and intellectual contribution to the work and approved it for publication.
The authors declare that the research was conducted in the absence of any commercial or financial relationships that could be construed as a potential conflict of interest.
All claims expressed in this article are solely those of the authors and do not necessarily represent those of their affiliated organizations, or those of the publisher, the editors and the reviewers. Any product that may be evaluated in this article, or claim that may be made by its manufacturer, is not guaranteed or endorsed by the publisher.
1. ^Source: https://kosis.kr/.
Ades, A. F., and Glaeser, E. L. (1995). Trade and circuses: explaining urban giants. Q. J. Econ. 110, 195–227. doi: 10.2307/2118515
Berry, B. J. L. (1961). City size distribution and economic development. Econ Dev Cult Change. 9, 573–88. doi: 10.1086/449923
Bretagnolle, A., Pumain, D., and Vacchiani-Marcuzzo, C. (2009). “The organisation of urban systems,” in Complexity Perspective in Innovation and Social Change, eds P. Lane, and W. Van der Leeuw (Springer), 197–220.
Budde, R., and Neumann, U. (2019). The size ranking of cities in Germany: caught by a MAUP?. GeoJournal 84, 1447–1464. doi: 10.1007/s10708-018-9930-z
Choi, J.-H. (1993). Spatial analysis of financial activities in the Korean Urban System. J. Korean Geograph. Soc. 28, 321–355.
Choi, J.-H., and Park, E. S. (2013). Characteristics of the interurban linkages by analyzing passengers bus routes. J. Korean Urban Geograph. Soc. 16, 27–39.
Christaller, W. (1966). Baskin C., Central Places in Southern Germany, The Pioneer Work in Theoretical Economic Geography. Englewood Cliffs, N.J.; Prentice-Hall.
Chun, Y. (2008). Modeling network autocorrelation within migration flows by eigenvector spatial filtering. J. Geogr. Syst. 10, 317–344. doi: 10.1007/s10109-008-0068-2
Chun, Y., and Griffith, D. A. (2011). Modeling network autocorrelation in space–time migration flow data: an eigenvector spatial filtering approach. Ann. Assoc. Am. Geograph. 101, 523–536. doi: 10.1080/00045608.2011.561070
Coffey, W. J. (1998). Urban systems research: an overview. Can. J. Reg. Sci. 21, 327–364. doi: 10.1177/016001769802100302
Galiani, S., and Kim, S. (2008). “Political centralization and urban primacy: evidence from national and provincial capitals in the Americas,” in Understanding Long-run Economic Growth: Geography, Institutions, and the Knowledge Economy. University of Chicago Press. 121–153.
Gomez-Lievano, A., Youn, H., and Bettencourt, and L. M. A. (2012). The statistics of urban scaling and their connection to Zipf's law, PloS ONE. 7. E40393. doi: 10.1371/journal.pone.0040393
Griffith, D. A. (2022). The United States urban hierarchy: An update. Front. Sustain. Cities 4. doi: 10.3389/frsc.2022.852090
Griffith, D. A., Chun, Y., and Hauke, J. (2022). A Moran eigenvector spatial filtering specification of spatial entropy. Pap. Reg. Sci. 101, 259–279. doi: 10.1111/pirs.12646
Jang, H. Y., and Moon, T. H. (2012). Establishing city-region based on connectivity and their development directions. J. Korea Plan. Assoc. 47, 5–18.
Jefferson, M. (1939). Why geography? The law of the primate city. Geograph. Rev. 79, 226–232 doi: 10.2307/215528
Jenks, G. F., and Caspall, F. C. (1971). Error on choroplethic maps: definition, measurement, reduction. Ann. Assoc. Am. Geograph. 61, 217–244. doi: 10.1111/j.1467-8306.1971.tb00779.x
Jun, M. J. (2020). The effects of polycentric evolution on commute times in a polycentric compact city: a case of the Seoul Metropolitan Area. Cities 98, 102587. doi: 10.1016/j.cities.2019.102587
Kim, H. K. (1973). City size distribution and urbanization policy: focusing on Korea's urban growth in 1930~70, Urban Affairs 8, 52–74.
Kim, H. S. (2011a). Korean urbanization process in the Japanese colonial period. J. Korea Plan. Assoc. 46, 69–92.
Kim, H. S. (2011b). Analyzing characteristics of Korean urbanization based on population indices: comparing the Japanese colonial period with its front and rear periods. J. Korean Regional Dev. Assoc. 23, 19–46.
Kim, S. (2014). A Study on the change of spatial structure in the Seoul Metropolitan Area between 1995 and 2010. Geograph. J. Korea. 48, 57–68.
Kim, T.-H. (1997). Methods and evaluation of Korean population census. Korea J. Popul. Stud. 20, 27–46.
Kwon, Y. (2001). The delineation of the Seoul metropolitan region in Korea. J. Korea Plan. Assoc. 36, 197–219.
Lee, C. M., and Ahn, K. H. (2005). Five new towns in the Seoul metropolitan area and their attractions in non-working trips: implications on self-containment of new towns. Habitat Int. 29, 647–666. doi: 10.1016/j.habitatint.2004.05.004
Lee, H. W. (2017). The change of rank-size distribution under the economic development in Korea. J. Korean Urban Geograph. Soc. 20, 45–57. doi: 10.21189/JKUGS.20.2.4
Lee, H. Y., and Lee, S. M. (2008). The influence of new town development on the changes of the migration and commuting patterns in the capital region. J. Korean Geograph. Soc. 43, 561–579.
Lee, J. H., and Lee, M. H. (2019). Regional balanced development policy leverage in the capital and non-capital areas: focusing on local function concentration and dispersion structure. J. Korea Acad. Ind. Coop. Soc. 20, 502–512.
Lee, O. H. (1990). Urban System and Passenger Bus Network in Korea: 1960–1985 (Doctoral Thesis). Ewha Womans University, Seoul, South Korea.
Limtanakool, N., Dijst, M., and Schwanen, T. (2007). A theoretical framework and methodology for characterising national urban systems on the basis of flows of people: empirical evidence for France and Germany. Urban Stud. 44, 2123–2145. doi: 10.1080/00420980701518990
Limtanakool, N., Schwanen, T., and Dijst, M. (2009). Developments in the Dutch urban system on the basis of flows. Reg. Stud. 43, 179–196. doi: 10.1080/00343400701808832
Linsky, A. S. (1965). Some generalizations concerning primate cities. Ann. Assoc. Am. Geograph. 55, 506–510. doi: 10.1111/j.1467-8306.1965.tb00531.x
Malecki, E. J. (1980). Growth and change in the analysis of rank—size distributions: empirical findings. Environ. Plan. A 12, 41–52. doi: 10.1068/a120041
Mehta, S. K. (1964). Some demographic and economic correlates of primate cities: a case for revaluation. Demography 1, 136–147. doi: 10.1007/BF03208454
Noh, S. C., Sim, J. H., and Lee, H. Y. (2012). A study on the delimitation of city-regions based on inter-regional functional linkages in Korea. J. Korean Urban Geograph. Soc. 15, 23–43.
Park, H. S., and Kim, K. S. (2004). Analyzing changes in urban rank-size distribution using population data between 1969 and 2002. J. Korea Plan. Assoc. 39, 7–21.
Richardon, H. W. (1977). City Size and National Spatial Strategies in Developing Countries. Washington, DC: World Bank. p. 252.
Rosen, K. T., and Resnick, M. (1980). The size distribution of cities: an examination of the Pareto law and primacy. J. Urban Econ. 8, 165–186. doi: 10.1016/0094-1190(80)90043-1
Rozenfeld, H., Rybski, D., Gabaix, X., and Makse, H. (2011). The area and population of cities: New insights from a different perspective on cities. Am. Econ. Rev. 101, 2205–2225 doi: 10.1257/aer.101.5.2205
Son, S. (2013). Time-spatial changing patterns of commuting and students' commuting flows in Seoul metropolitan area. J. Korean Urban Geograph. Soc. 16, 119–134.
Sung, H. G., Kim, E. C., Park, J. H., and Kim, M. S. (2007). A study on the changes and characteristics of the connection system of cities, within the Korean capital region, using functional linkage analysis method. J. Korea Plan. Assoc. 42, 33–49.
Ternent, I. A. S. (1976). “Urban concentration and dispersal: Urban policies in Latin America,” in Development Planning and Spatial Structure, eds, Gilbert, A. G. (New York: Wiley).
The Korean Urban Geographical Society. (1999). The Korean Cities, Bobmunsa, Paju, Korea. Paju: Bobmunsa Publisher.
Veneri, P. (2016). City size distribution across the OECD: Does the definition of cities matter? Comput. Environ. Urban Syst. 59, 86–94. doi: 10.1016/j.compenvurbsys.2016.05.007
Yang, O. H. (1979). A study on the urban system in Korea through the analysis of long-distance telephone calls between cities. J. Geograp. Educ. 9, 203–223.
Yoon, C. H., and Hwang, Y. W. (2012). Korean urban system by an analysis of interurban relationship. J. Korean Urban Manag. Assoc. 25, 31–48.
Zipf, G. (1949). Human Behavior and the Principle of Last Effort. Cambridge, MA: Addison Wesley Press.

Table A1. Regression diagnostics for the rank-size estimations at the city level.

Table A2. Regression diagnostics for the rank-size estimations at the functional urban area level.
Keywords: urban hierarchy, South Korea, rank size, spatial interaction, urban system
Citation: Chun Y and Kim K (2022) Temporal changes in the urban system in South Korea. Front. Sustain. Cities 4:1013465. doi: 10.3389/frsc.2022.1013465
Received: 07 August 2022; Accepted: 28 October 2022;
Published: 29 November 2022.
Edited by:
Marco Millones Mayer, University of Mary Washington, United StatesReviewed by:
Youngho Kim, Korea University, South KoreaCopyright © 2022 Chun and Kim. This is an open-access article distributed under the terms of the Creative Commons Attribution License (CC BY). The use, distribution or reproduction in other forums is permitted, provided the original author(s) and the copyright owner(s) are credited and that the original publication in this journal is cited, in accordance with accepted academic practice. No use, distribution or reproduction is permitted which does not comply with these terms.
*Correspondence: Yongwan Chun, eXdjaHVuQHV0ZGFsbGFzLmVkdQ==; Kamyoung Kim, a2FteW91bmdraW1Aa251LmFjLmty
Disclaimer: All claims expressed in this article are solely those of the authors and do not necessarily represent those of their affiliated organizations, or those of the publisher, the editors and the reviewers. Any product that may be evaluated in this article or claim that may be made by its manufacturer is not guaranteed or endorsed by the publisher.
Research integrity at Frontiers
Learn more about the work of our research integrity team to safeguard the quality of each article we publish.