 James P. Carmichael
 Yuan Liao
- Department of Electrical and Computer Engineering, University of Kentucky, Lexington, KY, United States
Classical neural networks such as feedforward multi-layer perceptron models (MLPs) are well established as universal approximators and as such, show promise in applications such as static state estimation in power transmission systems. The dynamic nature of distributed generation (i.e. solar and wind), vehicle to grid technology (V2G) and false data injection attacks (FDIAs), may pose significant challenges to the application of classical MLPs to state estimation (SE) and state forecasting (SF) in power distribution systems. This paper investigates the application of conventional neural networks (MLPs) and deep learning based models such as convolutional neural networks (CNNs) and long-short term networks (LSTMs) to mitigate the aforementioned challenges in power distribution systems. The ability of MLPs to perform regression to perform power system state estimation will be investigated. MLPs are considered based upon their promise to learn complex functional mapping between datasets with many features. CNNs and LSTMs are considered based upon their promise to perform time-series forecasting by learning the correlation of the dataset being predicted. The performance of MLPS, CNNs, and LSTMs to perform state estimation and state forecasting will be presented in terms of average root-mean square error (RMSE) and training execution time. An IEEE standard 34-bus test system is used to illustrate the proposed conventional neural network and deep learning methods and their effectiveness to perform power system state estimation and power system state forecasting.
Introduction
In power systems an essential requirement is that of resiliency. In general, resiliency includes the ability of a power system to withstand and recover quickly from events that may be considered low-frequency, yet high-impact events or adverse conditions.
Examples of such events or adverse conditions relate to but are not limited to the following: Extreme weather, Natural disasters, Man-made outages (physical, cyber, coordinated), Lack of Observability, Topology Errors, and False Data Injection Attacks (FDIA).
The authors in Soltan et al. (2018) discuss the importance of ensuring robust state estimation in the presence of noisy environments and following a cyber attack to the grid.
State estimation process provides optimal estimate of the true values of bus voltages and angles and power flows across the power system (Schweppe and Rom, 1970; Schweppe and Wildes, 1970). The results provide the basis or enhancement for other power system applications such as system planning, optimization, fault analysis, protection, and fault location (Fan and Liao, 2018, 2019; Fan, 2019; Fan et al., 2021).
The novelty of the research for which this paper is based are two-fold:
• Provide for a more systematic approach to the selection of artificial neural network model architecture and hyper-parameters which to best of the author's knowledge, remains mostly ad-hoc.
• Investigation of the whether pseudo-measurements can be more effectively generated by taking advantage of the ability of CNNs and LSTMs to perform time-series forecasting as opposed to regression via MLPs.
This paper focuses on application of classical artificial neural networks and deep learning networks to distribution system state estimation (DSSE) and distribution system state forecasting (DSSF). There are various types of networks such as Conventional Feed-Forward Multi-Layer Perceptron Networks (MLPs) / Deep Neural Networks, Convolutional Neural Networks (CNNs), Recurrent Neural Networks (RNNs)/Long Short-Term Memory Networks (LSTMs), and Hybrid-Neural Networks Utilizing a Combination of Network Types. Preliminary results based on MLPs, CNNs, and LSTMs are presented in this paper.
The research for which this paper is based upon has not yet considered the impact of distributed energy penetration to the power grid, however it does make use of temperature data to predict power demand and resulting voltage profile of the proposed test distribution system.
The novelty of the research for which this paper is based are two-fold:
• Provide for a more systematic approach to the selection of artificial neural network model architecture and hyper-parameters which to best of the author's knowledge, remains mostly ad-hoc.
• Investigation of the whether pseudo-measurements can be more effectively generated by taking advantage of the ability of CNNs and LSTMs to perform time-series forecasting as opposed to regression via MLPs.
Materials and Methods
Review of Conventional State Estimation
State estimation research and application has historically been largely focused on transmission systems as opposed to distribution systems. With increasing developments of the “smart grid”, increased utilization of phasor measurement units (PMUs) and improvements in monitoring and communications, Distribution System State Estimation (DSSE) and Distribution System State Forecasting (DSSF) interest and research has greatly increased in recent years.
The inherent challenges of application of “conventional” state estimation techniques to power distribution systems based upon weighted least squares is well established in the literature.
In recent years, “deep learning neural networks” have gained increasing interest in not only being able to improve the weighted least squares method, but also in the possibility of being able to address what may be considered as “extreme” or “adverse” conditions such as, but not limited to lack of observability, topology errors, false data injection attacks, network outages due to weather or malicious attack, and variances in weather that may affect distributed power generation from solar and wind sources.
Conventional state estimation was introduced in 1970 via a series of papers authored by Fred C. Shweppe and J. Wildes. The overall problem, mathematical modeling and general algorithm for state estimation, error detection and identification are presented in Schweppe and Wildes (1970).
The key assumption of the classical approach presented is that the state estimation vector consisting of the voltage magnitude and phase angles at all generation and load buses is static or quasi- static. Further assumptions are that the system is balanced, linear and can be accurately approximated via an iterative algorithm utilizing weighted least squares as the estimator. While these assumptions are reasonable when applied to transmission systems, they may not hold for distribution systems.
An approximate model and the resulting simplifications in state estimation, bad data detection and identification are presented in Schweppe and Rom (1970). This model is based on a DC load flow yielding linear equations with the following four basic assumptions:
• Reactance over resistance of all lines are significantly larger than one.
• Magnitude of voltage ≈1 for all buses.
• Angle differences between voltages at two ends of all lines are close to zero.
• Existence of errors in real power measurements.
The resulting approximate model, while enabling potential application to distribution systems is not readily applicable to state estimation in general for practical transmission or distribution networks. Thus, (Schweppe, 1970) addresses implementation problems associated with dimensionality, computational efficiency, data storage and the time-varying nature of actual power systems.
The time-variation inherent in power systems is addressed in Shivakumar and Jain (2008). This paper is a review of dynamic state estimation (DSE) methods as opposed to static state estimation (SSE). These methods are based primarily on Kalman Filtering (KF) techniques, M-estimation, and the Square Root Filter (SRF) technique which is an alternative implementation of KF that is numerically more stable.
Paper Krumpholz et al. (1980) discusses the essential role of power system observability to the state estimation problem and presents a theoretical basis for an algorithm to determine observability. The authors emphasize the requirement that conventional or classical state estimation methods be applied only to systems that are observable and thus establish that an observability test be conducted prior to performing state estimation. The algorithm presented is based upon a graph theoretical or topological approach. Specifically, the algorithm seeks to determine if the Jacobian of the system parameter network h(x) is full rank. If so, the power system network is considered observable.
The challenges to state estimation due to lack of observability are further discussed in Kuhar et al. (2020). The authors reiterate the essential observability criteria needed in order to perform classic state estimation and further surmise that the first step to controllability is observability.
Again, the challenges imposed by the dynamic nature of power systems and especially that of distribution systems with high penetration of distributed energy resources (DERs) is noted as a significant barrier to the application of classical state estimation techniques.
While the authors do recognize the improvements that the placement of smart meters and PMUs have made in enhanced situational awareness and greater observability, they also point out that smart meters do not offer real-time updates and that the practical implementation of PMUs is and will continue to be limited due to their cost.
In the paper being referenced, robustness refers to the insensitivity of the state estimation algorithm to major deviations in a limited number of redundant measurements. Thus, it is clear that the challenges of applying classical state estimation methods based upon weighted least squares and similar estimators to distribution systems also extend to determination of system controllability, observability and robustness.
The authors in Electric Power Research Institute (Electric Power Research Institute, 2016) provide an in depth discussion of the growing threats to modern power system resiliency that applies to all aspects of the grid (i.e. generation, transmission, distribution, distributed generation, micro-grids, etc.). Investment in the modernization of the power grid must be done so with a “No Regrets Strategy”. This strategy is based upon the cornerstones of resiliency, flexibility and connectivity.
• Resiliency – Resistance to High-Impact, Low Frequency Events.
◦ Extreme Weather.
◦ Earthquakes, Tsunamis.
◦ Man-made Outages (Physical, Cyber, Coordinated).
◦ Flexibility – Adaptability to Uncertainties.
◦ Fuel Prices.
◦ Power Market Prices/Incentives.
◦ Variable Generation.
◦ Consumer Behavior.
◦ Regulation and Policy.
• Connectivity – Enhanced Interoperability Across Electricity Enterprise.
◦ Advanced Sensors.
◦ Mobile Devices.
◦ Grid Modernization.
◦ Two-Way Flow.
Distribution System State Estimation (DSSE)
Power system states are defined as the vector of the voltage magnitudes and angles at all network buses (Schweppe and Wildes, 1970). Novel approaches on system resource scheduling considering reserve were presented in Fan et al. (2021), Fan and Liao (2019), and advanced methods for protection and fault locations for distribution systems were described in Fan and Liao (2018) and Fan (2019). These techniques can all benefit from improved measurements and topology.
Essentially, state estimation algorithms provide for a means of eliminating or minimizing measurement noises and errors and possible topology errors that would otherwise prevent accurate determination of the system state values at all buses. Power system state estimation was initially introduced and applied to transmission systems only and then extended to distribution systems with relatively less accuracy, owing to the fundamental differences between distribution and transmission systems.
Among these differences are the radial topology, low X/R ratios, phase imbalances and relative lack of measurement devices inherent in distribution systems (Schweppe and Rom, 1970). With the emergence of the smart grid and distributed generation (DG), such as photovoltaic systems, wind turbines, electric vehicle to grid (V2G) technology and other forms of power penetration, power flow is now bi-directional as opposed to previously being unidirectional.
Additionally, given the unpredictable nature of renewable energy sources such as solar and wind energy as well as the varying real-time utilization of power inherent in distributed networks, updated state estimation (and state forecasting) algorithms is now necessary.
As mentioned previously, challenges to the application of “conventional” state estimation as applied to distribution systems relate directly to the fundamental differences of the two power system types.
Figure 1 presents an example of both types of power networks and some of the differences that pose a challenge to the direct application of conventional state estimation to distribution systems.
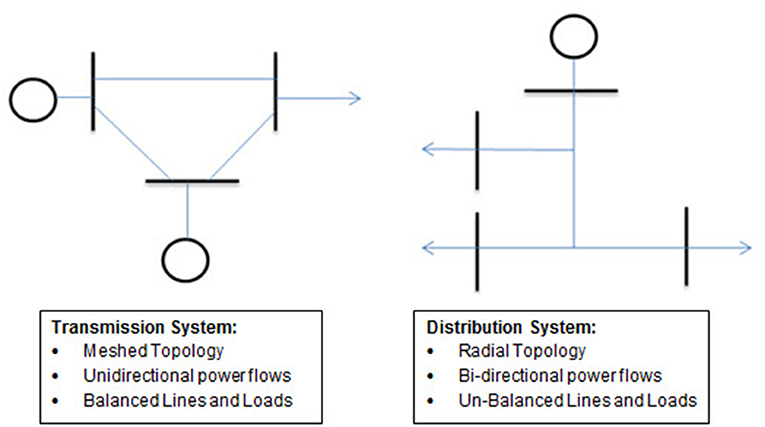
Figure 1. Transmission and distribution system key characteristics.
To appreciate the challenges that the emerging smart distribution grid pose to the direct application of conventional state estimation, it is essential to first understand the inputs and functional blocks that enable state estimation. Figure 2 provides an overview of the inputs and main functional blocks.
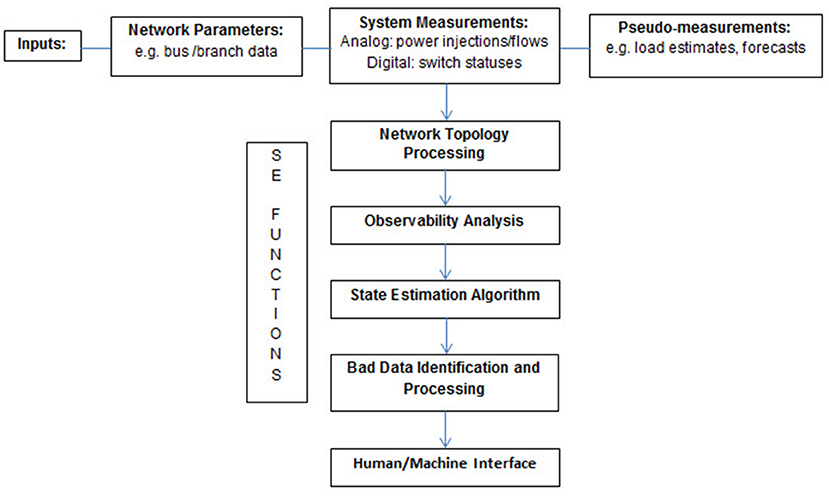
Figure 2. Functional block diagram of state estimation.
Note that the Network Topology Processing functional block verifies the accuracy of the network parameters included as Inputs. The Observability Analysis functional block establishes that there is sufficient data available for the State Estimation Algorithm functional block, and these two blocks may be integrated together in some methods. As discussed earlier, the relative lack of metering in distribution networks reduces the “observability” of the system.
The ability to meet this challenge, while being improved through the implementation of “smart meters” such as PMUs (phasor measurement units), will continue to be an inherent challenge in distribution networks as opposed to transmission networks. The State Estimation Algorithm functional block then seeks to determine a unique solution or system state. Also, critical to the overall state estimation functionality and final determination of the system state is the Bad Data Identification and Processing functional block that uses statistical techniques (e.g., Chi-square Test) to identify and filter out “noise” which may be related to inaccuracies in measurement meters and/or communication system failures.
Finally, the Human/Machine Interface functional block relates to the software and hardware utilized to visualize and otherwise monitor and control the power system.
Further challenges beyond lack of metering, are those associated with topology errors and false data injection attacks. The terms and consequences of lack of observability, topology errors and false data injection attacks will be explained in later sections of this paper.
Figure 3 summarizes the key characteristics of the “conventional” state estimator based upon weighted least squares.
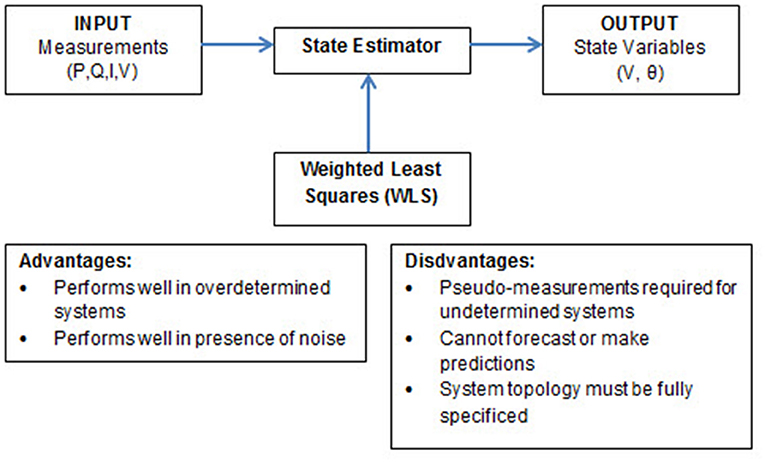
Figure 3. state estimator overview.
Note that the INPUT are typically measurements of P (Real Power), Q (Reactive Power), I (Current Flows), and V (Voltage Magnitudes), and the OUTPUT state variables are typically voltage magnitudes and voltage phase angles at all buses. With these two state variables, it is then possible to determine the remaining parameters such as Real and Reactive Power Injections and Current flow.
Note that one of the buses can be established as the reference bus or slack bus. Thus, if Bus 1 is established as the reference bus, then the phase angle for Bus 1 can be removed from the vector representation. Therefore, if there are n buses in the network, the total number of states is given as 2n – 1.
It is important to note that conventional state estimation applies only to overdetermined systems. Overdetermined systems are those in which the number of measurements exceeds the number of states. This critical and limiting requirement for application of conventional state estimation can be summarized in the following criteria:
• If the number of measurements is m, and the number of states is 2n−1, then in state estimation, m > 2n−1
• If m = 2n−1, the problem reduces to a power flow solution
Thus, as stated previously, distribution systems with limited measurement devices are inherently not overdetermined systems. For such underdetermined systems that may be either transmission or distribution networks lacking sufficient metering, observability is reduced and as indicated in Table 3, the state estimation algorithm must rely upon pseudo-measurements.
State Estimation Applied to Smart Distribution Systems
The authors of Dehghanpour et al. (2019) provide a survey on state estimation techniques and challenges in so-called “smart distribution systems”. This survey summarizes most of the essential concepts considered to this point regarding the following topics: Conventional mathematical formulation based upon an iterative algorithm utilizing weighted least squares or similar estimator, Application of pseudo-measurements to mitigate lack of sufficient metering to enable system observability, Consideration of optimal meter placement given the relatively limited metering, Network topology issues and effects, Impacts of renewable penetration, and Cybersecurity concerns. The paper goes further to make a distinction between “conventional” state estimation that is considered analytical and deterministic and “modern” state estimation that is considered data driven and probabilistic.
Regarding conventional state estimation, various “robust state estimators” are presented along with their pros and cons. For example, Generalized Maximum-likelihood (GM) has as a “pro”, Robust against bad data and a “con”, Parameter selection sensitivity.
Two major categories of data driven approaches are identified as alternatives to conventional state estimation based upon the previous list of estimators: Probabilistic and Statistical Approaches that employ spatial/temporal correlation and historical probability distributions, used widely for pseudo-measurement generation and uncertainty assessment, and Learning-Based Approaches/Machine learning algorithms that address problem of active/reactive power pseudo-measurement generation and uncertainty assessment.
Related to the recommendations of notable research directions, the paper (Baran and Kelley, 1994) presents previous work in the area of state estimation for real-time monitoring of distribution systems. While the work presented is based upon weighted least squares estimation, it shows the close correlation of state estimation accuracy to the initial starting point selected and accuracy of the forecasted loads.
Thus, an important takeaway from the work presented in Dehghanpour et al. (2019) and Baran and Kelley (1994) collectively is the idea of establishing a hybrid process involving classical state estimation algorithms and data-driven forecasting.
The data-driven portions would support the classical state estimation algorithm by providing a better starting point than a typical “flat start”, higher probability of convergence, and more accurate pseudo-measurements than those queried from large historical data repositories.
The design of an off-line planning method to enable real-time monitoring and control in systems with limited observability is considered in Yao et al. (2019) through consideration of robust measurement placement for distribution system state estimation. This paper proposes a robust measurement placement model to maximize estimation accuracy for DSSE over a wide-range of worst case operating conditions.
The problem is formulated as a mixed-integer semi-definite programming problem (MISDP). The authors seek to avoid combinatorial complexity through a convex relaxation, followed by a local optimization method. The approach demonstrates that accuracy of DSSE can be enhanced significantly by placing a limited number of measurements in optimal locations. Again, the approach taken, can be considered a hybrid approach of classical state estimation with probabilistic and statistical components that seek to minimize the effect of lack of observability on the weighted least squares estimator.
The paper presented in Haughton and Heydt (2013), provides a linear state estimation formulation for smart distribution systems. The authors assume the availability of synchro-phasors which yield direct voltage phasors at bus locations. Line power flows and current magnitudes are then able to be ascertained via the direct quantities available. The authors show that availability of direct voltage phasors effectively linearizes the h(x) coefficient matrix used in classical state estimation so that the result is a linear, non-iterative state estimation solution. Results confirm low computational burden, accommodation of meshed networks and avoidance of convergence issues which may occur in dealing with practical distribution systems with high r/x ratios. It should be noted, however that to achieve the results, the following must be maintained by the synchro phasors:
• Resolution Requirement: +/– 1 μS which corresponds to 0.0216 degree phase error in a 60 Hz system
• Maximum Allowable Total Vector Error (TVE): 1.0% when maximum phase error is 0.57 degrees
The authors in Deng et al. (2002) present a branch-estimation-based state estimation method for radial distribution systems. While this approach utilizes many of the conventional or classical state estimation techniques, it has the ability to handle most kinds of real-time measurements by decomposing the weighted least squares problem into a series of weighted least squares problems such that each sub-problem deals with single-branch estimation. The establishment of “zones” is an idea, where the entire distribution system can be comprised of much simpler single-branches and each zone will then correspond to a weighted least squares sub problem. Ref Deng et al. (2002) proposes two main parts: load allocation and state estimation. The load allocation portion is considered to be a real-time load modeling technique that incorporates use of customer class curves and provides a measure of the uncertainty (statistics) in the estimates. The purpose of this portion is to produce pseudo-measurements with a higher level of accuracy in real-time than historical data that must be retrieved from a large data repository. The state estimation portion then utilizes the pseudo-measurements that ensure observability and follows a traditional weighted least squares technique that is applied to each “zone”.
The authors propose that a forward/backward sweep scheme based upon this method would allow state estimation to be performed accurately for large-scale practical distribution systems while not requiring sparse matrix techniques.
Challenges of Applying Conventional State Estimation Utilizing Weighted Least Squares to Distribution Systems
The most common conventional state estimation algorithm is based upon the Weighted Least Squares (WLS) algorithm.
The following list provides some of the characteristics of distribution systems that pose major challenges to the direct application of conventional state estimation based upon weighted least squares:
• Radial Topology with bi-directional power flow
• Lack of adequate quality and quantity of measurement devices resulting in underdetermined systems and thus reduced observability
• Unbalanced Lines and Loads resulting in the need to consider all phases in the state estimator algorithm
• Unpredictability of energy sources injecting power back onto the grid (i.e. intermittent sunlight and wind, electric vehicles, etc.).
• Variability in the timing of power utilization throughout the day
• Low X/R ratios which do not allow for neglecting resistances
• Substantial number of nodes, combined with the need to consider all phases, result in the need for acquisition, storage and processing of substantial amounts of data
• Excessive noise resulting from the variety and lack of standardization of communication schemes between metering devices and the central control stations
It should be noted that the limitations listed above are considered “normal conditions” inherent in all distribution systems. The addition of “adverse conditions” noted previously further strengthens the case for needed research of methods such as artificial neural networks to maintain data integrity of distribution system state estimation and thus the overall resiliency of the modern power grid.
Lack of Observability in Distribution Systems
In the context of this paper, lack of observability will be directly related to the inability to accurately measure and store system values (power, voltage magnitude, voltage phase angles and current flow) of a distribution system due to lack of measurement devices, failures in devices, communication failures and/or malicious attacks that would also fall into the category of False Date Injection Attacks.
While there are increasing advances in and application of Phasor Management Units (PMUs) and so-called “smart-meters”, in this paper, there will not be an assumption that these devices are available at every bus location of a practical distribution system.
Thus, distribution system state estimation will be considered to be fundamentally challenged by lack of observability.
Topology Errors in Distribution Systems
In the context of this paper, topology errors will be directly related to errors in determination of system state values due to inaccurate determination of system breaker position. More generally, these errors could relate to incorrect determination of any device that involves switching or tap positioning.
The false status of system breakers could result from failures in devices, communication failures and/or malicious attacks that would also fall into the category of False Date Injection Attacks.
Thus, distribution system state estimation will also be considered to be fundamentally challenged by topology errors.
False Data Injection Attacks in Distribution Systems
In the context of this paper, false data injection attacks will refer to malicious attempts to alter data within distribution systems such that the true system state is made inaccurate. The goal of such attacks could be financial, such as controlling aspects of the power market or sabotage to the security of the power system resulting in power outages.
It should be noted that with advances in smart grid metering and reliance on digital communications, the susceptibility of the power grid to false data injection attacks will continue to be a growing security concern.
Thus, distribution system state estimation will also be considered to be fundamentally challenged (even threatened), by false data injection attacks.
Conventional Feed-Forward Multi-Layer Perceptron Networks (MLPs)
This type of network is considered the conventional or classical neural network model.
Figure 4 shows a “perceptron”, the fundamental building block of neural networks.
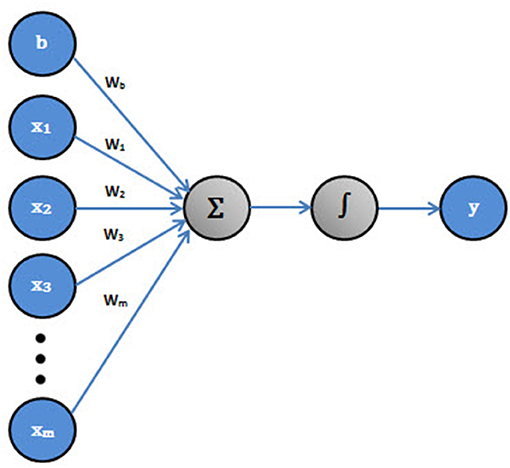
Figure 4. Perceptron building block of MLP networks.
Figure 5 depicts the functional blocks of a MLP network model.
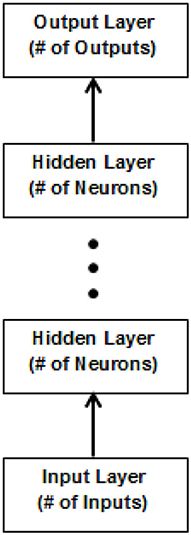
Figure 5. Multi-layer (MLP) model functional representation.
This type of network is considered a reasonable model for regression and classification problems. However, it has limited ability to predict or forecast sequence or time-series data as it does not maintain and share features between layers.
This type of neural network is also limited to how “deep” they can be in terms of number of layers that would otherwise enable them to solve more complex problems with greater accuracy.
Even with the noted limitations, this network type has promises to overcome many of the limitations of weighted least squares based state estimation. The principal advantage of this network type is the promise to accurately learn the mapping of inputs to outputs for a regression problem without the requirement of complex and large number of equations that would be necessary to perform non-linear regression on large distribution systems.
Convolutional Neural Networks (CNNs)
This type of network is considered to be an improvement upon the classical MLP architecture in that it learns directly from the input data and thus does not require a target dataset during training.
Figure 6 shows the general structure for a CNN model.

Figure 6. Convolutional neural network (CNN) model functional representation.
Note that this structure differs from that of the MLP structure presented in Figure 5 in that it contains the following additional fundamental layer types:
• Convolutional Layers
◦ Comprised of Filters and Feature Maps
◦ Filters correspond to neurons of the layer
◦ Filters have weighted inputs and produce outputs like a neuron
◦ Filters input size is fixed and is a “window” for convolution
◦ Feature Maps contain current values within the moving filter window
• Pooling Layers
◦ Down-sample and consolidate features learned from previous feature maps
◦ Serve to generalize or compress features selected
◦ Reduce overfitting of model training
◦ Simple functionality – selection of either maximum or average of input value to establish a new compressed feature map
• Dropout Layers
◦ Used between other layers to further reduce overfitting not completely eliminated by pooling layers by randomly excluding neurons
◦ Specified by a Dropout Percentage
• Flatten Layers
◦ Converts multidimensional arrays to vectors that can be sent to fully connected layers for final processing by activation functions
• Fully Connected Layers
◦ Normal flat feedforward neural network layer
◦ Contain a ‘softmax’ or nonlinear activation function to output probabilities of predicted classes
◦ Utilized at the end of network to create combinations of nonlinear features used for predictions
While primarily used in image/object detection and classification, computer vision and natural language processing, the research surrounding this paper will investigate the feasibility of this network type to perform regression so as to detect and correct data errors imposed upon distribution state estimation. Regression in this context is the determination of numerical values such as the predicted system state values or the numerical values indicating the error and/or variance between actual and predicted values.
The principal advantage of this network type is its ability to automatically learn and generalize features from the input data.
Recurrent Neural Networks (RNNs)
This type of network is also considered to be an improvement upon the classical MLP architecture in that it maintains an internal state (memory). There are three primary variants of RNNs:
• Bidirectional Recurrent Neural Networks (BRNN):
◦ RNNs that utilize future data along with data from previous inputs to improve accuracy
• Long Short Term Memory Networks (LSTM):
◦ Discussed in more detail in the next section.
• Gated Recurrent Units (GRUs):
◦ Like LSTMs, overcome short-term memory limitations of the basic RNN model
◦ Uses hidden states instead of “cell state” utilized by LSTMs
◦ Contains reset and update gates to control what information is retained and how much of this information to use for making predictions.
The principal advantage of this network type is that it maintains and passes features between layers, and thus very deep structures can be developed without the negative effects of exploding or vanishing gradients.
Long Short-Term Memory Networks (LSTMs)
This network is a type of RNN that can learn long-term dependencies between time steps of input sequence data by “remembering” the state between predictions. The following operations provide more details on the internal architecture of the LSTM unit.
• Step 1 – “Forget Gate” – Determines and eliminates previous information deemed as irrelevant and thus not useful
• Step 2 – “Store Gate” – Determines what new information to maintain as new candidate values
• Step 3 – “Update Gate” – Updates old cell state to new cell state
• Step 4 – “Output Gate” – Determines what is to be output for the next step
Hyper-Parameter Optimization
This research aims to provide an optimization method to determine the optimal hyper-parameters for desired performance metrics. Hyper-parameters include model parameters such as number of hidden layers and number neurons in a layer, and algorithm parameters such as adjustable learning rate. Hyper-parameters may be obtained using optimization methods such as grid search method, genetic algorithms, Bayesian optimization method, etc.
Selection of Base Distribution for Simulation
An IEEE 34 Bus Test Feeder radial distribution system was selected as the base test distribution system. It is shown in Figure 7 (Schneider et al., 2017).
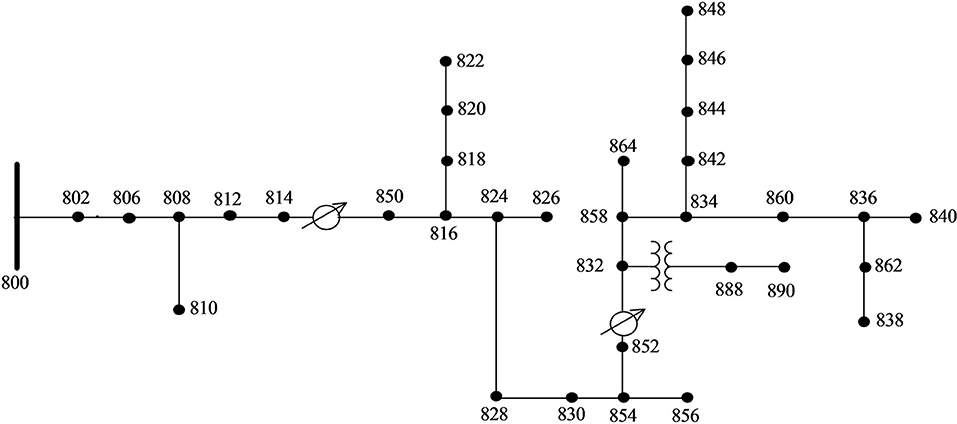
Figure 7. IEEE 34 node test base distribution system (Schneider et al., 2017).
Establishment of Measurement Points and Quantities
For purposes of training a supervised neural network, it was decided that the power (real and reactive) at each bus for all 3 phases would be measured and deemed the “input” dataset. The voltage and phase angle at each bus for all 3 phases were selected to be measured and deemed the “target” dataset.
The selected measurement points and quantities are shown in Figure 8. The labels corresponding to the “Key” represent either a power or voltage monitor, which is similar to a physical meter and will be discussed in more detail later.
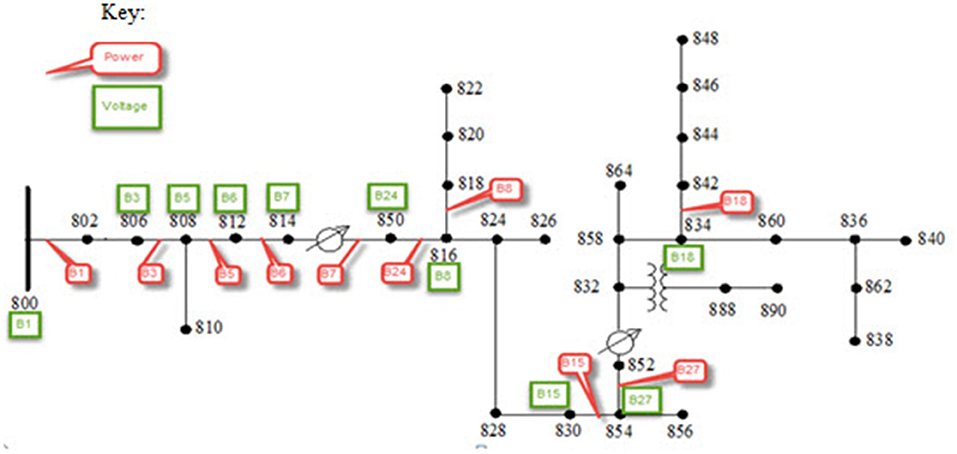
Figure 8. IEEE 34 node test base distribution system measurement points.
Note that power monitors capture the real and reactive power flow along the lines between specific nodes. Likewise, voltage monitors capture the voltage magnitude and voltage phase angle at specific nodes.
Power Flow Simulation to Establish Baseline Datasets
For purposes of performing a power flow simulation of the test feeder system to gather the power and voltage at each bus, OpenDSS from Electric Power Research Institute, Inc. (EPRI) was chosen. Note that the convention in OpenDSS is that Phase-1, Phase-2 and Phase-3 represent phases a, b, and c, respectively.
It was decided that the loads within the test distribution feeder would be varied over a time period of a year (8760 h) to yield a time-series dataset corresponding to the power and voltage as discussed previously.
To vary the base loads in a realistic manner, historical data from the Electric Reliability Council of Texas (ERCOT) as obtained. The load data for the entire ERCOT grid for every hour of the entire year of 2018 was selected. The ERCOT load dataset was then used to realistically scale the power (P and Q values) at each node that contains a load to establish the needed variation over a period of a year.
Note that “ERCOT” will be used as the baseline load profile, and all references to ERCOT datasets have their origin from the baseline power flow simulation of the test distribution system performed with varying loads according to this load profile.
OpenDSS (version 9.1.0.1, 64-bit build) was then utilized to perform a power flow simulation of the test feeder distribution system with varying load, and the real power, reactive power, voltage magnitudes and voltage phase angles were exported as power and voltage datasets. This exported data would serve as the input and target datasets from the test system under normal conditions. Training and testing of the neural networks types would be based upon this data.
Power Flow Simulation to Establish Previously Unseen Datasets
The previous steps related to performing a power flow simulation with OpenDSS were repeated with a different load profile to establish previously unseen data for validating the various neural network types.
Note that “COAST” will be used in descriptions of datasets that have their origin from the power flow simulation of the test distribution system performed with varying loads according to this load profile.
State Estimation Based Upon Regression
Conventional MLP Models were utilized to perform regression to map power data (real and reactive power) as inputs to voltage (voltage magnitudes and phase angles) as outputs. Utilization of MLPs for this purpose is reasonable given the ability of a suitable MLP to perform as a “universal function approximator”. This approach, however does not take into consideration time-series features of data such as seasonality.
For purposes of training a supervised MLP neural network to perform regression, it was decided that the power (real and reactive) at each bus for all 3 phases would be measured and deemed the “input” dataset. The voltage and phase angle at each bus for all 3 phases was selected to be measured and deemed the “target” dataset.
• Each dataset has the following characteristics:
◦ General Structure: (#samples, #features)
◦ Input Dataset Dimensions: (8760, 56)
◦ Target Dataset Dimensions: (8760, 56)
• Data would be split into 70% for Training and Testing data would be set to 30%.
◦ General Structure: (#samples, #features)
◦ Input Power Training Dimensions: (6132, 56)
◦ Input Power Testing Dimensions: (2628, 56)
◦ Output Voltage Training Dimensions: (6132, 56)
◦ Output Voltage Testing Dimensions: (2628, 56)
• The data included in the Training and Testing datasets were randomly selected as MLP network models were to perform regression without consideration of the temporal nature of the data.
• Power data (P and Q) values from a new power flow simulation were used to validate the trained MLP networks.
• The predicted output voltage dataset from each trained MLP network has the following characteristics:
◦ General Structure: (#samples, #features)
◦ Predicted Output Voltage Dimensions: (3760, 56)
State Estimation and Forecasting Based Upon Time Series Physics Aware Models
To add “awareness” of temporal dynamics and physics inherent in power systems, weather data (hourly temperatures at Dallas/Fort Worth International Airport for the entire 2018 year) were included in the training datasets. This data was selected to correspond with the original ERCOT datasets discussed in part C.
Figure 9 provides an example of the hourly temperature and real power demand for Dallas/Fort Worth for January 1, 2018.
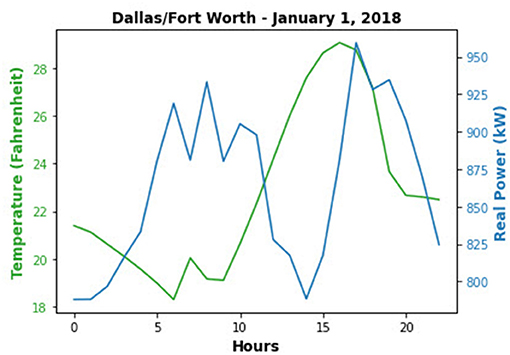
Figure 9. Hourly temperature and real power demand.
The datasets utilized in this research were restructured such that each “row” of data would correspond to a time element (hour) and each “column” of data would represent a unique time-series of measurement quantities or “features”.
In order to simplify the preliminary predictive model datasets, it was decided that only the power and voltage data associated with the substation bus would be considered. This corresponds to the power data and voltage data collected at Bus 800 with the OpenDSS monitor B1 in would be utilized for training and testing.
Although MLPs are not generally considered the optimal neural network type to perform time-series regression, weather data was utilized to train this network type to predict power demand. The power data (real and reactive powers) were then utilized to predict the voltage data (voltage magnitudes and phase angles).
CNNs and LSTMs are designed to perform auto-regression and classification on time-series data.
The “input” and “output” datasets utilized for the MLP models were combined into a single dataset with the following characteristics:
• General Structure: (#time-steps, #features)
• Dimensions: (8760, 112)
• CNNs and LSTMs require that the temporal ordering of the time-series dataset is maintained
◦ Splitting the dataset into 80% for Training and 20% for Testing
◦ First 7008 h – Training Dataset Dimensions: (7008, 112)
◦ Remaining 1752 h – Testing Dataset Dimensions: (1752, 112)
• CNNs and LSTMs require that Training and Testing datasets are reshaped into 3D-Arrays
◦ General Structure: (#samples, #time-steps, #features)
◦ Reshaped Training Dataset Dimensions: (292, 24, 112)
◦ Reshaped Testing Dataset Dimensions: (73, 24, 112)
• CNNs and LSTMs can be utilized to enable multivariate-multi-step time-series forecasting. Thus, the power system state estimation (PSSE) problem considered to this point can be viewed as power system state forecasting (PSSF).
• Preliminary CNN and LSTM models without hyper-parameter optimization were used to forecast the voltage magnitude and phase angles for the next 24 h. All variables were used to train the CNN model.
• Predictions of Real Power, Reactive Power, Voltage Magnitude and Voltage Phase Angle at the substation bus were made for the next 24, 168 and 672 h were made with MLPs, CNNs and LSTMs.
Results
Regression via MLP Model Without Hyper-Parameter Optimization
Table 1 presents training, testing and validation root-mean squared errors for nine MLP model architectures. As indicated in the table, the number of hidden layers and number of hidden layer neurons were varied. The number of input and output layer neurons was held constant at 56 neurons to correspond to the number of input and output features.
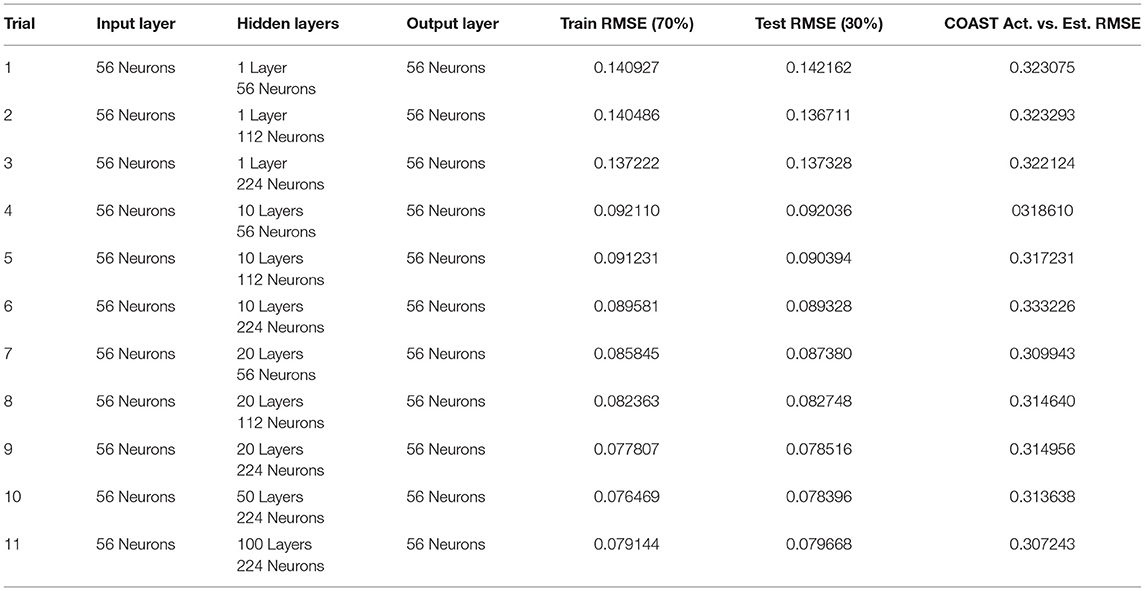
Table 1. Trial results for baseline MLP model without hyper-parameter optimization.
As indicated in this table, 70% of the ERCOT data was used for training and 30% was held out for testing. The “COAST Act. vs. Est” column shows results for the various architectures of the MLP when predicting output voltages and phase angles for COAST data that has never been seen by the neural network.
The results presented in Table 1 show that with adjustment of the number of hidden layers and number of hidden layer neurons, feedforward multilayer perceptron models (MLPs) show promise in terms of serving as a fully data-driven distribution system state estimator.
Demand and State Forecasting Based Upon Time-Series Data
The following tables show the results of the various model types (MLP, CNN and LSTM) in terms of their ability to forecast Real Power, Reactive Power, Voltage Magnitude and Phase Angles at the substation bus for various forecasting periods.
It is notable that the preliminary LSTM models without hyper-parameter optimization failed to converge during training for the forecasting horizons greater than 24 h as noted in Tables 3, 4 for either of the following systems:
• System I: Laptop
◦ Processor: Intel Core i7-350M CPU @ 2.90GHz
◦ Ram: 16.0GB
◦ Type: 64-bit Operating System
• System II: Google Colaboratory with GPU
Discussion
State estimation applied to electric power systems has been proposed since the early 1970s. The application of state estimation was primarily made to transmission systems as opposed to distribution systems. Classical or conventional state estimation was based upon an iterative algorithm to minimize error utilizing estimators such as weighted least squares. There are challenges to develop state estimation algorithms for power distribution systems due to inherent system unbalance among phases, bi-directional power flow and more recently, and dynamics and uncertainty associated with distributed energy resources (i.e. photovoltaic, wind, and electric vehicles).
This research focuses on data-driven approaches to the state estimation and state forecasting problem that employ the application of machine learning and neural networks in general and deep learning models in particular to mitigate the challenges associated with the direct application of conventional analytical approaches. Initial results based on MLPs, CNNs and LSTMs. are presented. The state estimation problem was staged with a power flow simulation of an IEEE 34 Node Test Feeder. This simulation provided input data consisting of real and reactive power flows between nodes and output or target data consisting of voltage magnitudes and phase angles at nodes for use in training MLPs. This same data was restructured as a multi-variate time series dataset for state forecasting for MLPs, CNNs and with lesser success LSTMs.
Some final take always from the current research for which this paper is based are the following:
• MLPs are capable of performing regression as “universal approximators” without hyper-parameter optimization for power system state estimation. Additionally, such neural network types enable “physics awareness” in terms of incorporating features such as temperature, humidity, barometric pressure etc. into the training datasets. The research has only considered the inclusion of temperature in the prediction of system state (real power demand, reactive power demand, bus voltage magnitude and bus voltage phase angle).
• For MLP models, without hyper-parameter optimization, there appears to be at this point in the research, no significant improvement in performing regression by utilizing more complicated networks in terms of number of layers and number of neurons. This is shown in Table 1.
• Table 2 shows that for MLP, CNN and LSTM models without hyper-parameter optimization, there appears to be at this point in the research, no significant advantage of selecting one model type over another in terms of average RMSE, when the forecast horizon is 24 h, however CNNs and LSTMs require greater training execution time for model architectures considered.
• Tables 3, 4 show that for MLP, CNN, and LSTM models without hyperparameter optimization, the training execution time for both CNNs and LSTMs increase as the forecasting horizon is extended. The additional complexity of the convolution operations required in CNNs is a reasonable explanation for increased execution time when tasked with making predictions over a larger time frame. The increased memory required to maintain system state throughout LSTM execution is a reasonable explanation at this point in the research to account for failure to converge during training when the training horizon is extended beyond 24 h.
• CNNs and LSTMs are capable of performing time-series forecasting by learning from the input data itself as opposed to requiring separate input and target datasets required by MLPs that perform regression. Such models are therefore able to take advantage of time-series features such as seasonality and trends, however the research has shown greater computational burden required of CNNs and LSTMs. This is shown in Tables 2–4 in the column “Execution Time.”
• The research to this point has shown that once trained on time-series data, CNNs and LSTMs show limitations on being able perform regression on data never seen before and that this limitation is not applicable to MLPs. Thus, once trained, MLP models may be presented with new input data to make new predictions via regression. The research has not shown at this point that CNNs and LSTMs are well-suited to applications for which learning functional mapping of inputs to targets is required. This suggests that these two network types may be better suited for classification and forecasting involving data that is auto-correlated.

Table 2. 24 h forecast (Average RMSE) at substation bus.

Table 3. 168 h forecast (Average RMSE) at substation bus.
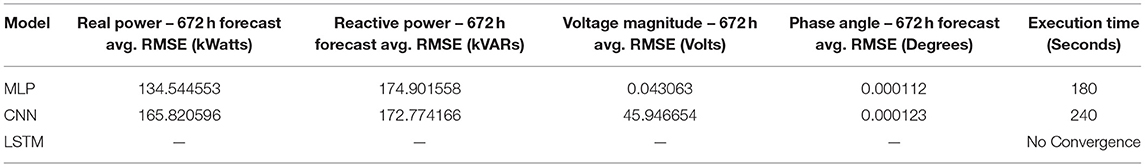
Table 4. 672 h forecast (Average RMSE) at substation bus.
Initially, the models were not optimized and their configuration followed an ad-hoc or heuristic approach. Future research will involve the following:
• Investigation of performance of MLPs, CNNs, and LSTMs to produce pseudo-measurements to account for reduced observability and communications failure for specific time-intervals. Performance will be compared on the basis of training execution time and root mean square error (RMSE) between the actual and predicted time series. The scenario is shown in Figure 10 below in which there is a loss of communications from meters that gather P and Q values during the shaded time interval at the substation. For this time interval, each network type will be applied to establish predicted measurements. There will also be a prediction for V_mag and V_phase during this same time interval. This could be extended to other bus locations that experience loss of communication and additional time periods of communication loss.
• Comparison of the computational burden of MLPs, CNNs, and LSTMS to perform regression in the case of MLPs and time-series forecasting in the case of CNNs and LSTMs to accomplish the aforementioned generation of pseudo-measurements. Research to this point has already confirmed that “ad-hoc” approach for networks such as LSTMs in particular have resulted in non-convergence of training even utilizing GPUs.
• Investigation of hyper-parameter optimization for each network type (MLPs, CNNs, and LSTMs) based upon Grid Search, Bayesian Optimization, and Genetic Optimization algorithms to reduce computational burden.
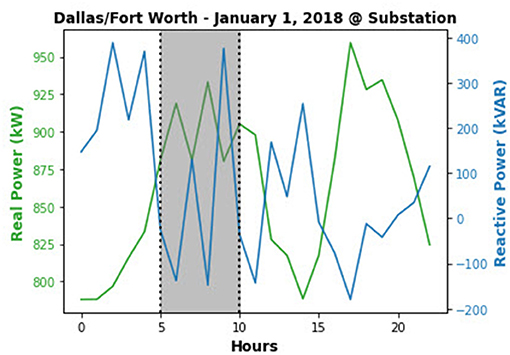
Figure 10. Prediction of system state during periods of communication loss.
Data Availability Statement
The raw data supporting the conclusions of this article will be made available by the authors, without undue reservation.
Author Contributions
JC performed the research, implemented the methods, and prepared the paper draft. YL directed overall research, method formulation, advised on implementation, and paper writing. Both authors contributed to the article and approved the submitted version.
Conflict of Interest
The authors declare that the research was conducted in the absence of any commercial or financial relationships that could be construed as a potential conflict of interest.
Publisher's Note
All claims expressed in this article are solely those of the authors and do not necessarily represent those of their affiliated organizations, or those of the publisher, the editors and the reviewers. Any product that may be evaluated in this article, or claim that may be made by its manufacturer, is not guaranteed or endorsed by the publisher.
References
Baran, M. E., and Kelley, A. W. (1994). State estimation for real-time monitoring of distribution systems. IEEE Trans. Power Syst. 9, 1601–1609. doi: 10.1109/59.336098
Dehghanpour, K., Wang, Z., Wang, J., Yuan, Y., and Bu, F. (2019). A survey on state estimation techniques and challenges in smart distribution systems. IEEE Trans. Smart Grid. 10, 2312–2322. doi: 10.1109/TSG.2018.2870600
Deng, Y., He, Y., and Zhang, B. (2002). A branch-estimation-based state estimation method for radial distribution systems. IEEE Trans. Power Deliv. 17, 1057–1062. doi: 10.1109/TPWRD.2002.803800
Electric Power Research Institute. (2016). Electrical Power System Resiliency: Challenges and Opportunities, EPRI White Papers, February 2016.
Fan, W. (2019). Advanced Fault Area Identification and Fault Location for Transmission and Distribution Systems, Dissertation. USA.
Fan, W., Hossan, M. S., Zheng, H., Cook, A., Zaid, S., and Fard, S. A. (2021). A CVR On/Off status detection algorithm for measurement and verification. In: 2021 IEEE Power and Energy Society Innovative Smart Grid Technologies Conference (ISGT), Washington, DC. USA. p. 1–5. doi: 10.1109/ISGT49243.2021.9372257
Fan, W., and Liao, Y. (2018). Fault identification and location for distribution network with distributed generations. Int. J. Emer. Electr. Power Syst. 19, 1–13. doi: 10.1515/ijeeps-2018-0048
Fan, W., and Liao, Y. (2019). Microgrid operation optimization considering storage devices, electricity transactions and reserve. Int. J. Emerging Electr. Power Syst. 20, 1–17. doi: 10.1515/ijeeps-2019-0003
Haughton, D. A., and Heydt, G. T. (2013). A linear state estimation formulation for smart distribution systems. IEEE Trans. Power Syst. 28, 1187–1195. doi: 10.1109/TPWRS.2012.2212921
Krumpholz, G. R., Clements, K. A., and Davis, P. W. (1980). Power system observability: a practical algorithm using network topology. IEEE Trans. Power Appar. Syst. 4, 1534–1542. doi: 10.1109/TPAS.1980.319578
Kuhar, U., Kosec, G., and Svigelj, A. (2020). Observability in Distribution Systems. 2020 – Full Textbook. doi: 10.1007/978-3-030-39476-9
Schneider, K. P., Mather, B. A., Pal, B. C., Ten, C. W., Shirek, G. J., Zhu, H., et al. (2017). Analytic considerations and design basis for the IEEE distribution test feeders. IEEE Trans. Power Syst. 33, 3181–3188. doi: 10.1109/TPWRS.2017.2760011
Schweppe, F. C. (1970). Power system static-state estimation, part III: implementation. IEEE Trans. Power Appar. Syst. 1, 130–135. doi: 10.1109/TPAS.1970.292680
Schweppe, F. C., and Rom, D. B. (1970). Power system static-state estimation, part II: approximate model. IEEE Transac. Power Appar. Syst. 1, 125–30. doi: 10.1109/TPAS.1970.292679
Schweppe, F. C., and Wildes, J. (1970). Power system static-state estimation, part I: exact model. IEEE Transac. Power Appar. Syst. 1, 120–25. doi: 10.1109/TPAS.1970.292678
Shivakumar, N. R., and Jain, A. (2008). A review of power system dynamic state estimation techniques. In: 2008 Joint International Conference on Power System Technology and IEEE Power India Conference. p. 1–6. doi: 10.1109/ICPST.2008.4745312
Soltan, S., Mittal, P., and Poor, H. V. (2018). Bayesian regression for robust power grid state estimation following a cyber-physical attack. In: 2018 IEEE Power and Energy Society General Meeting (PESGM), p. 1–5. doi: 10.1109/PESGM.2018.8586142
Keywords: artificial neural networks (ANNs), multilayer perceptron networks (MLPs), convolutional neural networks (CNNS), long short-term memory networks (LSTMs), state estimation, state forecasting, distribution systems
Citation: Carmichael JP and Liao Y (2022) Application of Deep Neural Networks to Distribution System State Estimation and Forecasting. Front. Sustain. Cities 3:814037. doi: 10.3389/frsc.2021.814037
Received: 12 November 2021; Accepted: 14 December 2021;
Published: 07 January 2022.
Edited by:
Om Prakash Mahela, Rajasthan Rajya Vidyut Prasaran Nigam Limited (RVPN), IndiaReviewed by:
Ram Niwash Mahia, National Institute of Technology Hamirpur, IndiaGajendra Chawda, Indian Institute of Technology Jodhpur, India
Suresh Singh, Enerzinx India Pvt. Ltd, India
Copyright © 2022 Carmichael and Liao. This is an open-access article distributed under the terms of the Creative Commons Attribution License (CC BY). The use, distribution or reproduction in other forums is permitted, provided the original author(s) and the copyright owner(s) are credited and that the original publication in this journal is cited, in accordance with accepted academic practice. No use, distribution or reproduction is permitted which does not comply with these terms.
*Correspondence: James P. Carmichael, SnBjYTIyN0BnLnVreS5lZHU=