 Muhammad Rashidul Hasan
 Md. Rakibul Hasan Kauser
 Jihan Ibrahim
- Department of Urban and Regional Planning, Chittagong University of Engineering and Technology, Chattogram, Bangladesh
Fire can have its origin either in natural or human activities resulting in death and/or property damage in a very short period of time. To develop fire hazard-resilient cities proper attention should be given to all possible sections of development to facilitate the service. Chattogram City is the second largest city of Bangladesh. Due to rapid rate of urbanization and unplanned growth of urban centers; hazards like fire have become a menace for the Chattogram City Corporation (CCC) area. So, the main objective of this research is to identify the nature of the fire hazard by analyzing frequency and intensity over time through different checklists and analyzing the existing firefighting capacity. In addition to past fire incident records, a direct questionnaire survey was utilized and expert opinion was solicited for primary data collection. Using geographical information systems (GIS) techniques, this study found that nine fire stations in the CCC area exhibited different frequency and intensity in different categories such as type of structure, land use, source of fire, damage, and losses in last 5 years. The number of fire incidents increased from 200 to 675 which indicates that the frequency increased over time. Among 2,514 fire accidents, 47% occurred in residential areas and 27% occurred in commercial areas. Fire intensity also varied with seasonal variation over a year. Within the last 5 years, the Chattogram City Corporation dealt with a 179,091,200 BDT financial loss and 83 people were injured, of which 15 were due to fire accidents. One the other hand, only nine fire stations serve the ~155 sq.km area and ~6 million people live in the CCC area which is 17 and 19 times larger than that of Bangkok and Oklahoma City. Finally, this data-driven approach and findings could help emergency planners to take necessary steps for improving firefighting capability to ensure better fire safety and resiliency.
Introduction
The trend of urban fire is closely related to the level of urbanization of an area (Wang et al., 2001) and globally this urbanization is taking place rapidly. In 2007, for the first time in history over half of the world's population, 3.3 billion people, were living in urban areas (FIG, 2010). And now 54% of the world's population lives in urban areas which is expected to increase to 66% by 2050 (UNDESA, 2014). Day by day, it is becoming increasingly difficult to manage this urban growth in a sustainable way. In addition, urban areas become vulnerable to different types of natural and man-made hazards (FIG, 2010). Generally, the process of urbanization and industrialization leads to changes in fuel amounts, composition, and its configuration. In addition to the change of land use, cities are experiencing an increased risk of fire (Wang et al., 2015).
As per UN data, ~25% of Bangladesh's current population lives in urban areas. This fast urbanization is putting pressure on the city's limited land, an already fragile environment with weak urban services (Zaman et al., 2014). Due to its geographical location, Chattogram City experiences numerous natural and man-made disasters every year. The rapid urbanization rate and unplanned growth of urban centers are creating more a vulnerable environment for the citizens. Recently, hazards like fire have become a menace for Chattogram. Most of the structures are owner-built, non-engineered in nature, structurally vulnerable for fire hazard, and are built to gain profit within a short time span through increasing commercial floor space without any essential structural measures to make it fire-resistant. On the other hand, many physical infrastructures and buildings such as sea ports, airports, EPZs (export processing zones), refineries, power stations, industries, etc. at Chattogram were constructed two centuries earlier without considering fire safety provisions; these buildings are more vulnerable to fire hazard (Bhuiyan et al., 2006; Masud, 2007; Kauser et al., 2016, 2017b,c). Due to a recent fire in Chattogram, 5 civilians were injured, 1 died, and 200 shops were destroyed incurring an overall loss of around BDT 10 Lakh1 (Kauser et al., 2017a, Daily Star 2017; Dhaka Tribune, 2018). As a port city in Bangladesh, Chattogram has become one of the main business hubs in the country. Garments factories and commercial areas are also growing with the city without adequate fire safety provisions and thereby increasing the fire threat in this sector.
There are limited numbers of studies conducted on fire hazards in Chattogram and most of the research focused on RMG (ready-made garments) sectors in the city. So, in this research, fire hazards of the Chattogram City Corporation (CCC) area will be analyzed in a comprehensive way for achieving sustainable cities and communities. The main objective of the study is to observe the nature of fire through intensity and frequency over time in the Chattogram City Corporation area and also to study the firefighting capacity of the fire stations serving the CCC area.
Bangladesh Fire Service and Civil Defense
In Bangladesh, BFSCD Directorate is the first emergency respondent in all natural and man-made calamities and they remain alert round the clock to fight fire and conduct surface rescue operations. During 1939-40, the British government first established a fire service in the Indian subcontinent. Later in 1981, the Fire Service Directorate and the Civil Defense Department were merged and established as the BFSCD. According to the “Fire Protection and Extinguishing Act, 2003,” the BFSCD can access any water source if required, has power to grant design approval for new settlements, inspects existing buildings for reducing fire risk, and maintains fire safety standard for all structures. Besides, training and drills are also arranged by the BFSCD to garner a more resilient community. After the incident of Rana Plaza in 2013, the Fire Service department received negative attention and determined that improvement is needed to serve the population. In addition to the 2003 Act, the Bangladesh National Building Code 2014 has rules for building construction and road layout design. The final draft of the code is being prepared and is likely to be converted into a law for ensuring public safety including fire safety (Tishi, 2015).
Study Area
Chattogram City is the second largest city of Bangladesh and situated on the banks of the Karnafully River. It is also the principal city of the Chattogram division and a major hub of commerce and industry. The city, under the jurisdiction of the City Corporation, has a population of about 6 million and is constantly growing (Kauser et al., 2017a; Kauser and Neema, 2019; CDA, 2020). Fire is an uncertain hazard. It can occur almost anywhere with storage and use of inflammable materials. Without rapid response, fire hazards can result in a huge loss of human life and properties. Recently, fire occurred three times in ward number 1 (South Pahartoli regions) affecting 20 families, 80 people were injured with a property loss of 5 Lakhs. A fire in 2013 affected one family and resulted in the loss of ~50,000 BDT (ADPC, 2020). A recent fire in Chattogram resulted in 1 death, injuries to 5, 200 shops destroyed, and a loss of around BDT 10 Lakhs (The Daily Star, 2017; Dhaka Tribune, 2018). Figure 1 shows the location of the study area (Chattogram City Corporation area).
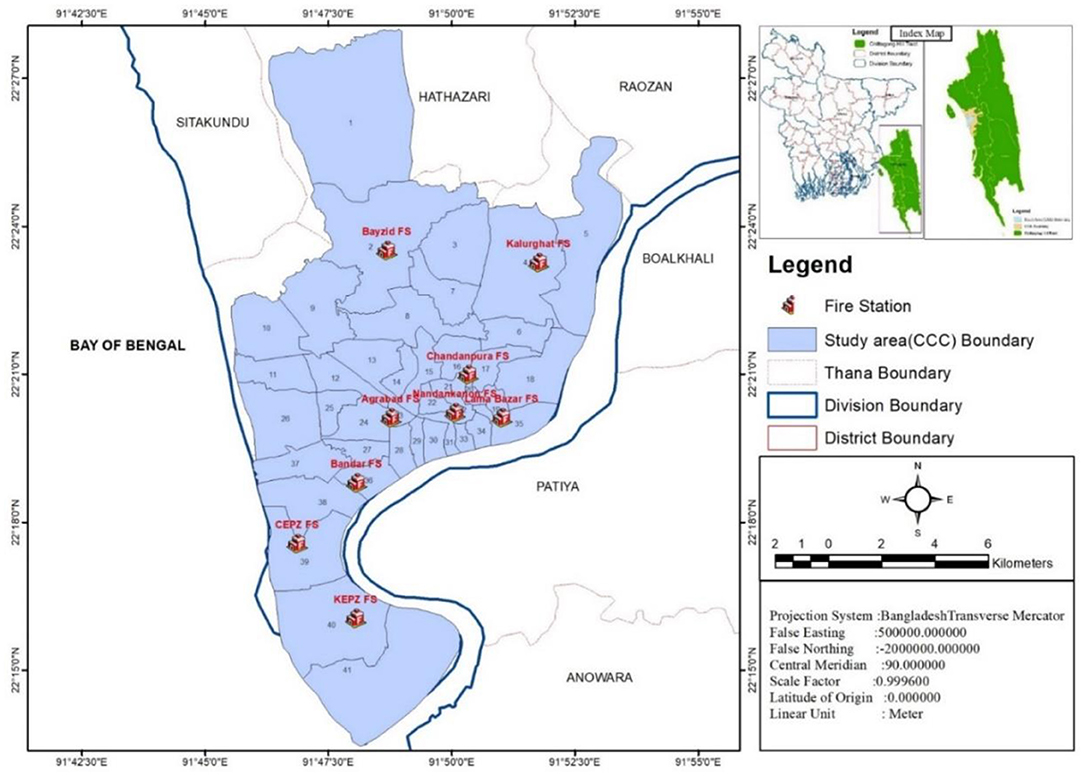
Figure 1. Location of study area (Chattogram City Corporation area).
According to the BFSCD, there are nine fire stations in the Chattogram City Corporation (CCC) area which are
• Agrabad Fire Station
• Bayzid Fire Station
• Chandanpura Fire Station
• Nandankanon Fire Station
• CEPZ Fire Station
• Kalurghat Fire Station
• KEPZ Fire Station
• Lama Bazar Fire Station
• Bandar Fire Station.
Materials and Methods
This study was conducted using primary data collected from a questionnaire survey on the nine fire stations in the Chattogram City Corporation area. The data were compiled and analyzed through different statistical tools.
Data Collection
Data were collected from primary sources. The main data include the records of fire incidents in the Chattogram City Corporation area in the last 5 years and these primary data were collected from the nine fire stations in the Chattogram City Corporation area. A checklist was constructed on the basis of the available information from the BFSCD website. Data on the number of fire incidents, occurrence, causes, damage, and losses were collected for the last 5 years (from 2015 to 2019) from Chattogram Fire Service Civil Defense stations and analyzed accordingly. Fire service stations stored only 1 year of data and a brief report of each year for the particular stations. Therefore, a detailed report on each incident could not be found for a period of more than 5 years. Some fire stations could not provide all 5 years of data because they did not keep previous records and hence there were missing records. The collected data were categorized by the nine fire stations that covered the CCC area. Also, information related to the number of fire extinguishing instruments and manpower of each station was collected to observe the capacity of fire stations.
Questionnaire Survey With Checklist
The data kept in the fire stations were unorganized. Therefore, it was difficult to collect proper data from their records for analysis. For this reason, the study required a questionnaire made with a checklist for data collection from the nine fire stations. The checklists were used to check the records of the type of structures, land use, possible sources of fire, damage and losses, capacity of the fire service, and possible prevention measures. Nine sets of questionnaires were provided to collect the data from nine stations within the city. The respondents of the questionnaire surveys were the fire service officials for each station.
Expert Interview and Participatory Rural Appraisal
An expert interview was required to validate our findings. Also, we needed suggestions to add in recommendation for fire safety measures. The interviewees were fire service officials such as the Divisional Director of the Chattogram Division and Senior Station Officers of each station, officials from the CCC (Chattogram City Corporation) and CDA (Chattogram Development Authority), and experts in disaster management from different universities and professions. PRA was also conducted with fire station officers and staff. PRA helped in participation and used largely visual techniques for assessing group and community resources, identifying and prioritizing problems, and appraising strategies for solving them.
Data Analysis
Records from the previous 5 years were collected and analyzed using a simple graphical method to observe the fire risk pattern in the Chattogram City Corporation area. Frequency and intensity of fire hazards for the last 5 years were also observed. The entire observation was categorized using structure type, land use type, source of fire, loss, and injury according to the survey checklist. Also, we measured whether the frequency and intensity had increased or decreased over time. The analysis was carried out for the whole Chattogram City Corporation area and for each fire station in the city. As data were collected from each fire station, the number of fire incidents occurred from 2015 to 2019 was analyzed qualitatively. Each station showed a different frequency of fire hazards and this is represented in bar diagrams to observe the changes. Different land use type demonstrated a different intensity of fire hazards all over the city. Hence the most common types of land use that were selected for the study are residential, commercial, industrial, educational institute, government institute, and mixed used. Likewise, the percentage of overall fire incidents for these six types of land use was produced with the same data.
In Bangladesh, the most common type of structures are pacca (paved structures), semi-pacca (semi-paved structures, usually structures without a concrete roof are considered as semi-pacca), and katcha (structures constructed only with tin, soil, etc.), and fire intensity differs in different types of mentioned structures. Sources that cause fire in different structures were categorized into electrical fault, kitchen fire, hazardous material, and cigarettes. Consequences from fire hazards can be injury, death, and financial loss, and these consequences were also calculated separately for the last 5 years and the variation was observed accordingly. Besides, seasonal influence is a big factor for causing fire accidents. Usually, the dry season is prone to fire accidents as dry conditions cause materials to be highly flammable. On the contrary, rainy and summer season creates high humidity in the country which reduces the chance of fire. From the results, a season-wise variation of fire incident intensity was identified. The outcome was represented using different statistical diagrams.
To observe the capacity of the fire service in the CCC area, the service area is presented as well. First, the location of each fire station was collected using a hand GPS (Global Positioning System). Then using the ArcGIS 10.4 software package, these GPS data were processed and visualized as a study area map. Service areas for each fire station were obtained in hard copy format. Then these data were digitized using the ArcGIS 10.4 software package; a service area map was prepared for further analyses using GIS techniques.
Finally, the findings from the statistical analysis and GIS analysis were presented to the experts and in the PRA session. Results found from the discussion with experts and the PRA session are outlined in the result and discussion section to improve fire safety measures.
Result and Discussion
Fire incidents that occurred around the Chattogram City Corporation area in last 5 years were collected from nine fire stations and the analysis was conducted accordingly. Results from the study were arranged according to the methodology.
Year-Wise Fire Incidents in Each Station
The number of occurrences of fire incidents for each year was represented through a comparative scenario. This scenario also illustrated the frequency change of fire incidents throughout the nine zones in the Chattogram City Corporation area. From the comparative scenario, most fire incidents occurred in the areas under the Bayzid Fire Station. In 2016, the second most fire hazards occurred under the CEPZ station area. In 2017, the Chandanpura Fire Station faced the second most fire incidents after the Bayzid station. CEPZ and Bondor Fire Stations showed a similar number of fire incidents in 2018. In 2019, most of the fire stations showed a decreasing number of fire incidents except Bondor station. Figure 2 shows the comparative scenario of the total number of fire incidents in each year for the nine fire stations.
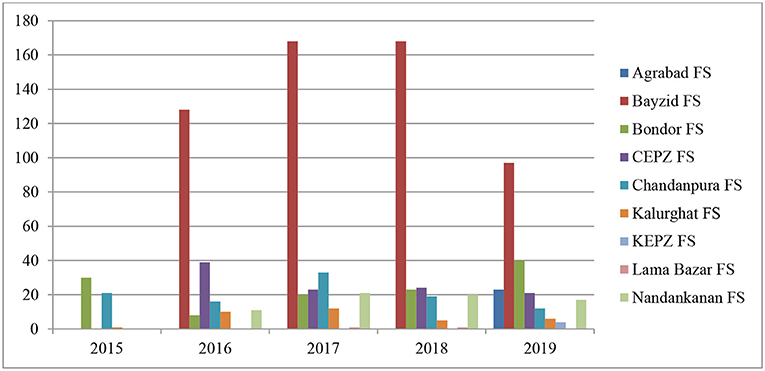
Figure 2. Comparative scenario of the total number of fire incidents in each year for the nine fire stations.
Each station showed a different trend of occurrences. Over the time, the total number of fire hazards increased from 200 to 675 thus indicating that the frequency increased over the past 5 years. The reason behind this increasing trend was revealed from the expert interview with the fire service officials. Unplanned urbanization near the industrialized area and construction of mixed-use buildings without adequate fire risk assessment caused the increasing trend of fire hazards all over the city. The Bayzid and CEPZ areas are major industrial areas. Workers seek accommodation near their work place. Therefore, land owners began to build houses without adhering to building regulations. Also workers tend to live in slums near their work place. These slums are highly vulnerable to fire.
Fire Incidents on Different Land Use Type-Related Analysis
Areas with a higher population and number of structures are more susceptible to fire hazards. Besides, older structures and congested localities face increased risk of rapid fire spread from one structure to another. Moreover, the old structures without adequate maintenance may be prone to faulty electrical, heating, and other utility systems. Commercial, industrial, and multi-use structures present their own unique fire hazards. The improper storage and use of hazardous materials not only increases the risk of fire, but also poses a significant threat to firefighters and the community (Urban and Planning, 2015).
With the growing population, housing developments have increased across the city to cater for the rapid growth rate. Therefore, with increasing settlements, fire hazards increased in the study period. The total number of fire accidents that occurred in the CCC area in the last 5 years showed that 46% took place in residential areas, 27% in commercial areas, 13% in mixed-use areas, 11% in industrial areas, 2% in different governmental institutions, and 0.6% in educational institutions. Figure 3 represents the percentage of fire hazards in different types of land use. From 2015 to 2018, the numbers of fire incidents in residential areas increased and in 2019, it decreased. Fire in commercial areas increased from 2015 to 2019. Industrial fires are a most severe problem in Bangladesh. But in Chattogram, the total number of fire hazards in industrial areas each year showed a gradual decreasing trend from 2016 to 2018 and in 2019, it increased. The main industrial areas for the Chattogram City Corporation area are Bayzid, CEPZ, and KEPZ. For this reason, fire accidents are high in those areas. Mixed land use type structures had an increasing trend from 2015 to 2019. As the number of fires in governmental and educational institutions is not high, that trend did not exhibit significant changes in last 5 years. Figure 4 represents the fire incident trend analysis for different land use types. According to the experts, fire in commercial and residential areas accelerated due to increasing but unplanned urbanization. Recently in Bangladesh, fire hazards in industries were emphasized so that the firefighting capacity increased slightly in industrial areas. Comprehensively, the frequency and intensity increased due to increased urbanization and affected residential and commercial areas predominantly.
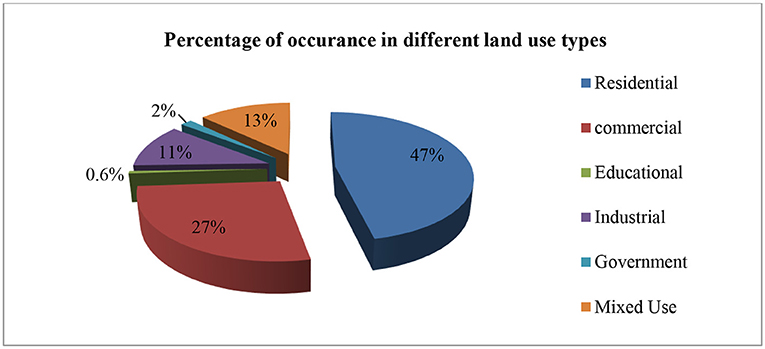
Figure 3. Percentage of fire hazards in different types of land use.
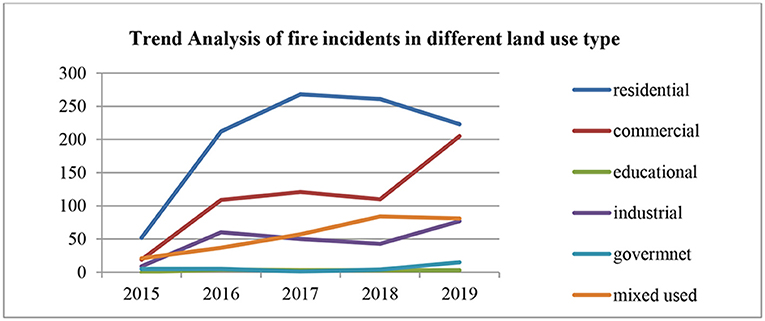
Figure 4. Fire incident trend analysis for different land use types.
Fire Incidents in Different Structure Type Analysis
Historic fire accident records showed that for the total number of fire incidents, 37% happened in pacca-type structures, 33% in semi-pacca structures, and 30% in katcha structures. From the trend analysis, pacca- and katcha-type structures showed an increasing trend from 2015 to 2019. Fire in semi-pacca structures increased from 2015 to 2017, decreased in 2018, and again increased slightly in 2019. Figure 5 represents the percentage of fire hazards in different types of structures. Experts explained that with increasing urbanization most of the katcha and semi-pacca structures were turned into pacca structures without maintaining fire safety measures in the buildings. This is the reason for an increase in trend of fire incidents in pacca structures.
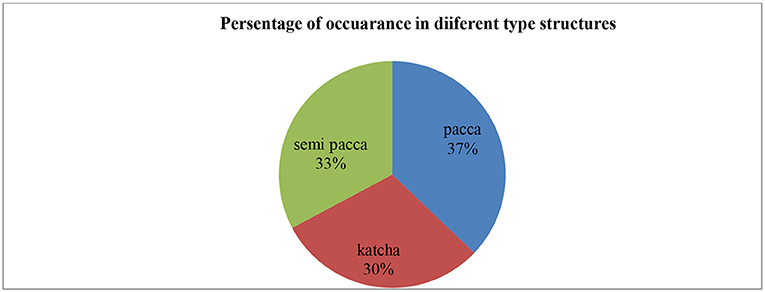
Figure 5. Percentage of fire hazards in different types of structures.
Source of Fire-Related Analysis
Urban fire features abruptness, chain reactions, complexity, difficult disposal, etc. A study conducted in Bangladesh showed that the causes of fire in garment factories were electrical short circuit (100%), boiler explosion (44.29%), storage of flammable materials (37.14%), transformer explosion (28.57%), canteen kitchen (24.17%), overheating (8.57%), and others (21.43%) (Morshadul Hasan et al., 2017). Fire usually occurs due to improper use of utilities or human errors. It can spread in any direction depending on the presence of inflammable materials and sustain itself for any period varying from a few minutes to days or weeks depending on the fire load and effective countermeasures (Urban and Planning, 2015). In this study, Table 1 represents the frequency of fire accidents for different causes in each fire station within the last 5 years. Electrical fire is often caused by faulty outlet/appliances, misuse of extension cords, heaters, outdated wiring, etc. From collected records, most of the fires that the Bayzid Fire Station responded to were due to electric problems in 2016. Other fire stations showed an increasing trend of fire occurrences due to electrical faults. The second most prominent cause of fire is from kitchen fires. Most kitchen fires are caused by leaving cooking food unattended, placing combustibles close to the heat source, gas leakage, and unintentionally turning on the cooking equipment. Again, the Bayzid Fire Station experienced 24 fire incidents due to kitchen fires in 2016, which was the highest in last 5 years. The Kalughat and Chandanpura Fire Stations also exhibited a high number of fire incidents from kitchen fires. Almost every station showed a variation of fire occurrences over time in the Chattogram City Corporation area. The selected third category for source of fire is presence of hazardous materials. Various inflammable chemicals, liquids, solids, gases, batteries etc. are considered as hazardous materials. From Table 1, the Bondor station showed the highest fire incidents caused from hazardous material. Also, the number of fire accidents due to hazardous material increased from 32 to 49 within the 5 years. Besides, the CEPZ Fire Station had 11 fire accidents in 2017. After that the number decreased in 2019. Cigarettes are regarded as one of the major causes in Bangladesh but yet the most unnoticed sources of fire. Even in open space a cigarettes can create a major fire, and many places and structures have caught fire due to burning cigarettes. The CEPZ Fire Station experienced the highest (10) fire hazards in 2017 and after that it gradually decreased to 2 in 2019. From 2015 to 2019, the Chandanpura Fire Station had between six and nine fire accidents which did not much change during the 5 years. The Kalurghat Fire Station experienced the most accidents from cigarettes at 15–18. Within the 5 years, there were not any significant changes in the numbers. But the highest number was 18 which occurred in 2017. Frequencies are also illustrated for each station in last 5 years in Table 1. Some fire stations could not provide the exact data as they still collect records manually.
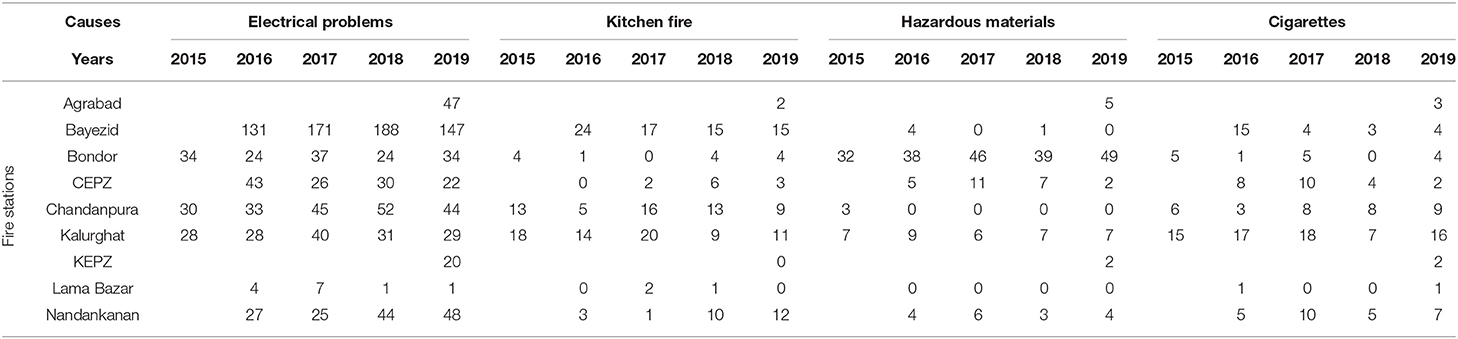
Table 1. Frequency of fire accidents from different causes in each fire station within the last 5 years.
In the last 5 years, of the fire incidents that occurred in the CCC area, 66% were caused by a problem in the electricity line, 13% were generated from hazardous material or sources, 11% were generated from kitchens in residence or hotels, 9% were generated from cigarettes, and 1% were caused by other potential sources of fire accidents. The number of fires due to electricity problems is much higher than the other causes and the observation also indicates a significant increasing rate from 2015 to 2019. Other causes of fire hazards such as fires from kitchens, from hazardous material or sources, and cigarettes did not show significant changes within the 5 years. Figure 6 represents the percentage of causes of fire hazards. Fire from electrical fault was quite high in terms of frequency and intensity compared to the other causes.
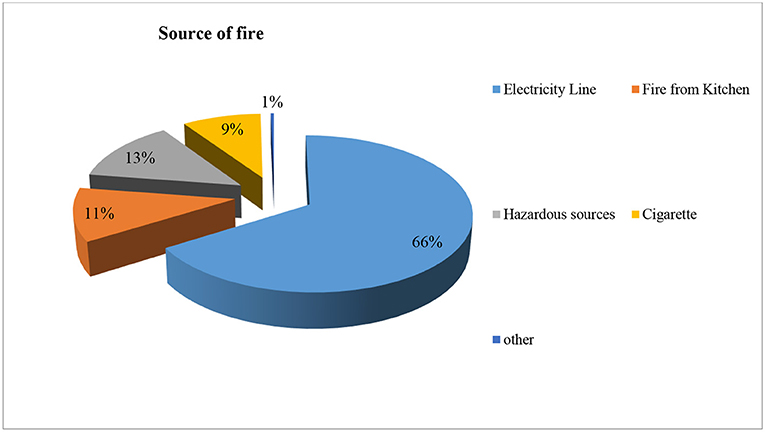
Figure 6. Percentage of causes of fire hazards.
Injury, Death, and Financial Loss
Injury and Death
The Bayzid Fire Station faced two injuries in 2017. The Bondor Fire Station experienced the highest number of injuries from fire incidents compared to the other fire stations. Nine people were injured in 2015, two in 2016, 21 in 2017, one in 2018, and 12 in 2019. Though the number of fire incidents was not much than the other stations, in case of injuries the Bondor station rescued more victims. Areas under the Bondor station are mostly industrial; therefore the number of injuries was higher than other stations within the last 5 years. The CEPZ Fire Station reported that two people were injured in 2016 and five people were injured in 2018. In 2017, the Chandanpura Fire Station had a case report for one injured person from fire incidents. The Kalurghat Fire Station rescued one injured person in 2015, two in 2016, five in 2017, six in 2018, and one in 2019. The KEPZ and Lama Bazar Fire Stations did not experienced any injuries from fire hazards. The Nandankanan Fire Station reported that they rescued one person from a fire accident in 2017, 10 people in 2018, and two in 2019. The number of injuries recorded in the last 5 years from fire accidents exhibited an increasing trend from 2015 to 2017. But it started to decrease after then to 2019. The Agrabad, Bayzid, and Chandanpura Fire Station reported no deaths from fire accidents within the 5 years. The Bondor Fire Station reported seven deaths in 2017 and one each in 2015 and 2019. The CEPZ Fire Station reported two deaths in 2019. The Kalurghat Fire Station had one death report each in 2017 and 2019. KEPZ had records for only 1 year and within that year they faced one death from fire accidents. One death was reported in 2018 from the Nandankanan Fire Station. The number of people who died from fire increased from 2016 to 2017 and after that the trend started to decrease until 2019.
Financial Loss
Financial losses for each year from fire accidents were quite high. Figure 7 represents the financial loss within the last 5 years in the CCC area. Financial loss from each accident is recorded in approximate amount in every fire station. Reports from the Agrabad Fire Station show that financial loss from fire accidents was 11,296,000 BDT in 2019. Approximately 4,745,000 BDT of financial losses from fire incidents were reported in 2016 at the CEPZ Fire Station. The amount decreased gradually until 2019 and the last reported financial loss was 699,000 BDT in 2019. An ~5,178,000 BDT financial loss was reported in the Chanadanpura Fire Station in 2015 and the loss decreased gradually in 2019. From the graph, the Kalurghat Fire Station shows that they had fire incidents that caused the most financial losses within the 5 years compared to the other fire stations. Records from the Kalurghat Fire Station state that financial loss was 17,235,000 BDT in 2015, 8,600,000 BDT in 2016, 12,850,000 BDT in 2017, 19,535,000 BDT in 2018, and 5,035,000 BDT in 2019. In 2016, the Nandankanan Fire Station reported losses of 4,717,000 BDT which increased over 2 years and in 2018, the amount reported was 9,016,200 BDT. In 2019, the Nandankanan Fire Station reported a decreased financial loss from fire incidents of 3,700,500 BDT. From the observations, the financial loss started to increase from 2015 to 2018. After 2018, the loss started to decrease significantly.
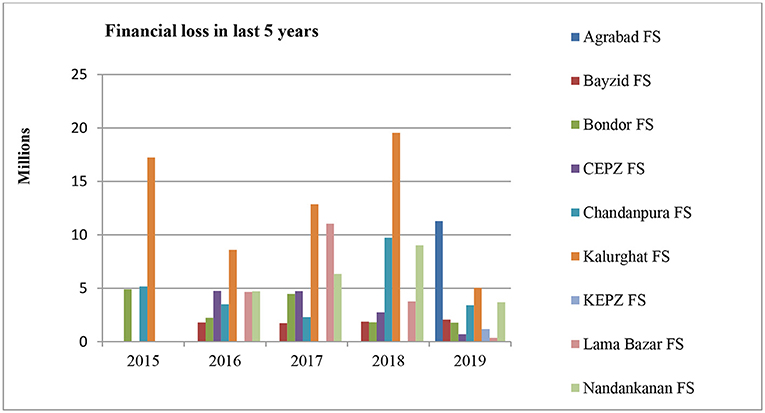
Figure 7. Financial loss within the last 5 years in the CCC area.
Seasonal Variation of Fire Hazards
For the purpose of this study, the winter season is defined as the months of November through February, early summer as February through March, summer as March through June, and the rainy or monsoon season as July through October. Seasons are not as easy to define as other fire categories as they blend with one another. From Figure 8, in the Chattogram City Corporation (CCC) area, the frequency trend of the fire incidents shows that in the winter season the number of fire incidents tends to increase due to dry weather. In December, the number of fire incidents that occurred in the CCC area was 250 and in the February and March, 334 and 333, respectively. But the frequency started to decrease in summer and monsoon time. In April, the total number of fire incidents in the CCC area was 296 which was less than the month before. In November, the number decreased to 198 which was in the early winter time. The average number of fire incidents in each month of the nine fire stations in the CCC area shows that January, February, March, April, and December had the most fire incidents in the previous 5 years. March had the highest number which was 41. December had 27, January had 37, and April had 32. The lowest number of fire incidents occurred in November with 22. The results also showed that most of the fire accidents occurred in the winter and summer seasons. It is evident that intensity of fire is high in winter and early summer time.
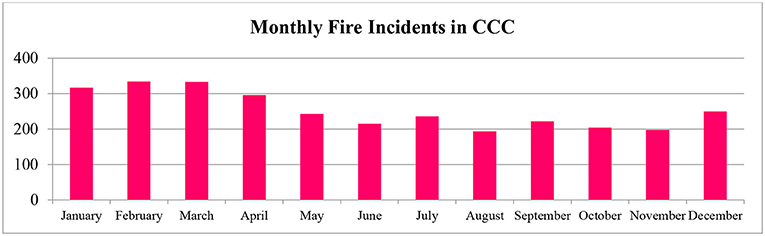
Figure 8. Monthly total number of fire incidents in the CCC area.
Firefighting Capacity of Fire Stations
Standard firefighting capacity should be ensured for every station to face fire incidents efficiently. The overall firefighting capacity of the nine fire stations of the Chattogram City Corporation area have been assessed.
Capacity of Fire Stations of the Chattogram City Corporation Area
Firefighting capacity has been assessed using two parameters, spatial parameters and non-spatial parameters. Spatial parameters are basically related to the location of fire stations which include coverage area, population served, and standard service area. On the other hand, non-spatial parameters include capacity of manpower and firefighting vehicles. In the following parts, the overall capacity of the nine fire stations have been elaborated.
Coverage Area and Population Served
According to BFSCD rules, there is a designated area for every fire station and the station is responsible to respond first in times of any fire incident within that area. This designated area is termed as the coverage area of the respective fire station. When the first station fails to put out the fire then the other neighboring stations add their support in the firefighting activity. Table 2 represents the coverage area and serving population per station of different cities. In the Chattogram City Corporation area, nine fire stations are responsible for serving an around 155 sq.km. area and the ~2.5 million people of Chattogram (CDA, 2020). On average, the coverage area per station is 17.22 sq.km. and the population size served per station is 666,667. In Bangladesh, there are no rules or standard for coverage area and the size of the served population. In the Chattogram City Corporation area, average area coverage per station is relatively lower than the others. But as the density of population is very high in this city, average population served per station is very high which is around 8 times larger than the average population served per station in Delhi, 17 times larger than that of Bangkok, and 19 times larger than that of Oklahoma City.
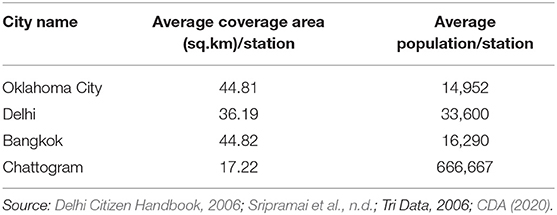
Table 2. Coverage area and serving population per station of different cities.
Served Standard Service Area
In firefighting activities, response time is the most crucial issue, as the loss due to fire incidents increases with increased response time. Standard service area is the designated area within which the firefighting team can reach in the standard response time. According to the National Fire Protection Association (NFPA) standard, the first firefighting vehicle is supposed to arrive at a fire incident within 4 min or less and the full assignment team is required to arrive within 8 min or less (NFPA, 2020). The BFSCD has set their minimum response time as 10 min considering the existing road network system of Bangladesh. This 10 min standard is also practiced in other cities such as Singapore. In times of fire incidents, though the turn-out time of the firefighters is only 30 s, the team cannot reach in the incident spot in due time basically because of huge traffic congestion on their way to the destination. And this traffic congestion has been identified as the major obstacle to efficient firefighting by the fire officials of the stations. Table 3 represents the response time of fire stations in times of fire incidents.
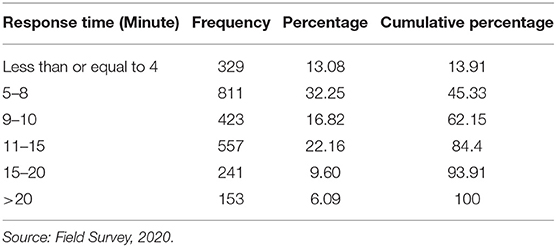
Table 3. Response time of fire stations in times of fire incidents.
Only in around 50% of cases could they reach the incident spot within 8 min, which is an international standard. In some cases, people in the community put out the fire before the arrival of the firefighting team. In 40% of observed incidents, people in the community were able to put out the fire before the arrival of firefighters. Figure 9 represents the service area map of different fire stations of the Chattogram City Corporation (CCC) area. This service area map has been prepared based on the data collected during the field survey using a hand GPS from each station and represented using GIS techniques. This service area map shows the coverage area of the nine fire stations throughout the CCC area.
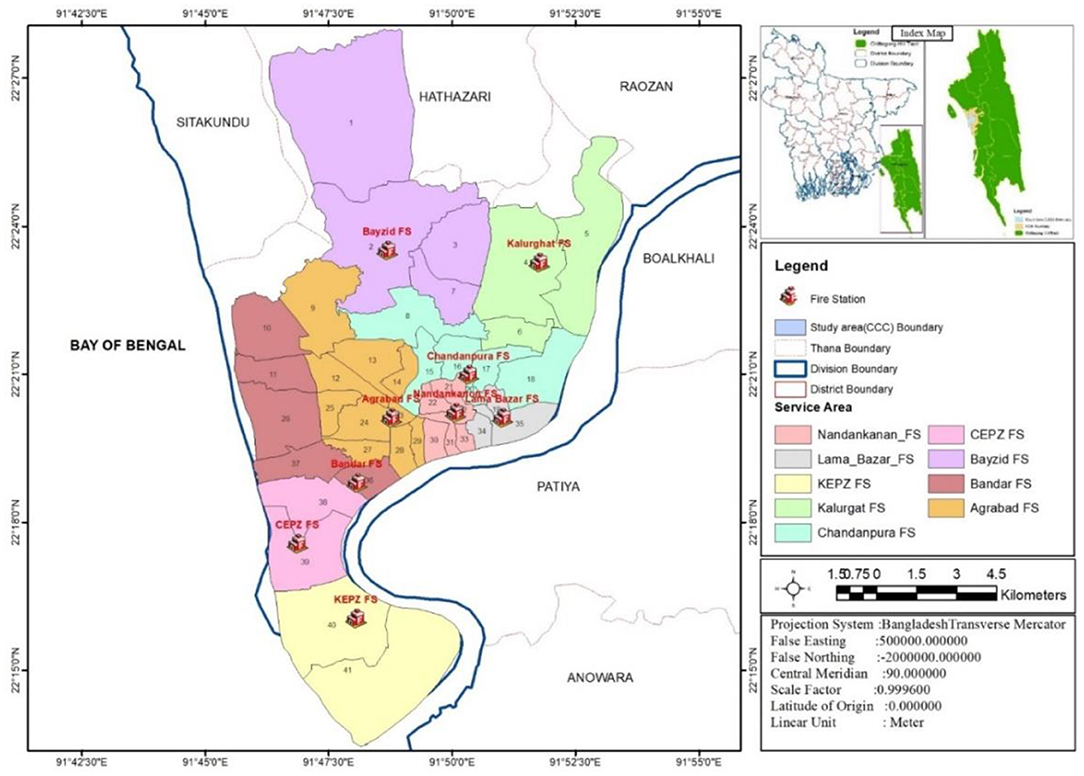
Figure 9. Service area map of different fire stations of the Chattogram City Corporation (CCC) area.
Capacity of Manpower
Efficient manpower in firefighting is only possible when the service is properly staffed. Manpower includes the officials and staff involved in the firefighting activity. Besides, the regular staff, volunteers play an important role in times of fire incidents all over the world. Except officials, in every fire station of the Chattogram City Corporation (CCC) area, there are staff which include a senior station officer, staff officer, station officer, warehouse inspector, driver, fireman, cook, and cleaner. Except the cook and cleaner, all staff are trained for firefighting. As a whole, there are 253 trained firefighters who include officials and firefighting staff in the nine fire stations within the Chattogram City Corporation (CCC) area. Usually, all the fire staff get a 24-h gap after a duty of 48 h. But from the interview it was revealed that due to an inappropriate number of staff in each fire station, the officials and staff only take a short break and they then have to remain on duty for 24 h. If necessary, they have to take leave from their office duty and arrange someone of their rank as substitute.
Comparison With Different Standards and Different Cities
Different national and international organizations have set different standards for firefighters to mitigate the loss of fire incidents. The National Fire Protection Association (NFPA) and the International City Managers Association (ICMA) recommend an ideal service ratio of one on-duty firefighter per 2,000 population served (Orcutt Community Plan EIR, 2020). In the CCC area, the ratio of population per on-duty firefighter is ~2,1277 (Source: Field Survey, 2020). Besides, according to the NFPA 1710 standard, there should be four on-duty personnel for fire companies whose primary functions are to pump and deliver water and perform basic firefighting at fires, including search and rescue (Wilson, 2009). In all fire stations, in every fire company, four on-duty personnel attend in the case of any fire incident. In the CCC area, population density is very high compared to other cities. So, in Chattogram, the population:staff ratio is very high which is ~6 times larger than Bangkok, four times larger than Delhi, and 33 times larger than Oklahoma City. Table 4 represents the population:staff ratio in different cities.
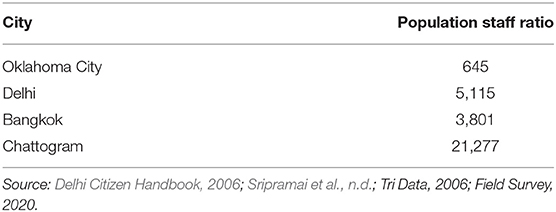
Table 4. Population:staff ratio in different cities.
Volunteer Service
Volunteers of the fire department work in parallel with the regular firefighters in different fire departments of different countries. In the United States, 69% of firefighters are working as volunteers (Haynes and Stein, 2013). The volunteers perform the same duties as the full-time firefighter whereas they receive no compensation or nominal fees up to 20% of the compensation a full-time firefighter would receive in the same capacity. In Canada, Volunteer Fire Departments are mostly found in rural and remote areas, with 127,000 such firefighters across the country. Volunteer departments are necessary for areas that cannot afford to staff a full-time department (Patton, 2008). But, according to the training department of the BFSCD, there are no facilities of regular training courses to recruit volunteers. There was a project of CDMP for the period of 2011-2015, which was funded by UK Aid, European Union, Norwegian Embassy, Sida, Australian Aid, and UNDP. The project aim was to build up 30,000 volunteers with knowledge on collapsed structure search, rescue, firefighting, and first aid in times of earthquakes which was implemented by Fire Service and Civil Defense Directorate. Through the implementation of the program, at the end of the project 30,000 volunteers were trained. The target area of the project was three city corporations: Dhaka City Corporation, Chattogram City Corporation, and Sylhet City Corporation and seven other districts: Dinajpur, Rangpur, Bagura, Rajshahi, Tangail, Mymensingh, and Cox's Bazar which was selected based on the level of earthquake vulnerability. The number of trained volunteers in the three city corporations is as follows: Dhaka City Corporation−18,000, Chattogram City Corporation−7,000, and Sylhet City Corporation−3,600. But recently there has been no such type of program to recruit efficient volunteers (Tishi, 2015).
Capacity of Firefighting Vehicles
Firefighting vehicles are one of the vital elements of firefighting for any type of emergency. The type and capacity of these emergency vehicles must conform to the specific requirement according to land use characteristics and pattern of fire incidents. In India, according to the National Disaster Management Guidelines of Fire Services, water tender, extra heavy water tender, and ambulance vehicles are recommended as standard scale for each fire station (NDMA, 2012). Besides, in addition to the appliances mentioned above, more specialized appliances should be provided at selected fire stations according to local circumstances. Among which a turntable ladder, hydraulic platform, extra heavy pumping appliance, motor cycle mist, and foam tender are important in firefighting vehicles.
In our country, the emergency firefighting vehicles mostly cover the above-mentioned vehicles. Existing firefighting vehicles of the BFSCD include water tender (store water, capacity ranges from 4000 to 8000 L), special water tender (special type of water tender, capacity ranges from 8000 to 11000 L), toeing vehicle (carries different types of equipment including water pump, foam can, etc.), turntable ladder (special type of vehicle giving access to high-rise buildings of different ranges up to 400 m), foam tender, foam caman (used foam to put out oil fires), chemical tender (carries four types of fire extinguishing agent- water, foam, carbon dioxide, dry chemical powder, which is useful in any type of fire incident), water mist (special type of motor cycle used in giving access to narrow roads with water and foam in its reserve chamber), cold-cut (cpecial type of equipment carried by a toeing vehicle with a high pressure hose and also used to cut iron sheets in times of fire incident and rescue events), and ground monitor (used in severe fire incidents to project a large volume of water a longer distance) vehicles.
Among these vehicles, according to BFSCD rules, there is a standard number of vehicles designated for each type of fire station. All other types of vehicles are supposed to be housed in the head office of BFSCD and in every divisional head office. In a written document, the designated type and number of vehicle and equipment did not consider the specific land use characteristics. The next section will present a summary of key findings followed by conclusions and recommendations.
Solution From the PRA Session
PRA was also conducted with fire station officers and staff. PRA session results are discussed below.
Improving the Activity and Corresponding Role
The spider diagram refers to the role of participants according to different activities which will help to improve the existing condition of fire-related hazards. This diagram has been prepared with the help of a PRA session conducted during the field survey. The activities education, collaboration, budget, internal factor, external factor, participation, physical strength, and efficiency, etc. are main factors identified by the participants. The participants are divided into three parts, a fire station role, different authority role, and people role. Fire station roles include firefighters, equipment, and training. If this role of the fire station improves, the fire-related hazard will be decreased. Simultaneously, improvement in different authority roles and people roles will decrease fire-related hazards. Their activity and corresponding role are described in Figure 10A.
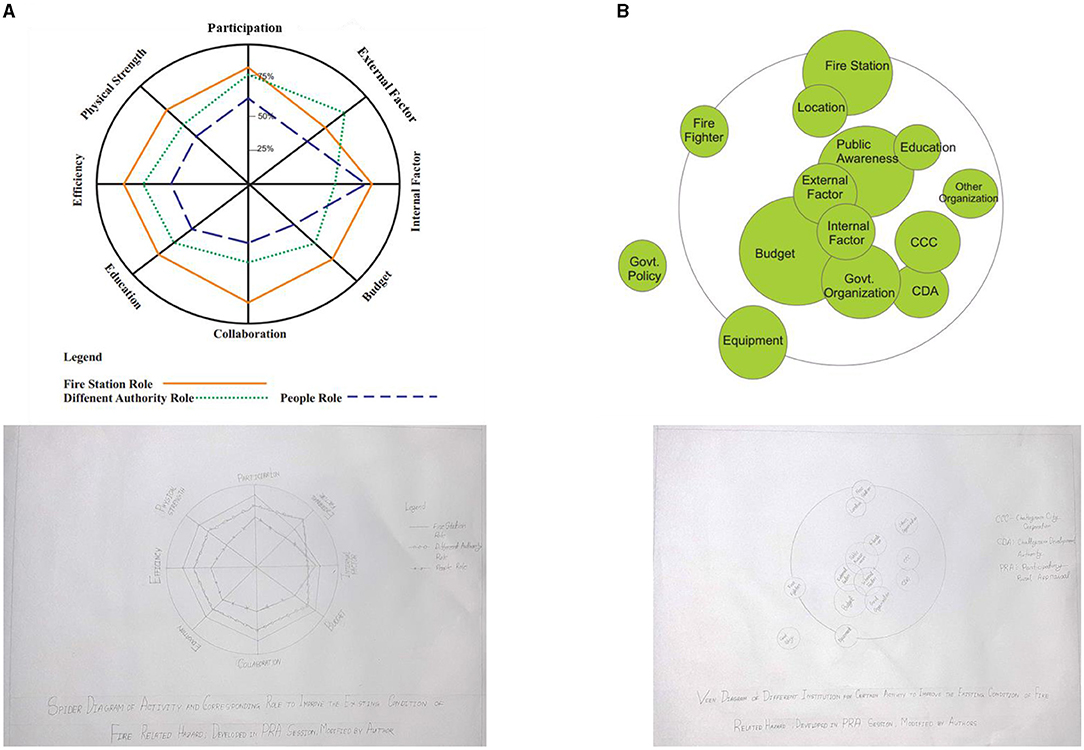
Figure 10. (A) Spider diagram of activity and corresponding role to improve the existing condition of fire-related hazards, (B) Venn diagram of different institutions for certain activities to improve the existing condition of fire-related hazards.
Improving the Role of Institutions for Certain Activities
The Venn diagram refers to the role different institutions can play for certain activities to improve the existing condition of fire-related hazards. This diagram has been prepared by conducting PRA sessions during the field survey. The circles of various sizes represent institutions or individuals. The size of the circles represents the importance of the institution or individual, the distance between circles represents the degree of influence or contact between institutions or individuals, and overlapping circles indicate interactions and the extent of overlap can indicate the level of interaction. If this the role of different institutions improves, fire-related hazards will be decreased. The roles of different institutions for certain activities are described in Figure 10B. Figure 10 describes (a) a Spider diagram of activity and corresponding role to improve the existing condition of fire-related hazards, (b) a Venn diagram of different institutions for certain activities to improve the existing condition of fire-related hazards.
Conclusion and Recommendation
This article focused on understanding fire hazards in Chattogram City and the role of empirical data to support response plans of emergency responders. Due to rapid urbanization, the frequency of fire accidents was also increased drastically. The total number of fire accidents that occurred in urban areas is 2,514 in the last 5 years. The high density of population and densely distributed buildings contribute to a high fire risk. Though the observed frequency revealed that the number of fire incidents decreased gradually because of the development of fire service civil defense in the CCC area, the risk of fire still remains high. The people of the city are mostly unaware of the fire risk and usually they do not have proper training. Therefore, different land use type shows the different intensity of fire hazards. Residential areas show a high intensity of fire hazards in the city of almost 47%. As garments factories are the most prominent sector in Chattogram, this sector deals with the most fire incidents. The fire service civil defense focuses on RMG sectors for fire drills and training. As a result, the number of industrial fires has decreased in the last 5 years but due the recent establishment of the KEPZ Fire Station, the overall number of occurrences has increased. Other sectors such as residential, commercial, educational etc. are getting less attention than the RMG sector. Fire accidents that occurred within the 5 years were mostly caused by electrical faults. That is almost 66% of all the fire hazards in the CCC area. From the records, pacca structures are more prone to fire risk because of rapid urbanization causing the owners to violate building regulations. Therefore, they also overlooked fire safety regulations. The same has occurred in commercial, industrial, and mixed-use type buildings. It was noticed that most of the fire incidents occurred in the winter season that is from November to March and during June and July in early summer. Moreover, the study shows that fire service civil defense needs to be upgraded but insufficient manpower is hindering stations from providing the required service. In each fire station, there is not enough staff. A total of 15 people lost their lives and 83 people were injured in the last 5 years from fire hazards in the Chattogram City Corporation area. The total amount of financial loss was 179,091,200 BDT. The following suggestions are therefore recommended:
• Advancement of reporting systems: Special attention should be given to the incident record management and reporting system. Fire stations still preserve their records manually. Standard fire reporting systems are required to maintain and develop services. There should be a simple information technology system to connect with one station to the central station. The records need to be preserved and sorted properly to reduce missing and inaccurate information.
• Manpower in each station: From the detailed analysis, it was revealed that there is a shortage of manpower in each station. The required number of staff in each station is 35. To replenish the shortage, more qualified candidates should be recruited. Also, volunteers should be encouraged to participate in firefighting activities to lessen the pressure from staff.
• Sufficient water source: Expert interviews highlighted the inadequacy of water sources to extinguish fire. At present they use water from reservoirs or from adjacent buildings near the incident area. Bangladesh should establish fire hydrants in necessary points across Chattogram adequately.
• Adequate extinguishing equipment: Interviews with the fire service staff showed that only the main branch has the most equipment. When needed they ask for it and it is transferred to the accident spot. This process is time-consuming. Moreover, each station does not have the same type and number of vehicles. Thus, it is important to distribute vehicles and equipment equally to all fire stations in order to provide a proper service to the citizen.
• Training: Volunteer training should be available for the general public to eliminate the fire risk and also in any safety measures, and planning community participation is highly required.
• More precisely, to improve the conditions, the following recommendations are given:
• Public awareness: People in the community are the first responders in any hazard. Hence it is essential for them to have proper knowledge to reduce fire risk. In every sector, fire safety training and education should be given. This can be implemented by each fire station in the Chattogram City Corporation area. Timely inspection and drills should be arranged to protect the community at risk.
• Improving the role of institutions: The role of different institutions should be improved through coordination of different institutions. Inter-institutional teams can be made with members from different institutions to ensure the coordination process.
Data Availability Statement
The original contributions presented in the study are included in the article/supplementary material, further inquiries can be directed to the corresponding author.
Ethics Statement
Ethical review and approval was not required for the study on human participants in accordance with the local legislation and institutional requirements. The patients/participants provided their verbal informed consent to participate in this study.
Author Contributions
All authors contributed to writing and reviewing the original manuscript, made a substantial, direct and intellectual contribution to the work, and approved it for publication.
Funding
This material was based upon work supported by the Directorate of Research and Extension of Chittagong University of Engineering and Technology (CUET) under Grant No. CUET/DRE/2019-20/URP/005.
Conflict of Interest
The authors declare that the research was conducted in the absence of any commercial or financial relationships that could be construed as a potential conflict of interest.
Publisher's Note
All claims expressed in this article are solely those of the authors and do not necessarily represent those of their affiliated organizations, or those of the publisher, the editors and the reviewers. Any product that may be evaluated in this article, or claim that may be made by its manufacturer, is not guaranteed or endorsed by the publisher.
Acknowledgments
The authors would like to thank the Directorate of Research and Extension, Chittagong University of Engineering and Technology for funding this project. We would like to thank to Dr. Md. Reaz Akter Mullick, Head and Professor, Department of Urban and Regional Planning, Chittagong University of Engineering and Technology for effective supervision and guidance that helped us conduct this project. We would also like to thank officers of the different fire stations of Chattogram for their effective discussion and suggestions for conducting this project.
Footnotes
1. ^1 Lakh = 100,000.
References
ADPC (2020). Occurrence of Manmade Disaster–Fire Hazard in Chattogram City Corporation Area. Available online at: https://www.adpc.net/igo/contents/iPrepare/iprepare-news_id.asp?ipid=256 (accessed September 6, 2020).
Bhuiyan, M. A. R., Alam, M. J., Roy, T., and Barua, A. K. (2006). Generation of liquefaction potential map for chattogram city area, Bangladesh, in 4th International Conference on Earthquake Engineering. Paper No. 283 (Taipei).
CDA (2020). Chattogram Development Authority Website. Retrieved from Chattogram Development Authority. Available online at: http://portal.cda.gov.bd/ (accessed September 6, 2020).
Delhi Citizen Handjournal (2006). Centre for Civil Society. New Delhi. Available online at: https://ccs.in/sites/all/journals/com_journals/journal_dch_2006.pdf
Dhaka Tribune (2018). Fire Destroys 200 Shanties in Chattogram. Available online at: https://www.dhakatribune.com/bangladesh/nation/2018/02/19/fire-destroys-200-shanties-Chattogram (accessed October 23, 2020).
FIG (2010). Rapid Urbanization and Mega Cities: The Need for Spatial Information Management. Copenhagen: The International Federation of Surveyors (FIG).
Haynes, H. J. G., and Stein, G. P. (2013). US Fire Department Profile 2013. Quincy, MA: National Fire Protection Association, Fire Analysis and Research Division.
Kauser, M. R. H., and Neema, M. N. (2019). Service area analysis of hospitals in Chittagong using geographic information system, in International Conference on Sustainability in Natural and Built Environment (Dhaka), 203–208. Available online at: https://www.researchgate.net/publication/354116787_Service_Area_Analysis_of_Hospitals_in_Chittagong_Using_Geographic_Information_System
Kauser, M. R. H., Saha, J. K., and Raja, D. R. (2017a). An analysis of structure, fire and social vulnerabilities of Chattogram City corporation area due to earthquake hazard. J. Bangladesh Inst. Plan. 10, 89–104. Available online at: https://www.academia.edu/43336371/An_Analysis_of_Structure_Fire_and_Social_Vulnerabilities_of_Chittagong_City_Corporation_Area_due_to_Earthquake_Hazard
Kauser, M. R. H., Saha, J. K., and Raja, D. R. (2017b). A GIS based approach of seismic microzonation of Chittagong City corporation area, Bangladesh, in 1st International Conference on Disaster Risk Mitigation, 23–24 September, 2017 (Dhaka: BUET-Japan Institute of Disaster Prevention and Urban Safety).
Kauser, M. R. H., Saha, J. K., and Raja, D. R. (2017c). Community vulnerability analysis of Chittagong city corporation area, Bangladesh due to earthquake hazard, 1st International Conference on Disaster Risk Mitigation, 23–24 September, 2017 (Dhaka: BUET-Japan Institute of Disaster Prevention and Urban Safety).
Kauser, M. R. H., Rahman, M. M., Alam, H. S., Lopa, G. R., and Hasan, M. R. (2016). Urbanization and planned residential area development practice according to existing standards, in 3rd International Conference on Advances in Civil Engineering, 21-23 December, 2016 (Chittagong: Department of Civil Engineering).
Masud, A. M. (2007). Earthquake risk analysis for Chattogram City (Unpublished Master thesis). Department of Civil Engineering, Bangladesh University of Engineering and Technology, Dhaka, Bangladesh.
Morshadul Hasan, M., Mahmud, A., and Islam, M. S. (2017). Deadly incidents in Bangladeshi apparel industry and illustrating the causes and effects of these incidents. J. Finance Account. 5, 193–199. doi: 10.11648/j.jfa.20170505.13
NDMA (2012). National Disaster Management Guidelines Scaling, Type of Equipment, and Training of Fire Services. New Delhi: National Disaster Management Authority, Government of India.
NFPA (2020). Document Information Pages (list of NFPA Codes and Standards). Quincy, Massachusetts, USA. Available online at: http://www.nfpa.org/codes-and-standards/ document-information-pages on (accessed June 20, 2020).
Orcutt Community Plan EIR (2020). Long Range Planning Division, Country of Santa Barbara. Available online at: http://longrange.sbcountyplanning.org/planareas/orcutt/documents/OCP%20EIR/OCP%20EIR%20Volume%201/5.14%20Public%20Services.pdf (accessed November, 2020).
Patton, B. (2008). Volunteer Vision: Obstacles in Maintaining a Volunteer Department. Available online at: http://www.firefightingincanada.com/volunteers/volunteer-vision-obstacles-in-maintaining-a-volunteer-department-2136 (accessed August, 2020).
Sripramai, K., Oikawa, Y., Kanai, M., and Katada, T. (n.d.). The Relationship Between Local Government Residents in Disaster Prevention Activity. Available online at: https://jglobal.jst.go.jp/en/detail?JGLOBAL_ID=20100228926705978
The Daily Star (2017). One Killed, Five Injured in Ctg fire. Available online at: https://www.thedailystar.net/backpage/one-killed-five-injured-ctg-fires-1487917 (13 November 2020).
Tishi, T. R. (2015). A Study on Frequency of Fire Incidents and Fire Fighting Capacity in Different Land Use Categories of Dhaka Metropolitan Area. Dhaka: Bangladesh University of Engineering and Technology (BUET).
UNDESA (2014). World's Population Increasingly Urban with More Than Half Living in Urban Areas. New York, NY: United Nations Department of Economic and Social Affairs.
Urban, M. O. F., and Planning, R. (2015). A Study on Frequency of Fire Incidents and Fire Fighting Capacity in Different Land Use Categories of Dhaka Metropolitan Area.. Dhaka: Department of Urban and Regional Planning Bangladesh University of Engineering and Technology (BUET).
Wang, J. H., Sun, J. H., Lo, S. M., Gao, L. J., and Yuen, R. K. K. (2001). Statistical analysis on the temporal-spatial characteristics of urban fires under typical urbanization features. Proc. Eng. 11, 437–444, doi: 10.1016/j.proeng.2011.04.680
Wang, Z., Zhang, X., and Xu, B. (2015). Spatio-temporal features of china's urban fires: an investigation with reference to gross domestic product and humidity. Sustainability 7, 9734–9752. doi: 10.3390/su7079734
Wilson, K. W. (2009). Fire Department Staffing: A Need, not a Want, Fire Engineering. Magazine Editorial, PennWell Corporation, South Fair Lawn, NJ, United States. Available online at: https://www.fireengineering.com/firefighting/firedepartment-staffing-a-need-not-a-want/#gref
Zaman, A. K. M. H.U., Khan, M. T. A., and Islam, M. J. (2014). Urbanization in Bangladesh: present status and policy implications. ASA Univ. Rev. 4. Available online at: https://www.semanticscholar.org/paper/Urbanization-in-Bangladesh%3A-Present-Status-and-uz-*-Khan-Alam/459565a90508347585e3030c20a67153078af7cb
Keywords: fire incident, fire station, fire fighting capacity, land use, response time, service area
Citation: Hasan MR, Kauser MRH and Ibrahim J (2021) Fire Hazard in Chattogram City Corporation Area: A Critical Analysis of Its Causes and Mitigation Measures. Front. Sustain. Cities 3:683468. doi: 10.3389/frsc.2021.683468
Received: 21 March 2021; Accepted: 12 July 2021;
Published: 10 September 2021.
Edited by:
Magesh Nagarajan, Indian Institute of Management Nagpur, IndiaReviewed by:
Md. Tariqul Islam, University of Nottingham, United KingdomRajasekaran C., National Institute of Technology, Karnataka, India
Copyright © 2021 Hasan, Kauser and Ibrahim. This is an open-access article distributed under the terms of the Creative Commons Attribution License (CC BY). The use, distribution or reproduction in other forums is permitted, provided the original author(s) and the copyright owner(s) are credited and that the original publication in this journal is cited, in accordance with accepted academic practice. No use, distribution or reproduction is permitted which does not comply with these terms.
*Correspondence: Muhammad Rashidul Hasan, bXJoYXNhbkBjdWV0LmFjLmJk