- 1Department of Environmental Health, Harvard T.H. Chan School of Public Health, Boston, MA, United States
- 2Center for Climate, Health, and the Global Environment, Harvard T.H. Chan School of Public Health, Boston, MA, United States
- 3Graduate School of Design, Harvard University, Cambridge, MA, United States
As the frequency and severity of extreme heat increases with global climate change, residential buildings play a key role in defining personal temperature exposures. In recent decades, residential buildings have become the focus of energy efficiency and cost savings programs and initiatives. Residential buildings can also mitigate high indoor temperatures and heat-related health impacts, but these heat adaptation interventions have not been fully evaluated for their potential energy, climate, and health benefits. We aimed to quantify the health and climate benefits of energy and indoor temperature reductions that result from heat adaptation strategies applied to residential (specifically single-family detached built between 1990 and 2010) buildings in 10 U.S. cities. Building energy models were used to simulate energy reduction retrofits, including changing roof reflectivity, adding window overhangs, improving window properties, and roof/wall insulation, as well as the addition of shade trees and indoor phase change materials. We used the building simulation results to estimate attendant reductions in greenhouse gas (GHG) and criteria air pollution (AP) emissions from the electrical grid, and used the damage estimates to evaluate the resulting climate and health benefits. Under light and deep retrofit scenarios, respectively, we estimate that the simulated heat adaptation retrofits in this subset of relatively new buildings have the potential to yield $1.10 or $1.57 billion in direct utilities savings. There is an additional $462.9 million ($301.3–$909.9 million) or $692.8 million ($442.6 million–$1.385 billion) in climate and health benefits, due to avoided GHG and AP emissions. Put simply, the climate and health benefits may account for an additional 42–44% of the direct utility savings, on average. Climate and health benefits were generally highest for adaptations simulated in hot climates (Dallas, TX and Houston, TX) or in areas with dirtier fuel mixes (Chicago, IL and Philadelphia, PA). When climate and health savings are included, the payback periods of these interventions can decrease by nearly half. We also discuss the potential additional health benefits of reducing indoor temperatures during extreme heat. These significant savings from avoided climate and public health damages should be factored into climate change adaptation decision making by stakeholders and policymakers.
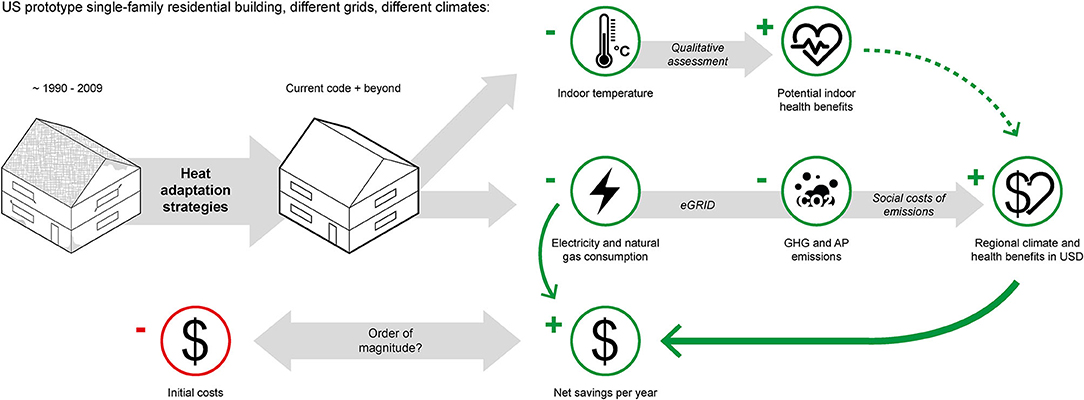
Graphical Abstract. The study assessed the financial benefits due to health and reduced greenhouse gas emissions, in addition to the utility cost savings, of energy efficiency and heat adaptation strategies in housing.
Introduction
Extreme heat is one of the leading causes of death among meteorological phenomenon (National Weather Service, 2017) and contributes to morbidity due to cardiovascular, respiratory, renal, diabetes, cerebrovascular, and gastrointestinal disease (Melillo et al., 2014; Campbell et al., 2018; Mayrhuber et al., 2018; Reidmiller et al., 2018), declining productivity and cognition (Park, 2016a,b; Cedeño Laurent et al., 2018), poor sleep (Obradovich et al., 2017; Williams et al., 2019), and thermal discomfort (Synnefa et al., 2007; van Loenhout et al., 2016). The frequency, duration, and severity of heatwaves and the resulting heat-related mortality and morbidity are expected to increase with climate change (Melillo et al., 2014; Reidmiller et al., 2018).
In the U.S., people spend upwards of 90% of their time indoors (Klepeis et al., 2001), and a large percentage of this time is spent at home. Elderly populations, young children, and those with preexisting medical conditions are particularly vulnerable to extreme heat and may spend more time at home than the general public. Thus, buildings, especially residential buildings, play a key role in defining indoor heat exposure during periods of extreme heat (Samuelson et al., 2020). As a result, factors such as floor of residence, insulation level, air conditioning (AC) system availability and type, roof type, and construction materials can impact occupants health during heatwaves (Naughton, 2002; O'Neill, 2005; Keller, 2013; Quinn et al., 2014; Taylor et al., 2015; Alam et al., 2016; Holmes et al., 2016). Therefore, residential buildings provide a place of intervention to mitigate heat-related health impacts.
One of the primary adaptation strategies used to date in the U.S. to combat extreme heat has been the use of mechanical cooling (e.g., AC). AC is not a sustainable solution on its own to protect public health in the face of more frequent and intense extreme heat events. During widespread power outages, which are projected to occur more frequently in the U.S. (Reidmiller et al., 2018), buildings may not be passively habitable without AC (Holmes et al., 2016; Baniassadi et al., 2018; Sailor et al., 2019). This puts many people at risk for severe morbidity or mortality. There are also severe inequities in AC ownership and use (O'Neill, 2005). Those of lower socioeconomic status are frequently less likely to own and afford to operate AC, and older adults have physiologic systems that delay the ability to perceive overheating (Kenny et al., 2018). Further, AC is a carbon intensive technology, and contributes to the same mechanisms that are making cities warmer (Krayenhoff et al., 2018).
Buildings consume 40% of the energy in the U.S., nearly half of which is for residential buildings and more than a third used for space heating, ventilation and AC (US DOE, 2012). Cooling energy demands are projected to increase with climate change (U.S. Global Change Research Program, 2014). Throughout the world, 59.5% (50.4% in the U.S.) of electricity is generated through the burning of fossil fuels (International Energy Agency), which releases climate-forcing greenhouse gas (GHG) emissions and health-harmful air pollutants (AP) that can cause 3.3 million premature deaths annually (Lelieveld et al., 2015). Buildings are responsible for 30% of energy-related GHG emissions globally (Ürge-Vorsatz et al., 2015). Electricity production and resulting GHG, such as carbon dioxide (CO2), and AP emissions, such as sulfur dioxide (SO2) and nitrogen oxides (NOx) tend to peak on hot days to meet cooling demands. Abel et al. (2017) found that as electricity generation increased in the eastern U.S., emissions from CO2, SO2, and NOx, also increased by 3.32, 3.35, and 3.60%/°C, respectively (Abel et al., 2017). Mid-century simulations found that as summer mean temperatures increase 1–5°C in the eastern U.S., there is projected to be a 32% increase in peak energy demand that could result in 16% increase in NOx and an 18% increase in SO2, using current energy generation sources (Meier et al., 2017).
For the past four decades, there has been a significant effort by governments, as well as building designers, homeowners, and constructors to reduce the energy demand of buildings. The development and implementation of building energy codes such as ASHRAE 90.1, IECC, and non-mandatory systems such as LEED in the U.S. (ASHRAE, 2016; International Code Council, 2018; USGBC), have resulted in a push toward more efficient buildings. While reducing building energy demand (and utility cost) has been the main target of these efforts, regional climate and health benefits accrue from reductions in GHG and AP emissions (Buonocore et al., 2016, 2019; MacNaughton et al., 2018). Further, these energy reduction measures can also enhance resiliency of buildings to extreme heat through indoor temperature reductions (Silvero et al., 2019b). The climate and health benefits that accumulate vary depending on the type of fuel being displaced, emissions rates, regional population downwind, local meteorology, and atmospheric chemistry of each region (Buonocore et al., 2016; Heo et al., 2016). However, these regional and indoor climate and health benefits are often not factored into the decisions to implement residential heat adaptation strategies. The additional benefits from reducing both GHG and air pollutant emissions from consumption of electricity for AC, and additional wintertime benefits of reduced heating fuel consumption are also often not considered.
In this paper, we quantify the health and climate benefits of energy and indoor temperature reductions that result from heat adaptation strategies applied to residential buildings (specifically a subset of single-family housing) in 10 cities across the U.S using building performance simulations. We then used the simulated energy reductions to estimate climate and health benefits from avoided regional GHG and AP emissions.
Materials and Methodology
Building Simulations
We used whole-building energy simulations to estimate the impacts of interventions on energy demand, and thermal comfort on a subset of buildings in each city. We created model baseline buildings and compared them with two improved cases (light and deep retrofits). This section describes the methodology of our building stock analysis.
Building Energy Simulations
Whole-building energy models are physics-based tools used by researchers, engineers, and architects for conducting thermal comfort and energy analysis of buildings. Current state-of-the-art tools are a result of four decades of research and development; and can reliably simulate buildings given an accurate input. For this study, we used EnergyPlus V9.1, a tool developed and extensively validated by U.S. Department of Energy (Crawley et al., 2001). The input to EnergyPlus includes details that define building shape, construction materials, occupant behavior, system characteristics, and accompanying weather data.
Model Buildings
When assessing the entire building stock of a geographical area, modeling and simulating individual buildings is not feasible. More importantly, the level of detail in data that allows for distinguishing individual buildings is often not available. Therefore, building science researchers commonly use archetypical building models as representative samples (Swan and Ugursal, 2009; Caputo et al., 2013; Reinhart and Cerezo Davila, 2016). Given the prevalence of detached single-family homes in U.S. metropolitan areas (US EIA, 2015; US Census Bureau, 2017), we limited our analysis to this type of building. In addition, because reliable data on construction properties of buildings built prior to 1990's was not available, we focused on buildings built between 1990 and 2010. By the 1990's, most city governments in the U.S. were enforcing building codes. As a result, the thermal properties of buildings built in this period are subject to the local energy code at the time. In contrast, for older buildings, there is no reliable data on envelope properties (e.g., insulation level) at the time of their construction, and possible later retrofits. This seriously limits the ability to create reliable models of older buildings. Notably, the houses simulated in this study would provide a conservative estimate of potential utility, climate, and health benefits, given the relative enhanced energy performance of newer buildings to older buildings.
With the scope of our analysis defined, we used American Housing Survey data (US Census Bureau, 2017) and extracted the number of single-family detached units built in this period in each of our test cities, and extracted their characteristics from the census data. For each city, our archetype reflected the most common number of floors, floor area, basement type, and heating fuel. Table 1, lists the selected cities, building characteristics of typical detached single-family homes, as well as climate types.
We used the 1998 version of International Energy Conservation Code for envelope properties (wall, ceiling, and floor insulation, as well as window properties) for each climate zone, and set the roof type (attic space vs. flat roof) based on archetypes provided by the U.S. Department of Energy (US DOE, 2019). We followed Building America Housing Simulation Protocols that sets forth a procedure for creating energy models of U.S. residential buildings (Wilson et al., 2014). For each city, in addition to the baseline model, we also created two improved cases. Our light retrofit case includes common interventions that are generally affordable and relatively easy to implement. The deep retrofit case includes measures that are generally more expensive and require more effort (such as replacing the windows) (see Table 2 for base and retrofitted properties).
Weather Data
EnergyPlus requires hourly weather data to estimate the building's heating, cooling, and lighting demands. When observed meteorological data is not available, simulated data has been found to be a reliable option for building energy simulations (Silvero et al., 2019a). Because of the annual variations in climate, common practice in building science uses a Typical Meteorological Year (TMY) which is generated using an amalgamation of 30 years of data. However, to include the impacts of climate change, we used morphed, “future” weather data. Details are available elsewhere (Troup and Fannon, 2016), but briefly, the data is created by starting with TMY data, and shifting data based on predictions from Global Circulation Models (GCM). We used typical weather (from WeatherShift), predicted using this technique (Troup and Fannon, 2016), for the years 2025–2045 for our analysis. For further details on TMY data and the morphing technique used to create the weather files we used, refer to Hall et al. (1978) and Troup and Fannon (2016).
Simulations and Outputs
EnergyPlus directly outputs annual energy demand of the building by fuel type and end use, as well as hourly indoor temperature and relative humidity. For each city, we modeled a baseline and two improved cases (Table 2). Using simulation best practices (ASHRAE, 2016), we then repeated each simulation three more times, rotating the building's orientation 90 degrees each time and averaging the outputs, to cancel any anomalies due to a specific solar orientation.
A properly sized and fully functional AC system can comfortably regulate the temperature of interior spaces at all times, even under a warming climate. Nevertheless, we were more interested in scenarios where AC is not functioning. This can be due to energy poverty, system failure, power outage, or inability to sense and react to heat (Baniassadi, 2019). Therefore, we ran each case with and without AC. We used the models with AC for energy saving calculations and models without AC for our discussion on indoor heat mitigation potential. In total, this resulted in 12 simulations for each city. The electricity and natural gas savings were multiplied by the total number of residential units (see section Model Buildings) and were then incorporated into the health and climate benefits analyses (see Section Benefits of Residential Energy Retrofits).
Benefits of Residential Energy Retrofits
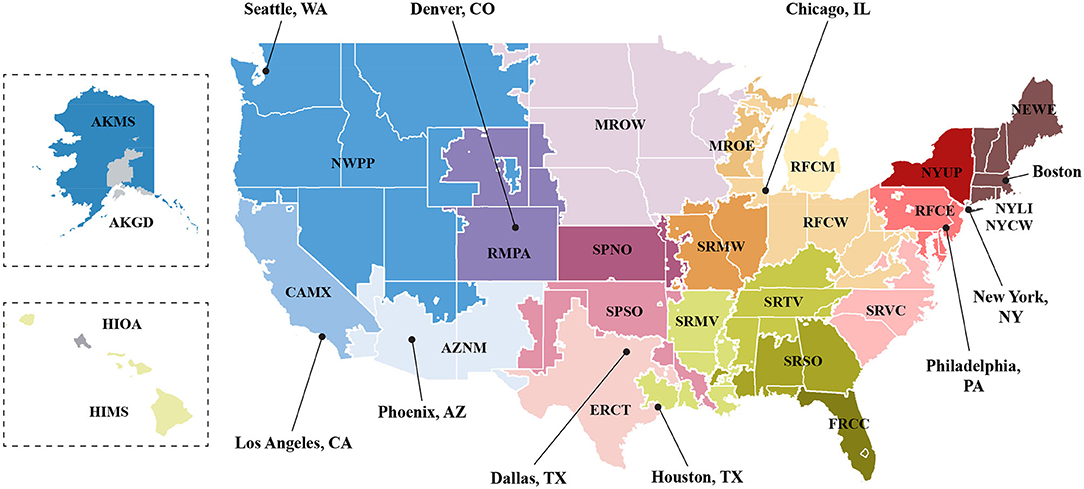
This analysis employs several publicly available tools and follows similar methodology and model framework as other research on the topic (Buonocore et al., 2016, 2019; MacNaughton et al., 2018). We translated energy reductions output from the building simulations into GHG emission (CO2, CH4, and N2O) and criteria AP emission (PM2.5, SO2, and NOx) reductions using the Environmental Protection Agency's (EPA) Emissions and Generation Resource Integrated Database (eGRID) which provided emissions factors for GHG's and AP's of interest (US EPA, 2018). These emissions factors are based on the mass of each pollutant released for the fuel mix in each sub-region. For emissions reductions from natural gas (for heating), we used EPA's WebFIRE (US EPA) to determine the AP and GHG emissions factors based on stational, residential fuel combustion from natural gas. We then determined the quantity of avoided AP and GHG emissions within each eGRID sub-region (Figure 1).
To estimate the human health damages from AP emissions, we used Estimating Air Pollution Social Impact Using Regression (EASIUR) model (Heo and Adams, 2015) as described by Heo et al. (2016). EASIUR is a reduced complexity model (RCM) derived from a suite of simulations using a complex computational atmospheric chemistry and transport model that provides estimates of the marginal social cost or marginal damage ($/metric ton) from emissions of PM2.5, SO2, and NOx at county-resolution (Heo and Adams, 2015). We evaluated total nationwide impacts of emissions for each source county, summarized by state, and assigned average annual health damage estimates for each eGRID region to each city. We estimated damages from elevated point sources using $11.2 2017 USD million as the value of a statistical life (VSL) (Dockins et al., 2004) and used a concentration-response curve with a slope of 1.29%/μg/m3, following findings from a meta-analysis of 53 research articles on the association between PM2.5 and mortality (Vodonos et al., 2018) as our estimate of the relationship between ambient PM2.5 concentrations and increased mortality risk.
We used the social cost of carbon (SCC) to evaluate the average health damage estimates from CO2 emissions. The SCC is a monetary measure of the long-term damages that result from emitting CO2 within a given year (US EPA, 2016). We also used the social cost of atmospheric release (SCAR) to evaluate the average health damage estimates from CH4 and N2O emissions. These values were adjusted for inflation to 2019 US dollars (USD), resulting in a SCC of $39.17/ton of CO2 ($11.97/ton–$114.24/ton), $14,143.64/ton of N2O ($3,046.32–$38,079.03), and $1,087.97/ton of CH4 ($489.59–$3,046.32). Low-range estimates assumed a 5% discount rate, mid-range estimates assumed a 3% discount rate, and high-range estimates account for a high-impact scenario with a 3% discount rate (US EPA, 2010, 2016). Results are reported as the total climate and health benefits from avoided GHG and AP emissions in January 2016 USD.
The average price of electricity for residential uses was determined for each state for January 2016 (US EIA, 2016), as well as the annual price of natural gas for each state in 2016 (US EIA, 2020), both available from the US Energy Information Administration. The total utility savings from light and deep retrofits were calculated based on the total MWh of on-site electricity and therms of natural gas reduced.
Costs of Residential Energy Retrofits
We estimated the costs of the building and site-level retrofits using several sources. We used 2011 RSMeans Construction Cost Data for the assemblies and unit price sample estimates of several interventions: caulking/sealing the windows (air infiltration), installing window overhangs, planting trees, and adding wall and roof insulation. We referred to a guideline by the U.S. DOE (Urban and Roth, 2010) for the cost of increasing roof albedo of an existing non-cool roof. For glazing costs, we used the National Residential Efficiency Measures Database (Roberts, 2012), which is also referred to in the U.S. DOE guideline for the selection of energy-efficient windows (Carmody and Haglund, 2012). The cost of the microencapsulated phase change materials was provided by regional distributors. All costs were adjusted for inflation to 2016 USD.
To account for the accrued benefits of the interventions over time, we calculated their simple payback periods, measured in years, and their net present values (NPVs), quantified in US dollars (2016 USD). These are financial metrics that help determine the profitability of an investment or project. The simple payback period refers to the amount of time that it takes to recover the cost of an investment. The NPV is the difference between the initial cost and the annual savings over the useful life of the project converted to a single present value. The latter is a more sophisticated measurement, since it factors in the time value of money. If the NPV is positive, the intervention is considered profitable over the project time frame. A 30-years period and a discount rate of 3% were assumed.
Results
Building Simulations
On average, there was 3.6°C (range: 3.0–5.5°C) reduction in daily maximum temperature (over the entire summer) from baseline under light retrofit scenarios, and a 6.8°C (range: 4.3°F−8.9°C) reduction under deep retrofit scenarios (Table 3). The amount of reduction in indoor temperature varied with climate, with the greatest reduction in indoor maximum temperature found in Denver, CO under light retrofits and Philadelphia, PA under deep retrofits, as compared to the base building, while New York, NY (light retrofits) and Los Angeles, CA (deep retrofits) had the least reduction. Both light and deep retrofits were found to mitigate daily maximum temperature more than daily mean temperature indoors.
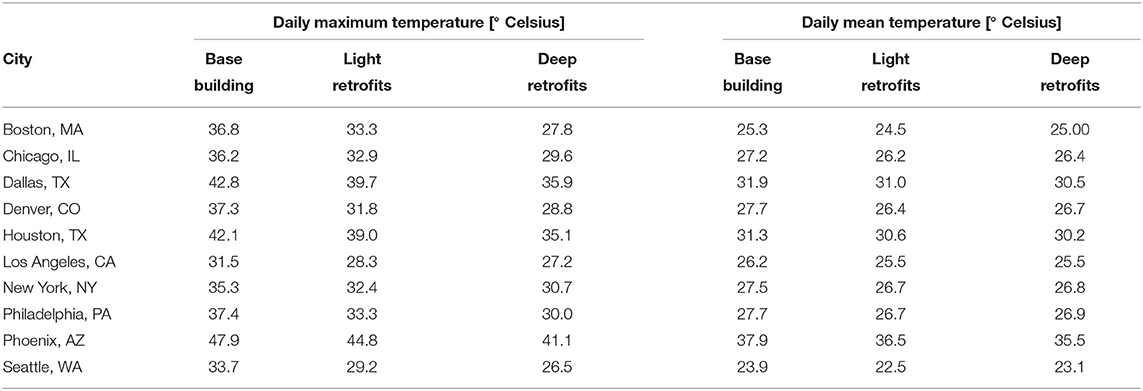
Table 3. Simulated indoor temperatures [° Celsius] (without AC) under light and deep retrofits by city.
Figure 2 lists the cumulative electricity savings (Figure 2A) and natural gas savings (Figure 2B) by city. Across these cities alone, there is upwards of 14.9 million MWh in electricity and 982.5 million therms in natural gas savings possible with these residential heat adaptation retrofits in this subset (built in 1990–2010) of single-family homes. These buildings represent 13–49% of single-family residential buildings in these cities.
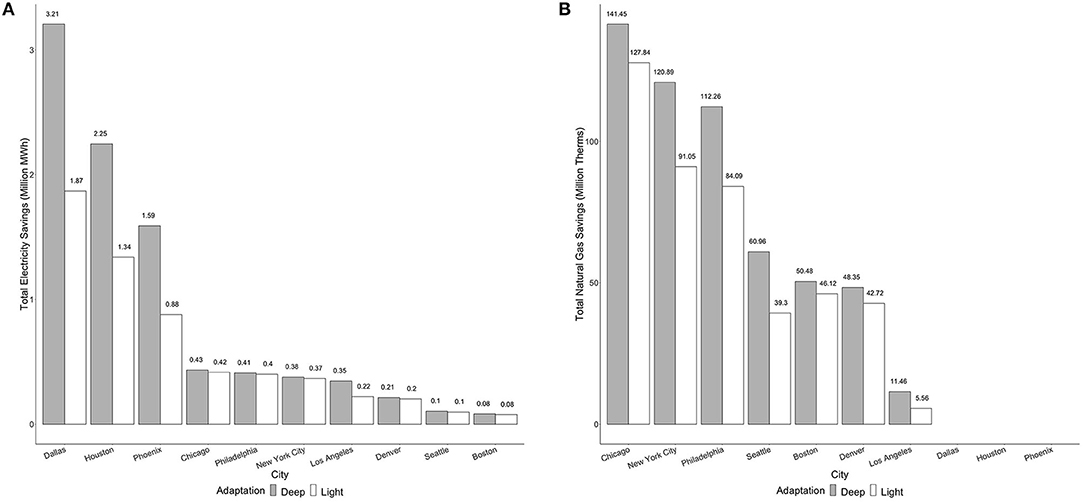
Figure 2. (A) Modeled electricity (million MWh) and (B) natural gas (million therms) savings for each of the 10 US cities simulated with light (relatively easy) vs. deep (more difficult) heat adaptation retrofits of single-family detached homes built from 1990 to 2010. In Phoenix, Dallas, and Houston, our archetypical building model had electric resistant heating instead of a natural gas furnace or boiler.
The electricity reductions vary significantly across different eGRID sub-regions, largely due to the baseline energy intensity of single-family homes, difference in envelope properties, structure type, and heating fuel (electricity vs. natural gas), as well as the differences in climate. The three cities with the greatest potential regional electricity savings are Dallas, TX, Houston, TX, and Phoenix, AZ, which are the hottest cities in this analysis. Boston, MA, Seattle, WA, and Denver, CO were estimated to have the least electricity savings. Of those cities that utilize natural gas for heating, Chicago, IL, New York, NY, and Philadelphia, PA had the greatest reductions in natural gas.
Benefits of Residential Energy Retrofits
Under light and deep heat adaptation retrofits, we found a total mid-range estimate of $1.57 billion (low-range estimate, $1.41–high-range estimate, $2.01 billion) and $2.26 billion ($2.01–$2.95 billion) in total annual benefits (climate, health, and utility), respectively.
Utility Savings
There was a total of $1.10 billion and $1.57 billion in direct savings from avoided utility costs under light and heavy retrofits, respectively. This resulted in an average savings of $110.4 million (light retrofits) or $156.5 million (deep retrofits) per city. Direct benefits from utility savings accounted for ~77% of possible benefits on average under either retrofit scenario. Chicago, IL, Dallas, TX, Houston, TX, and New York, NY experiencing the greatest magnitude of utility savings. Since many of the building retrofits reduce both heating and cooling costs the financial returns tended to be greatest in harsh cold climates and least in climates with warm winters, such as Los Angeles and Phoenix. In addition, utility savings tended to be greater in cities with electric, not natural gas, heating, such as Dallas and Houston.
Climate and Health Benefits
Climate-change-related benefits of residential heat adaptation retrofits result from reductions in GHG emissions. Health benefits accruing from these avoided GHG emissions as well as decreased emissions of criteria APs. These indirect benefits consisted of ~23% of all calculated benefits. There was an average of $46.3 million and $69.3 million in climate and health benefits per city under light and deep retrofits, respectively. These cities would accumulate ~$462.9 million ($309.3–$909.9 million) in annual climate and health benefits under light retrofits in single-family homes built from 1990 to 2010 (Figure 3). Under deep retrofits in these same buildings, ~$692.8 million ($442.6 million–$1.39 billion) in climate and health benefits would be possible (Figure 3). These climate and health benefits are largely due to the removal of 5.7 billion tons of CO2 (8.8 billion tons of CO2 under deep retrofits) from the atmosphere, and the reduction of 8,400 tons of health-harmful APs (13,00 tons of APs under deep retrofits).
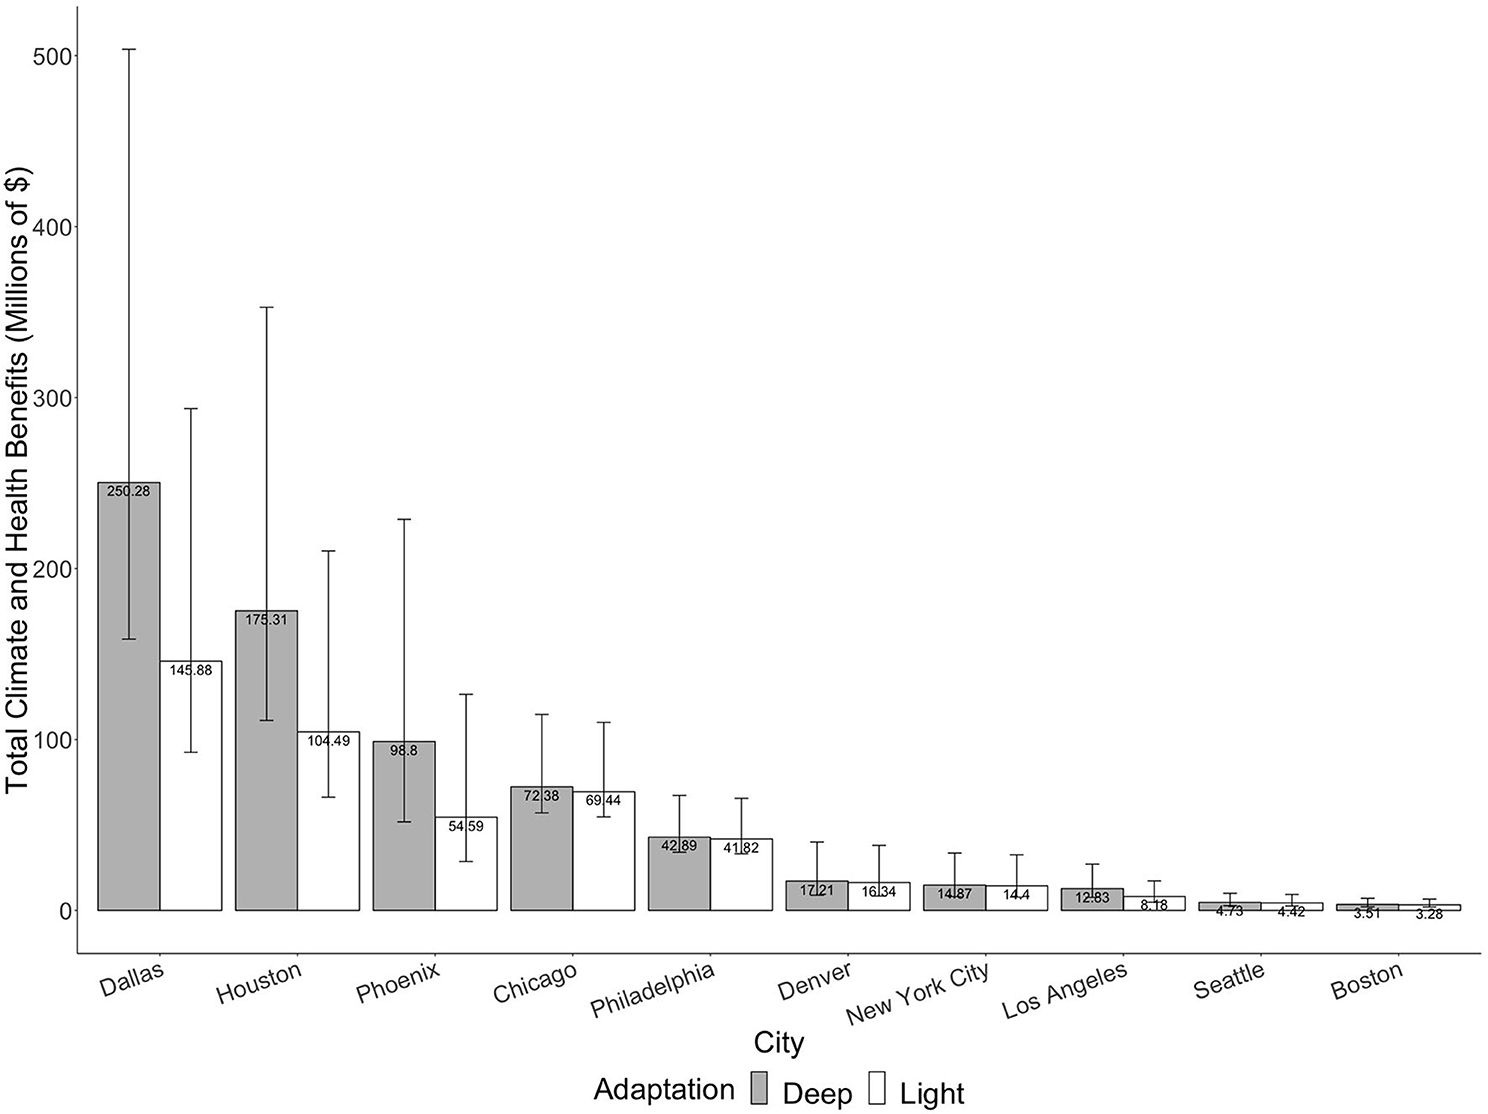
Figure 3. Total estimated climate and health benefits (million 2016 USD) from light (white) or deep (gray) heat adaptation retrofits applied to detached single-family residential buildings built from 1990 to 2010. Error bars indicate low- and high-range estimates.
The majority of differences in climate and health benefits is driven by differences in climate and the electricity grid, such that those regions that are hotter or with more polluting and carbon-intensive grids (i.e., generally those with more coal) have greater climate and health benefits that would result from these heat adaptation retrofits. Under scenarios with light retrofits, Dallas, TX ($145.9 million), Houston, TX ($104.5 million), and Chicago, IL ($69.4 million) were estimated to have the greatest amount of climate and health benefits (Figure 3). Under deep retrofits, Dallas, TX ($250.3 million), Houston, TX ($175.3 million), and Phoenix, AZ ($96.8 million) had the greatest climate and health benefits; these same cities had the greatest electricity reductions. While Chicago, IL did not have the largest energy reductions from the light or deep retrofitting, it did have large savings from reductions in natural gas demand and also has a dirtier electricity grid. Boston, MA had the least amount of climate and health benefits under either retrofit scenario (light: $3.28 million; deep: $3.51 million).
Total Benefits
When considering both direct benefits from utility savings and indirect savings from climate and health benefits under these retrofit scenarios, Dallas, TX (light: $350.5 million; deep: $601.4 million), Houston, TX (light: $251.1 million; deep: $421.2 million), and Chicago, IL (light: $214.2 million; deep: $229.5 million) accrued the greatest magnitude of benefits. Denver, CO (light: $74.9 million; deep: $68.9 million), Los Angeles, CA (light: $53.7 million; deep: $87.4 million) and Seattle, WA (light: $54.1 million; deep: $77.6 million) had the least amount of total benefits (Figure 4). On average, the climate and health benefits were equivalent to 42.1% (light) and 44.1% (deep) the value of the utility savings (Figure 5). Under either retrofit scenario, the climate and health benefits accrued as a percentage of utility savings were largest in Dallas, TX and Houston, TX and were smallest in Boston, MA and Seattle, WA.
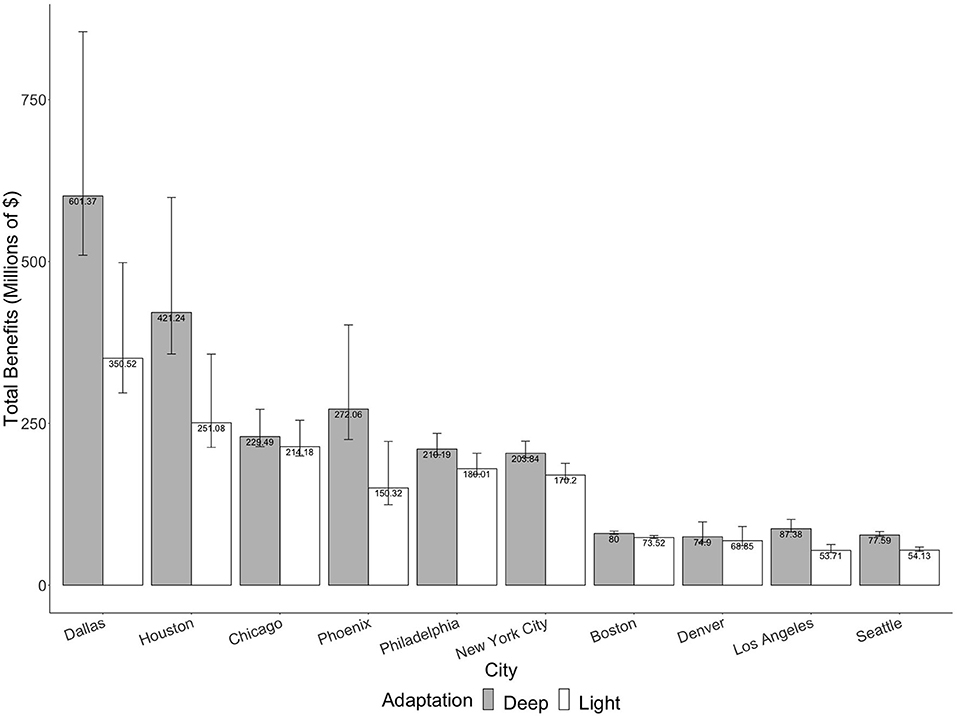
Figure 4. Total estimated benefits (climate, health, and utility) (million 2016 USD) from light (white) or deep (gray) heat adaptation retrofits applied to detached single-family residential buildings built from 1990 to 2010. Error bars indicate low- and high-range estimates.
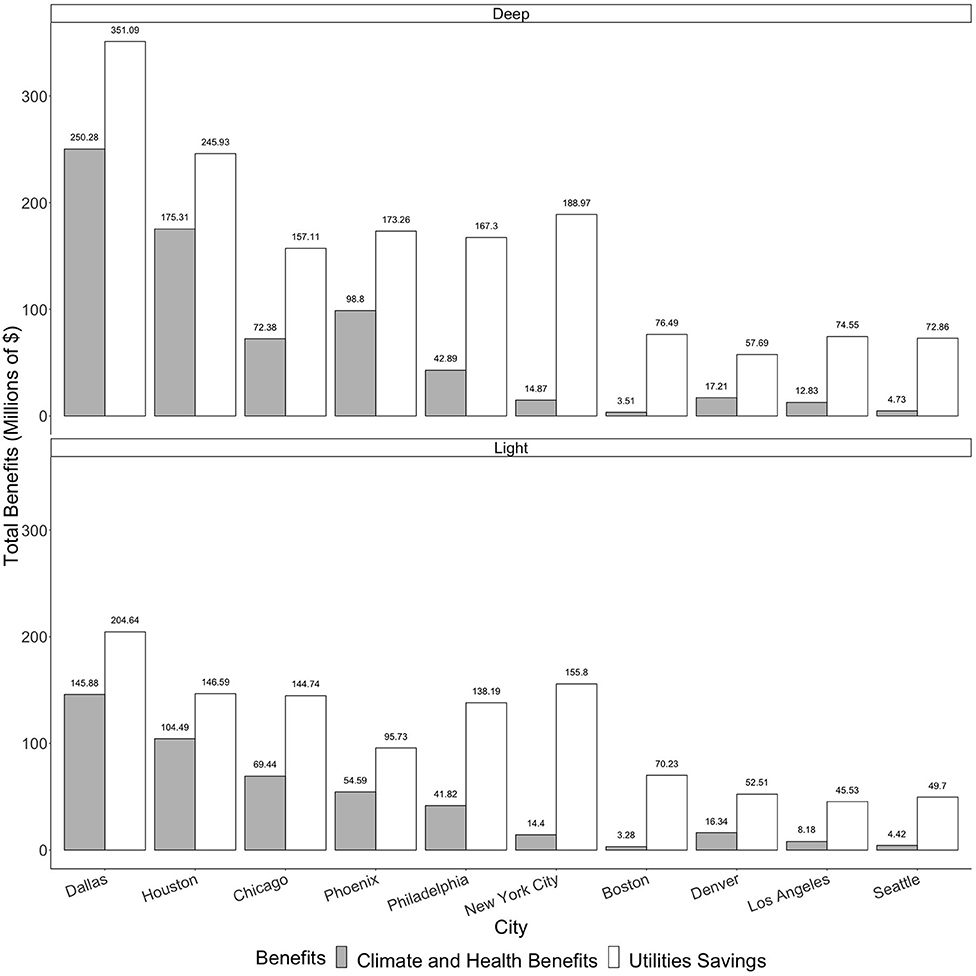
Figure 5. Total estimated climate and health (gray) or utility (white) benefits (million 2016 USD) under light (top) or deep (bottom) heat adaptation retrofits applied to detached single-family residential buildings built from 1990 to 2010.
On average, there were $205.3 million (range: $180.4 million- $274.3 million) in total benefits per MWh of energy reduced. The greatest total benefits per unit energy savings were in Chicago, IL ($281.1 million/MWh) and Philadelphia, PA ($243.1 million/MWh), with the least in Phoenix, AZ ($171.2 million/MWh) and Seattle, WA ($136.2 million/MWh). There were $73.5 million in climate and health benefits per MWh of energy saved. The greatest climate and health benefits per the amount of energy reduced from implementing these heat-adaptation retrofit strategies in 1990–2010 single family detached homes occurred in the cities with the dirtiest energy mixes: Chicago, IL ($166.9 million/MWh) and Philadelphia, PA ($104.4 million/MWh). The cities with cleaner electricity grids, Los Angeles, CA ($37.1 million/MWh) and New York, NY ($39.4 million/MWh), had the least climate and health benefits per MWh saved (Figure 6).
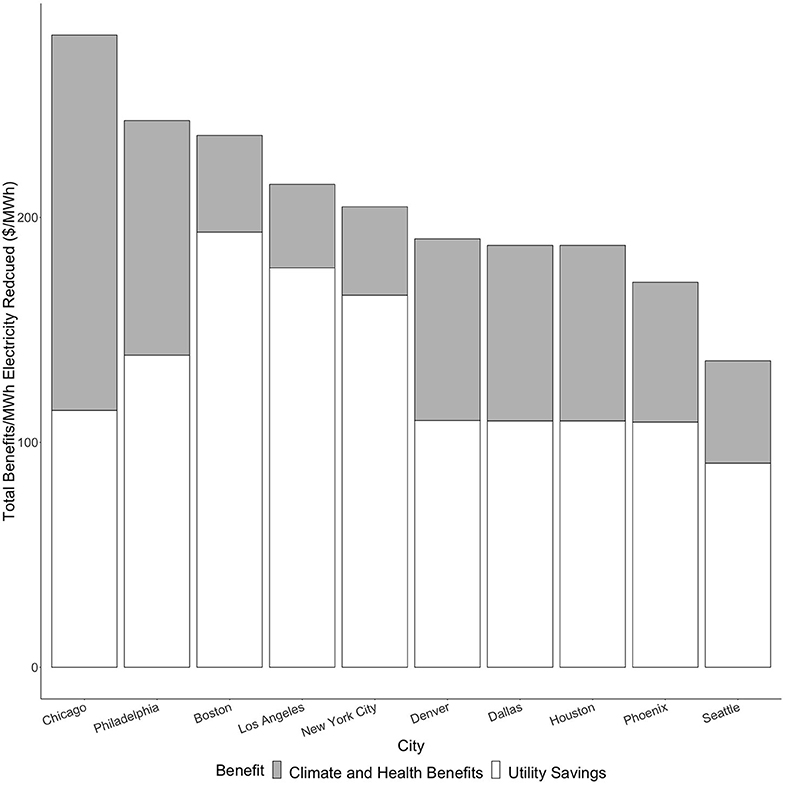
Figure 6. Total climate and health (gray) and utility savings (white) benefits per MWh (2016 USD/MWh) of energy reduced from heat adaptation retrofits applied to detached single-family homes built from 1990 to 2010.
When comparing the benefits in respect to the simulated energy reductions and number of single-family detached homes built from 1990 to 2010 (Figure 7), trends emerge between cities. A positive trend is evident when comparing the benefits/MWh reduced per home and the amount of energy reduced per home (Figure 7), with the greatest electricity savings and benefits per home in Dallas, TX, Houston, TX, and Philadelphia, PA. Phoenix, AZ had moderate electricity savings and benefits per housing unit, while Seattle, WA had the least.
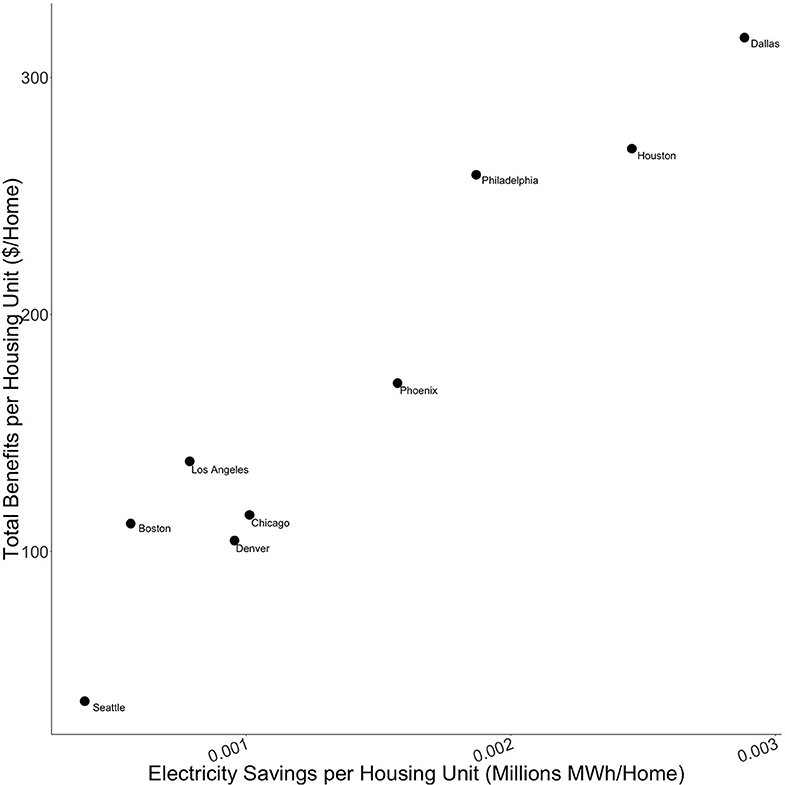
Figure 7. Total electricity savings per single-family detached home (1990 to 2010) and total benefits per MWh of electricity reduced from heat adaptation retrofits 2010.
Costs of Residential Energy Retrofits
Table 4 lists the total costs of both light and deep retrofit interventions. It is important to consider these benefits in the context of the cost of these interventions. In the full residential stock of single-family detached homes built from 1990 to 2010 that were simulated in this study, we estimate the light and deep retrofits would cost $25.09 billion and $212.65 billion, respectively. The total costs of these retrofit strategies are 16 and 94 times larger than the annual accrued climate, health, and utility benefits of these retrofit strategies, for light and deep retrofits, respectively. The costs of the light retrofits exceed the annual utility savings by 23 times and the regional annual climate and health benefits by 54 times.
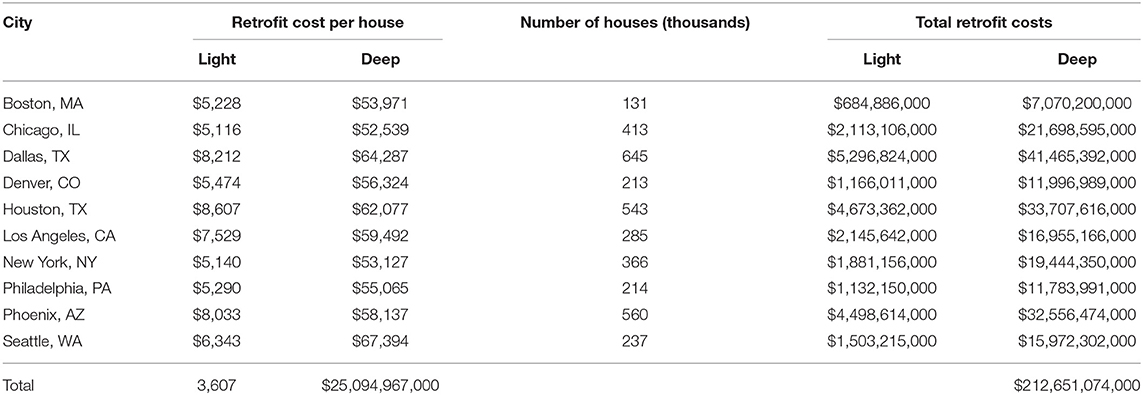
Table 4. Estimated costs (2016 USD) of light and deep retrofits for single family detached homes built from 1990 to 2010 for city.
For all cities, the cost estimates of these strategies range from ~$5,100–$8,600 per unit for light retrofits and $52,000–$67,000 per unit for deep retrofits for the single-family detached homes that were simulated. Under either retrofit strategy, Philadelphia, PA accrues the most total benefits per housing unit with the cheapest retrofit cost. Boston, MA also demonstrated moderate benefits per housing unit for a relatively cheaper cost. Under the current modeling assumptions, this housing archetype represents the fewest number of units in Boston, MA. While Dallas, TX and Houston, TX experienced large benefits per housing unit, the average cost was more expensive. In the other cities that were analyzed, the association between the total benefits per and the cost of retrofits vary more widely (Figure 8).
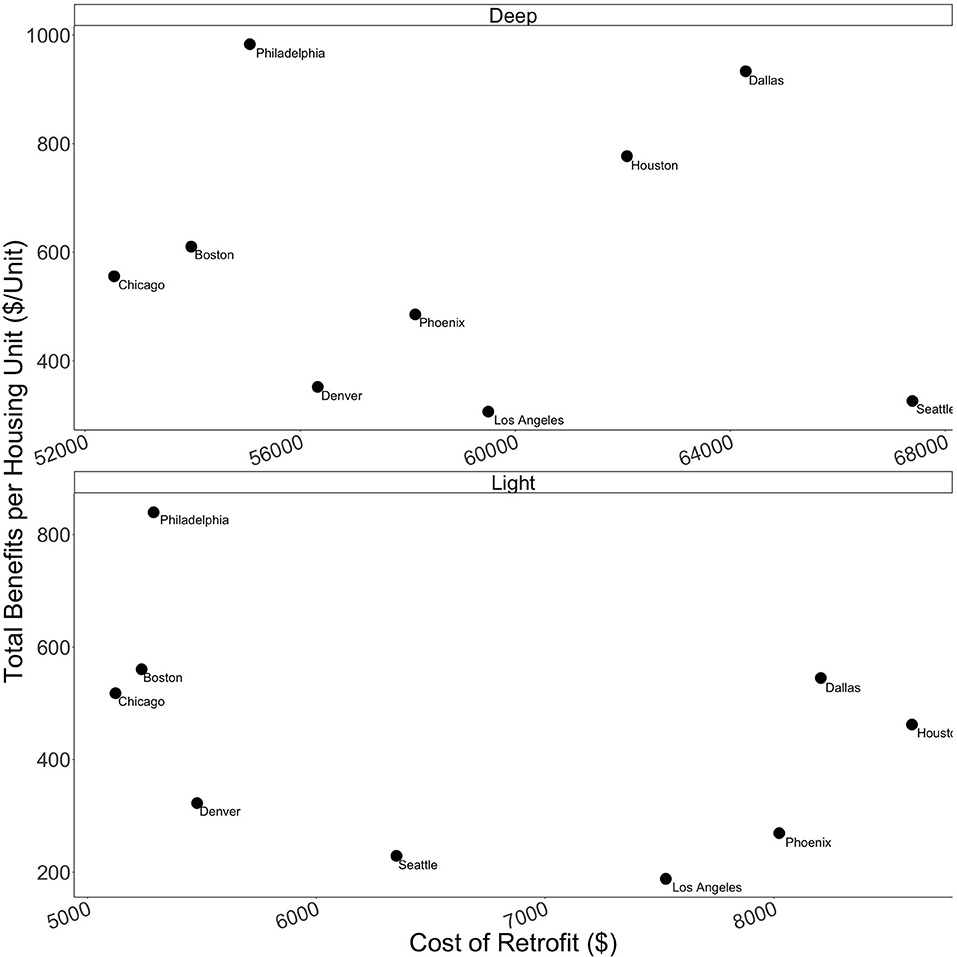
Figure 8. Total annual cost (2016 USD) of deep (top) and light (bottom) heat adaptation retrofits per single-family detached housing unit (1990–2010) and total benefits (climate, health, and utility savings) from heat adaptation retrofits per detached single-family homes built from 1990–2010.
We assessed the payback periods and NPVs of these interventions for light and deep retrofits twice. First, we included the utility savings only, and second, we considered the total savings (utility, climate, and health) (Table 5). When all savings are included, light retrofits have payback periods ranging from 6 to 40 years, with an average of 18.5 years, and have an average total benefit of $2,128 per house across all 10 cities over the 30-years period. Accounting for either all savings, or only utility savings, can have a substantial impact on these metrics. This impact can be especially large in certain cases. For example, the utility-only payback periods for light retrofits of houses in Dallas, TX and Houston, TX are 26 years and 32 years, respectively. When climate and health savings are included, these payback periods decrease to almost half (15 and 19 years, respectively). In contrast to light retrofits, deep retrofits are not economically attractive, with long payback periods and negative NPVs.
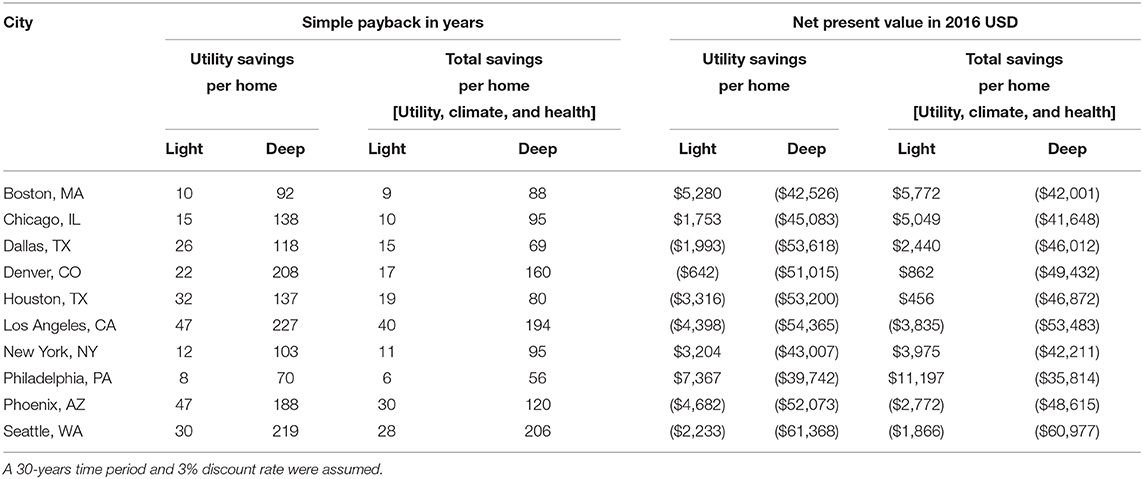
Table 5. Simple Payback (years) and Net Present Value (2016 USD) of light and deep retrofits for single family detached homes built from 1990 to 2010 for city, considering the utility savings only, or the total savings (utility, climate, and health).
Discussion
In this study, energy reductions within single-family detached homes built from 1990 to 2010 were simulated across 10 U.S. cities, which allows us to estimate the resulting health and climate benefits. We estimate that the simulated heat adaptation retrofits in this subset of residential buildings have the potential to yield $1.57 billion ($1.41–$2.01 billion) or ~$2.26 billion ($2.01 –$2.95 billion) in total annual benefits that result from light or deep retrofits, respectively. Utility savings comprise about 77% of these benefits, and are responsible for $1.10 billion of the total benefits under light retrofits and $1.57 billion under deep retrofits. Indirect regional benefits to climate and health, from avoided health harmful AP and GHG emissions would contribute $462.9 million ($301.3–$909.9 million) in annual benefits under light retrofits and $692.8 million ($442.6–$1.39 billion) under deep retrofits. Climate and health benefits were equivalent to 42.1% (light) and 44.1% (deep) the value of the utility savings on average.
To fully understand the economic implications of the heat adaptation retrofits, we factored in the initial investment costs of the interventions. If all savings (utility, health, and climate) are included in the analysis, light retrofits yield an average total benefit of $2,128 per house across all 10 cities over a 30-years period, with an average payback period of 18.5 years. Notably, a revised list of retrofit options, i.e., one that eliminates some of the least profitable investments, could be chosen for each city to improve the financial returns. However, the list of retrofits studied here, serves the purpose of allowing us to compare direct and indirect benefits. It is important to note that accounting for either all savings, or for utility savings only, can considerably impact these results. For instance, the payback period of light retrofits decreases from an average of 25–18.5 years when all savings are included. Deep retrofits have much longer payback periods and are not attractive from a strictly financial standpoint.
In recent decades, governments, building designers, and homeowners have paid particular attention to reducing energy demands of buildings. Because of its focus on reducing energy consumption for utility savings, much of this work has been classified as climate change mitigation since it reduces energy consumption and resulting AP and GHG emissions from electricity generation, rather than climate change adaptation. However, climate change adaptation solutions, like retrofits to residential buildings to mitigate extreme heat, can also result in reductions in energy demand. These reductions have direct benefits to landlords, homeowners, and residential occupants through reduced utility costs.
Given that many people in the U.S. spend a large majority of their time at home, residential buildings play a significant role in enhancing resilience and preparedness to extreme heat events and safeguarding the occupants during harmful heat events. To date, residential buildings in the U.S. have primarily relied upon increasing mechanical cooling to improve thermal comfort during extreme heat events. There is a large suite of adaptation interventions and retrofits that would reduce indoor temperatures and reduce energy demand. These climate change adaptation retrofits, like those simulated within this paper, result in regional climate and health benefits accrued from reductions in GHG and AP emissions generated through energy production (Buonocore et al., 2016, 2019; MacNaughton et al., 2018). These indirect benefits to climate and health are not widely considered in the planning and implementation of climate change adaptation strategies. We aimed to demonstrate in this paper the magnitude of potential utility savings and climate and health benefits of potential heat adaptation solutions. These benefits should be considered in heat adaptation planning and may make some retrofit options more financially appealing to designers, occupants, and other decision-makers.
Utility benefits varied by city, but were driven by the simulated energy reductions, the proportion of the local housing stock represented by the simulated building archetype used in this study, and the cost of electricity and natural gas in each city. On average, the direct benefits from utility savings were 2.38 (light retrofits) or 2.27 (deep retrofits) times greater than the indirect benefits from climate and health improvements. Climate-change-related benefits of residential heat adaptation retrofits result from reductions in GHG emissions, with health benefits accruing from these avoided climate emissions as well as decreased emissions of criteria APs. These indirect benefits consisted of ~42–44% of all calculated benefits. There was an average of $46.3 million and $69.3 million in climate and health benefits per city under light and deep retrofits, respectively, and were due to the removal of 5.7–8.8 billion tons of CO2 from the atmosphere, and the reduction of 8,400–13,000 tons of health-harmful APs.
The magnitude of climate and health benefits varied by city and were largely driven by differences in energy mixes, with “dirtier” grids like those comprised of more fossil fuels, resulting in more climate and health benefits under the same retrofit scenarios. With these dirtier energy mixes, reductions in electricity demand can displace the combustion of coal or oil, which prevents more GHG or AP from being released into the atmosphere compared to a region with a cleaner energy mix (e.g., more renewable energy). Further, those regions that are hotter also saw greater climate and health benefits under these heat adaptation retrofits, due to a greater reduction in energy demand on hotter days and most cities utilizing electric heat. Cities like Dallas, TX, Houston, TX, Phoenix, AZ, and Chicago, IL had the greatest amount of climate and health benefits. Philadelphia, PA had a moderate amount of benefits per home with relatively cheaper cost of retrofit. These cities, which make up the hottest cities and the regions in the U.S. with the dirtiest energy mixes, suggest locations where a balance of residential energy savings, total benefits, and cost of retrofit may be maximized.
Health Benefits of Indoor Temperature Reductions
Our results show that these indirect climate and health benefits are large, since we selected a concentration-response function that is much lower than most other studies on air pollution and mortality risk. In addition to the climate and health benefits that result from energy reductions, significant benefits would also result from reducing indoor temperature in single-family homes as residential buildings become more resilient to extremely hot weather and reduce exposure to dangerous and health-harmful temperatures. In the absence of a functional AC, we estimated a 3.0–5.5°C and 4.3–8.9°C maximum indoor temperature reduction under light and deep retrofit scenarios, respectively. We are unable to quantify these additional health benefits from reduced indoor temperatures, which are not included in our estimates. However, there is expansive research, discussed below, demonstrating that the large health benefits that are possible for occupants with these heat adaptation interventions.
Despite the vast amount of literature available on heat and health using ambient temperatures, few epidemiological studies have examined indoor temperatures and their impact on mortality, morbidity, and thermal health outcomes. Here, we briefly summarize some relevant results of epidemiological literature that have demonstrated associations between indoor temperature and these health outcomes to put the estimated indoor temperature reductions from these heat adaptation retrofits into context and demonstrate additional potential health benefits that are possible from cooler indoor environments.
A recent epidemiological study in Texas that utilized mortality data with simulations of summertime indoor heat at the census block group level found 1.18 and 1.27 times the odds of mortality per 5°C increase in same-day maximum indoor discomfort index for heat- and circulatory-related disease, respectively, in Houston (Baniassadi, 2019; Wilhelmi et al., 2020). For a 5°C increase in same-day indoor maximum temperature, there was 1.11 times the odds of heat-related mortality, and 1.18 times the odds of circulatory-related mortality with a 5°C increase in maximum indoor discomfort index in Houston (Wilhelmi et al., 2020). High indoor temperatures have also been associated with morbidity and declines in sleep and cognitive function. In young, healthy adults in the greater Boston, MA area, researchers found a 2.74-min decrease in total sleep duration and a 16–24 ms increase in reaction time on validated cognitive tests for each 1°C increase in overnight indoor temperatures (Cedeño Laurent et al., 2018), as well as more disrupted sleep for each 5°C increase in overnight indoor mean temperatures in older adults living in public housing in the same city (Williams et al., 2019). As indoor temperatures increased from 22.6 to 25°C in a nursing home, agitation in dementia patients increased (Tartarini et al., 2017). Finally, there has been a 43% (15%) increase in medical distress responses from respiratory disease (cardiovascular disease) as indoor heat index exceeded 26°C, as well as findings that both diastolic and systolic blood pressure can significantly increase as indoor or outdoor temperatures increase (Kim et al., 2012; Uejio et al., 2016).
Energy saving adaptations that also result in indoor temperature reductions can be associated with a wide range of health benefits to residents that should be factored into the decisions to implement residential adaptation strategies. For example, Alam et al. (2016) modeled the correlation between housing energy rating and heat-related mortality in Melbourne; these researchers found that if the entire existing housing stock that currently has low energy rates were upgraded to a 5.4 minimum energy star rating, the mortality rate from an event similar to a 2009 severe heatwave may decrease by 90% (Alam et al., 2016). A recent study in the United Kingdom found that by applying external shutters, energy consumption is reduced, and heat mortality has the potential to decrease 37–43% (Taylor et al., 2018). Research in Paraguay showed that while climate change will result in increased temperatures that lead to greater discomfort among building occupants, energy refurbishment measures can mitigate the impact and should therefore be incorporated into building codes (Silvero et al., 2019b). These studies show how these adaptation strategies to combat extreme heat exposures, like those simulated within this study, result in significant energy savings, as well as benefits to public health by reducing heat exposure for occupants.
Implementing heat adaptation strategies has potential to contribute to a beneficial positive feedback, reducing energy and temperatures indoors, which reduces the amount of cooling needed, reducing future energy use and AC-related waste heat to the environment (which then also cools urban temperatures) (Kikegawa et al., 2003; Hsieh et al., 2007; Salamanca et al., 2014). The figures presented in this study are therefore likely underestimates of true magnitude of climate and health benefits that are possible, as reduced waste-heat has not been factored into these analyses.
While knowledge gaps still exist from a lack of comprehensive epidemiological associations between indoor temperature exposures and health impacts, these studies provide evidence that significant health benefits are likely to result from lower indoor temperatures at magnitudes like those temperature reductions, 3.0–5.5°C under light retrofits and 4.3–8.9°C under deep retrofits, demonstrated here. The reduced indoor temperatures estimated from light and/or deep retrofits would provide significant public health benefits, although we are unable to quantify the exact magnitude of those benefits within this analysis.
Limitations
There are some limitations of these analyses. In particular, we used single archetypes to represent an average house. In future, this can be improved by increasing the number of archetypes per city. However, a key barrier remains explicit data. For example, data in American Housing Survey or Residential Energy Consumption Surveys do not come in the form of bi- or tri-variable tables. Regarding the emissions avoided, eGRID models emissions reductions and associated benefits from the primary fuel type displaced on average, not the actual fuel mix that is displaced. Therefore, if an individual power plant is co-fired by both gas and coal and uses less gas in response to decrease electrical demand rather than the average fuel mix, this is not reflected in our modeling. Further, the climate and health benefits presented here do not include full lifecycle emissions from energy source generation (e.g., mining, fracking), which contribute a significant number of health impacts for some fuels, like coal (Epstein et al., 2011) or natural gas (McKenzie et al., 2012; Adgate et al., 2014).
Another limitation to consider is that the cost estimates of these retrofits include market cost only. They do not include the environmental costs of production or transportation, and these additional impacts of these retrofit interventions should be included in the planning and implementation of widespread retrofit solutions. The climate and health damages and utility prices used within these analyses are from January 2016, to provide internal consistency with the other simulations and estimates throughout the analyses. However, these prices are location and time dependent. The time, season, location of consumption reductions may result in different energy displacement scenarios, and to account for this, annual averages are used throughout. Further, as the electricity grid changes, the benefits of reducing consumption, like the energy reductions shown herein, will likely reduce as the grid becomes less carbon intensive (i.e., through the deployment of more renewables).
As this analysis focused on single family detached homes built from 1990 to 2010, there are many single-family homes not included in our building simulations and attendant results. Arguably, the single-family buildings modeled in this study were built to with the best energy efficient of all single-family homes to date. Thus, the potential previously unaccounted for climate and health benefits estimated here are likely a conservative estimate and exceed these values.
For the payback period calculations, other retrofit options that are more financially attractive could have been chosen. For example, less aggressive levels of insulation may be more cost-effective in the mild and warm climates. Further, these calculations don't account for all of the benefits accrued from mitigating GHG or the health impacts of extreme heat. However, these estimates allow us to compare the magnitude of direct and indirect climate and health benefits, which should be incorporated into adaptation planning to enhance the heat resilience of the residential housing stock.
Conclusion
As the frequency and severity of extreme heat increases with global climate change, residential buildings play a key role in climate change adaptation, as they provide a point of intervention to mitigate high indoor temperatures and heat-related public health impacts. However, these residential heat adaptation interventions had not been fully evaluated for their potential energy, climate, and health benefits, but were found to yield $1.57 billion ($1.04–$2.01 billion) in total utility, climate, and health benefits under light retrofit and $2.26 billion ($2.01–$2.95 billion) under heavy retrofit scenarios in 10 U.S. cities. The climate and health benefits may account for an additional 42–44% of the direct utility savings, on average. While deep retrofits were not found to be financially profitable, light retrofits had an average payback period as low as 6 years when accounting for all benefits, with an average economic benefit of $2,128 per house across all 10 cities. These direct and indirect benefits should be considered in heat adaptation planning for residential buildings, especially at the policy-level, and may make some retrofit options more financially appealing to designers, occupants, and other decision-makers.
Data Availability Statement
The raw data supporting the conclusions of this article will be made available by the authors, without undue reservation.
Author Contributions
AW, AB, PI, JC-L, and HS contributed conception and design of the study. AW, AB, and PI organized the database. AB and PI performed the building simulation analyses and wrote sections of the manuscript. AW performed the statistical analyses on the health and climate benefits with assistance by JB. AW wrote the first draft of the manuscript. HS and AB secured funding. HS supervised the project. All authors contributed to manuscript revision, read, and approved the submitted version.
Funding
This research was funded by the Harvard University Climate Change Solutions Fund.
Conflict of Interest
The authors declare that the research was conducted in the absence of any commercial or financial relationships that could be construed as a potential conflict of interest.
The handling editor is currently organizing a Research Topic with one of the author JB.
Acknowledgments
We wish to acknowledge the Harvard Center for Green Buildings and Cities for providing office space.
References
Abel, D., Holloway, T., Kladar, R. M., Meier, P., Ahl, D., Harkey, M., et al. (2017). Response of power plant emissions to ambient temperature in the Eastern United States. Environ. Sci. Technol. 51, 5838–5846. doi: 10.1021/acs.est.6b06201
Adgate, J. L., Goldstein, B. D., and McKenzie, L. M. (2014). Potential public health hazards, exposures and health effects from unconventional natural gas development. Environ. Sci. Technol. 48, 8307–8320. doi: 10.1021/es404621d
Alam, M., Sanjayan, J., Zou, P. X. W., Stewart, M. G., and Wilson, J. (2016). Modelling the correlation between building energy ratings and heat-related mortality and morbidity. Sustain. Cities Soc. 22, 29–39. doi: 10.1016/j.scs.2016.01.006
ASHRAE. (2016). ASHRAE Standard 90.1-2016, Energy Standard for Buildings Except Low-Rise Residential Buildings. The American Society of Heating, Refrigerating and Air-Conditioning Engineers (ASHRAE). Available online at: https://ashrae.iwrapper.com/ViewOnline/Standard_90.1-2016_(IP) (accessed February 10, 2020).
Baniassadi, A. (2019). Vulnerability of the US Residential Building Stock to Heat: Status Quo, Trends, Mitigation Strategies, and the Role of Energy Efficiency. Tempe, AZ: Arizona State University.
Baniassadi, A., Heusinger, J., and Sailor, D. J. (2018). Energy efficiency vs resiliency to extreme heat and power outages: the role of evolving building energy codes. Build. Environ. 139, 86–94. doi: 10.1016/j.buildenv.2018.05.024
Buonocore, J. J., Hughes, E. J., Michanowicz, D. R., Heo, J., Allen, J. G., and Williams, A. (2019). Climate and health benefits of increasing renewable energy deployment in the United States. Environ. Res. Lett. 14:114010. doi: 10.1088/1748-9326/ab49bc
Buonocore, J. J., Luckow, P., Norris, G., Spengler, J. D., Biewald, B., Fisher, J., et al. (2016). Health and climate benefits of different energy-efficiency and renewable energy choices. Nat. Clim. Change 6, 100–105. doi: 10.1038/nclimate2771
Campbell, S., Remenyi, T. A., White, C. J., and Johnston, F. H. (2018). Heatwave and health impact research: a global review. Health Place 53, 210–218. doi: 10.1016/j.healthplace.2018.08.017
Caputo, P., Costa, G., and Ferrari, S. (2013). A supporting method for defining energy strategies in the building sector at urban scale. Energy Policy 55, 261–270. doi: 10.1016/j.enpol.2012.12.006
Carmody, J., and Haglund, K. (2012). Measure guideline: energy-efficient window performance and selection (No. DOE/GO-102012-3656). Golden, CO: National Renewable Energy Lab. (NREL). Available online at: https://www.nrel.gov/docs/fy13osti/55444.pdf
Cedeño Laurent, J. G., Williams, A., Oulhote, Y., Zanobetti, A., Allen, J. G., and Spengler, J. D. (2018). Reduced cognitive function during a heat wave among residents of non-air-conditioned buildings: an observational study of young adults in the summer of 2016. PLoS Med. 15:e1002605. doi: 10.1371/journal.pmed.1002605
Crawley, D. B., Lawrie, L. K., Winkelmann, F. C., Buhl, W. F., Huang, Y. J., Pedersen, C. O., et al. (2001). EnergyPlus: creating a new-generation building energy simulation program. Energy Build. 33, 319–331. doi: 10.1016/S0378-7788(00)00114-6
Dockins, C., Maguire, K., Simon, N., and Sullivan, M. (2004). Value of statistical life analysis and environmental policy: a white paper. J Risk Insurance. 72, 577–599.
Epstein, P. R., Buonocore, J. J., Eckerle, K., Hendryx, M., Stout Iii, B. M., Heinberg, R., et al. (2011). Full cost accounting for the life cycle of coal: full cost accounting for the life cycle of coal. Ann N Y Acad Sci. 1219, 73–98. doi: 10.1111/j.1749-6632.2010.05890.x
Hall, I. J., Prairie, R. R., Anderson, H. E., and Boes, E. C. (1978). Generation of a typical meteorological year. in (San Diego, CA, USA: U.S. Department of Energy Office of Scientific and Technical Information). Available online at: https://www.osti.gov/biblio/7013202 (accessed March 2, 2020).
Heo, J., and Adams, P. J. (2015). EASIUR: Marginal Social Costs of Emissions in the United States. Available online at: https://barney.ce.cmu.edu/~jinhyok/easiur/.
Heo, J., Adams, P. J., and Gao, H. O. (2016). Public health costs of primary PM2.5 and inorganic PM2.5 precursor emissions in the United States. Environ. Sci. Technol. 50, 6061–6070. doi: 10.1021/acs.est.5b06125
Holmes, S. H., Phillips, T., and Wilson, A. (2016). Overheating and passive habitability: indoor health and heat indices. Build. Res. Inform. 44, 1–19. doi: 10.1080/09613218.2015.1033875
Hsieh, C.-M., Aramaki, T., and Hanaki, K. (2007). Estimation of heat rejection based on the air conditioner use time and its mitigation from buildings in Taipei City. Build. Environ. 42, 3125–3137. doi: 10.1016/j.buildenv.2006.07.029
International Code Council. (2018). International Energy Conservation Code (IECC). Washington, DC: International Code Council. Available online at: https://www.iccsafe.org/products-and-services/i-codes/2018-i-codes/iecc/ (accessed April 6, 2020).
International Energy Agency. Data and statistics: Explore energy data by category, indicator, country or region. International Energy Agency Available at: https://www.iea.org/data-and-statistics?country=USAandfuel=Energy%20supplyandindicator=Total%20primary%20energy%20supply%20(TPES)%20by%20source (accessed February 10, 2020).
Keller, R. C. (2013). Place matters: mortality, space, and urban form in the 2003 Paris heat wave disaster. French Historical Stud. 36, 299–330. doi: 10.1215/00161071-1960682
Kenny, G. P., Flouris, A. D., Yagouti, A., and Notley, S. R. (2018). Towards establishing evidence-based guidelines on maximum indoor temperatures during hot weather in temperate continental climates. Temperature 6, 11–36. doi: 10.1080/23328940.2018.1456257
Kikegawa, Y., Genchi, Y., Yoshikado, H., and Kondo, H. (2003). Development of a numerical simulation system toward comprehensive assessments of urban warming countermeasures including their impacts upon the urban buildings' energy-demands. Appl. Energy 76, 449–466. doi: 10.1016/S0306-2619(03)00009-6
Kim, Y.-M., Kim, S., Cheong, H.-K., Ahn, B., and Choi, K. (2012). Effects of heat wave on body temperature and blood pressure in the poor and elderly. Environ. Health Toxicol. 27:e2012013. doi: 10.5620/eht.2012.27.e2012013
Klepeis, N. E., Nelson, W. C., Ott, W. R., Robinson, J. P., Tsang, A. M., Switzer, P., et al. (2001). The national human activity pattern survey (NHAPS): a resource for assessing exposure to environmental pollutants. J. Exposure Sci. Environ. Epidemiol. 11, 231–252. doi: 10.1038/sj.jea.7500165
Krayenhoff, E. S., Moustaoui, M., Broadbent, A. M., Gupta, V., and Georgescu, M. (2018). Diurnal interaction between urban expansion, climate change and adaptation in US cities. Nat. Clim. Change 8, 1097–1103. doi: 10.1038/s41558-018-0320-9
Lelieveld, J., Evans, J. S., Fnais, M., Giannadaki, D., and Pozzer, A. (2015). The contribution of outdoor air pollution sources to premature mortality on a global scale. Nature 525, 367–371. doi: 10.1038/nature15371
MacNaughton, P., Cao, X., Buonocore, J., Cedeno Laurent, J. G., Spengler, J. D., Bernstein, A., et al. (2018). Energy savings, emission reductions, and health co-benefits of the green building movement. J. Exposure Sci. Environ. Epidemiol. 28, 307–318. doi: 10.1289/isesisee.2018.O04.02.04
Mayrhuber, E. A.-S., Dückers, M. L. A., Wallner, P., Arnberger, A., Allex, B., Wiesböck, L., et al. (2018). Vulnerability to heatwaves and implications for public health interventions – a scoping review. Environ. Res. 166, 42–54. doi: 10.1016/j.envres.2018.05.021
McKenzie, L. M., Witter, R. Z., Newman, L. S., and Adgate, J. L. (2012). Human health risk assessment of air emissions from development of unconventional natural gas resources. Sci. Total Environ. 424, 79–87. doi: 10.1016/j.scitotenv.2012.02.018
Meier, P., Holloway, T., Patz, J., Harkey, M., Ahl, D., Abel, D., et al. (2017). Impact of warmer weather on electricity sector emissions due to building energy use. Environ. Res. Lett. 12:064014. doi: 10.1088/1748-9326/aa6f64
Melillo, J. M., Richmond, T., and Yohe, G. W., (Eds). (2014). Climate Change Impacts in the United States: The Third National Climate Assessment. U.S. Global Change Research Program, 841 p. doi: 10.7930/J0Z31WJ2
National Weather Service. (2017). Weather Fatalities. Available online at: http://www.nws.noaa.gov/om/hazstats.shtml.
Naughton, M. (2002). Heat-related mortality during a 1999 heat wave in Chicago. Am. J. Prev. Med. 22, 221–227. doi: 10.1016/S0749-3797(02)00421-X
Obradovich, N., Migliorini, R., Mednick, S. C., and Fowler, J. H. (2017). Nighttime temperature and human sleep loss in a changing climate. Sci. Adv. 3:e1601555. doi: 10.1126/sciadv.1601555
O'Neill, M. S. (2005). Disparities by race in heat-related mortality in four US cities: the role of air conditioning prevalence. J. Urban Health. 82, 191–197. doi: 10.1093/jurban/jti043
Park, J. (2016a). Temperature, Test Scores, and Educational Attainment. Harvard University Economics Department Working Paper, 66.
Park, J. (2016b). “Will we adapt? temperature shocks, labor productivity, and adaptation to climate change in the United States (1986-2012),” in Harvard University Economics Department Working Paper (Cambridge, MA: Harvard University), 47. Available online at: https://www.belfercenter.org/sites/default/files/files/publication/dp81_jpark_hpca.pdf
Quinn, A., Tamerius, J. D., Perzanowski, M., Jacobson, J. S., Goldstein, I., Acosta, L., et al. (2014). Predicting indoor heat exposure risk during extreme heat events. Sci. Total Environ. 490, 686–693. doi: 10.1016/j.scitotenv.2014.05.039
Reidmiller, D. R., Avery, C. W., Easterling, D. R., Kunkel, K. E., Lewis, K. L. M., Maycock, T. K., et al. (2018). Fourth National Climate Assessment. Volume II: Impacts, Risks, and Adaptation in the United States, Report-in-Brief. Washington, DC: US Global Change Research Program Available online at: https://nca2018.globalchange.gov/ (accessed February 9, 2019).
Reinhart, C. F., and Cerezo Davila, C. (2016). Urban building energy modeling – a review of a nascent field. Build. Environ. 97, 196–202. doi: 10.1016/j.buildenv.2015.12.001
Roberts, D. (2012). National Residential Efficiency Measures Database Aimed at Reducing Risk for Residential Retrofit Industry (No. DOE/GO-102012-3229). NREL. Available online at: https://remdb.nrel.gov/.
Sailor, D. J., Baniassadi, A., O'Lenick, C. R., and Wilhelmi, O. V. (2019). The growing threat of heat disasters. Environ. Res. Lett. 14:054006. doi: 10.1088/1748-9326/ab0bb9
Salamanca, F., Georgescu, M., Mahalov, A., Moustaoui, M., and Wang, M. (2014). Anthropogenic heating of the urban environment due to air conditioning: anthropogenic heating due to AC. J. Geophys. Res. 119, 5949–5965. doi: 10.1002/2013JD021225
Samuelson, H., Baniassadi, A., Lin, A., Gonzalez, P. I., Brawley, T., and Narula, T. (2020). Housing as a critical determinant of heat vulnerability and health. Sci. Total Environ. 2020:137296. doi: 10.1016/j.scitotenv.2020.137296
Silvero, F., Lops, C., Montelpare, S., and Rodrigues, F. (2019a). Generation and assessment of local climatic data from numerical meteorological codes for calibration of building energy models. Energy Build. 188–189, 25–45. doi: 10.1016/j.enbuild.2019.02.001
Silvero, F., Lops, C., Montelpare, S., and Rodrigues, F. (2019b). Impact assessment of climate change on buildings in Paraguay—overheating risk under different future climate scenarios. Build. Simulat. 12, 943–960. doi: 10.1007/s12273-019-0532-6
Swan, L. G., and Ugursal, V. I. (2009). Modeling of end-use energy consumption in the residential sector: a review of modeling techniques. Renew. Sustain. Energy Rev. 13, 1819–1835. doi: 10.1016/j.rser.2008.09.033
Synnefa, A., Santamouris, M., and Akbari, H. (2007). Estimating the effect of using cool coatings on energy loads and thermal comfort in residential buildings in various climatic conditions. Energy Build. 39, 1167–1174. doi: 10.1016/j.enbuild.2007.01.004
Tartarini, F., Cooper, P., Fleming, R., and Batterham, M. (2017). Indoor air temperature and agitation of nursing home residents with dementia. Am. J. Alzheimers Dis. Other Dement. 32, 272–281. doi: 10.1177/1533317517704898
Taylor, J., Wilkinson, P., Davies, M., Armstrong, B., Chalabi, Z., Mavrogianni, A., et al. (2015). Mapping the effects of urban heat island, housing, and age on excess heat-related mortality in London. Urban Clim. 14, 517–528. doi: 10.1016/j.uclim.2015.08.001
Taylor, J., Wilkinson, P., Picetti, R., Symonds, P., Heaviside, C., Macintyre, H. L., et al. (2018). Comparison of built environment adaptations to heat exposure and mortality during hot weather, West Midlands region, UK. Environ. Int. 111, 287–294. doi: 10.1016/j.envint.2017.11.005
Troup, L., and Fannon, D. (2016). Morphing Climate Data to Simulate Building Energy Consumption. in (Salt Lake City, UT, USA: ASHRAE), 8. Available online at: https://ibpsa-usa.org/index.php/ibpusa/article/view/390/376 (accessed May 4, 2020).
Uejio, C. K., Tamerius, J. D., Vredenburg, J., Asaeda, G., Isaacs, D. A., Braun, J., et al. (2016). Summer indoor heat exposure and respiratory and cardiovascular distress calls in New York City, NY, U.S. Indoor Air 26, 594–604. doi: 10.1111/ina.12227
Urban, B., and Roth, K. (2010). Guidelines for Selecting Cool Roofs. Washington, DC: US Department of Energy. Available online at: https://www.energy.gov/sites/prod/files/2013/10/f3/coolroofguide.pdf
Ürge-Vorsatz, D., Cabeza, L. F., Serrano, S., Barreneche, C., and Petrichenko, K. (2015). Heating and cooling energy trends and drivers in buildings. Renew. Sustain. Energy Rev. 41, 85–98. doi: 10.1016/j.rser.2014.08.039
US Census Bureau. (2017). American Housing Survey (AHS). Washington, DC: US Census Bureau. Available online at: https://www.census.gov/programs-surveys/ahs.html (accessed March, 2, 2020).
US DOE. (2012). 2011 Buildings Energy Data Book. The Building Technologies Program of the U.S. Department of Energy. Available online at: http://web.archive.org/web/20130214212606/http://buildingsdatabook.eren.doe.gov/docs/DataBooks/2011_BEDB.pdf.
US DOE. (2019). Residential Prototype Building Models. Available online at: https://www.energycodes.gov/development/residential/iecc_models (accessed February 5, 2020).
US EIA. (2015). Residential Energy Consumption Survey (RECS): 2015 RECS Survey Data. Washington, DC: Energy Information Administration. Available online at: https://www.eia.gov/consumption/residential/data/2015/ (accessed March 2, 2020).
US EIA. (2016). Electric Power Monthly: Table 5.6.A. Average Price of Electricity to Ultimate Customers by End-Use Sector, by State, November 2019 and 2018 (Cents per Kilowatthour). Available online at: https://www.eia.gov/electricity/monthly/epm_table_grapher.php?t=epmt_5_6_a (accessed February 18, 2020).
US EIA. (2020). Natural Gas Prices: Dollars per Thousand Cubic Feet, Except Where Noted. Available online at: https://www.eia.gov/dnav/ng/ng_pri_sum_a_EPG0_PRS_DMcf_a.htm (accessed February 18, 2020).
US EPA. (2010). Technical Support Document: -Social Cost of Carbon for Regulatory Impact Analysis - Under Executive Order 12866 -. Interagency Working Group on Social Cost of Carbon, United States Government.
US EPA. (2016). The Social Cost of Carbon: Estimating the Benefits of Reducing Greenhouse Gas Emissions. Available online at: https://19january2017snapshot.epa.gov/climatechange/social-cost-carbon_.html.
US EPA. (2018). Emissions and Generation Resource Integrated Database (eGRID). US Environmental Protection Agency. Available online at: https://www.epa.gov/energy/emissions-generation-resource-integrated-database-egrid (accessed January 27, 2020).
US EPA. Welcome to WebFIRE. US Environmental Protection Agency. Available online at: https://cfpub.epa.gov/webfire/ (accessed January 27, 2020).
USGBC LEED rating system. US Green Building Council. Available online at: https://www.usgbc.org/leed
van Loenhout, J. A. F., le Grand, A., Duijm, F., Greven, F., Vink, N. M., Hoek, G., et al. (2016). The effect of high indoor temperatures on self-perceived health of elderly persons. Environ. Res. 146, 27–34. doi: 10.1016/j.envres.2015.12.012
Vodonos, A., Awad, Y. A., and Schwartz, J. (2018). The concentration-response between long-term PM2.5 exposure and mortality; a meta-regression approach. Environ. Res. 166, 677–689. doi: 10.1016/j.envres.2018.06.021
Wilhelmi, O., O'Lenick, C., Hayden, M., Sailor, D., and Baniassadi, A. (2020). Assessing Indoor Health Risks and Vulnerability of Older Adults to Extreme Heat and Ozone. in (Boston, MA). Available online at: https://ams.confex.com/ams/2020Annual/meetingapp.cgi/Paper/369785 (accessed January 14, 2020).
Williams, A. A., Spengler, J. D., Catalano, P., Allen, J. G., and Cedeno-Laurent, J. G. (2019). Building vulnerability in a changing climate: indoor temperature exposures and health outcomes in older adults living in public housing during an extreme heat event in Cambridge, MA. Int. J. Environ. Res. Public Health 16:2373. doi: 10.3390/ijerph16132373
Keywords: extreme heat, housing, heat resilience, energy savings, public health
Citation: Williams AA, Baniassadi A, Izaga Gonzalez P, Buonocore JJ, Cedeno-Laurent JG and Samuelson HW (2020) Health and Climate Benefits of Heat Adaptation Strategies in Single-Family Residential Buildings. Front. Sustain. Cities 2:561828. doi: 10.3389/frsc.2020.561828
Received: 13 May 2020; Accepted: 31 August 2020;
Published: 27 October 2020.
Edited by:
Melissa Scott, Duke University, United StatesReviewed by:
Terri-Ann Berry, Unitec Institute of Technology, New ZealandMaria Fernanda da Silva Rodrigues, University of Aveiro, Portugal
Copyright © 2020 Williams, Baniassadi, Izaga Gonzalez, Buonocore, Cedeno-Laurent and Samuelson. This is an open-access article distributed under the terms of the Creative Commons Attribution License (CC BY). The use, distribution or reproduction in other forums is permitted, provided the original author(s) and the copyright owner(s) are credited and that the original publication in this journal is cited, in accordance with accepted academic practice. No use, distribution or reproduction is permitted which does not comply with these terms.
*Correspondence: Augusta A. Williams, YXV3ODgyQG1haWwuaGFydmFyZC5lZHU=
 Augusta A. Williams
 Amir Baniassadi
 Pablo Izaga Gonzalez
 Jonathan J. Buonocore2
 Jose G. Cedeno-Laurent
 Holly W. Samuelson

