 Qing Zhao
 Chi Zhang
94% of researchers rate our articles as excellent or good
Learn more about the work of our research integrity team to safeguard the quality of each article we publish.
Find out more
ORIGINAL RESEARCH article
Front. Sustain. Cities , 18 September 2020
Sec. Urban Greening
Volume 2 - 2020 | https://doi.org/10.3389/frsc.2020.00044
This article is part of the Research Topic Integrated Solutions for Urban Greening View all 4 articles
Urban forest plays a crucial role in coping with global change and rapid urbanization via providing various ecosystem services. In this context, cities in Guangdong-Hongkong-Macao Greater Bay Area of China (GBA) established increasing investment in urban forest construction since 2000. However, data on the current condition of the planted forests remains scarce, which hampers a comprehensive understanding of how to improve the quality of urban forest planning and construction in the future. Therefore, we selected a core city Guangzhou, an inland city Foshan and a coastal city Zhuhai in GBA as our research objects and classified them into core urban area (CUA), semi urban area (SUA), and urban fringe area (UFA). We launched a field measurement for the tree variables regarding forest structure. Besides, ecological indexes were introduced to evaluate the condition and potential of the forests and florescence data together with tridimensional green quantity data provided different perspectives on landscape diversity and stability. The results show that Guangzhou has a well-planned forest pattern with advantages in forest structures and visible landscape values in different areas. To introduce different tree species in CUA and SUA and to plant more trees of those rare tree species in UFA can effectively increase Guangzhou's forest diversity and evenness. For Foshan, it is advisable to implement a balanced forest-investment policy by making specific recommendations for different areas, such as planting various tree species in CUA and UFA to increase forest diversity. For Zhuhai, it is distinguished for the attractiveness for tourists by the advantages in landscape diversity and stability, but it is still necessary to plant different trees with appropriate classes to enhance the urban forest stability. Overall, it is crucial for city managers to obtain precise knowledge of urban forest conditions from both the ecological and landscape perspectives, which may contribute enormously to the improvement of the quality of urban forest planning and construction in adapting to various environmental challenges.
Humanity nowadays is experiencing a dramatic shift to urban living and the percentage of urban dwellers is estimated to exceed 60% by the year 2030 (Grimm et al., 2008; Seto et al., 2011). Accompanying the rapid urbanization, global change including elevated CO2, increased temperature, and land-use change is projected to have increasingly detrimental impacts on cities (Alberti, 2005; IPCCCC, 2007; Parnell et al., 2007). In this context, urban forests were considered to play a crucial role in coping with various environmental challenges, such as improving air quality, fixing carbon, mitigating environmental degradation, and providing other ecosystem services (Alonzo et al., 2016; Steenberg et al., 2017), which had been widely researched (Dobbs et al., 2011; Escobedo et al., 2011). For example, Nowak et al. (2013) quantified the carbon sequestration of urban forests in USA to assess their magnitude and role concerning climate change and Xu et al. (2020) investigated the ecosystem services changes of urban forests caused by urban expansion in Shenzhen and Hong Kong, China. At urban-tree scale, Rahman et al. (2015) compared and quantified the growth and cooling effectiveness of five common urban tree species in Germany and Zhang et al. (2019) studied how the frequently-planted tree species in Munich coped with drought stress in terms of below-ground process. To sum up, how urban communities benefited from the various ecosystem services provided by urban forests and trees were widely studied in both temporal and spatial scales all over the world (Young, 2010; Dobbs et al., 2014; Livesley et al., 2016).
There is an increasing demand for urban forests, however, how to improve the quality of urban forest planning and construction from both ecological and landscape perspectives remains to be investigated. Currently, most cities emphasized the forest cover rate that the priority was given to the plantation of adequate trees, ignoring whether the constructed urban forests adapted to the local environment and could develop ecologically, sustainably, and aesthetically (Jensen et al., 2004; Carreiro et al., 2007). In this light, Jim and Liu (2000) pointed out that urban forest construction should fully take locations, sizes, and features of cities into consideration to avoid the inadaptability of urban trees. Liu B. et al. (2006) suggested that different regions within the same city might affect the development of urban forests. Furthermore, lacking quantitative information on the structures of urban forests might lead to a knowledge gap regarding their growth patterns and community development (Zhu et al., 2001). Besides, introducing different ecological indexes could efficiently promote a better evaluation of the quality of urban forests, such as diversity indexes assessing the forest potential, evenness indexes assessing the forest stability, and landscape indexes assessing the visible benefits (Chen et al., 2007; Dumas et al., 2008). Overall, to improve the quality of urban forest planning and construction should involve a comprehensive analysis of the city feature, region classification, and forest structure, together with which the introduction of ecological and landscape indexes could also enhance our understanding of them.
With an area over 56,000 km2 and a population of over 70 million, the Guangdong-Hongkong-Macao Greater Bay Area of China (GBA) is one of the most economical and populous regions around the world (Chen et al., 2010). In the context of rapid urban expansion and global change, GBA is under the increasing pressure of severe environmental challenges and it is essential to take action to ameliorate the adverse effects. Therefore, cities in GBA started to plant a wide variety of trees in the urban area since 2000, aiming to raise the forest cover rates and to improve the urban environmental quality (Zhang et al., 2020). Although most of them have become “national forest cities” with advantages in forest cover rate, whether the constructed urban forests stayed healthy and could develop sustainably were scarcely investigated (Zhang et al., 2018). This might lead to a knowledge gap regarding the urban ecosystem and prevent us from thoroughly understanding the ecosystem services supplied by urban forests. Therefore, a field investigation together with analysis from the ecological and landscape perspectives would be conducive to improving the quality of urban forest planning and construction in the future (Konijnendijk, 2003).
In this light, we selected three different but representative cities in GBA as our objects and classified each city into separate areas for further analysis, i.e., core urban area, semi urban area, and urban fringe area. In these areas, a sampling survey combined with a field measurement campaign regarding tree variables was conducted to analyze the urban forest structure. Moreover, the class distribution of DBH (diameter at breast height), tree height, and crown area was studied to assess the forest stability, potential and probable developing patterns. Besides, four indexes were introduced to evaluate ecological and landscape values. Hence, the research questions are addressed: (1) Do urban forests have specific features in different areas within the same city? (2) How can the three cities improve their urban forest planning and construction more ecologically? (3) How to increase landscape values in terms of visible landscape diversity and stability?
With the urbanization ratio of 86.5, 95.0, and 90.1%, Guangzhou, Foshan, and Zhuhai are three representative cities in GBA1, regarded as a core city, a landlocked city and a coastal city, respectively, which were selected for our research (Figure 1). To obtain the particular information of urban forests in different areas of the three selected cities, we classified their urban areas into three types, i.e., core urban area (CUA), semi urban area (SUA), and urban fringe area (UFA). In this research, the classifications were conducted on the basis of the specific data on the distances of the objective areas to the city center from the local government website. In each area of the three cities, 100 sample plots with the size of 30 × 30 m were established randomly, after which those plots mainly containing urban forests were retained and investigated while the other plots were eliminated, e.g., plots mainly containing buildings, roads or lakes (Table 1).
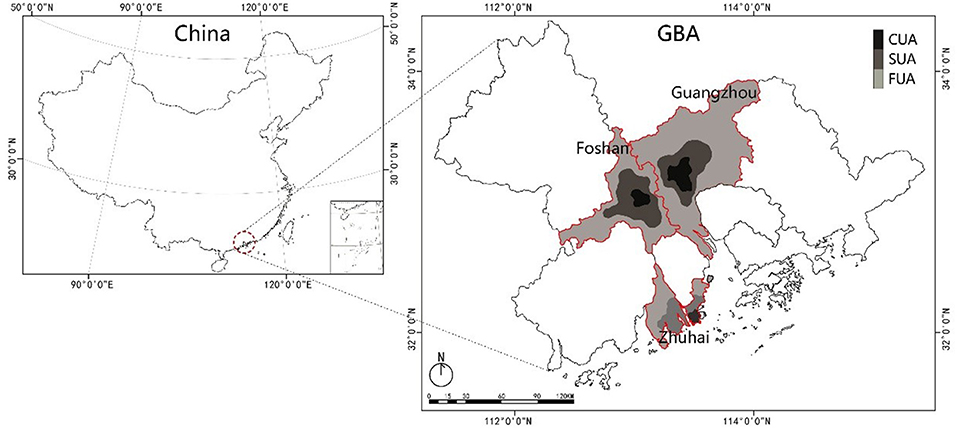
Figure 1. Schematic of the locations of the three surveyed cities - Guangzhou, Foshan, and Zhuhai in Guangdong-Hongkong-Macau Greater Bay Area (GBA), China. The areas with the colors dark gray, medium gray and light gray in each city represent core urban area (CUA), semi urban area (SUA) and urban fringe area (UFA), respectively.

Table 1. City area (km2) and population (million) of Guangzhou, Foshan, and Zhuhai, respectively.
In all the sample plots containing urban forests, a field measurement campaign for the forest structure was launched from May to June in 2019, which involved the measurement of DBH (diameter at breast height), tree height, crown height, crown diameter, and clear-bole height, which was based on classic ecological theories (O'Brien et al., 1995). In each plot, identification of tree species and confirmation of the number of trees was firstly carried out. Then for each tree, DBH was measured with the help of a diameter tape and tree height as well as crown height was measured using a clinometer (Haglof Vertex IV, Sweden). In terms of the crown area, we projected the edges of the crown vertically to the ground using a plumb bob and then the lengths in N-S and W-E horizontal levels were recorded and averaged as the crown radius. The square of the crown radius multiplied by π was set as the crown area. Moreover, a tape was held in the same horizontal level as the lowest branch, and the vertical distance between the tape and ground was set as the clear-bole height. To reduce random errors, every measurement was conducted three times and mean values were used for further analysis.
The class classifications regarding DBH, height, and crown area were conducted for all the surveyed trees. Based on previous findings of Moss (2012) and Liao et al. (2017), tree structure classification should have an appropriate number of classes and be objective and quantitative. Thus, combined with prior knowledge, the classification in our research showed a “small then big” trend to make the number of classes not very large or small, avoiding over little or huge differences between different classes that might prevent difficulties in further analysis. In this way, eight classes with varying class levels were applied for further analysis concerning DBH, height, and crown area (Table 2). For instance in DBH classification, 10-cm scale was set for class 1 to class 4 (0–10, 10–20, 20–30 and 30–40 cm) and 20-cm scale was for class 5 to class 7 (40–60, 60–80, and 80–100 cm). Those over 100 cm were set as class 8.
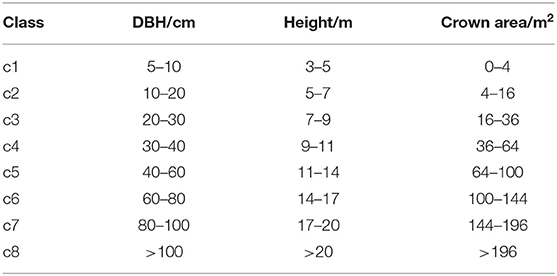
Table 2. Specific class classifications for DBH, height, and crown area in this study.
In this research, four ecological indexes were applied to assess the ecological diversity and evenness of all the samples, i.e., three diversity indexes including richness index (RI), Shannon-Wiener index (SWI) and Simpson index (SI) and one evenness index (EI). Based on the classical theories in ecology from previous studies (Lande, 1996; Keylock, 2005; Gotelli and Colwell, 2011), the four indexes in each sample plot were calculated as follows:
with
where S was the total number of the tree species and Ni was the abundance of the i-th tree species in each sample plot.
In this research, the florescence of all the tree species was investigated and applied to evaluate the visible landscape diversity in each area. To be detailed, those tree species having a blossom were recorded with their colors and blooming months. Then the percentages of the numbers of the blooming trees in each area were calculated in order to produce the regional monthly florescence statistics for the three cities.
On the purpose of the estimation of the visible landscape stability in each area, the total vegetation crown volumes of evergreen trees which could provide “sustainable noticeable green” became the focus. The concept “tridimensional green quantity” (TGQ) was therefore introduced to analyze how much visible green could be supplied by trees, mainly being related to the volumes of crown, branch, and foliage. Based on previous researches, TGQ was firstly determined by tree shape and then calculated by inputting the data of crown diameters and heights into empirical regression models that had been validated (Chang and Zhaogang, 2011; Li and Jin, 2012). In our research, the tree shapes followed mainly six types, i.e., oval-crown type, cone-crown type, spherical-crown type, spherical-fan- crown type, spherical-cap-crown type, and cylindrical-crown type. Their calculations of TGQ were as follows:
where a was the average crown diameter and b was the crown height of each tree.
The software package R (Version 3.4.4) was used for statistical analysis. To investigate the difference between means, two-sampled t-test and analysis of variance (ANOVA) with Tukey's HSD test were used. In all the cases, statistical significance was detected at p < 0.05. Where necessary, data were log or power transformed in order to correct for data displaying heteroscedasticity.
Those plots containing urban forests were investigated for tree species composition and tree numbers firstly, and the relative density bar graph for CUA, SUA, and UFA in the three cities was displayed as Figure 2. For the density of tree species, little difference was found between the three areas for both Guangzhou and Zhuhai, while UFA in Foshan had higher density (32.2/ha) than its CUA (16.7/ha) and SUA (15.6/ha). Regarding the density of tree numbers in each area, the three cities exhibited different patterns for their three areas. It geographically increased from the city center to the urban fringe area in Guangzhou (CUA: 121.0/ha; SUA: 198.7/ha; UFA: 288.3/ha) but showed high similarity in Foshan's three areas (CUA: 251.7/ha; SUA: 267.2/ha; UFA: 226.7/ha). Among all the areas of the three cities, UFA in Zhuhai was observed to have the highest tree plantation density that reached at 471.8/ha.
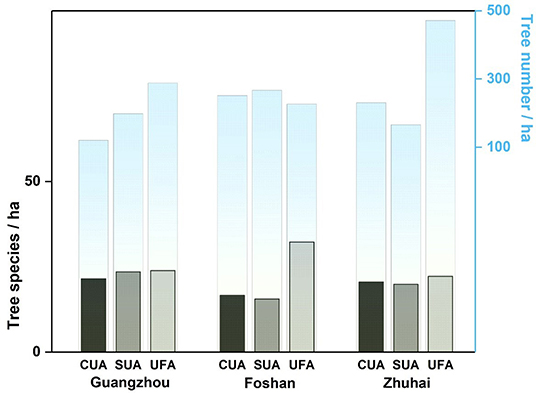
Figure 2. The density of tree species (/ha) and density of tree numbers (/ha) in CUA, SUA, and UFA of the three cities, respectively. The bars in dark gray, medium gray, and light gray are the densities of tree species that follow the left black y-axis while the light blue bars representing the density of tree numbers match the right blue y-axis.
Table 3 gave the mean values of tree variables including DBH, height, clear-bole height, crown area, and crown height in CUA, SUA, and UFA of the three cities. For most cases, the three areas in each city exhibited significant differences (P < 0.05) which indicated varying tree profiles in different spatial distributions.
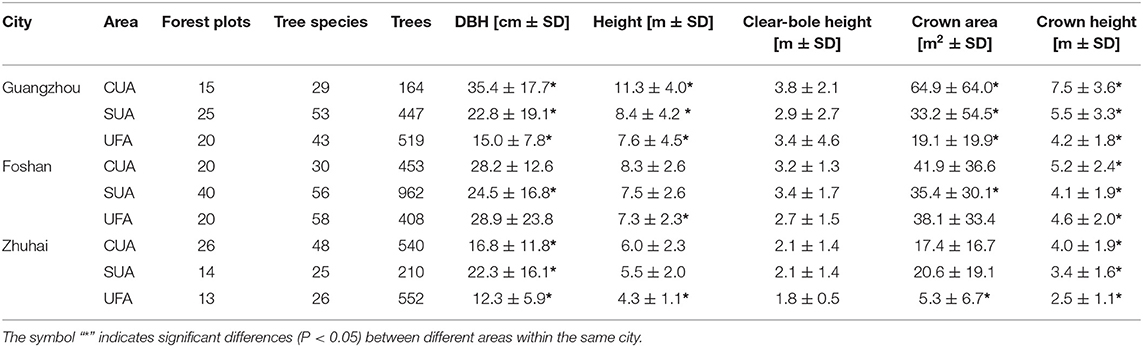
Table 3. The characteristics of the surveyed trees in CUA, SUA and UFA of Guangzhou, Foshan, and Zhuhai, including numbers of forest plots, numbers of tree species, numbers of trees, DBH (cm ± SD), height (m ± SD), clear-bole height (m ± SD), crown area (m2 ± SD) and crown height (m ± SD).
In Guangzhou, except for the clear-bole height, the other four tree variables showed an apparent decreasing trend in the sequence of CUA, SUA, and UFA (P < 0.05). Compared to SUA and UFA, CUA had fewer forest plots, tree species, and trees but significantly larger tree sizes in terms of DBH (35.4 ± 17.7 cm), height (11.3 ± 4.0 m) and crown profile (crown area: 64.9 ± 64.0 m2; crown height: 7.5 ± 3.6 m). Moreover, trees in the city center had higher values of clear-bole heights (CUA: 3.8 ± 2.1 m; SUA: 2.9 ± 2.7 m; UFA: 3.4 ± 4.6 m) although no significant difference was found between the three areas.
With a higher number of forests plots, SUA in Foshan revealed lower DBH, crown area, and crown height than CUA and UFA (P < 0.05). With the largest DBH (28.9 ± 23.8 m) but least height (7.3 ± 2.3 m), UFA in Foshan had medium crown size (crown area: 38.1 ± 33.4; crown height: 4.6 ± 2.0) and clear-bole height (2.7 ± 1.5 m). Among the three areas, the least number of tree species was observed in CUA which displayed the greatest crown area (41.9 ± 36.6 m2), crown height (5.2 ± 2.4 m), and height (8.3 ± 2.6 m).
For Zhuhai, trees in UFA displayed the smallest sizes among the three areas regarding all the measured variables, especially for the crown area (5.3 ± 6.7 m2) which was way less than that of CUA (17.4 ± 16.7 m2) and SUA (20.6 ± 19.1 m2). With same clear-bole height, SUA had advantages in DBH (22.3 ± 16.1 m) and crown area (20.6 ± 19.1 m2) while CUA showed higher values in terms of tree height (6.0 ± 2.3 m) and crown height (4.0 ± 1.9 m).
The percentages of different classes of DBH, height, and crown were shown in Figure 3, which was in the form of cities in the horizontal level and areas in the vertical level. As it showed, there mainly existed four types of distribution, i.e., normal distribution, approximate normal distribution, reverse-J-shaped distribution, and random distribution.
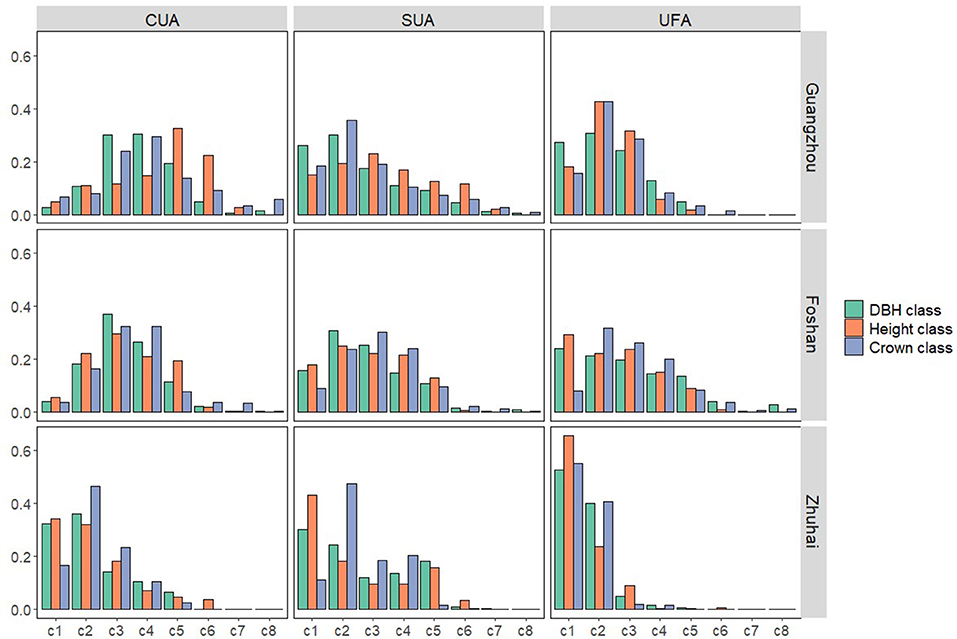
Figure 3. Distributions of the classes of DBH (green bars), height (orange bars), and crown (cyan bars) of CUA, SUA, and UFA in each city. The classified classes from c1 to c8 are on the x-axis and the numbers on the y-axis represent the percentages of the classes.
Normal distribution was a symmetric distribution where most of the observations clustered around the central peak and the probabilities for values furthered away from the mean taper off equally in both directions. In our research, the DBH, height, and crown classes in CUA of Guangzhou and Foshan conformed to this distribution. For example, DBH classes of CUA in Foshan distributed normally that the proportions from c1 to c8 were 3.9, 18.2, 37.0, 26.6, 11.5, 2.2, 0.2, and 0.4%, respectively.
Compared to the normal distribution, approximate normal distribution had a similar latter pattern but higher values for former classes, e.g., DBH and height classes of SUA and UFA in Guangzhou, crown classes in Foshan's UFA and Zhuhai's CUA, etc. Taking DBH classes of SUA in Guangzhou as an instance, c1 was 26.22%, and c2 reached the peak of 30.2%, after which a declining trend was found from c3 to c8.
Reverse-J-shaped distribution was detected for DBH and height classes in the UFA of Foshan and height classes in the CUA of Zhuhai. They had the highest percentage in c1 and the proportions decreased with the increase in classes, showing a steady declining trend.
The DBH, height and crown classes in SUA and UFA of Zhuhai exhibited a random distribution that different classes had various proportions, from which it was difficult to draw any conclusions to describe the trend, e.g., crown classes of SUA in Zhuhai, percentages from c1 to c8 were 11.3, 47.4, 18.7, 20.4, 1.7, 0.4, 0, and 0%, respectively.
The estimations of ecological diversity and evenness as well as significant difference analysis were summarized in Table 4.
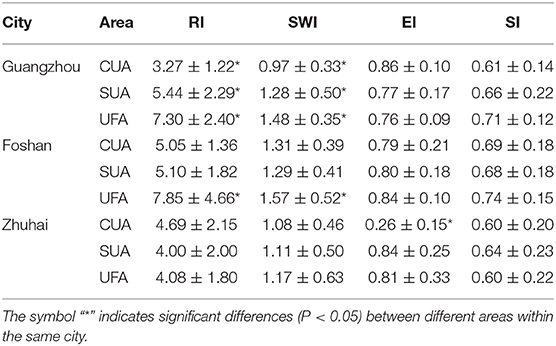
Table 4. Values of ecological diversity and evenness indexes with standard deviations of CUA, SUA, and UFA in Guangzhou, Foshan, and Zhuhai, including richness index (RI), Shannon-Wiener index (SWI), evenness index (EI), and Simpson index (SI).
For Guangzhou, distinct regional features were observed that values of RI, SWI, and SI were increasing following the sequence of CUA, SUA, and UFA, indicating the highest diversity of trees species in UFA. With the opposite trend as diversity indexes, the highest value of EI was found in CUA (CUA: 0.86 ± 0.10; SUA: 0.77 ± 0.17; UFA: 0.76 ± 0.09), which revealed little difference of tree numbers between different tree species in this area.
UFA of Foshan not only exhibited the highest diversity (RI: 7.85 ± 4.66, SWI: 1.57 ± 0.52; SI: 0.74 ± 0.15) but also an excellent performance in evenness of tree species with EI reaching 0.84 ± 0.10. Unlike Guangzhou, slight difference between CUA and SUA in Foshan was observed regarding all the four indexes, showing a remarkably similar pattern of the composition and distributions of tree species.
Different from the regional patterns of Guangzhou and Foshan, the three areas in Zhuhai varied slightly and showed no significant differences in terms of RI, SWI, and SI. The only exception was found for EI of CUA (0.26 ± 0.15), which was significantly lower than that of SUA (0.84 ± 0.25) and UFA (0.81 ± 0.33).
Figure 4 gave the monthly percentages of those blossomed trees together with their colors in CUA, SUA, and UFA of the three cities. With the average monthly percentage of 11.2% of the nine areas, various florescence with multifarious colors led to a tremendous distinction between different areas and cities.
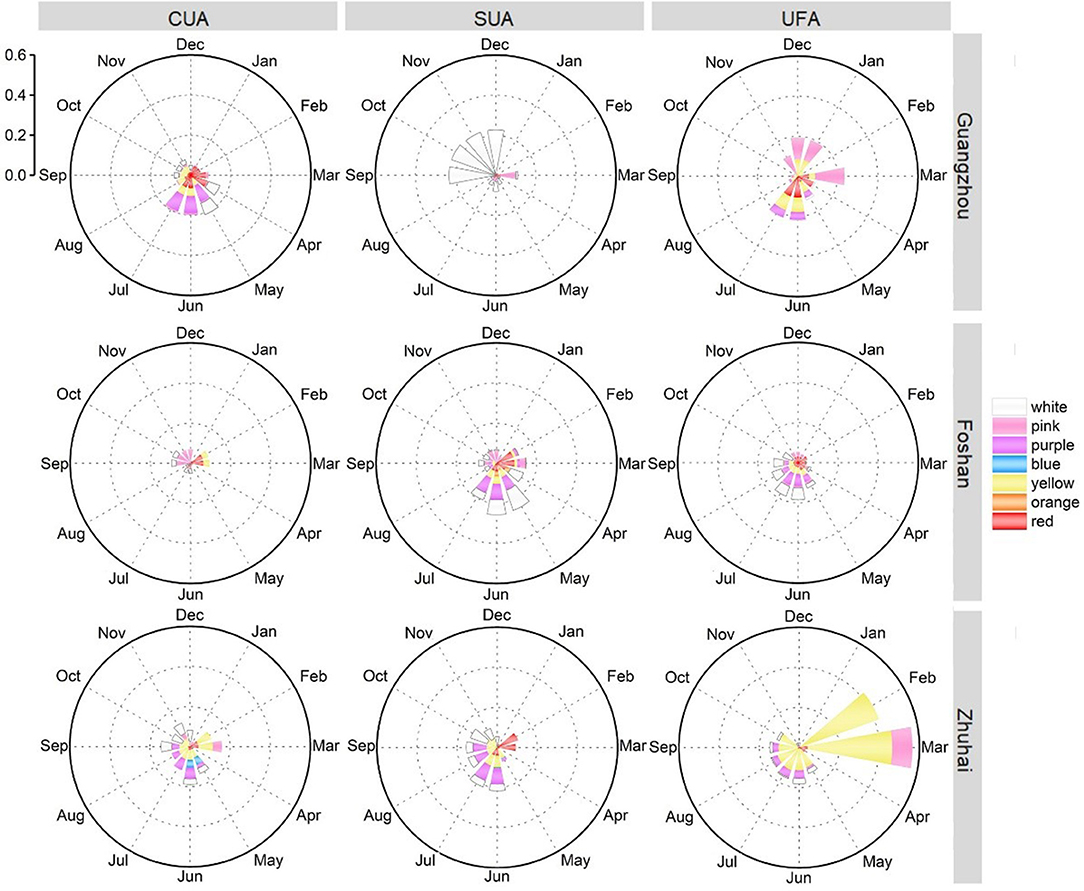
Figure 4. Monthly statistics of the percentages of blossomed trees in CUA, SUA, and UFA of Guangzhou, Foshan, and Zhuhai. In each plot, the outer circle-axis represents 12 months in 1 year, and sectorial bars are the proportions of blossomed trees with their flowers' colors.
For Guangzhou, CUA mainly had more trees in blossom in April (15.4%), May (20.9%), June (19.8%), and July (19.8%) with the primary colors in red, yellow, purple and white. UFA was observed to have a higher florescence ratio with mean proportion at 12.7% and 6 months' percentages over 10%. Compared to CUA and UFA, SUA had a lower amount of trees in blossom (mean: 10.7%) that only white flowers bloomed from September to December.
In Foshan, the mean florescence ratios of CUA, SUA, and UFA were 5.5, 12.62, and 9.62%, respectively, of which SUA appeared to have a continuous florescence period throughout the whole year. In addition, six colors of blossomed trees in SUA could be sighted, indicating an adequate supply of multicolored diversity. Although UFA did not reach the average level as SUA, it still had a relatively high blossomed period from May to September (mean: 15.12%) rather than CUA, which showed significant disadvantages within the whole year.
Among the three cities, Zhuhai took the advantaged predominance in providing steady landscape diversity that trees in blossom could be sighted in most of the months (CUA: 11.0%; SUA: 11.1%; UFA: 16.5%). Besides, the blue blossom was merely observed in CUA of Zhuhai, contributing to a multicolored scene in May and June. Although only four colors could be seen in UFA (yellow, purple, pink, and white), the proportion of blossomed trees in February and March reached 42.2 and 56.5%, showing an enormous advantage in providing visible landscape comfort.
To assess the visible landscape stability in each area of the three surveyed cities, TGQ (tridimensional green quantity) and its densities were given in Figure 5.
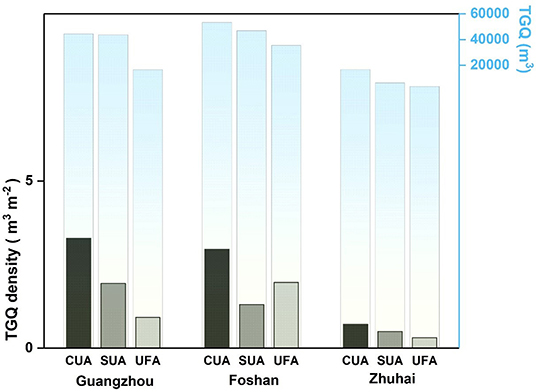
Figure 5. The density of TGQ (m3 m−2) and the sum of TGQ (m3) in CUA, SUA, and UFA of the three cities, respectively. The bars in dark gray, medium gray, and light gray are the densities of TGQ that follow the left black y-axis while the light blue bars representing the overall TGQ match the right blue y-axis.
In Guangzhou, CUA had the highest density of TGQ (3.3 m3 m−2), followed by SUA (1.9 m3 m−2), and UFA displayed the lowest one (0.9 m3 m−2). For the sum of regional TGQ, little difference was found between CUA (44403.2 m3) and SUA (43586.3 m3) while UFA reached the lowest level at 16547.0 m3.
With values of 53260.6 m3, 46901.6 m3, and 35461.9 m3, CUA, SUA, and UFA in Foshan revealed the greatest regional TGQ in comparison to the same areas of Guangzhou and Zhuhai. Concerning the TGQ density, SUA of Foshan exhibited an unmatched value (1.3 m3 m−2) with its sum of TGQ, indicating a disadvantage compared to CUA (3.0 m3 m−2) and UFA (2.0 m3 m−2).
It was apparent that the three areas in Zhuhai exhibited the weakest ability to provide visible landscape stability among the three cities, especially for the TGQ densities with the values of 0.7, 0.5, and 0.3 m3 m−2 in CUA, SUA, and UFA respectively, which were way lower than those in Guangzhou and Foshan.
Although to fulfill the standard of a national forest city in China became the unanimous target for the cities in GBA, they might face different challenges and launch specific strategies according to their respective features (Chen, 2008). Therefore, to assess the quality of urban forest planning and construction and to make appropriate recommendations should not ignore the actual situations of the cities, including their geographic locations, economic environment, and development orientation, etc.
With time-honored history, a large population, and strong economy, Guangzhou was the first city in GBA that was granted as a national forest city in 2008 (Hou et al., 2008). Sufficient resource was invested on its urban forests and evenly allocated in different areas under a steady policy (Dan and Xu, 2008), which most likely led to a stable and similar pattern of the urban forest planning and construction for CUA, SUA, and UFA. Under this background, the difference of urban forest structure among the three areas might be mainly relative to timing progress instead of other artificial or natural disturbances.
Foshan, an inland city in GBA, was famous for its rapidly developing economy, which relied mainly on the manufacturing industry (Lu et al., 2005). As CUA with restricted areas might face both economic and environmental stress, Foshan was transferring part of the industry to SUA and especially UFA (Zhang et al., 2020). Taking into account this phenomenon and becoming a national forest city in 2018 (Zhang et al., 2020), it could be confirmed that Foshan had an increasing demand for forest construction as urban forests were highly expected to provide various ecosystem services such as reducing noise, purifying air quality, and improving environmental quality.
Adjacent to the South China Sea, Zhuhai was distinguished for its appealing beach scenery and acted as a tourism city (Hsu and Gu, 2010). Therefore, urban forest construction was paid great attention to by the local government to enhance Zhuhai's attractiveness to domestic and abroad visitors. However, due to its particular location, typhoon damage was the primary natural disturbance and forests in Zhuhai frequently suffered from them, which virtually increased the difficulty in local forest planning and construction (Huang et al., 2018).
Information on urban forest structure was imperative to accurately assess the magnitude of the benefits of urban forests (Nowak et al., 2008). To optimize the benefits, detailed forest structural data including classes of DBH, height, and crown provided the basis to estimate the current health and condition of forest communities (Da Silva et al., 2002), which could also be used to predict regional forest dynamics as well as the land use changes (Lea et al., 1979; Day, 1985).
In Guangzhou, the three classes of DBH, height, and crown from CUA, SUA, and UFA followed the normal distribution and approximate normal distribution. This was thought to be the most stable distribution for forests that the medium classes had the gigantic proportions which could maintain the stability of the forest community, and simultaneously the moderate numbers of small and large classes ensured the succession of the new to the old to some extent (Yang et al., 2010). This suggested that the urban forests in the three areas of Guangzhou were well-planned and managed, and could be expected to have a prosperous growing pattern in the future.
The class distribution of DBH, height, and crown in CUA and SUA of Foshan exhibited a similar pattern as Guangzhou, indicating a desirable forest condition. The only exception was that the crown class in UFA had a reverse-J-shape distribution, which was considered a vigorous but unstable growing pattern (Westphal et al., 2006). This was because the small classes had the highest percentages which resulted in a prosperous growth of the whole forest community, but simultaneously uncertainties increased that they might be more easily disturbed than those large classes (Sempos et al., 2013). Therefore, to plant a moderate number of trees with a medium crown area could help to increase the stability of forest crown structure in UFA of Foshan.
In Zhuhai, except for CUA, the classes of DBH, height, and crown in SUA and UFA conformed to random distribution, indicating an unstable condition of their forest community. This resulted mainly from the severe damage and destruction from the Typhoon Hato in 2017 (Takagi et al., 2018; Xie et al., 2018), and after which, an urgent replantation of urban forests and trees were conducted that completely disturbed the original forest patterns. With regard to the classes of DBH, height, and crown, it was essential to replant plenty of trees with medium classes with strong typhoon resistance to enhance the forest community stability.
Ecological indexes regarding species diversity and evenness combined with the data on tree dimensional variables could help to analyze the potential of forest community from ecological perspectives, based on which specific recommendations could be put forwarded to enhance the ecosystem services (Risser and Rice, 1971; Routledge, 1979; Keylock, 2005). Each city presented significantly different spatial patterns among CUA, SUA, and UFA, implying distinct regional ecological features.
With comparable tree species densities of the three areas, Guangzhou showed a stepwise increased diversity and decreased evenness in the sequence of CUA, SUA, and UFA. Under the background of its strict and gradual urban expansion instead of random sprawl, this phenomenon resulted likely from a regular and nature-based urban forest planning and construction (Yu and Ng, 2007), showing relatively balanced regional forest features. On one hand, the limited space in the city center resulted in the fewest trees in CUA while UFA with larger areas could accommodate way more trees. On the other hand, massive plantation with introducing various tree species in UFA since 2000 contributed potently to the increase of diversity (Jim and Liu, 2001). Therefore, it was advisable to consider planting different tree species in CUA and SUA to increase the diversity and transplant more trees of those infrequent tree species in UFA to enhance the evenness, which could effectively improve the forest sustainability from the ecological perspective (Beisel et al., 2003).
With relatively similar tree sizes, little difference was found between CUA and SUA of Foshan city in terms of diversity and evenness. However, UFA showed the highest diversity and tree species density, implying a recent focus on this area. Furthermore, as CUA and SUA were already occupied with various enterprises, it was necessary to transfer part of the industry to UFA and together with which, the forest construction obtained enhanced investment (Zhang et al., 2020). Hence, to introduce different tree species in CUA and SUA could increase their diversity to optimize the ecosystem services and achieve balanced development between the three areas.
As mentioned above, Zhuhai suffered from typhoon damage frequently, and most of its urban forest was newly constructed after the Typhoon Hato in 2017. This could explain why the diversity and evenness indexes were almost same between the three areas, except for a shallow evenness index in CUA. As CUA was generally the most important, it might receive the priority of urgent forest remediation with more trees than common conditions and therefore the evenness of forests was reduced. Consequently, to increase forest diversity could be an effective strategy for Zhuhai. On one hand, high-diversity forests would stabilize the forest condition which was conducive to the resistance against natural disturbance such as typhoons (Nicoll and Ray, 1996); on the other hand, a variety of tree species might raise the city attractiveness.
The data on florescence and TGQ of urban forests could help to evaluate the landscape values (Liu C. et al., 2006; Wang et al., 2013; Kratschmer et al., 2019). In this research, the percentages of the trees in blossom were calculated to assess the visible landscape diversity and the TGQ was set as the landscape stability which could be continuously sighted. Within each city, the three areas exihibited different patterns of landscape diversity and stability.
In Guangzhou, UFA had advantages in florescence rate but disadvantages in TGQ, while CUA and SUA showed opposite patterns that they had higher TGQ but lower florescence rate within 1 year. As Guangzhou was the core city in GBA with the population over 15 million, the traffic in CUA was generally exposed to high pressure. In this light, the low visible landscape diversity in CUA might be encouraged to alleviate visiting stress while the high TGQ was welcomed to provide stable visual comfort. Nevertheless, SUA and UFA were recommended to increase the landscape diversity by introducing various trees with blossom to attract more citizens and visitors.
For Foshan, such an industrial city, equivalent investment among the three areas might comprehensively improve the environmental quality rather than cause regional disequilibrium. Therefore, specific strategies for different areas would be feasible based on the data on their florescence rates and TGQ. In terms of the visible landscape diversity, Foshan exhibited a balanced pattern between the three areas, except for CUA in summer, so it was advisable to introduce urban trees with their blossom from May to August in this area. For visible landscape stability, although no significant difference was detected between the three areas, SUA showing low TGQ density was suggested to obtain increasing attention that planting trees with luxuriant structure would be particularly practical.
With high values of florescence rate, Zhuhai was distinguished for its tourism attractiveness by providing a favorable urban environment in terms of landscape diversity. Besides, a variety of colors of blossomed trees were observed within the whole year and the florescence rate in UFA reached over 40% in February and March, proving its distinct landscape appealing. However, TGQ in the three areas in Zhuhai was relatively low which indicated weak landscape stability. Therefore, the priority of the improvement of the landscape quality should be given to planting trees with luxuriant structures, which could increase the visible landscape stability in order to promote the urban environment aesthetically.
To improve the quality of urban forest planning and construction should take the city features and regional characteristics into account. Furthermore, information on the class distribution of DBH, height, and crown combined with ecological indexes could provide a clear overview of the current condition of the surveyed forest communities. Besides, assessment of the florescence rate and TGQ could contribute to a better understanding of the visible landscape diversity and stability.
As a core city in GBA, Guangzhou had a well-planned forest pattern with advantages in class distribution of DBH, height, and crown. Moreover, the visible landscape diversity and stability in CUA, SUA, and UFA were appropriate concerning the regional features. Planting different tree species in CUA and SUA to increase the diversity and planting more trees of those infrequent tree species in UFA to enhance the evenness could effectively improve the forest sustainability from the ecological perspective.
Under the probable transferring industry away from the urban core area, Foshan tended to increase the forest investment in UFA rather than CUA and UFA. Thus, it was advisable to implement a balanced policy of urban forest planning and construction from ecological and landscape perspective, such as planting different tree species in CUA and UFA to increase the regional forest diversity.
For Zhuhai, on one hand, the urban forests were frequently disturbed by typhoons which showed random distribution in the class distribution of DBH, height, and crown; on the other hand, it was distinguished for attractiveness for tourists by the advantages in visible landscape diversity and stability. Therefore, to improve the quality of its urban forest could be more conducted from ecological perspectives, such as introducing various tree species with appropriate classes to enhance the urban forest stability.
Overall, to improve the quality of urban forest planning and construction will promote enormously to a better city environment coping with global change and rapid urbanization, which should be based on comprehensive research containing information from ecological and landscape perspective. For other cities, we recommend that an urban-area classification can be conducted on the basis of geographical, economic or combined information to explore regional features of urban forests. Cities's characteristics are essential for making futural policies such as enhancing landscape values for attracting tourists, focusing on the plantation of forests with dense crown to purify air condition, or increasing the tree species numbers for community diversity, etc. Besides, further work can be established on the relationship between the urban forest and the urban citizens, which may provide another social perspective.
The raw data supporting the conclusions of this article will be made available by the authors, without undue reservation.
QZ: conception and design. CZ and QZ: manuscript's original writing. DX and RH: data collection. HT: project administration. WQ and XC: visualization. All authors contributed to the article and approved the submitted version.
This study was supported by the Forestry Science and Technology Innovational Specific Project of Guangdong Province (Grant Nos. 2019KJCX009 and 2017KJCX034).
The authors declare that the research was conducted in the absence of any commercial or financial relationships that could be construed as a potential conflict of interest.
1. ^www.cnbayarea.org.cn, 2020.
Alberti, M. (2005). The effects of urban patterns on ecosystem function. Int. Reg. Sci. Rev. 28, 168–192. doi: 10.1177/0160017605275160
Alonzo, M., McFadden, J. P., Nowak, D. J., and Roberts, D. A. (2016). Mapping urban forest structure and function using hyperspectral imagery and lidar data. Urban For. Urban Green. 17, 135–147. doi: 10.1016/j.ufug.2016.04.003
Beisel, J. N., Usseglio-Polatera, P., Bachmann, V., and Moreteau, J. C. (2003). A comparative analysis of evenness index sensitivity. Int. Rev. Hydrobiol. 88, 3–15. doi: 10.1002/iroh.200390004
Carreiro, M. M., Song, Y.-C., and Wu, J. (2007). “Ecology, planning, and management of urban forests,” in International Perspective, eds M. M. Carreiro, Y.-C. Song, and J. Wu (Louisville, KY: Springer). doi: 10.1007/978-0-387-71425-7
Chang, L., and Zhaogang, L. (2011). Tridimensional green biomass of Urban forests in harbin based on AHP. J. Northeast Forestry Univ. 39, 52–55. doi: 10.3969/j.issn.1000-5382.2011.04.017
Chen, D., Zheng, T., and Deng, C. (2010). Research on the economic cooperation of guangdong, hong kong, macao in the “Bay Area” of pearl river estuary. Econ. Geogr. 30, 1589–1598. doi: 10.4236/jss.2019.72021
Chen, F., Shao, B., Yuao, G., and Wang, H. (2007). A review of the studies on quantitative indexes for urban forest construction. J. Southwest Agric. Univ. 2007, 6–9. doi: 10.3969/j.issn.1672-5379.2007.05.001
Chen, H. (2008). Decipherment and Discussion of Partial Evaluation Indexes for National Forest City. Inner Mongolia Forestry Investigation and Design.
Da Silva, R. P., dos Santos, J., Tribuzy, E. S., Chambers, J. Q., Nakamura, S., and Higuchi, N. (2002). Diameter increment and growth patterns for individual tree growing in central Amazon, Brazil. For. Ecol. Manag. 166, 295–301. doi: 10.1016/S0378-1127(01)00678-8
Dan, X., and Xu, Y. (2008). Ecological Culture Connotation Analysis During National Forest City Construction in Guangzhou. Central South Forest Inventory and Planning.
Day, F. P. Jr. (1985). Tree growth rates in the periodically flooded Great Dismal Swamp. Castanea. 50, 89–95. doi: 10.2307/4033133
Dobbs, C., Escobedo, F. J., and Zipperer, W. C. (2011). A framework for developing urban forest ecosystem services and goods indicators. Landsc. Urban Plan. 99, 196–206. doi: 10.1016/j.landurbplan.2010.11.004
Dobbs, C., Kendal, D., and Nitschke, C. R. (2014). Multiple ecosystem services and disservices of the urban forest establishing their connections with landscape structure and sociodemographics. Ecol. Indicat. 43, 44–55. doi: 10.1016/j.ecolind.2014.02.007
Dumas, E., Jappiot, M., and Tatoni, T. (2008). Mediterranean urban-forest interface classification (MUFIC): a quantitative method combining SPOT5 imagery and landscape ecology indices. Landsc. Urban Plan. 84, 183–190. doi: 10.1016/j.landurbplan.2007.12.002
Escobedo, F. J., Kroeger, T., and Wagner, J. E. (2011). Urban forests and pollution mitigation: analyzing ecosystem services and disservices. Environ. Pollut. 159, 2078–2087. doi: 10.1016/j.envpol.2011.01.010
Gotelli, N. J., and Colwell, R. K. (2011). Estimating species richness. Biol. Diversity: Front. Measure. Assess. 12, 39–54.
Grimm, N. B., Faeth, S. H., Golubiewski, N. E., Redman, C. L., Wu, J., Bai, X., et al. (2008). Global change and the ecology of cities. Science 319, 756–760. doi: 10.1126/science.1150195
Hou, B., Lei, Y., and Zhu, Z. (2008). Development strategy for ecological civilization in Guangzhou city. J. Chin. Urban Forestry. 2008, 63–66. doi: 10.3969/j.issn.1672-4925.2008.05.020
Hsu, C. H., and Gu, Z. (2010). Ride on the gaming boom: how can Hong Kong, macau and zhuhai join hands to develop tourism in the region? Asia Pac. J. Tour. Res. 15, 57–77. doi: 10.1080/10941660903510057
Huang, C., Zhenqing, L., Chen, S., Zhang, A., and Min, C. (2018). Quantification of precipitation during Typhoon Hato using a polarimetric radar in Southern China. AGUFM. 2018, A31H–2936.
IPCCCC (2007). The Physical Science Basis. Contribution of Working Group I to the Fourth Assessment Report of the Intergovernmental Panel on Climate Change. New York, NY, Cambridge, UK: Cambridge University Press.
Jensen, R., Gatrell, J., Boulton, J., and Harper, B. (2004). Using remote sensing and geographic information systems to study urban quality of life and urban forest amenities. Ecol. Soc. 9:5. doi: 10.5751/ES-01201-090505
Jim, C. Y., and Liu, H. (2000). Statutory measures for the protection and enhancement of the urban forest in Guangzhou City, China. Forestry 73, 311–329. doi: 10.1093/forestry/73.4.311
Jim, C. Y., and Liu, H. (2001). Species diversity of three major urban forest types in Guangzhou City, China. For. Ecol. Manag. 146, 99–114. doi: 10.1016/S0378-1127(00)00449-7
Keylock, C. (2005). Simpson diversity and the shannon–wiener index as special cases of a generalized entropy. Oikos 109, 203–207. doi: 10.1111/j.0030-1299.2005.13735.x
Konijnendijk, C. C. (2003). A decade of urban forestry in Europe. For. Policy Econ. 5, 173–186. doi: 10.1016/S1389-9341(03)00023-6
Kratschmer, S., Pachinger, B., Schwantzer, M., Paredes, D., Guzmán, G., Goméz, J. A., et al. (2019). Response of wild bee diversity, abundance, and functional traits to vineyard inter-row management intensity and landscape diversity across Europe. Ecol. Evol. 9, 4103–4115. doi: 10.1002/ece3.5039
Lande, R. (1996). Statistics and partitioning of species diversity, and similarity among multiple communities. Oikos 76, 5–13. doi: 10.2307/3545743
Lea, R., Tierson, W. C., and Leaf, A. L. (1979). Growth responses of northern hardwoods to fertilization. For. Sci. 25, 597–604.
Li, B. B., and Jin, X. L. (2012). Study on application of green quantity in Urban Greening. Northern Horticult. 2012, 115–118.
Liao, S., Zheng, D., Cai, Y., Xu, l., Fan, S., Zhan, X., et al. (2017). Highness class structure of natural castanopsis cissa stand in Northern Fujian. J. Northern For. Univ. 37, 45–50. doi: 10.14067/j.cnki.1673-923x.2017.06.007
Liu, B., Wen, Q., and Liu, S. (2006). Urban forest classification in urban forest planning—case study of akesu urban forest planning in xinjiang uygur autonomous region. 2006, 6–10. doi: 10.3969/j.issn.1672-4925.2006.04.001
Liu, C., He, X., Chen, W., Zhao, G., and Xu, W. (2006). Tridimensional green biomass measures of Shenyang urban forests. J. Beijing For. Univ. 28, 32–37. doi: 10.3321/j.issn:1000-1522.2006.03.006
Livesley, S., McPherson, E., and Calfapietra, C. (2016). The urban forest and ecosystem services: impacts on urban water, heat, and pollution cycles at the tree, street, and city scale. J. Environ. Qual. 45, 119–124. doi: 10.2134/jeq2015.11.0567
Lu, L., Li, Y., and Wang, J. (2005). On industrial comparison and complementary development between Guangzhou and Foshan. Trop. Geogr. 25:160. doi: 10.3969/j.issn.1001-5221.2005.02.009
Moss, I. (2012). Stand Structure Classification, Succession, and Mapping using LiDAR[D]. Vancouver, BC: University of British Columbia.
Nicoll, B. C., and Ray, D. (1996). Adaptive growth of tree root systems in response to wind action and site conditions. Tree Physiol. 16, 891–898. doi: 10.1093/treephys/16.11-12.891
Nowak, D. J., Crane, D. E., Stevens, J. C., Hoehn, R. E., Walton, J. T., and Bond, J. (2008). A ground-based method of assessing urban forest structure and ecosystem services. Aboricult. Urban For. 34, 347–358.
Nowak, D. J., Greenfield, E. J., Hoehn, R. E., and Lapoint, E. (2013). Carbon storage and sequestration by trees in urban and community areas of the United States. Environ. Pollut. 178, 229–236. doi: 10.1016/j.envpol.2013.03.019
O'Brien, S. T., Hubbell, S. P., Spiro, P., Condit, R., and Foster, R. B. (1995). Diameter, height, crown, and age relationship in eight neotropical tree species. Ecology 76, 1926–1939. doi: 10.2307/1940724
Parnell, S., Simon, D., and Vogel, C. (2007). Global environmental change: conceptualising the growing challenge for cities in poor countries. Area 39, 357–369. doi: 10.1111/j.1475-4762.2007.00760.x
Rahman, M., Armson, D., and Ennos, A. (2015). A comparison of the growth and cooling effectiveness of five commonly planted urban tree species. Urban Ecosyst. 18, 371–389. doi: 10.1007/s11252-014-0407-7
Risser, P. G., and Rice, E. L. (1971). Diversity in tree species in oklahoma upland forests. Ecology 52, 876–880. doi: 10.2307/1936036
Routledge, R. (1979). Diversity indices: which ones are admissible? J. Theoret. Biol. 76, 503–515. doi: 10.1016/0022-5193(79)90015-8
Sempos, C. T., Durazo-Arvizu, R. A., Dawson-Hughes, B., Yetley, E. A., Looker, A. C., Schleicher, R. L., et al. (2013). Is there a reverse J-shaped association between 25-hydroxyvitamin D and all-cause mortality? Results from the US nationally representative NHANES. J. Clin. Endocrinol. Metab. 98, 3001–3009. doi: 10.1210/jc.2013-1333
Seto, K. C., Fragkias, M., Güneralp, B., and Reilly, M. K. (2011). A meta-analysis of global urban land expansion. PLoS ONE 6:e23777. doi: 10.1371/journal.pone.0023777
Steenberg, J. W., Millward, A. A., Nowak, D. J., Robinson, P. J., and Ellis, A. (2017). Forecasting urban forest ecosystem structure, function, and vulnerability. Environ. Manag. 59, 373–392. doi: 10.1007/s00267-016-0782-3
Takagi, H., Xiong, Y., and Furukawa, F. (2018). Track analysis and storm surge investigation of 2017 typhoon hato: were the warning signals issued in macau and Hong Kong timed appropriately? Georisk Assess. Manag. Risk Eng. Syst. Geohazards 12, 297–307. doi: 10.1080/17499518.2018.1465573
Wang, J., Yang, H., and Feng, Z. (2013). Tridimensional green biomass measurement for trees using 3-D laser scanning. Trans. Chin. Soc. Agric. Machinery 44, 229–233. doi: 10.6041/j.issn.1000-1298.2013.08.039
Westphal, C., Tremer, N., von Oheimb, G., Hansen, J., von Gadow, K., and Härdtle, W. (2006). Is the reverse J-shaped diameter distribution universally applicable in European virgin beech forests? For. Ecol. Manag. 223, 75–83. doi: 10.1016/j.foreco.2005.10.057
Xie, J., Yang, T., and Li, G. (2018). “Extracting geospatial information from social media data for hazard mitigation, typhoon hato as case study (short paper),” in 10th International Conference on Geographic Information Science (GIScience 2018). Schloss Dagstuhl-Leibniz-Zentrum fuer Informatik (Melbourne, VIC).
Xu, C., Jiang, W., Huang, Q., and Wang, Y. (2020). Ecosystem services response to rural-urban transitions in coastal and island cities: a comparison between Shenzhen and Hong Kong, China. J. Clean. Product. 260:121033. doi: 10.1016/j.jclepro.2020.121033
Yang, X., Hong, W, and Wu, C. (2010). Distribution characteristic of DBHand tree height for gap edge trees of Acacia confusa in mid-subtropical zone. J. Southwest For. Univ. 30, 25–28. doi: 10.3969/j.issn.2095-1914.2010.06.006
Young, R. F. (2010). Managing municipal green space for ecosystem services. Urban For. Urban Green. 9, 313–321. doi: 10.1016/j.ufug.2010.06.007
Yu, X. J., and Ng, C. N. (2007). Spatial and temporal dynamics of urban sprawl along two urban–rural transects: a case study of Guangzhou, China. Landsc. Urban Plan. 79, 96–109. doi: 10.1016/j.landurbplan.2006.03.008
Zhang, C., Stratopoulos, L. M. F., Pretzsch, H., and Rötzer, T. (2019). How do Tilia cordata greenspire trees cope with drought stress regarding their biomass allocation and ecosystem services? Forests 10:676. doi: 10.3390/f10080676
Zhang, C., Zhao, Q., Tang, H., Qian, W., Su, M., and Pan, L. (2020). How well do three tree species adapt to the urban environment in guangdong-hongkong-macao greater bay area of china regarding their growth patterns and ecosystem services? Forests 11:420. doi: 10.3390/f11040420
Zhang, X., Huang, G., Liu, L., Zhai, M., and Li, J. (2018). Ecological and economic analyses of the forest metabolism system: a case study of guangdong province, China. Ecol. Indicat. 95, 131–140. doi: 10.1016/j.ecolind.2018.07.022
Keywords: class distribution, ecological index, forest planning and construction, landscape value, urban area
Citation: Zhao Q, Xu D, Qian W, Hu R, Chen X, Tang H and Zhang C (2020) Ecological and Landscape Perspectives on Urban Forest Planning and Construction: A Case Study in Guangdong-HongKong-Macao Greater Bay Area of China. Front. Sustain. Cities 2:44. doi: 10.3389/frsc.2020.00044
Received: 13 July 2020; Accepted: 10 August 2020;
Published: 18 September 2020.
Edited by:
Mohammad Asrafur Rahman, Technical University of Munich, GermanyReviewed by:
Dapeng Wang, Institute of Urban Environment (CAS), ChinaCopyright © 2020 Zhao, Xu, Qian, Hu, Chen, Tang and Zhang. This is an open-access article distributed under the terms of the Creative Commons Attribution License (CC BY). The use, distribution or reproduction in other forums is permitted, provided the original author(s) and the copyright owner(s) are credited and that the original publication in this journal is cited, in accordance with accepted academic practice. No use, distribution or reproduction is permitted which does not comply with these terms.
*Correspondence: Chi Zhang, emhhbmdjaGlAc2lub2dhZi5jbg==
Disclaimer: All claims expressed in this article are solely those of the authors and do not necessarily represent those of their affiliated organizations, or those of the publisher, the editors and the reviewers. Any product that may be evaluated in this article or claim that may be made by its manufacturer is not guaranteed or endorsed by the publisher.
Research integrity at Frontiers
Learn more about the work of our research integrity team to safeguard the quality of each article we publish.