 Yudi Li1,2*†
 Alona Armstrong3,4†
 Christopher Simmons5†
 Noah Z. Krasner1,2†
 Rebecca R. Hernandez1,2,3,4*†
- 1Wild Energy Center, Energy and Efficiency Institute, University of California, Davis, Davis, CA, United States
- 2Department of Land, Air & Water Resources, University of California, Davis, Davis, CA, United States
- 3Lancaster Environment Centre, Lancaster University, Lancaster, United Kingdom
- 4Energy Lancaster, Lancaster University, Lancaster, United Kingdom
- 5Department of Food Science and Technology, University of California, Davis, Davis, CA, United States
Large, ground-mounted photovoltaic solar projects (GPVs) are expanding rapidly worldwide, driven by their essential role in climate change mitigation and the transition to a low-carbon economy. With the global market for tracking systems projected to increase annually by 32% in capacity by 2050, understanding their ecological impacts, including those from their operation and management (O&M), is critical but understudied. This study presents the first comprehensive evaluation of microclimate and vegetation mosaics within a conventional, single-axis GPV managed through regular mowing. In the state of California’s Great Central Valley (United States), we developed a novel experimental framework to characterize five distinct “micro-patches” that capture the full spectrum of microclimate and vegetation zones modulated by the tracking PV system and O&M. Over a 12-month period, we monitored nine above- and belowground microclimate variables and 16 plant ecology metrics across these micro-patches. Beneath PV panels, photosynthetically active radiation decreased by 89%, and wind speed slowed by 46%, while open spaces within the GPV footprint exhibited greater soil surface temperatures (+2.4°C) and accelerated moisture loss (+8.5%) during drought periods. Furthermore, PV panel rotation influenced shading patterns throughout the day, creating temporal variability in air temperature and vapor pressure deficit. Plant surveys identified 37 species, 86% of which were non-native. Marked differences in vegetation across micro-patches indicated that GPVs drive changes in plant community composition, structure, and productivity. Compared to open spaces, vegetation near and within the PV array footprint displayed greater species richness (+8.4%), taller maximum height (+21%), reduced coverage of sun-loving plants (−71%), and less dead biomass accumulation (−26%), from shade-driven effects. These findings suggest the consideration of micro-patch-specific maintenance strategies and nature-based solutions to control invasive, exotic plant species, conferring opportunities to enhance operational, ecological, and socioeconomic sustainability while redressing the twin crises of climate change and biodiversity loss simultaneously.
1 Introduction
Photovoltaic (PV) solar energy surpassed wind energy capacity in 2022, reaching 710 GW and accounting for one-third of power generation among all renewable sources worldwide (IEA, 2024). Ground-mounted PV solar energy projects (GPVs) contributed significantly to this growth, representing 46% of PV capacity expansion in 2023 (IEA, 2024). GPVs are projected to increase through 2050 to support global sustainability targets, including net zero emissions and related climate change mitigation goals (US Department of Energy, 2021). However, the relatively high land transformation rate of GPVs (~2,000 ha/TWh/y) compared to distributed PV systems (e.g., rooftop solar) and other renewable energy sources (e.g., geothermal) poses environmental challenges by driving land-use and land-cover change (Hernandez et al., 2015; Lovering et al., 2022). The presence of GPV infrastructure and its operation may also modify the local microclimate, depending on the type of racking infrastructure used (Sinha et al., 2018; Nordberg et al., 2021). Despite fixed-tilt arrays accounting for 76% of global demand in 2018, the global market for tracking systems is expected to grow annually by 32% in capacity through 2050 due to their lower levelized cost of electricity (LCOE) (Awasthi et al., 2020; Andre and Guerra, 2020). In certain places, tracking PV is already predominant: for example, in California’s Great Central Valley, the installed capacity of single-axis GPVs is four times that of fixed-tilt systems. However, a deeper understanding of their ecological outcomes and best practices is needed to mitigate risks and amplify benefits (Stid et al., 2022).
Changes in microclimate driven by fixed-tilt GPVs have been documented since 2013 and have emphasized the role of shading. For example, up to 85% of direct solar radiation may be intercepted in densely packed GPV designs (Wynne-Sison et al., 2023), but this may be attenuated to 29–44% when PV panels are elevated (e.g., above 2 m; Marrou et al., 2013a; Barron-Gafford et al., 2019; Fagnano et al., 2024). Shading causes cooling of air and soil surfaces up to 2°C and 5°C, respectively, during daytime in spring and summer (AL-agele et al., 2021; Suuronen et al., 2017; Marrou et al., 2013b; Lambert et al., 2021; Ferrara et al., 2023). However, in winter or at night, temperatures within PV array footprints may be greater due to heat dissipation from operating modules or obstructed sky views that trap long-wave radiation, highlighting the importance of seasonal and diel-scale variation at fixed-tilted GPVs (Armstrong et al., 2016; Barron-Gafford et al., 2016; Yang et al., 2017; Hassanpour Adeh et al., 2018; Yue et al., 2021). In temperate zones, evapotranspiration losses at fixed-tilted GPVs may decrease more gradually (by 10–40%) due to a combination of lower vapor pressure deficits and reduced wind speeds, leading to 2–113% higher soil moisture beneath panels (Weselek et al., 2021; Juillion et al., 2022; Wu et al., 2022). However, in more arid ecosystems, a greater proportion of precipitation is intercepted and redistributed, leading to lower soil moisture underneath PV panels than control areas (Tanner et al., 2020; Moscatelli et al., 2022; Yavari et al., 2022). Overall, the static nature of PV panels associated with a fixed-tilt GPV creates a landscape of spatial repeating microsites, shade, runoff, and interspace, but these have not been extensively explored.
Vegetation responses to fixed-tilt GPVs are less documented than microclimatic effects. Shade is likely the predominant microclimate effect on vegetation owing to PV panel operation. In a marine west coast climate, light limitation under PV panels led to reduced species richness, disadvantaging sun-loving species, while cover and biomass varied, ranging from reductions of up to fourfold to no significant changes (Armstrong et al., 2016; Lambert et al., 2021; Lambert et al., 2022; Uldrijan et al., 2022). Some herbaceous plants may adapt to reduced shade by elongating stems to access sunlight, albeit at the expense of reduced canopy volume and seed production (Hernandez et al., 2020; Wynne-Sison et al., 2023). Impacts of fixed-tilt GPV on vegetation may also drive changes in community composition. For example, at a restored brownfield GPV, annual grasses tended to thrive and dominate under persistent shade compared to perennial grasses and wildflowers (Uldrijan et al., 2021). In contrast, a study in a desert ecosystem in the state of California, USA, found that shading increased species richness at a more stressful caliche pan habitat, but not at a gravelly bajada (Tanner et al., 2020). In the state of Oregon, USA, biomass under PV panels doubled compared to open areas due to enhanced water-use efficiency under heat or drought stress (Hassanpour Adeh et al., 2018). Agrivoltaic systems—solar energy generation co-occurring with agriculture—have also demonstrated mixed impacts of fixed-tilt PV panels on crop and fruit yields, ranging from −39% for lettuce in France to +47% for mountain tea in Greece (Marrou et al., 2013a; AL-agele et al., 2021; Barron-Gafford et al., 2019; Weselek et al., 2021; Ferrara et al., 2023; Fagnano et al., 2024). These findings underscore that the impact of fixed-tilt GPVs on vegetation remains uncertain but likely context-dependent, influenced by factors such as local climate, soil conditions, panel configuration, and species-specific traits (Yavari et al., 2022).
Tracking GPVs produces less temporally uniform shading and microclimatic patterns than fixed-tilt designs due to daily rotation (Dupraz et al., 2011; Suuronen et al., 2017; Valle et al., 2017). In single-axis GPVs, light availability beneath PV panels can range from 5% measured at a height of 1 m above the ground to 57% at 0.1 m, with the interspaces between adjacent PV module strings receiving up to 84% of solar radiation (Liu et al., 2019; Graham et al., 2021). Despite the overall cooling and humidifying effects of shading (Choi et al., 2020; Choi et al., 2023), Yue et al. (2021) observed that beneath single-axis PVs in an alpine desert, soil temperature and moisture were 2.5°C and 3.6% higher, respectively, during summer than those beneath fixed-tilt PVs. In a semiarid desert in China, a slower wind speed under single-axis PVs contributed to higher seed bank density and diversity, benefiting from minimized spillover of seeds (Li et al., 2024). At a GPV in temperate Czechia reseeded with grasses, plant community composition differed between two racking systems, with rotating PVs favoring annual wildflowers and stationary PVs supporting annual grasses and perennial wildflowers (Vaverková et al., 2022). Productivity within the PV array footprint compared to open reference sites can also vary widely, ranging from −22 to +210% (Liu et al., 2019; Kannenberg et al., 2023; Edouard et al., 2023; McCall et al., 2024). Additionally, the position of vegetation relative to panels also plays a critical role as those shaded in the afternoon under the western leading edge often exhibited the greatest cover and biomass (Beatty et al., 2017; Sturchio et al., 2022; Sturchio et al., 2024). Therefore, the interplay among single-axis PV panel operation, microclimatic, and vegetation may be more complex than that of fixed-tilt design.
The impact of single-axis GPVs on vegetation is further modulated by vegetation management, which may be executed using various mechanisms—including herbicide, mowing, and grazing—often by third-party operation and management (O&M) providers. For example, mowing under rotating panels may gradually transition grasslands from annual-dominated to perennial-dominated communities, whereas sheep grazing can lead to shifts in the opposite direction (Vaverková et al., 2022). Zones along the perimeter of the PV array footprint within a GPV, which can occupy a significant portion of the facility footprint, are also subject to unique environmental conditions and may be managed uniquely from O&M practices across the PV array footprint.
This study represents the first comprehensive investigation of a single-axis GPV in the Great Central Valley of California, USA, assessing both microclimate (9 variables) and vegetation (16 variables) over 12 consecutive months across five distinct “micro-patches” that capture the full heterogeneity of conditions created by single-axis tracking GPV infrastructure and regular mowing. We present these “micro-patches” as a novel experimental framework for the study of ecological outcomes at single axis, tracking GPV, which may also help standardize future studies, allow for more accurate comparisons across different studies, and distinguish results from those at fixed-tilt GPVs. Given our significant challenges of study site from exotic, noxious weeds, we also propose best management practices to inform decision-making for stakeholders. We hypothesize that areas beneath PV panels will exhibit (i) the lowest solar irradiance, air temperature, wind speed, species diversity, canopy coverage, aboveground biomass, and floral resources and (ii) the highest relative humidity, soil moisture, structural profile, and abundance of shade-tolerant species. We anticipate that the experimental framework and findings will provide valuable evidence to optimize the design and management of single-axis GPVs, advancing their ecological sustainability and functionality.
2 Materials and methods
2.1 Site description
The UC Davis Experimental Ecovoltaic Park (DEEP), located south of Interstate 80 and north of Putah Creek (38.520268, −121.739191), is a single-axis GPV spanning 62 acres (0.25 km2) constructed in 2015 on agricultural land owned by the University of California, Davis (Davis, California, USA). Historically, the land was a natural wetland adjacent to wildflower-dominated grasslands and riparian woodlands, typical of the California prairie biome (Holstein, 2011). Situated in a Mediterranean climate, Davis has an annual global horizontal irradiance of 1,854 kWh/m2, average temperatures ranging from 8.9°C to 23.9°C, and annual precipitation of 498 mm, primarily between October and April (U.S. Climate Data, 2023). The soil is predominantly characterized as the Yolo series, featuring well-drained alluvium (SoilWeb, 2023).
Adjacent to the UC DEEP are diverse agricultural activities, including crop cultivation (e.g., alfalfa, tomatoes, and sunflowers), horse ranching, and apiary operations. With a nameplate capacity of 13 MWac (16.3 MWdc), the GPV generates 33 GWh annually, meeting approximately 14% of the electricity demand of the campus. Originally developed by SunPower, the facility ownership was transferred to Arevon Energy in 2020. The system employs multicrystalline PV modules mounted on 1.37-m high piles with single-axis tracking (east–west direction). When fully tilted (~53°), the lowest frame edge is 0.54 m above the ground, with a pole-to-pole spacing of 4.57 m.
Vegetation management includes thrice-yearly mowing (February, June, and September) to maintain plant heights of 100–150 mm and remove biomass. This practice minimizes shading that may reduce power output, prevents physical contact with cabling and other GPV elements, and mitigates fire risks by controlling fuel loads (Randle-Boggis et al., 2020; Uldrijan et al., 2021). Additional measures such as herbicide application, soil fertility depletion, or revegetation were not implemented. Consequently, noxious, non-native weeds are prevalent across the site. The research area, covering approximately 7.6 acres (0.031 km2) in the central region of the facility, was permitted for our ecological studies (Figure 1A).
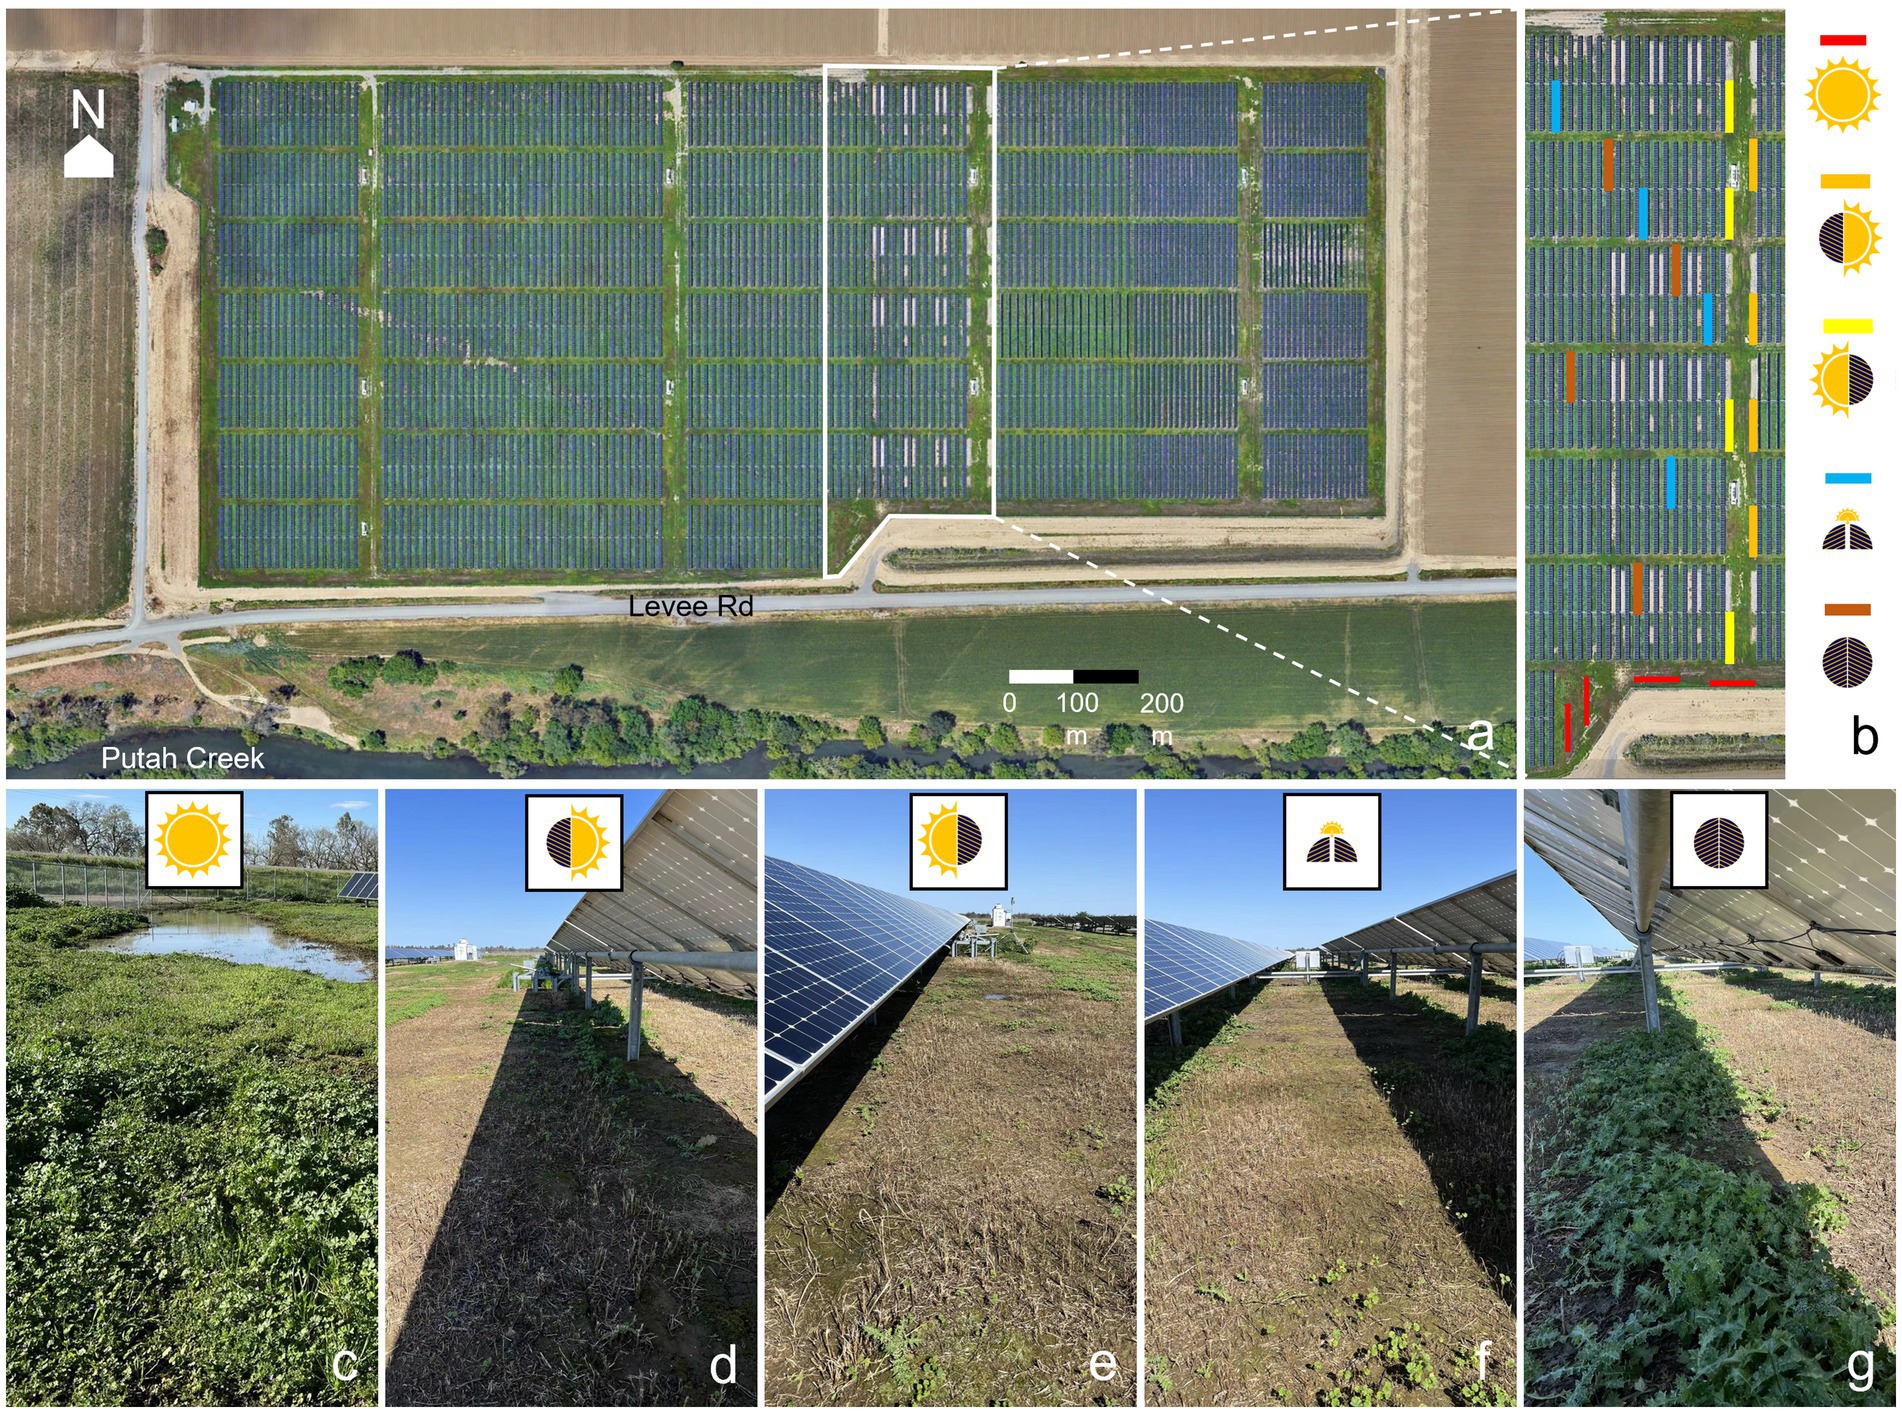
Figure 1. Aerial map of UC DEEP (A), showing plot locations within permitted research area and micro-patches (B). Photographs of five micro-patches captured at 10:00 am in March 2023 following the first round of mowing: No Shade ( ) (C), AM Shade (
 ) (D), PM Shade (
 ) (E), AM & PM Shade (
 ) (F), and Full Shade (
 ) (G). Aerial images (A,B) are sourced from Google Earth, and photographs (C–G) were taken by Yudi Li.
2.2 Micro-patch description
The UC DEEP is characterized by a mixed-use footprint, with 14% of the area supporting little to no vegetation due to gravel roads, bare ground used as lay-down areas for on-site materials, and infrastructure required for operations and maintenance activities. The remaining 86% was classified into five distinct micro-patch types based on the diurnal shading patterns created by the PV panels:
a. No Shade (NS): Situated in the open space—with vernal pools in winter—within the security fence, this micro-patch receives uninterrupted full sunlight throughout the day, covering 3.95% of the utility footprint (Figure 1C).
b. AM Shade (MS): Situated along the eastern edges of PV panel strings, this micro-patch experiences shading in the morning but receives full sunlight during midday and afternoon, covering 3.82% of the footprint (Figure 1D).
c. PM Shade (AS): Situated along the western edges of PV panel strings, this micro-patch experiences shading in the afternoon but receives full sunlight during the morning and midday, also covering 3.82% of the footprint (Figure 1E).
d. AM and PM Shade (BS): Situated in the gap between adjacent PV panel strings, this micro-patch experiences shading in the morning and afternoon but receives full sunlight during midday, covering 38.62% of the footprint (Figure 1F).
e. Full Shade (FS): Situated directly beneath the PV panel strings, this micro-patch receives minimal direct sunlight exposure throughout the day, except during sunrise and sunset when the zenith angles are large, covering 35.67% of the footprint (Figure 1G).
NS represents conditions closest to a natural, unshaded grassland ecosystem, serving as a baseline for evaluation. In contrast, FS is subject to persistent shading, offering insight into environments with highly modified light availability. The other three micro-patches (MS, AS, and BS) have intermediate shading conditions that vary in timing, potentially influencing microclimate and vegetation.
These five micro-patches can also be grouped into three functional zones based on their relative position to the solar arrays: (i) within-array, comprising BS and FS located within solar arrays, (ii) near-array, comprising MS and AS located along the periphery of the solar arrays, and (iii). beyond-array, comprising NS in fully open areas farther away from the solar arrays.
The classification of these micro-patches reflects the ecological heterogeneity introduced by single-axis GPVs. This framework enables the investigation of how shade-induced microclimates drive flora composition and productivity, with broader implications for managing solar installations as dual-use or multifunctional landscapes that optimize ecological and operational outcomes.
2.3 Survey protocol
To ensure robust data collection, four permanent 48-m2 plots (22 m length × 2.7 m width) were randomly selected and delineated within each micro-patch type, resulting in 20 plots across the permitted research area (Figure 1B). Monthly data collection was conducted from December 2022 to November 2023, spanning 12 sampling periods to capture seasonal variations.
We chose one plot per micro-patch type to monitor meteorology, including ambient temperature (AT; °C), dew point temperature (DP; °C), relative humidity (RH; %), and wind speed (WS; m s−1) at 15-min intervals by digital 5,400-AG weather meters (Kestrel Meters, Boothwyn, PA, USA) mounted on posts 0.6 m height above the soil surface of center of each plot for 6–7 days in the second or the third week of each month. Vapor pressure deficit (kPa) was derived from AT and RH following Ward and Trimble (2003):
Arithmetic averages of daily, daytime, nighttime, morning, and afternoon, as well as daily maximum, minimum, and range, were calculated for AT, DP, RH, WS, and VPD. Photosynthetic active radiation (PAR; μmol m−2s−1), daily light integral (DLI; mol m−2d−1), and photoperiod (hours) were concurrently monitored with DLI-400 meters (Apogee Instruments, Logan, UT, USA) at 3-min intervals on the same posts of weather meters. Daytime, morning, and afternoon mean PARs were calculated on a daily basis. Growing degree days (GDD) was derived from the average of daily maximum and minimum ATs minus a base temperature threshold of 5°C:
Volumetric water content (VWC; %) and soil temperature (ST; °C) were measured at 10 cm depth on six randomly selected spots per plot with TDR-315H (Acclima, Meridian, ID, USA)—using a portable time domain reflectometer—from 10:00 a.m. to 2:00 p.m., yielding 100 records every month/sampling event (5 micro-patches x 4 plots/micro-patch x 5 records/plot).
Vegetation communities were evaluated by five randomly positioned 1 m2 x 1 m2 quadrats per plot (i.e., 100 quadrats, or 100 m2, per month/sampling event). Within each quadrat, we (i). surveyed presence–absence, canopy coverage, blooming frequency, height profile, and aboveground live biomass to the lowest taxonomy (further details could be referred to Note 1 in Supplementary material 1), (ii). estimated bare ground and dead tissue coverages, (iii). calculated maximum height and total aboveground live biomass as well as the coverage ratios of narrowleaf: broadleaf, heliophilous: sciophilous, and anemophilous: entomophilous, and (iv). derived species richness, Simpson diversity, Shannon diversity, and Pielou’s evenness based on the presence–absence using the “vegan” package (Oksanen et al., 2019) of R 4.2.1 (R Core Team, Vienna, Austria).
2.4 Data analysis
All statistical analyses were conducted using R 4.2.1 software.
The primary goal was to assess how microclimate variables (e.g., VPD, WS, PAR, GDD, VWC) and vegetation variables (e.g., presence–absence, mean height, litter coverage, live biomass) were influenced by the interactions between micro-patch type and seasonal or monthly variations. To achieve this, generalized linear mixed-effect models (GLMMs) were applied, with micro-patch type (five levels: NS, MS, AS, BS, and FS), month (12 levels: December to November), or season (four levels: winter, spring, summer, and autumn), and their two-way interactions as fixed factors. Random factors, including date (for meteorology, excluding ST and VWC) and plot (for vegetation, ST, and VWC), were incorporated to account for hierarchical data structure or repeated measures.
The distribution of the response variables was determined using the “fitdistrplus” package (Delignette-Muller and Dutang, 2015), ensuring that appropriate model families were chosen. For instance, Gaussian was employed for continuous real-number data (e.g., AT, VPD, diversity indices). Assumptions of normality and homoscedasticity were checked using the Shapiro–Wilk test, and when necessary, data were transformed using the “bestNormalize” package (Peterson and Peterson, 2020) before model fitting. For other types of data: Binomial, Beta, Gamma, and Poisson were more appropriate for binary numbers (e.g., presence–absence), continuous probability numbers (e.g., RH), positive real numbers (e.g., height), and natural numbers (e.g., species richness), respectively,
GLMMs were conducted using the “lme4” package (Bates et al., 2015). To address issues such as zero inflation, overdispersion, or autocorrelation, the “DHARMa” package (Hartig and Hartig, 2017) was used for diagnostics, and the “glmmTMB” package (Brooks et al., 2023) was applied for corrected modeling when needed. Model selection was guided by the lowest Akaike information criterion (AIC) to ensure optimal fit. Significant effects of sampling periods or micro-patches were examined further using Tukey’s honestly significant difference (HSD) post-hoc tests with the “emmeans” package (Lenth and Lenth, 2018), providing pairwise comparisons between treatment levels.
To analyze community composition, non-metric multidimensional scaling (NMDS) was performed using the “vegan” package, leveraging Jaccard dissimilarity and 999 permutations to visualize differences in weed community assemblages based on presence–absence data. NMDS, as a non-parametric approach, is well suited for ecological datasets with uncertain or non-linear relationships. The dimensionality of NMDS plots was optimized by selecting stress values below the recommended threshold for accurate ordination (Martin, 2022). Differences among levels of season, micro-patch type, and their interactions were tested using permutational multivariate analysis of variance (PERMANOVA).
To complement the unconstrained NMDS and enhance the interpretability of species co-occurrence patterns, linear discriminant analysis (LDA), a supervised clustering approach, was performed using the “MASS” package (Ripley et al., 2013; Priyadarsini et al., 2015). To identify species specifically associated with each season and micro-patch combination, indicator species analysis was also conducted using the “indicspecies” package (De Caceres et al., 2016).
Our comprehensive statistical framework enabled detailed exploration of both microclimate and vegetation dynamics, providing robust insights into how these ecological variables respond to spatiotemporal variations of the environment.
3 Results
3.1 Microclimate
Wind speeds were the highest in NS, with an annual mean of 3.89 m/s (± 2.58 m/s), followed by MS (3.00 m/s ± 2.28 m/s), AS (2.75 m/s ± 1.87 m/s), BS (2.70 m/s ± 2.05 m/s), and FS (2.10 m/s ± 1.95 m/s) (Figure 2A; Table 1). However, these differences were not statistically significant across all months and seasons (Supplementary Tables S1, S2 in Supplementary material 2). A similar trend was observed for daytime PAR, with MS, AS, BS, and FS receiving 91, 88, 83, and 11% of the PAR observed in NS, respectively (Figure 2B). PAR in MS and AS did not significantly differ from BS during the morning and afternoon, respectively, due to shadows cast by the PV panels (Figures 2C,D; Supplementary Figure S2 in Supplementary material 1). The daily photoperiod was longest in winter and shortest in autumn in NS, although the annual mean photoperiod was comparable across all micro-patches, ranging from 13.4 to 13.8 h per day (Table 1; Supplementary Figures S3A–D in Supplementary material 1).
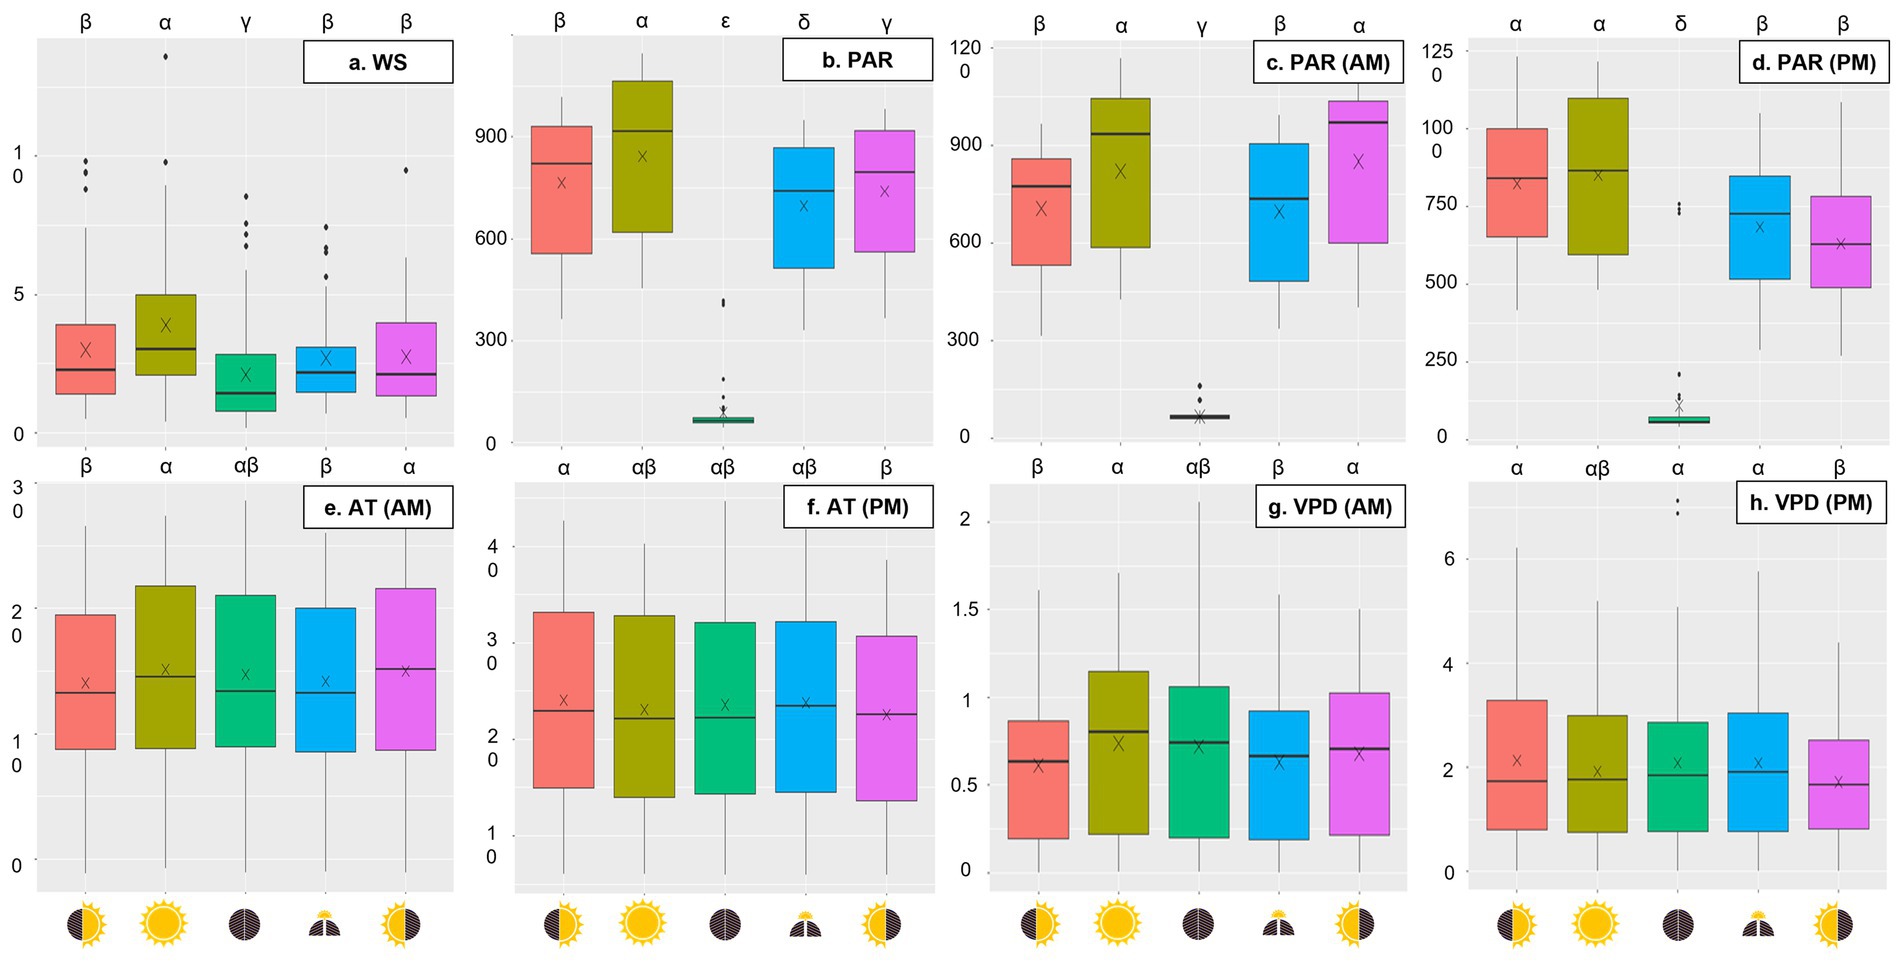
Figure 2. Boxplots of daily wind speed (m/s) (A), daytime photosynthetic active radiation (μmol m−2 s−1) (B), morning photosynthetic active radiation (μmol m−2 s−1) (C), afternoon photosynthetic active radiation (μmol m−2 s−1) (D), morning air temperature (°C) (E), afternoon air temperature (°C) (F), morning vapor pressure deficit (kPa) (G), and afternoon vapor pressure deficit (kPa) (H) averaged over 12 months (December 2022 to November 2023) across five micro-patches: No Shade (), AM Shade (), PM Shade (), AM & PM Shade (), and Full Shade (). Statistical differences between micro-patches (p-value <0.05) are labeled with Greek symbols (e.g., α, β, γ, δ, and ε).
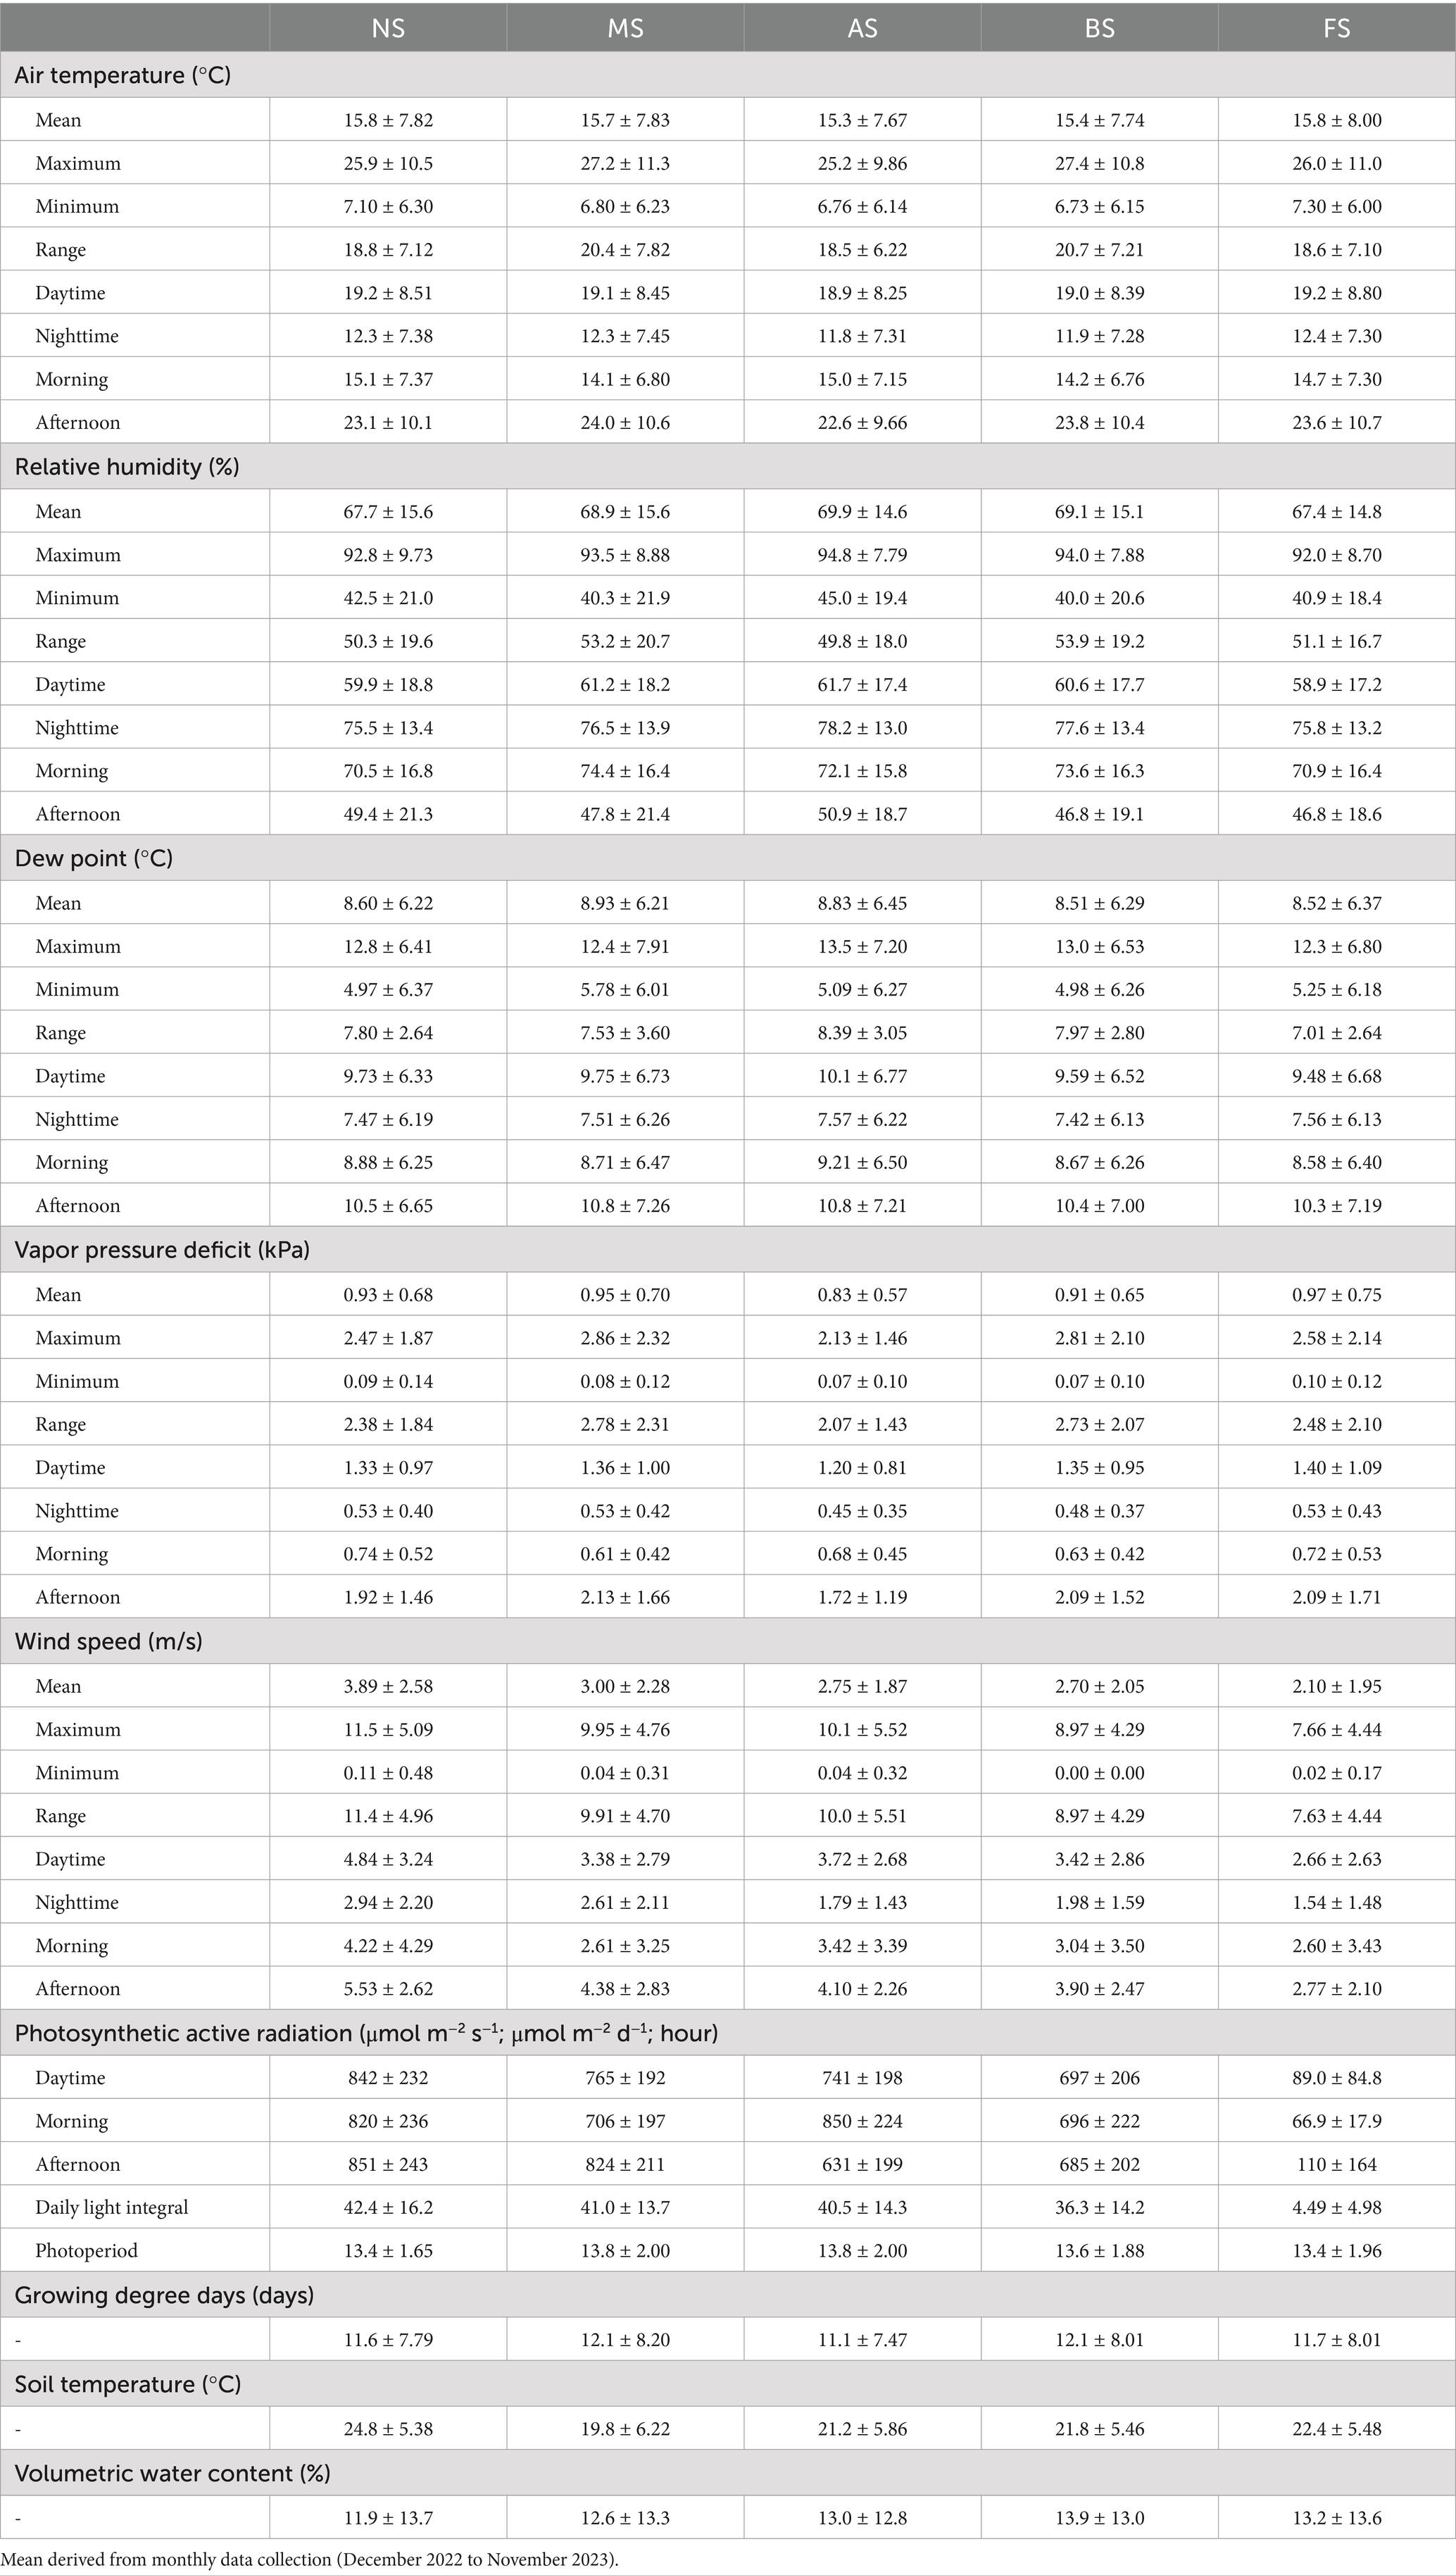
Table 1. Annual mean value ± standard deviation of microclimate indicators on the five micro-patches: No Shade (NS), AM Shade (MS), PM Shade (AS), AM & PM Shade (BS), and Full Shade (FS).
AT, DP, VPD, and GDD peaked in July or August (Supplementary Figure S1 in Supplementary material 1). Among the micro-patches, AS consistently exhibited the lowest GDD as well as the mean, maximum, daytime, afternoon, nighttime, and range of AT and VPD, while RH and DP exhibited the opposite patterns (Table 1; Supplementary Figures S3E,F in Supplementary material 1). The highest maximum AT and VPD were observed in BS (AT: 27.4°C ± 10.8°C; VPD: 2.86 kPa ± 2.32 kPa), and the greatest ranges of these measures occurred in MS (AT: 20.7°C ± 7.21°C; VPD: 2.78 kPa ± 2.31 kPa), although statistical analysis revealed no significant differences across micro-patches (Supplementary Tables S1, S2 in Supplementary material 2). Interestingly, mean, daytime, and nighttime AT in FS were comparable to those in NS (Table 1). In the morning, NS and AS were the warmest, whereas in the afternoon, MS displayed higher AT and VPD than all other micro-patches (Figures 2E–H).
Temperature of soil averaged 24.8°C (± 5.38°C) in NS, which was 2.4°C, 3.0°C, 3.6°C, and 5.0°C warmer than in FS, BS, AS, and MS, respectively (Figure 3A; Table 1). Annual VWC was highest in BS (13.9% ± 13.0%), followed closely by FS (13.2% ± 13.6%), AS (13.0% ± 12.8%), and MS (12.6% ± 13.3%), with the lowest levels observed in NS (11.9% ± 13.7%) (Figure 3B; Table 1). The statistical differences between BS and FS, as well as among AS, MS, and NS, were marginal (Supplementary Tables S1, S2 in Supplementary material 2). Over time, FS experienced the driest conditions in December and February (up to −7.1%) but transitioned to the moistest from April through June (up to +6.8%) (Figure 3C). No significant differences in VWC were observed among the micro-patches during other months (Supplementary Tables S1, S2 in Supplementary material 2).
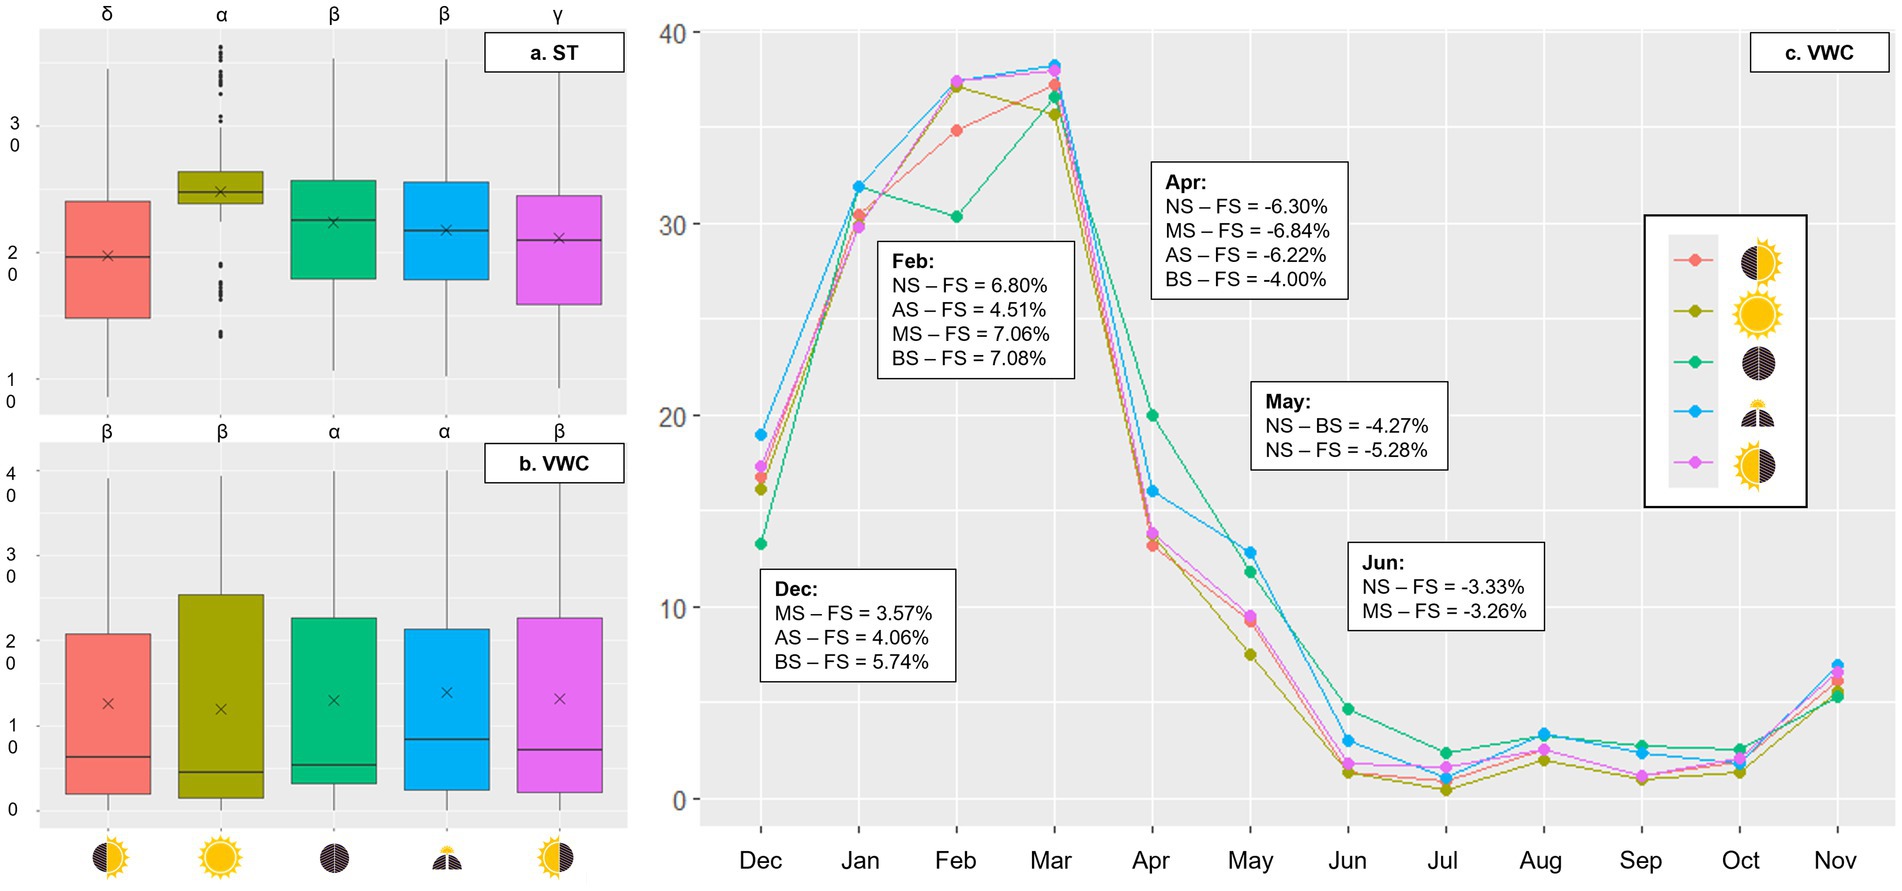
Figure 3. Boxplots of soil temperature (°C) (A) and volumetric water content (%) (B) averaged over 12 months and connected dot plots of mean volumetric water content (%) (C) from December 2022 to November 2023 across five micro-patches: No Shade (), AM Shade (), PM Shade (), AM & PM Shade (), and Full Shade (). Statistical differences between micro-patches (p-value <0.05) are labeled with Greek symbols (e.g., α, β, and γ).
3.2 Vegetation
A total of 37 species were identified at the UC Davis Ecovoltaic Solar (Supplementary Table S1 in Supplementary material 1), including 16 dominant broadleaves (observed across multiple quadrats during more than one sampling event; Figure 4), 12 rare broadleaves (Supplementary Figures S4A–L in Supplementary material 1), and 9 narrowleaves (Supplementary Figures S4M–T in Supplementary material 1). Of the five species native to California, four—Croton setiger, Epilobium ciliatum, Gilia tricolor, and Matricaria discoidea—were rarely encountered, while the invasive Erigeron canadensis was common. Approximately 60% of species were shade-tolerant, 53% were insect-pollinated, and 30% were perennial or semi-perennial.
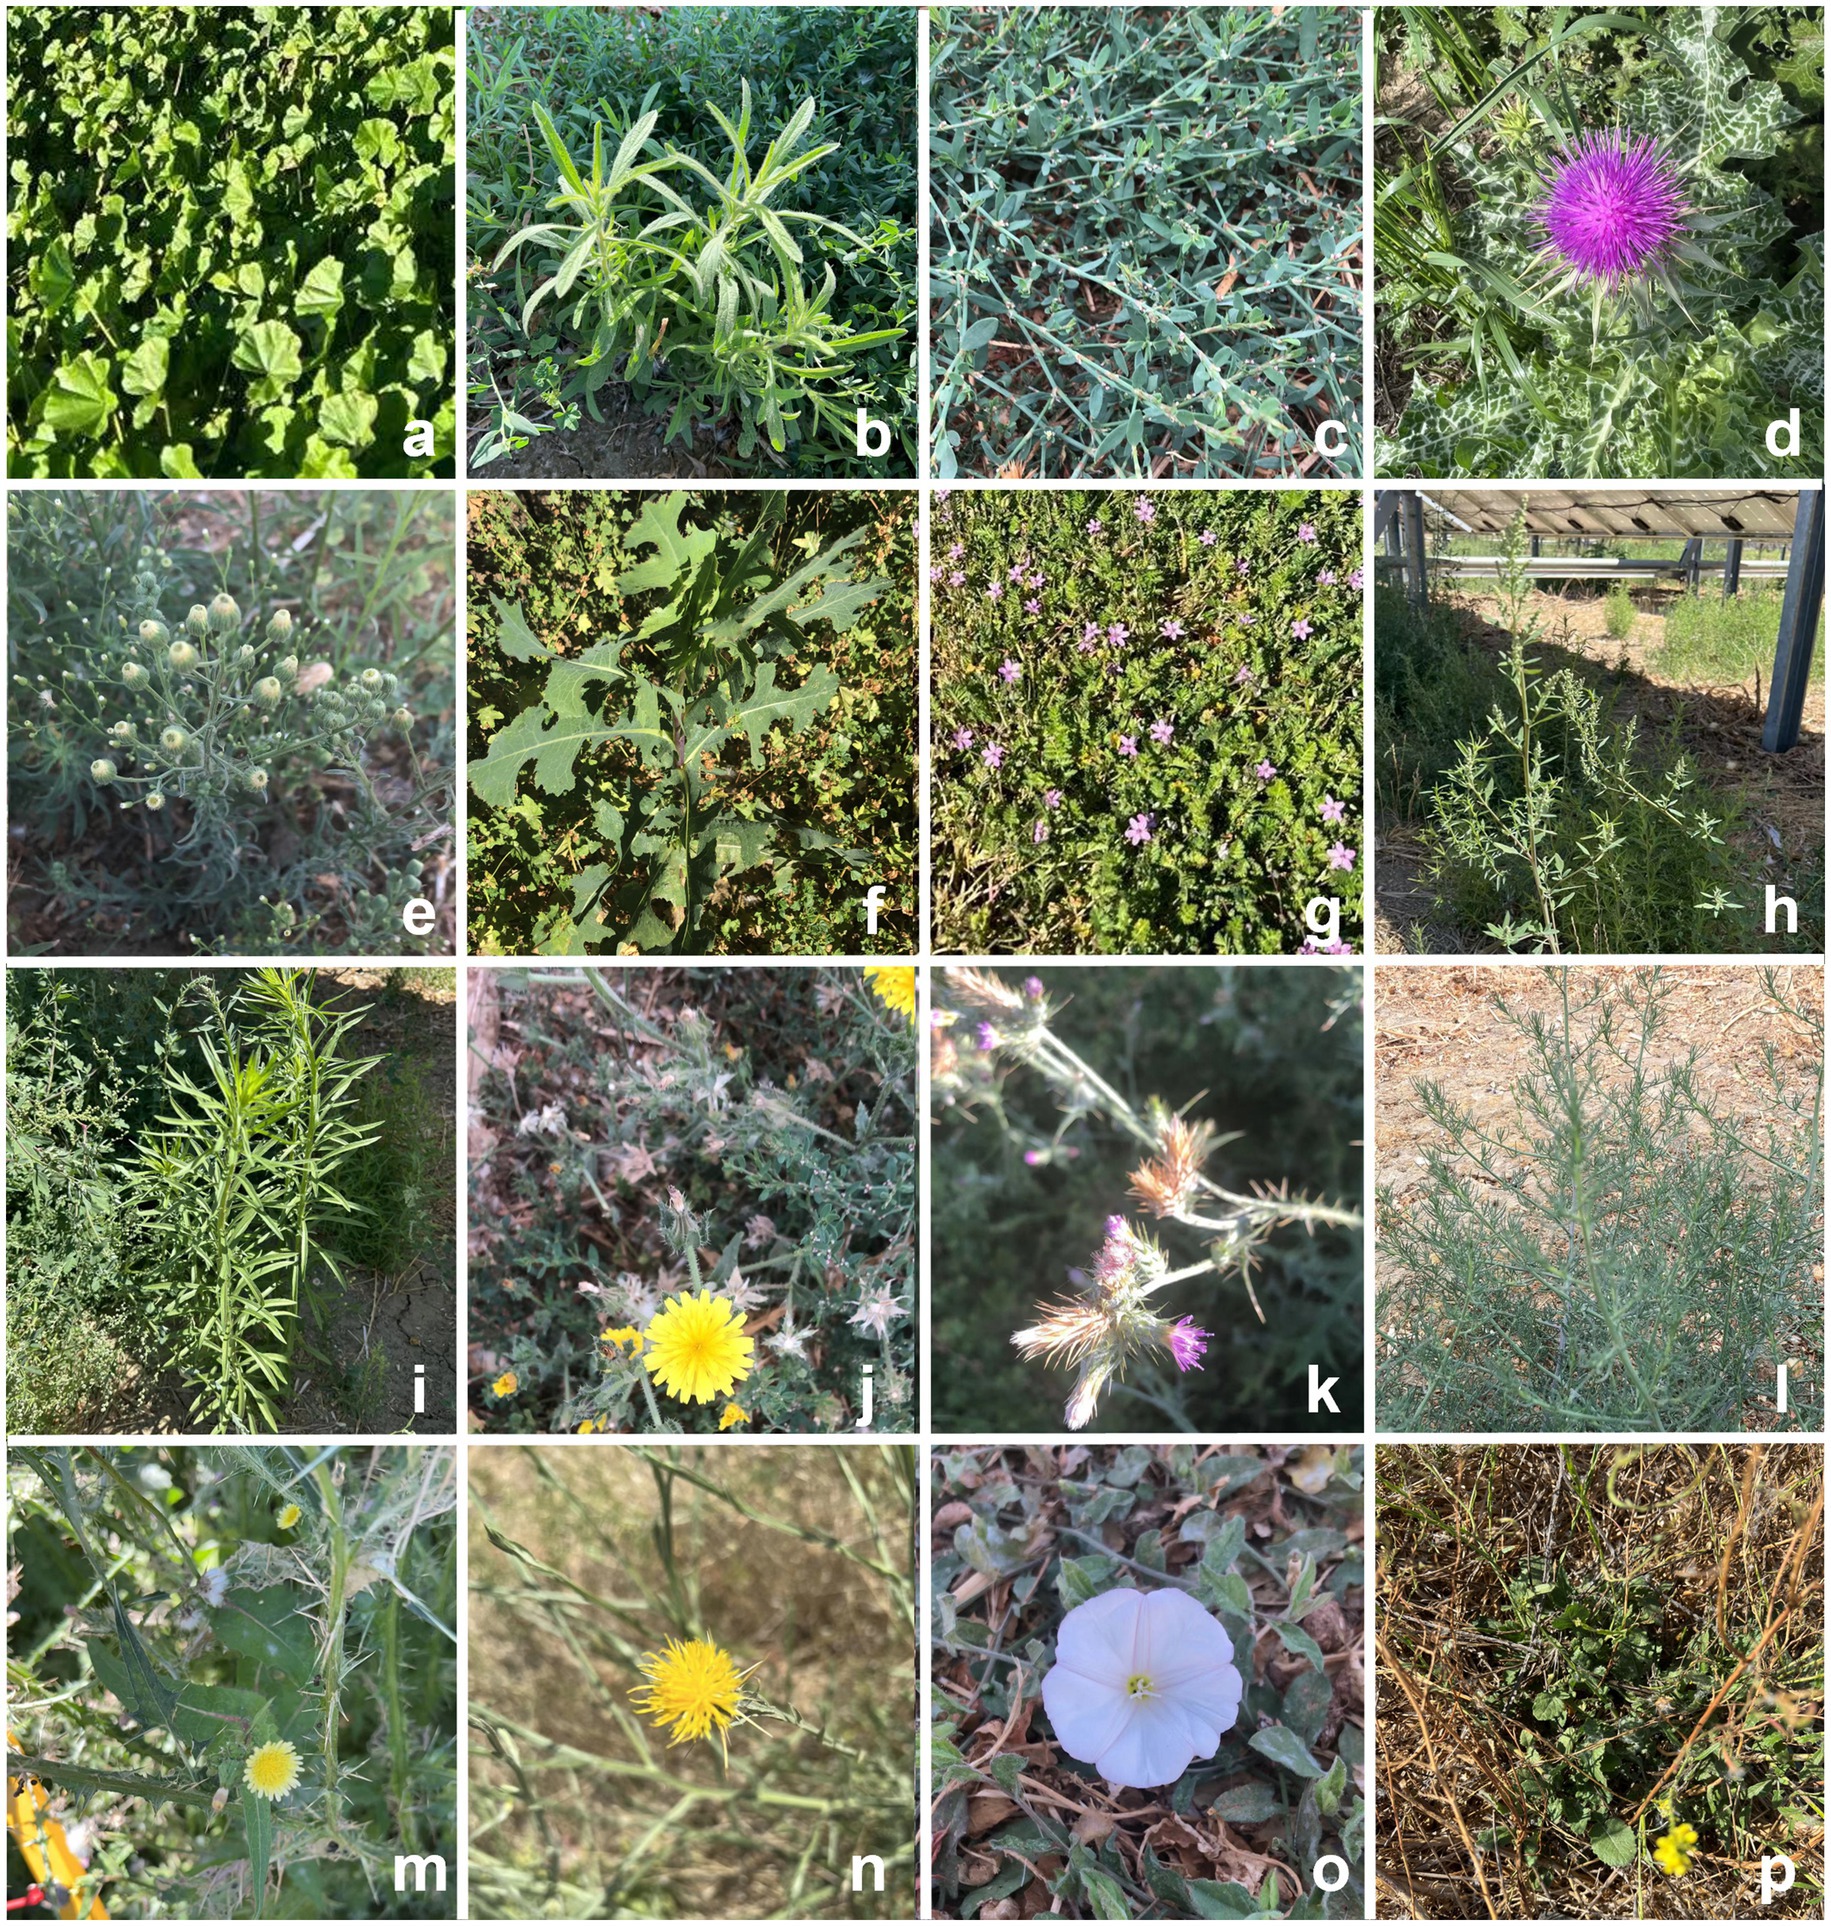
Figure 4. Photographs of 16 dominant broadleaves (forbs) at the UC DEEP: Malva neglecta (A), Dittrichia graveolens (B), Polygonum aviculare (C), Silybum marianum (D), Erigeron bonariensis (E), Lactuca serriola (F), Erodium cicutarium (G), Chenopodium album (H), Erigeron canadensis (I), Helminthotheca echioide (J), Carduus pycnocephalus (K), Salsola tragus (L), Sonchus oleraceus (M), Centaurea solstitialis (N), Convolvulus arvensis (O), Hirschfeldia incana (P).
The presence and coverage of certain broadleaves, such as Malva neglecta, Silybum marianum, and Erodium cicutarium, declined dramatically in March, July, and October following mowing events (p < 0.05) (Supplementary Figure S5 in Supplementary material 1). Mowing also caused notable reductions in the height and biomass of M. neglecta and Dittrichia graveolens (Supplementary Figure S7 in Supplementary material 1; Supplementary Table S3 in Supplementary material 2). While the blooming frequency of M. neglecta decreased from summer to autumn, the floral resources of Polygonum aviculare and Erigeron bonariensis displayed the opposite trend (p < 0.01) (Supplementary Table S4 in Supplementary material 2).
Aboveground biomass of certain species varied significantly across micro-patches. For example, both D. graveolens and P. aviculare exhibited greater biomass in near-array zones than the other two zones, while Lactuca serriola was most productive in FS (p < 0.05) (Supplementary Figure S9B in Supplementary material 1; Supplementary Tables S3, S4 in Supplementary material 2). Blooming frequencies also showed variation: M. neglecta bloomed more abundantly in NS, Erigeron bonariensis in AS and BS, and P. aviculare in MS (p < 0.05) (Supplementary Figure S9A in Supplementary material 1). However, no consistent patterns were observed for plant height (Supplementary Tables S3, S4 in Supplementary material 3).
Narrowleaves emerged in early winter and were absent between August and October, with peak presence and coverage in April and May when species identification was enabled due to spikelet development (Supplementary Figures S4M–T in Supplementary material 1; Supplementary Table S1 in Supplementary material 1). Avena fatua, Bromus hordeaceus, Bromus tectorum, Elymus repens, and Phleum pratense were observed only in NS; Hordeum murinum and Polypogon monspeliensis were exclusive to the near-array zone, whereas Festuca perennis and Pennisetum clandestinum were widespread across all micro-patches. Narrowleaf presence and coverage were significantly lower near-array (p < 0.05) (Supplementary Figure S7 in Supplementary material 1; Supplementary Tables S3, S4 in Supplementary material 2).
Two-dimensional NMDS achieved excellent fit (R2 = 0.982, stress = 0.135), with NMDS1 and NMDS2 explaining 60.9 and 30.8% of variability, respectively (Figures 5A–B). Species clustering was apparent near-array (between MS and AS) and within-array (between BS and FS), as confirmed by LDA (Figures 5C,D). PERMANOVA indicated significant seasonal and micro-patch effects on species composition (p < 0.0001), though centroids overlapped between (i) summer and autumn and (ii) MS and AS (Supplementary Figure S12 in Supplementary material 1; Supplementary Table S6 in Supplementary material 2).
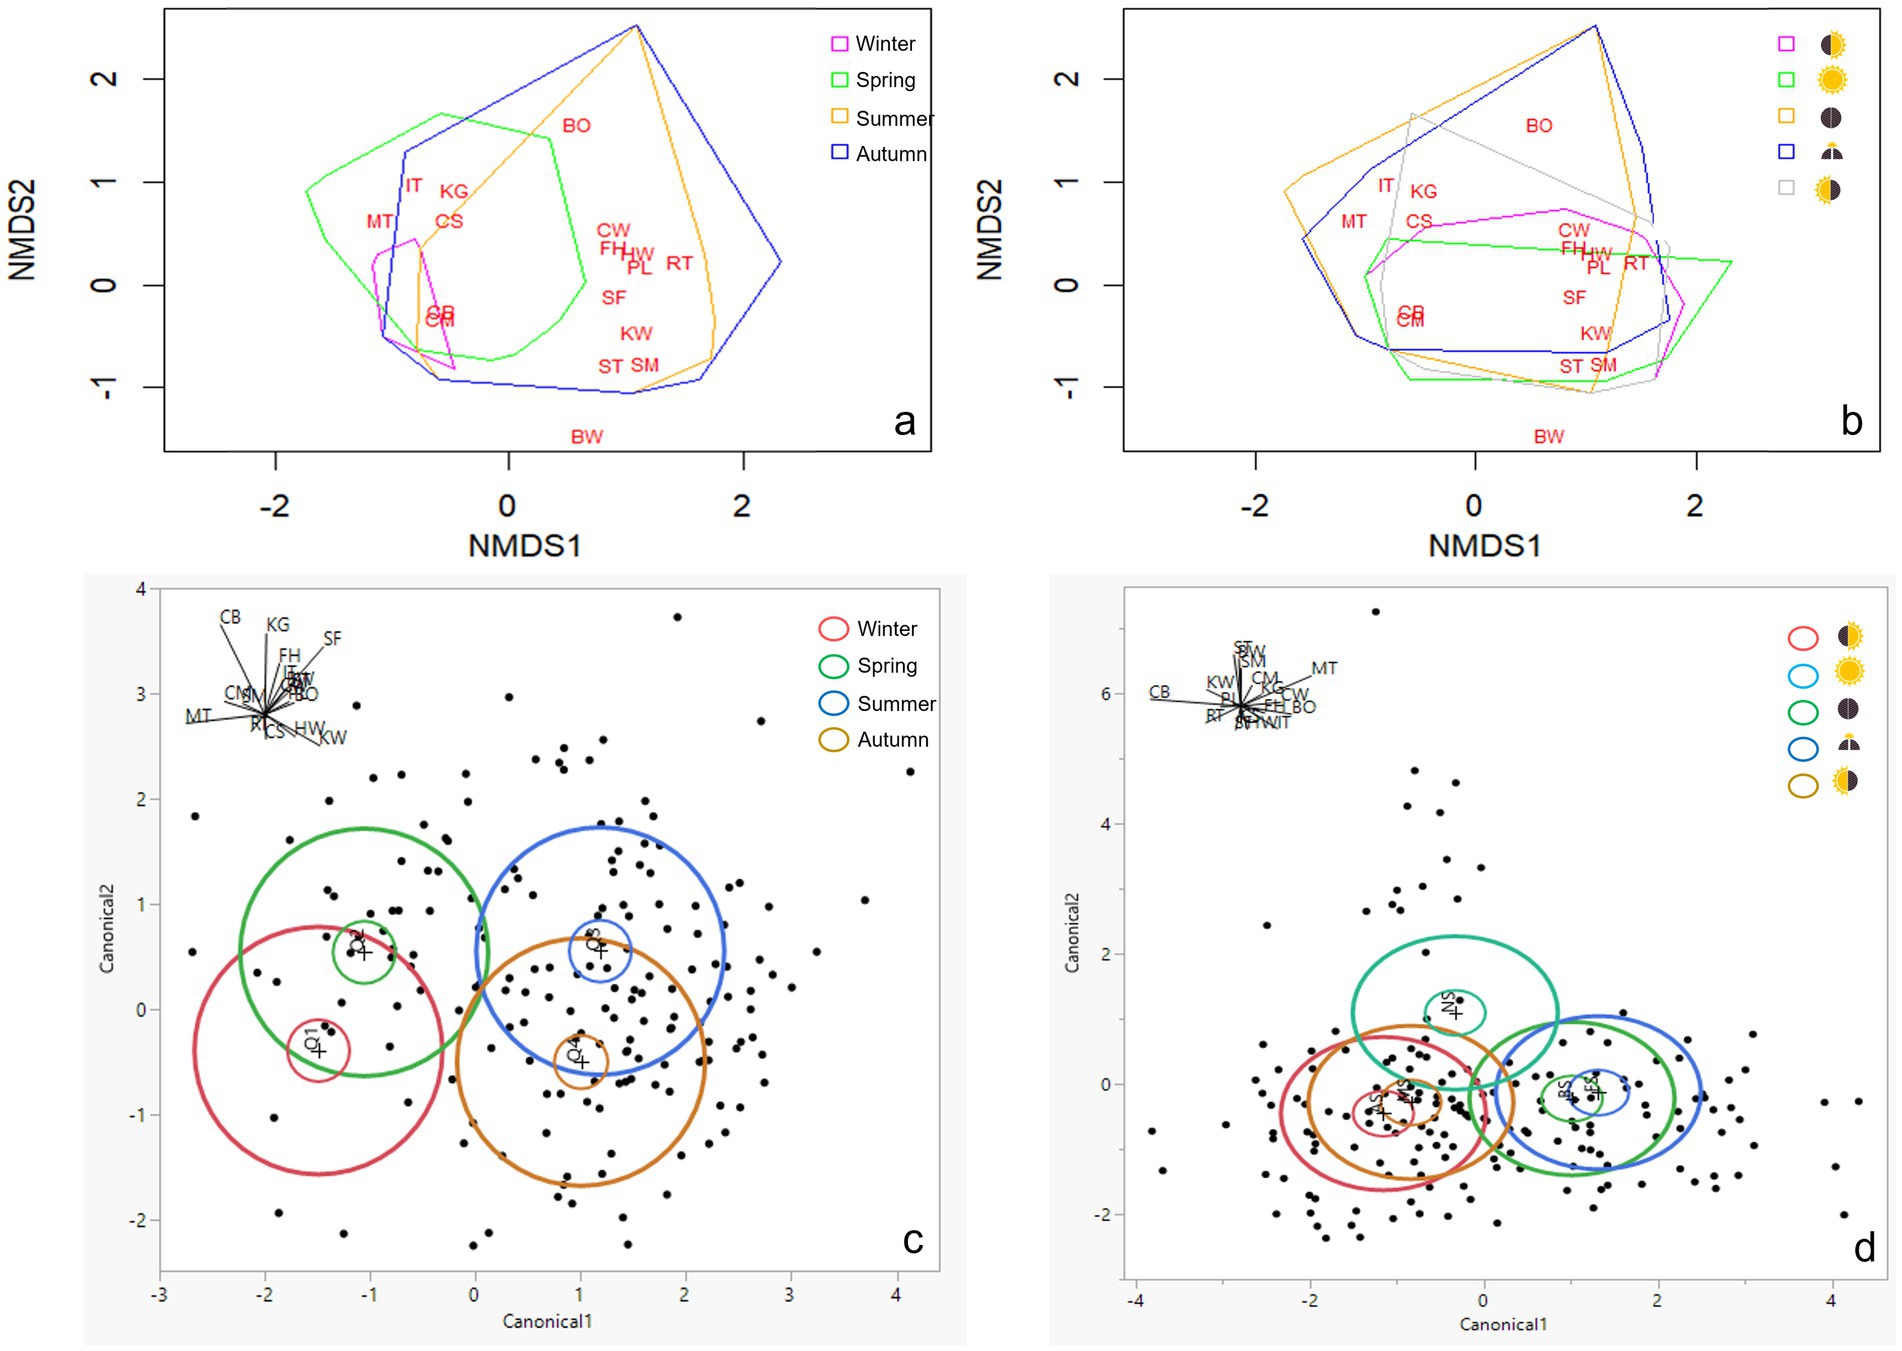
Figure 5. Two-dimensional non-metric multidimensional scaling (NMDS) plots (a, b) and linear discriminant analysis (LDA) plots (C,D) of vegetation composition for the four seasons (A,C) and the five micro-patches (B,D); No Shade (), AM Shade (), PM Shade (), AM & PM Shade (), and Full Shade (). Data dispersions were outlined by polygons in different colors. The R2 of non-metric fit is 0.982. *BO, Helminthotheca echioide; BW, Convolvulus arvensis; CB, Erodium cicutarium; CM, Malva neglecta; CS, Sonchus oleraceus; CW, Erigeron canadensis; FH, Chenopodium album; HW, Erigeron bonariensis; IT, Carduus pycnocephalus; KG, Poaceae; KW, Polygonum aviculare; MT, Silybum marianum; PL, Lactuca serriola; RT, Salsola tragus; SF, Dittrichia graveolens; SM, Hirschfeldia incana; ST, Centaurea solstitialis.
Species richness, diversity, and evenness reached the maximum in June, with the highest and lowest values in BS and near-array, respectively (Figures 6A,B; Supplementary Tables S5, S6 in Supplementary material 2). The coverage ratios of heliophilous-to-sciophilous and anemophilous-to-entomophilous species peaked in summer and autumn, with the highest values in AS and MS, respectively (Supplementary Figure S10 in Supplementary material 1). Indicator species analysis revealed early-season (e.g., S. marianum), late-season (e.g., H. echioides), and all-season (e.g., M. neglecta) groupings, as well as species characteristic of each micro-patch (Supplementary Table S2 in Supplementary material 1).
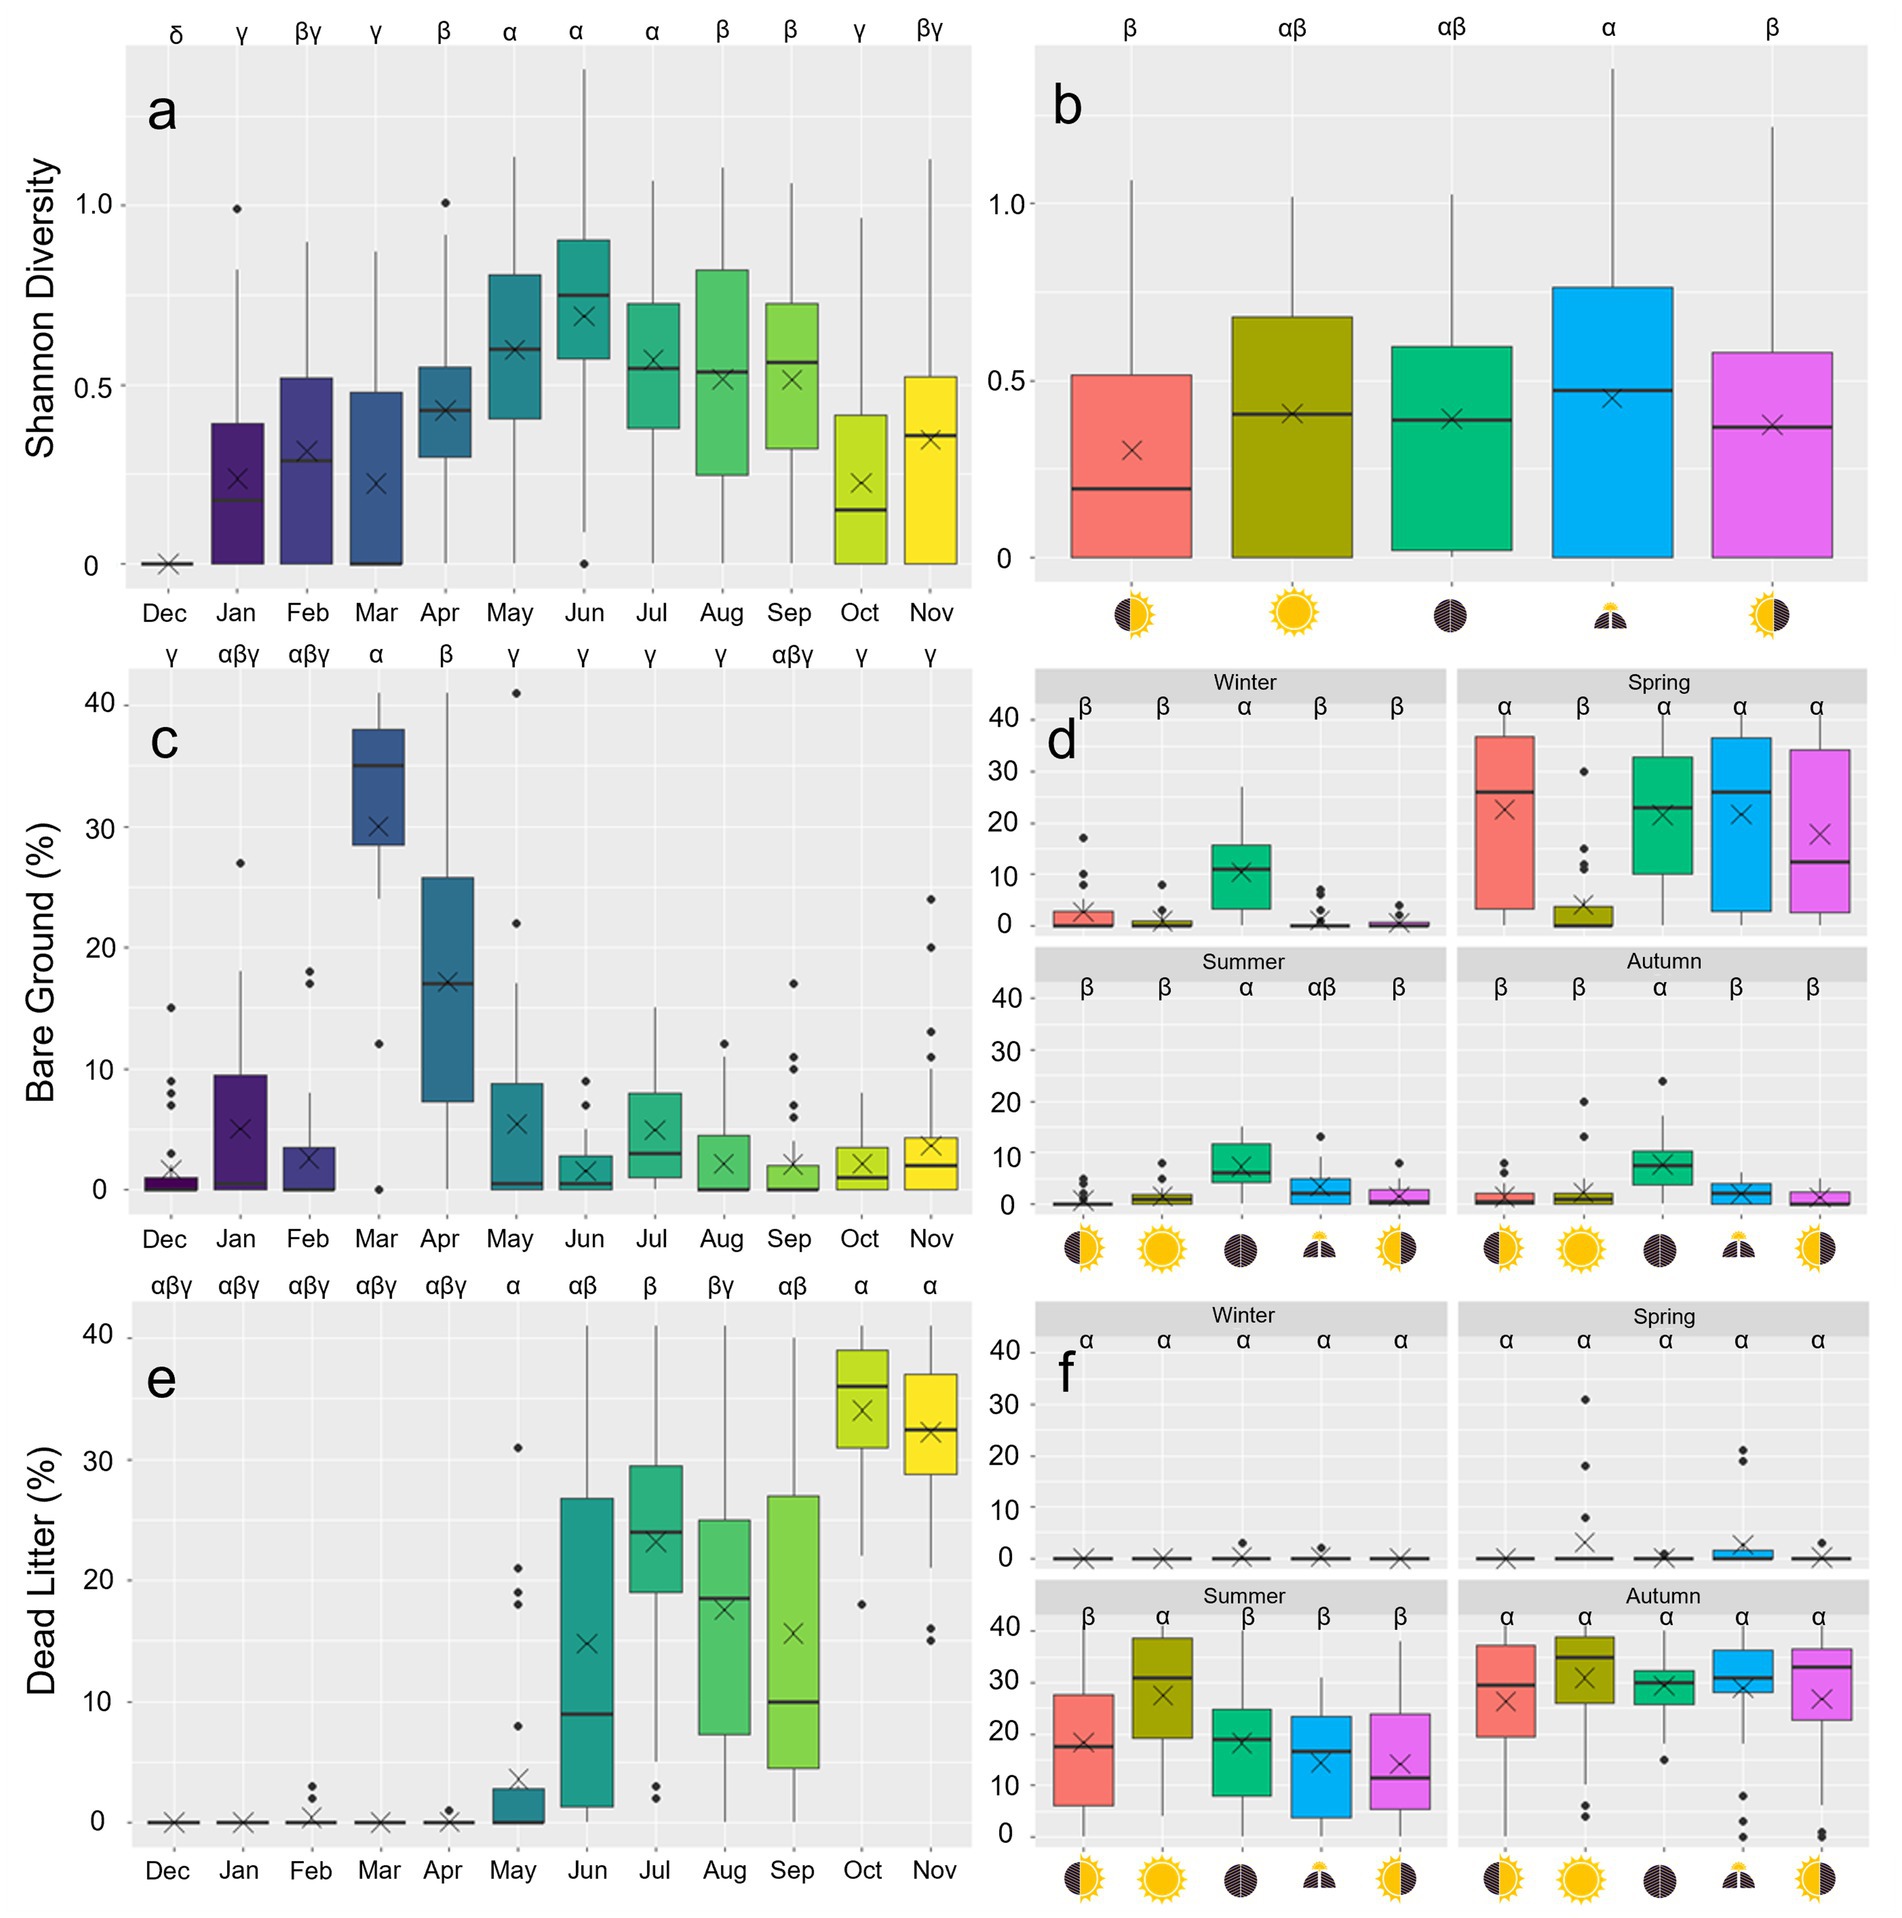
Figure 6. Boxplots of Shannon diversity (unitless) across 12 months (A) and five micro-patches (B). Boxplots of bareground coverage (%) across 12 months (C) and five micro-patches faceted by four seasons—winter, spring, summer, and autumn (D). Boxplots of dead litter coverage (%) across 12 months (E) and five micro-patches faceted by four seasons—winter, spring, summer, and autumn (F).*No Shade (), AM Shade (), PM Shade (), AM & PM Shade (), and Full Shade (). Statistical differences are labeled with Greek symbols (e.g., α, β, and γ).
The maximum height of the plant community peaked in summer and was the tallest in BS (110 cm ± 81.0 cm) (Supplementary Figure S1 in Supplementary material 1). However, live aboveground biomass of BS was 53–88% of the other micro-patches (Table 3). Bare ground exposure increased significantly in March and April after the first mowing event (p < 0.0001) and was consistently the highest in FS except during spring (Figures 6C,D; Supplementary Tables S5, S6 in Supplementary material 2). Dead litter began accumulating in May, and the coverage was 35% higher in NS than in the other micro-patches during summer (p < 0.05) (Figures 6E,F; Table 2).
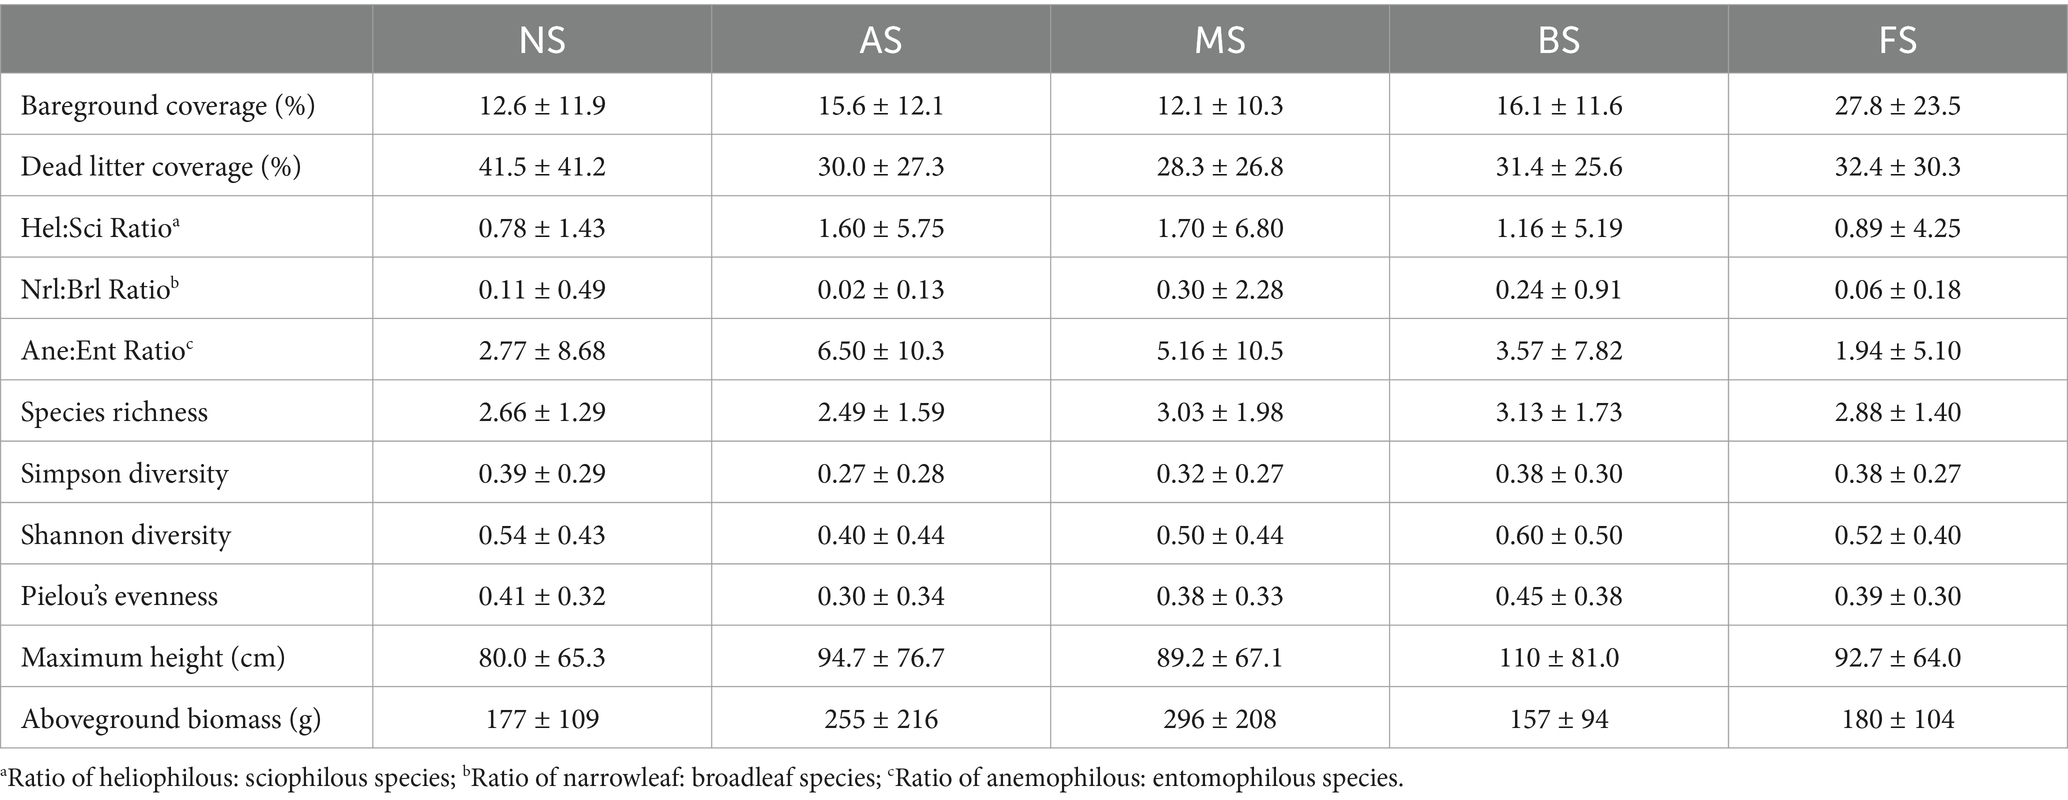
Table 2. Annual mean presence (%), canopy coverage (%), bloom frequency (%), mean height (cm), and live aboveground biomass (g) of the 16 dominant broadleaf plant species and grass taxa (combined), in order of decreasing presence (%), at the UC Davis Solar Farm (data collected monthly; December 2022 to November 2023).
4 Discussion
4.1 Microclimate
The shading and wind-sheltering effects of single-axis GPVs were evident across all micro-patches within the within-array and near-array zones (Armstrong et al., 2016; Fagnano et al., 2024). PAR was intercepted by 9, 12, 17, and 89% in MS, AS, BS, and FS, respectively, compared to NS (Figure 2B; Table 1). These reductions in sunlight exposure could be adjusted by deploying meteorological sensors at varying heights, enabling comparisons with values reported in other studies (Liu et al., 2019; Graham et al., 2021; Sturchio et al., 2024). Unlike fixed-tilt PV systems, the diurnal rotation of panels resulted in a 3% lower PAR in AS than MS (p < 0.05), attributed to the higher intensity of afternoon irradiance than morning conditions (Figures 2C,D). Additionally, this rotational design prevents permanent shadows; even FS received an annual mean PAR of 89 μmol m−2s−1 (Table 1; Moscatelli et al., 2022; Uldrijan et al., 2022; Vaverková et al., 2022). A similar trend was observed for wind speed, with NS recording 1.30, 1.41, 1.44, and 1.85 times the values of MS, AS, BS, and FS, respectively (Figure 2A; Table 1). These values exceed the range (1.3–1.6 times) observed beneath fixed-tilt panels at 0.5–1.2 m heights (Hassanpour Adeh et al., 2018), corroborating the findings by Li et al. (2024) that single-axis tracking systems may be more effective in reducing airflow. However, the differences in wind speed across micro-patches were only marginally significant, likely due to the dominance of north–south winds that align with the orientation of module strings, reducing cross-panel disruptions (Oomen, 2024).
Air temperature, as well as derived variables VPD and GDD, were primarily driven by seasonal trends instead of micro-patch types (Supplementary Figures S1A–D in Supplementary material 2; Yue et al., 2021; Sturchio et al., 2022; Yavari et al., 2022). Contrary to our expectations, AS, rather than FS, exhibited the lowest air temperature, VPD, and GDD, along with the most dampened variations among all five micro-patches (Table 1). For instance, while AS was fully exposed to sunlight in the morning and experienced similar air temperatures to NS (AS: 15.0 ± 7.15°C; NS: 15.1 ± 7.37°C), afternoon shading resulted in AS being on average 0.5°C cooler than NS (Figures 2E–H). By contrast, although afternoon shading also occurred in BS and FS, they were on average 0.7°C and 0.5°C warmer than NS, respectively, attributable to a combination of heat dissipation from adjacent operating solar panels and reduced wind speeds, counteracting the cooling and humidifying effects of cast shadows (Hassanpour Adeh et al., 2018; Wu et al., 2022). These findings suggest that shading may not always mitigate evaporative demand for vegetation during periods of high solar irradiance—particularly for stems situated very close to the panels (Makaronidou, 2020; Fagnano et al., 2024). The nighttime “PV heat insulation” hypothesis proposed by Armstrong et al. (2016)—whereby fixed-tilt panels obstruct skyview and constrain the escape of long-wave outgoing radiation—was not observed in this study. Instead, AS remained the coolest micro-patch, albeit without statistical significance, likely related to the minimal energy absorbed by the ground surface during the daytime (Table 1).
Unlike air temperature, the topsoil temperature (0.1 m depth) of NS was consistently the warmest (up to 4.9°C) throughout the entire year (Table 1). However, the temperatures of near-array micro-patches were still lower than those of within-array (Figure 3A). These patterns suggest that impacts of emitted long-wave radiation from PV panels still exist but diminish with distance (Marrou et al., 2013b; Wu et al., 2022). In contrast, VWC exhibited notable seasonal variations (Figure 3C). In December and February, the diversion and redistribution of precipitation by PV panels reduced water inputs to the FS; this “umbrella” effect was mitigated during periods of ample rainfall in January and March through three potential pathways: (i) belowground hydrological processes, (ii) lateral transfer of concentrated fluxes via micro-gullies and capillaries, and (iii) water flow along driplines and supporting frames (Armstrong et al., 2016; Elamri et al., 2018; Choi et al., 2020; Makaronidou, 2020; Sturchio et al., 2024). As the Mediterranean climate entered its dry season in April, with precipitation dropping to nearly zero, a combination of relatively low soil temperatures and reduced evapotranspiration allowed FS to retain 3–7% more soil moisture than other micro-patches through August (Figure 3C; Yang et al., 2017; Hassanpour Adeh et al., 2018; Barron-Gafford et al., 2019; Tanner et al., 2020; Lambert et al., 2021). On an annual average, VWCs of FS (13.9%) and BS (13.0%) were 0.6–2% higher than in other micro-patches (Figure 3B; Table 1). However, these values were much lower than the range of 11–34% reported in other studies conducted on single-axis or fixed-tilt PV systems over 2 m in height in less arid regions (Liu et al., 2019; Yue et al., 2021; Fagnano et al., 2024).
4.2 Vegetation
Consistent with Vaverková et al. (2022), the tracking GPV infrastructure created favorable conditions for annual broadleaves (Supplementary Table S1 in Supplementary material 1). However, the formation of repeating mosaics of unique environmental zones—that is, micro-patches—played a significant role in shaping vegetation assemblages, driven largely by adaptations to the PAR gradient (Liu et al., 2019; Graham et al., 2021; Kannenberg et al., 2023; McCall et al., 2024). Among dominant broadleaves, heliophilous species such as C. arvensis, C. solstitialis, and H. incana were confined to the NS micro-patch, while E. cicutarium was notably absent within-array (Figure 5B). In contrast, sciophilous species such as C. pycnocephalus and H. echioides were restricted to within-array zones, whereas E. bonariensis and L. serriola exhibited higher abundances near-array (Supplementary Figure S6 in Supplementary material 1). As highlighted by LDA, the distinct composition across the three broader zones (within-array, near-array, and beyond-array) was pronounced (Figure 5D). Nevertheless, the coverage ratio of heliophilous-to-sciophilous species did not show an increasing trend along gradients in micro-patches with more extensive skyviews (Supplementary Figure S10A in Supplementary material 1), suggesting that factors like interspecific, asymmetric competition may also play a key role (Uldrijan et al., 2022). For instance, P. aviculare and D. graveolens appeared to benefit from the morning and afternoon shade of MS and AS, respectively, during summer and autumn, as evidenced by their significantly higher presence, coverage, and biomass (Supplementary Figures S6, S9 in Supplementary material 1). In the early season, E. cicutarium formed dense, basal “carpet” in MS and AS, preempting available space and suppressing less competitive cohorts such as annual grasses and S. marianum (Supplementary Figures S6, S7 in Supplementary material 1). Consequently, species diversity and evenness near-array were both approximately 19% lower than in the other two zones (Table 3). The higher species richness observed in BS (3.13) than in FS (2.88) and NS (2.66) aligned with Liu et al. (2019), suggesting that the moderate shading (> 15%) imposed by PVs may promote niche partitioning of flora.
Although no consistent patterns of height at the species level were observed, the maximum height of the vegetation stand was lowest in NS (80 cm) and highest in BS (110 cm)—the only micro-patch with vegetation exceeding the lower leading edge of PV panels (106.7 cm) (Supplementary Figure S11B in Supplementary material 1). Beyond phenotypic plasticity, such as stem elongation to enhance light capture (Weigelt et al., 2021; Kannenberg et al., 2023), this variation is more likely tied to the relative abundance of vegetation assemblages. In particular, six of the eight tall broadleaf species (mean height > 30 cm) were tolerant of partial shade, with C. album and E. bonariensis being particularly prevalent in BS (Table 2; Supplementary Figure S6 in Supplementary material 1; Uldrijan et al., 2021; Uldrijan et al., 2022). Unlike findings from studies at conventional fixed-tilt GPVs, the annual mean aboveground biomass showed no significant difference between within-array patches (FS: 180 g/m2; BS: 157 g/m2) and beyond-array patches (NS: 177 g/m2) (Supplementary Figure S11A in Supplementary material 1; Hassanpour Adeh et al., 2018; Elamri et al., 2018). However, AS was 46 and 73% more productive than MS and the other micro-patches (Table 3), aligning with Sturchio et al. (2024), who reported that reduced heat stress from afternoon shading benefits community yield. The availability of overall floral resources provided by dominant broadleaves did not vary significantly across micro-patches, except the most abundant E. bonariensis, M. neglecta, and P. aviculare, which were characterized by multiple inflorescences per stem and exhibited blooming frequencies congruent with their presences (Supplementary Figure S8 in Supplementary material 1). In contrast to Uldrijan et al. (2021) on fixed-tilt GPVs, the highest coverage ratio of anemophilous-to-entomophilous species was observed in MS and AS—rather than FS—where P. aviculare and D. graveolens predominated, respectively, during the mid- to late-growing season (Supplementary Figure S10B in Supplementary material 1; Brownsey et al., 2013). Their wind-dispersed pollen poses potential challenges: (i) deposition on PV module surfaces, impairing power generation efficiency and increasing maintenance costs and (ii) triggering human allergies (Sanz Saiz et al., 2020; Nowak et al., 2023).
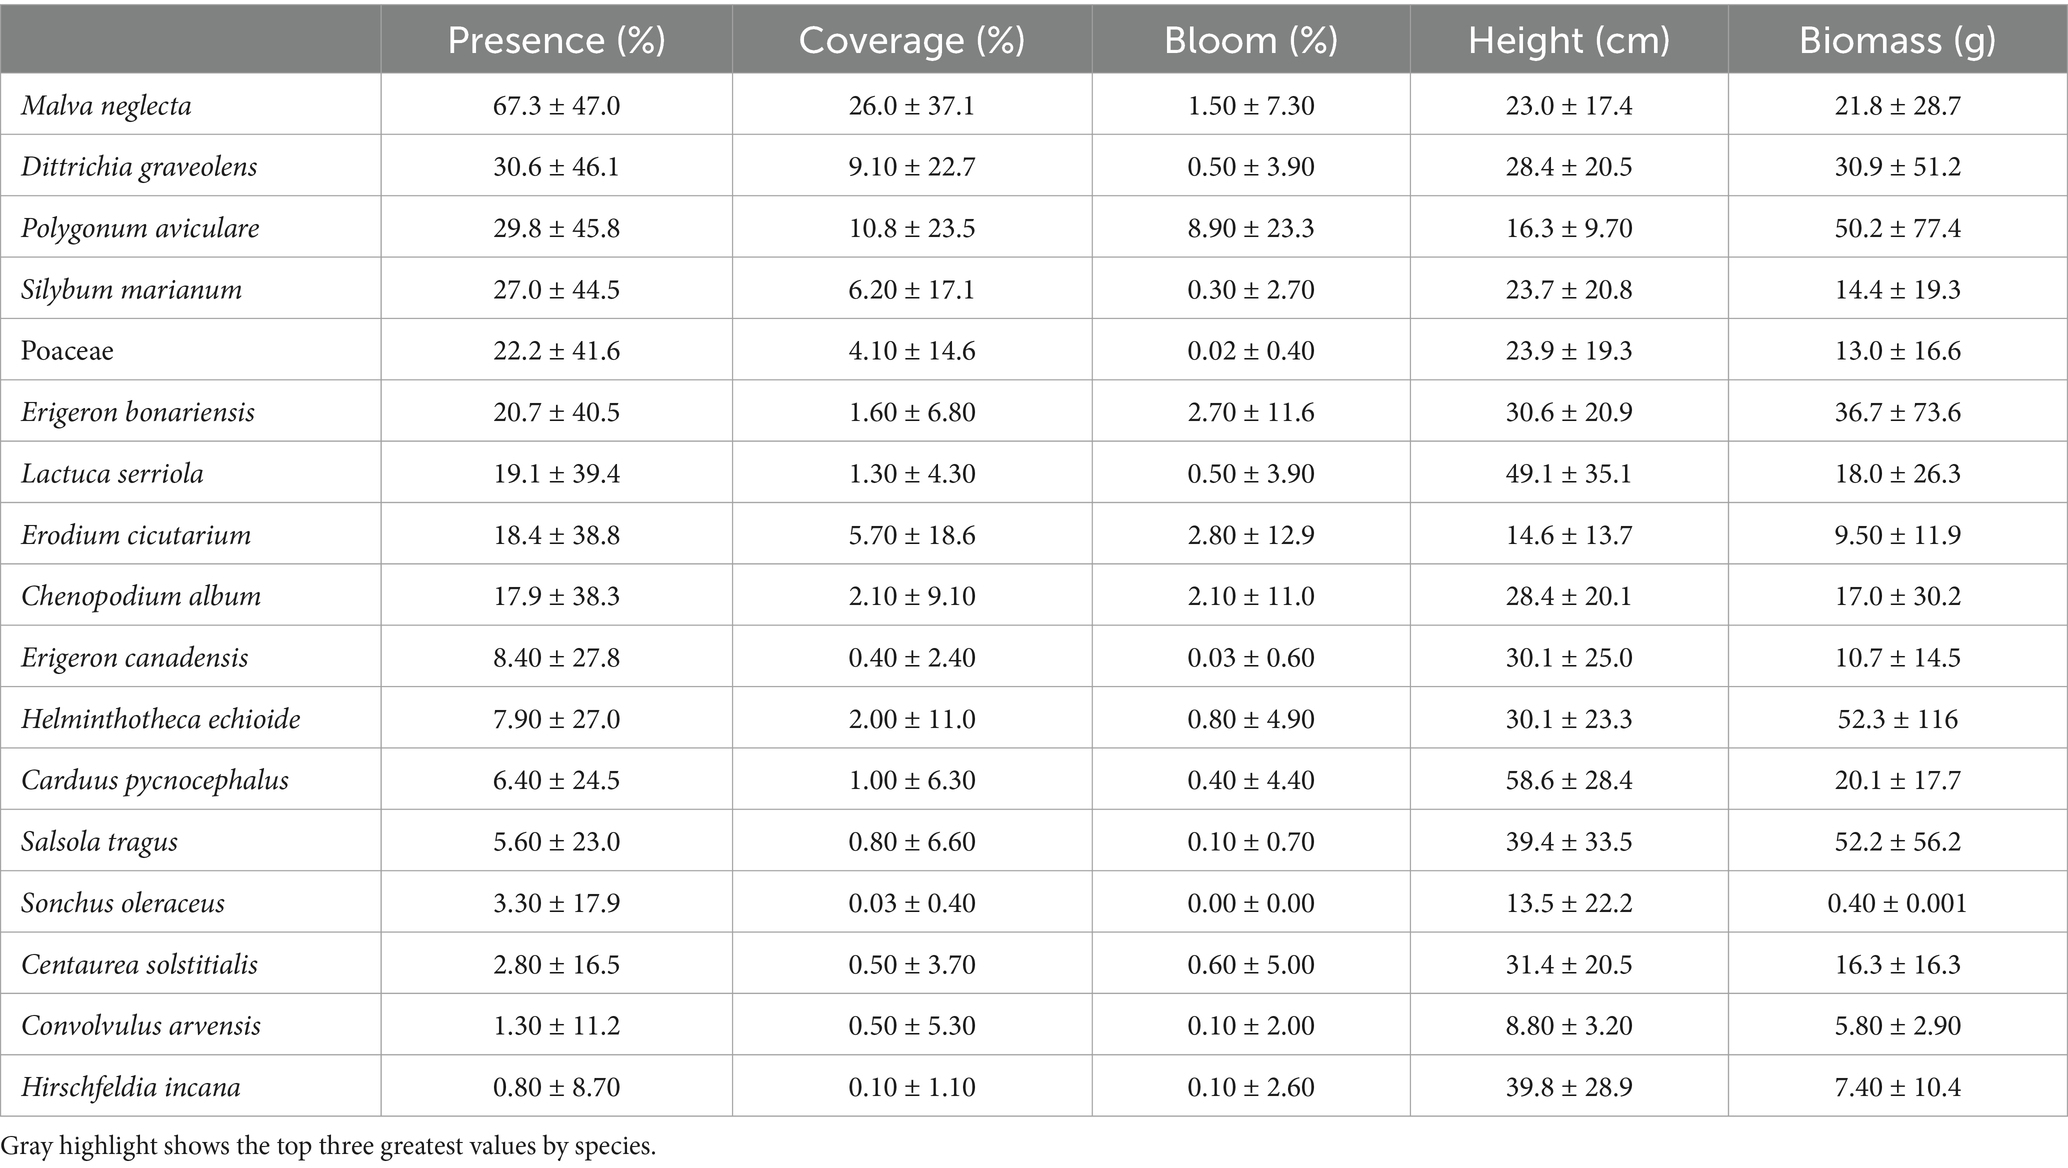
Table 3. The mean value ± standard deviation of vegetation community indicators on the five micro-patches: No Shade (NS), AM Shade (MS), PM Shade (AS), AM & PM Shade (BS), and Full Shade (FS).
Statistical analysis using GLMMs revealed significant spatiotemporal variations in vegetation coverage. Bare ground exposure was most pronounced in (i) March, coinciding with the first mowing event, and (ii) FS, where low germination and high mortality rates affected species unable to tolerate extreme sunlight deficiency, except in spring (Figures 6C,D; Schindler et al., 2018; Lambert et al., 2021; Uldrijan et al., 2022). Vegetation coverage remained relatively stable throughout the entire year with annual means exceeding 80% on most micro-patches (NS: 87.4%; AS: 84.4%; MS: 87.9%; BS: 85.9%) except FS (72.2%) (Table 3). These are comparable to the 80.5% documented for within-array patches by Beatty et al. (2017) but lower than the 90.5% measured in July by Liu et al. (2019). The much lower coverage reported for NS in Liu et al. (2019) (13.4%) likely reflects their lower annual precipitation (200 mm) of the study site compared to Davis (429 mm), underscoring the role of aridity in amplifying the benefits of solar arrays on vegetation productivity (Barron-Gafford et al., 2019). Dead litter accumulation began in May as early-season graminoids (e.g., H. murinum and P. clandestinum) and forbs (e.g., C. pycnocephalus, E. cicutarium, and S. marianum) entered senescence (Figure 6E; Supplementary Figures S5, S7 in Supplementary material 1). NS was the most drought-prone micro-patch, characterized by the warmest soil temperature and the fastest moisture depletion, resulting in the highest dead litter coverage during summer (Figure 3; Armstrong et al., 2016). Broadleaf species conducive to burning were scarce, except near-array where relatively flammable species such as D. graveolens and S. tragus dominated during summer and autumn (Bernau and Eldredge, 2018). Although annual grasses (e.g., B. hordeaceus, B. tectorum, and A. fatua) are significant contributors to layered fuel beds that can easily ignite and propagate fire (Vaverková et al., 2022), their occurrences were either rare—particularly within-array—or did not overlap with peak drought periods. As a result, the fire hazard associated with these grasses may remain minimal under the current conditions.
4.3 Management
At the UC DEEP where weed pressure is intensive, adhering to a mowing-only strategy poses risks in the following six aspects:
1. Energy: Fast-growing, tall weeds can reduce PV panel efficiency by casting shadows between mowing intervals (Meyer et al., 2023).
2. Wildfire: Dried biomass from prodigious weeds can accumulate as fuel, threatening infrastructure, especially in hot, arid regions (Vaverková et al., 2022).
3. Accessibility: Overgrown weeds can impede operations and maintenance (O&M) personnel, increasing the time and costs of service.
4. Biodiversity: Competitive weeds undermine native plant diversity, degrading habitat quality for wildlife foraging and breeding (Nordberg et al., 2021).
5. Ingression: Aggressive weeds and their associated pests/pathogens can encroach on neighboring arable lands and rangelands, reducing crop yields and harming livestock health (Uldrijan et al., 2021).
6. Esthetics: Dense monocultures of invasive weeds may create an unkempt appearance, undesirable for local communities and stakeholders who increasingly value native plant-based landscaping (Zadegan et al., 2008).
Moreover, mowing can also inadvertently exacerbate weed problems. For species that propagate via underground rhizomes or tubers (e.g., thistles, lettuces, and fleabanes), mowing may encourage resprouting from residual stems. If conducted during seed production phases of the life cycle, mowing can instead facilitate the spread of seeds (Bossard and Lichti, 2000). These factors have contributed to the low diversity of native species at the UC DEEP after 7 years of operation.
While eradicating all noxious weeds on-site may be unrealistic, adopting alternative approaches may help enhance maintenance efficiency and socio-ecological benefits (Randle-Boggis et al., 2020; Uldrijan et al., 2023). No single method can effectively manage all noxious weeds across the diverse micro-patches without tradeoffs. Instead, multiple control practices tailored to specific site conditions should be implemented in parallel or sequence for optimal outcomes (see Note 2 in Supplementary material 1 for alternative options and Supplementary Table S3 in Supplementary material 1 for their effectiveness against species observed at the UC DEEP) (DiTomaso et al., 2013; US Fish and Wildlife Service, 2014).
Given the scale of the site (>1 acre) and specific challenges, such as the toxicity of certain broadleaf species to grazing livestock, we recommend that O&M personnel at the UC DEEP, or similar GPVs, implement a targeted approach. Specifically, repeated shallow cultivation combined with herbicide spot-spraying could be conducted over at least 2 years to deplete the weed seed bank, followed by the sowing of sacrificial cover crops to proactively occupy the ground surface. Extra resources should be allocated to BS due to its tallest vegetation profiles and highest species richness, and to the near-array zone to address potential fuel loads and pollen spillover. Careful planning and execution of control measures are essential to ensure they align with site performance goals and avoid unintended impacts on PV modules or surrounding ecosystems (McCall et al., 2023).
For solar energy developers aiming to balance low long-term maintenance costs, biodiversity net gain, esthetic enhancement, and heritage preservation, the establishment of a permanent native vegetation community offers an ideal solution. Such vegetation should at least meet several criteria: (i) competitive but non-invasive, (ii) short-statured to remain below the leading edge of PV panels, and (iii) fire-retardant, featuring traits that decrease flammability, such as high live fine fuel moisture and low levels of volatiles, waxes, and resins (Blackhall and Raffaele, 2019). By integrating these strategies, GPV can realize a confluence of ecosystem services beyond clean energy generation, fostering resilient and multifunctional landscapes.
4.4 Study limitation and research opportunity
This study has several limitations that warrant consideration. First, the findings are based on a single year of data collection, which may not capture interannual variability driven by climatic fluctuations or successional changes in vegetation. Additionally, the study was conducted at a single site, limiting the generalizability of the results to other GPV installations with different climate, soil, and ecological conditions. The exclusive focus on a single management practice—mowing—further constrains the scope, as alternative strategies such as grazing, herbicide application, or integrated approaches may yield different outcomes. Moreover, the fixed height and depth of microclimate measurements, while sufficient for characterizing surface conditions, may overlook vertical gradients and subsurface processes critical to ecosystem functioning.
Future research should prioritize multi-year or long-term monitoring to better understand temporal dynamics and their implications for vegetation management and ecosystem services (Lambert et al., 2021). Expanding studies to include GPVs in diverse climate regions, soil types, and array configurations—such as elevated, bifacial, or dual-axis panels—would enhance the applicability of findings across various solar installations. Additionally, incorporating a wider range of management practices and optimizing microclimate measurement protocols to capture more comprehensive profiles could provide deeper insights into the interplay between tracking PV systems, microclimate, and vegetation dynamics.
5 Conclusion
Our study is the first to identify five distinct micro-patches and evaluate their characteristic microclimate patterns and vegetation communities within a single-axis GPV in a Mediterranean climate. We found that light intensity, wind flow, and soil temperature were significantly reduced, while volumetric water content was retained, creating microclimate heterogeneity akin to that observed in conventional fixed-axis systems. However, panel rotation further introduced subtle diurnal variations in air temperature and vapor pressure deficit, highlighting temporal variability. This mosaic of micro-patch environments shaped vegetation assemblages, resulting in distinct species composition, structure, and productivity primarily driven by irradiance gradients and interspecific competition. Moderate shading in certain micro-patches enhanced diversity through niche differentiation, while nutrient-rich soils from agricultural legacies and inadequate management allowed high-growing, aggressive species to dominate. These species present challenges to power generation, ecological integrity, and socioeconomics, emphasizing the need for micro-patch-specific strategies to effectively implement control over exotic, noxious weeds and optimize ecosystem services.
Data availability statement
The original contributions presented in the study are included in the article/Supplementary material, further inquiries can be directed to the corresponding authors.
Author contributions
YL: Writing – original draft, Writing – review & editing. AA: Writing – review & editing. CS: Writing – review & editing. NK: Writing – review & editing. RH: Writing – original draft, Writing – review & editing.
Funding
The author(s) declare that financial support was received for the research, authorship, and/or publication of this article. This study was supported by Electric Power Research Institute (EPRI), Award/Grant Number 10014423.
Acknowledgments
The authors express their gratitude to Kathleen Ave (Sacramento Municipal Utilities District, Sacramento, CA, USA) and Jessica Fox (Electric Power Research Institute, Palo Alto, CA, USA) for funding that made this project possible. They also acknowledge funding from the University of California Office of the President’s (Award A24-1267) California Climate Action Seed Grant.
Conflict of interest
The authors declare that the research was conducted in the absence of any commercial or financial relationships that could be construed as a potential conflict of interest.
Publisher’s note
All claims expressed in this article are solely those of the authors and do not necessarily represent those of their affiliated organizations, or those of the publisher, the editors and the reviewers. Any product that may be evaluated in this article, or claim that may be made by its manufacturer, is not guaranteed or endorsed by the publisher.
Supplementary material
The Supplementary material for this article can be found online at: https://www.frontiersin.org/articles/10.3389/frsus.2025.1497256/full#supplementary-material
References
Al-Agele, H. A., Proctor, K., Murthy, G., and Higgins, C. (2021). A case study of tomato (Solanum lycopersicon var. legend) production and water productivity in agrivoltaic systems. Sustain. For. 13:2850. doi: 10.3390/su13052850
Armstrong, A., Ostle, N. J., and Whitaker, J. (2016). Solar park microclimate and vegetation management effects on grassland carbon cycling. Environ. Res. Lett. 11:074016. doi: 10.1088/1748-9326/11/7/074016
Awasthi, A., Shukla, A. K., Dondariya, C., Shukla, K. N., Porwal, D., and Richhariya, G. (2020). Review on sun tracking technology in solar PV system. Energy Rep. 6, 392–405. doi: 10.1016/j.egyr.2020.02.004
Barron-Gafford, G. A., Minor, R. L., Allen, N. A., Cronin, A. D., Brooks, A. E., and Pavao-Zuckerman, M. A. (2016). The photovoltaic Heat Island effect: larger solar power plants increase local temperatures. Sci. Rep. 6:35070. doi: 10.1038/srep35070
Barron-Gafford, G. A., Pavao-Zuckerman, M. A., Minor, R. L., Sutter, L. F., Barnett-Moreno, I., Blackett, D. T., et al. (2019). Agrivoltaics provide mutual benefits across the food–energy–water nexus in drylands. Nature Sustain. 2, 848–855. doi: 10.1038/s41893-019-0364-5
Bates, D., Maechler, M., Bolker, B., Walker, S., Christensen, R. H. B., Singmann, H., et al. (2015). Package ‘lme4’. Convergence 12:2. doi: 10.18637/jss.v067.i01
Beatty, B., Macknick, J., McCall, J., Braus, G., and Buckner, D. (2017). Native vegetation performance under a solar PV array at the National Wind Technology Center (no. NREL/TP-1900-66218). Golden, CO: National Renewable Energy Lab. (NREL).
Bernau, C. R., and Eldredge, E. P. (2018). Plant guide for prickly Russian thistle (Salsola tragus L.). Fallon, Nevada: USDA-Natural Resource Conservation Service, Great Basin Plant Materials Center.
Blackhall, M., and Raffaele, E. (2019). Flammability of Patagonian invaders and natives: when exotic plant species affect live fine fuel ignitability in wildland-urban interfaces. Landsc. Urban Plan. 189, 1–10. doi: 10.1016/j.landurbplan.2019.04.002
Bossard, C., and Lichti, R. (2000). Carduus Pycnocephalus, L. Invasive plants of California’s wildlands. University of California Press: Los Angeles, CA, 86–90.
Brooks, M., Bolker, B., Kristensen, K., Maechler, M., Magnusson, A., and McGillycuddy, M. (2023). Package ‘glmmtmb’. R Packag Vers 1:7. doi: 10.32614/RJ-2017-066
Brownsey, R., Kyser, G. B., and DiTomaso, J. M. (2013). Stinkwort is rapidly expanding its range in California. Calif. Agric. 67, 110–115. doi: 10.3733/ca.v067n02p110
Choi, C. S., Cagle, A. E., Macknick, J., Bloom, D. E., Caplan, J. S., and Ravi, S. (2020). Effects of revegetation on soil physical and chemical properties in solar photovoltaic infrastructure. Front. Environ. Sci. 8:140. doi: 10.3389/fenvs.2020.00140
Choi, C. S., Macknick, J., Li, Y., Bloom, D., McCall, J., and Ravi, S. (2023). Environmental co-benefits of maintaining native vegetation with solar photovoltaic infrastructure. Earth's. Future 11:e2023EF003542. doi: 10.1029/2023EF003542
De Caceres, M., Jansen, F., and De Caceres, M. M. (2016). Package ‘indicspecies’. Indicator 8. doi: 10.32614/CRAN.package.indicspecies
Delignette-Muller, M. L., and Dutang, C. (2015). Fitdistrplus: an R package for fitting distributions. J. Stat. Softw. 64, 1–34. doi: 10.18637/jss.v064.i04
DiTomaso, J. M., Kyser, G. B., Oneto, S. R., Wilson, R. G., Orloff, S. B., Anderson, L. W., et al. (2013). Weed control in natural areas in the western United States. Oakland: University of California, 544.
Dupraz, C., Marrou, H., Talbot, G., Dufour, L., Nogier, A., and Ferard, Y. (2011). Combining solar photovoltaic panels and food crops for optimising land use: towards new agrivoltaic schemes. Renew. Energy 36, 2725–2732. doi: 10.1016/j.renene.2011.03.005
Edouard, S., Combes, D., Van Iseghem, M., Tin, M. N. W., and Escobar-Gutiérrez, A. J. (2023). Increasing land productivity with agriphotovoltaics: application to an alfalfa field. Appl. Energy 329:120207. doi: 10.1016/j.apenergy.2022.120207
Elamri, Y., Cheviron, B., Lopez, J. M., Dejean, C., and Belaud, G. (2018). Water budget and crop modelling for agrivoltaic systems: Application to irrigated lettuces. Agric Water Manag 208, 440–453. doi: 10.1016/j.agwat.2018.07.001
Fagnano, M., Fiorentino, N., Visconti, D., Baldi, G. M., Falce, M., Acutis, M., et al. (2024). Effects of a photovoltaic plant on microclimate and crops’ growth in a Mediterranean area. Agronomy 14:466. doi: 10.3390/agronomy14030466
Ferrara, G., Boselli, M., Palasciano, M., and Mazzeo, A. (2023). Effect of shading determined by photovoltaic panels installed above the vines on the performance of cv. Corvina (Vitis vinifera L.). Sci. Hortic. 308:111595. doi: 10.1016/j.scienta.2022.111595
Graham, M., Ates, S., Melathopoulos, A. P., Moldenke, A. R., DeBano, S. J., Best, L. R., et al. (2021). Partial shading by solar panels delays bloom, increases floral abundance during the late-season for pollinators in a dryland, agrivoltaic ecosystem. Sci. Rep. 11, 1–13. doi: 10.1038/s41598-021-86756-4
Hassanpour Adeh, E., Selker, J. S., and Higgins, C. W. (2018). Remarkable agrivoltaic influence on soil moisture, micrometeorology and water-use efficiency. PLoS One 13:e0203256. doi: 10.1371/journal.pone.0203256
Hernandez, R. R., Hoffacker, M. K., Murphy-Mariscal, M. L., Wu, G. C., and Allen, M. F. (2015). Solar energy development impacts on land cover change and protected areas. Proc. Natl. Acad. Sci. 112, 13579–13584. doi: 10.1073/pnas.1517656112
Hernandez, R. R., Tanner, K. E., Haji, S., Parker, I. M., Pavlik, B. M., and Moore-O’Leary, K. A. (2020). Simulated photovoltaic solar panels alter the seed bank survival of two desert annual plant species. Plan. Theory 9:1125. doi: 10.3390/plants9091125
IEA (2024). Renewables 2023, IEA, Paris. Licence: CC BY 4.0. Available online at: https://www.iea.org/reports/renewables-2023
Juillion, P., Lopez, G., Fumey, D., Lesniak, V., Génard, M., and Vercambre, G. (2022). Shading apple trees with an agrivoltaic system: impact on water relations, leaf morphophysiological characteristics and yield determinants. Sci. Hortic. 306:111434. doi: 10.1016/j.scienta.2022.111434
Kannenberg, S. A., Sturchio, M. A., Venturas, M. D., and Knapp, A. K. (2023). Grassland carbon-water cycling is minimally impacted by a photovoltaic array. Commun. Earth Environ. 4:238. doi: 10.1038/s43247-023-00904-4
Lambert, Q., Bischoff, A., Cueff, S., Cluchier, A., and Gros, R. (2021). Effects of solar park construction and solar panels on soil quality, microclimate, CO2 effluxes, and vegetation under a Mediterranean climate. Land Degrad. Dev. 32, 5190–5202. doi: 10.1002/ldr.4101
Lambert, Q., Gros, R., and Bischoff, A. (2022). Ecological restoration of solar park plant communities and the effect of solar panels. Ecol. Eng. 182:106722. doi: 10.1016/j.ecoleng.2022.106722
Li, J., Bao, A. K., Sun, X. D., Wu, T., Duan, Y. Y., Yang, H., et al. (2024). Effects of single-Axis and fixed-tilt photovoltaic Array construction on the soil seed Bank characteristics in semi-arid grasslands. Land Degrad. Dev. doi: 10.1002/ldr.5372
Liu, Y., Zhang, R. Q., Huang, Z., Cheng, Z., López-Vicente, M., Ma, X. R., et al. (2019). Solar photovoltaic panels significantly promote vegetation recovery by modifying the soil surface microhabitats in an arid sandy ecosystem. Land Degrad. Dev. 30, 2177–2186. doi: 10.1002/ldr.3408
Lovering, J., Swain, M., Blomqvist, L., and Hernandez, R. R. (2022). Land-use intensity of electricity production and tomorrow’s energy landscape. PLoS One 17:e0270155. doi: 10.1371/journal.pone.0270155
Makaronidou, M. (2020). Assessment on the Local Climate Effects of Solar Photovoltaic Parks. Lancaster University (United Kingdom). ProQuest Dissertations & Theses, 2020.:28277379.
Marrou, H., Dufour, L., and Wery, J. (2013a). How does a shelter of solar panels influence water flows in a soil–crop system? Eur. J. Agron. 50, 38–51. doi: 10.1016/j.eja.2013.05.004
Marrou, H., Guilioni, L., Dufour, L., Dupraz, C., and Wery, J. (2013b). Microclimate under agrivoltaic systems: is crop growth rate affected in the partial shade of solar panels? Agric. For. Meteorol. 177, 117–132. doi: 10.1016/j.agrformet.2013.04.012
Martin, J. (2022). Ecosystem enriching and efficient solar energy: Exploring the effects of pollinator-friendly solar facilities on ecosystem function and solar panel efficiency (Publication No. 1638386955) [Master’s thesis, William & Mary]. William & Mary Dissertations, Theses, Masters Projects. doi: 10.21220/0mv9-9h84
McCall, J., Beatty, B., Janski, J., Doubleday, K., Martin, J., Hartmann, H., et al. (2024). Little prairie under the panel: testing native pollinator habitat seed mix establishment at three utility-scale solar sites in Minnesota. Environ. Res. Commun. 6:075012. doi: 10.1088/2515-7620/ad5b3c
McCall, J., Macdonald, J., Burton, R., and Macknick, J. (2023). Vegetation management cost and maintenance implications of different ground covers at utility-scale solar sites. Sustain. For. 15:5895. doi: 10.3390/su15075895
Meyer, M. H., Dullau, S., Scholz, P., Meyer, M. A., and Tischew, S. (2023). Bee-friendly native seed mixtures for the greening of solar parks. Land 12:1265. doi: 10.3390/land12061265
Moscatelli, M. C., Marabottini, R., Massaccesi, L., and Marinari, S. (2022). Soil properties changes after seven years of ground mounted photovoltaic panels in Central Italy coastal area. Geoderma Reg. 29:e00500. doi: 10.1016/j.geodrs.2022.e00500
Nordberg, E. J., Caley, M. J., and Schwarzkopf, L. (2021). Designing solar farms for synergistic commercial and conservation outcomes. Sol. Energy 228, 586–593. doi: 10.1016/j.solener.2021.09.090
Nowak, A., Świsłowski, P., Świerszcz, S., Nowak, S., Rajfur, M., and Wacławek, M. (2023). Ecovoltaics-a truly ecological and green source of renewable goods. Ecol. Chem. Eng. 30, 315–332. doi: 10.2478/eces-2023-0032
Oomen, C. (2024). Wind. LocalWiki. Available online at: https://localwiki.org/davis/Wind
Oksanen, J., Blanchet, F. G., Kindt, R., Legendre, P., Minchin, P. R., and O’hara, R. B. (2019). Vegan: community ecology package. R package, version 2018, 25–27.
Peterson, R. A., and Peterson, M. R. A. (2020). Package ‘bestNormalize’. Normalizing transformation functions. R package version, 1.
Priyadarsini, M. J. P., Murugesan, K., Inbathini, S. R., Vishal, J., Anand, S., and Nair, R. N. (2015). Performance evaluation of LDA, CCA and AAM. Res. J. Appl. Sci. Eng. Technol. 9, 685–699. doi: 10.19026/rjaset.9.2613
Randle-Boggis, R. J., White, P. C. L., Cruz, J., Parker, G., Montag, H., Scurlock, J. M. O., et al. (2020). Realising co-benefits for natural capital and ecosystem services from solar parks: a co-developed, evidence-based approach. Renewable and Sustainable Energy Reviews 125:109775. doi: 10.1016/j.rser.2020.109775
Ripley, B., Venables, B., Bates, D. M., Hornik, K., Gebhardt, A., Firth, D., et al. (2013). Package ‘mass’. Cran r 538, 113–120. doi: 10.32614/CRAN.package.MASS
Sanz Saiz, C., Polo Martínez, J., and Martín Chivelet, N. (2020). Influence of pollen on solar photovoltaic energy: literature review and experimental testing with pollen. Appl. Sci. 10:4733. doi: 10.3390/app10144733
Schindler, B. Y., Blaustein, L., Lotan, R., Shalom, H., Kadas, G. J., and Seifan, M. (2018). Green roof and photovoltaic panel integration: effects on plant and arthropod diversity and electricity production. J. Environ. Manag. 225, 288–299. doi: 10.1016/j.jenvman.2018.08.017
Sinha, P., Hoffman, B., Sakers, J., and Althouse, L. (2018). Best practices in responsible land use for improving biodiversity at a utility-scale solar facility. Case studies in the. Environment 2, 1–12. doi: 10.1525/cse.2018.001123
SoilWeb, (2023). SoilWeb: An online soil survey browser. Davis: University of California. Avaialble at: https://casoilresource.lawr.ucdavis.edu/soilweb/.
Stid, J. T., Shukla, S., Anctil, A., Kendall, A. D., Rapp, J., and Hyndman, D. W. (2022). Solar array placement, electricity generation, and cropland displacement across California's Central Valley. Sci. Total Environ. 835:155240. doi: 10.1016/j.scitotenv.2022.155240
Sturchio, M. A., Kannenberg, S. A., Pinkowitz, T. A., and Knapp, A. K. (2024). Solar arrays create novel environments that uniquely alter plant responses. Plants, People, Planet 6, 1522–1533. doi: 10.1002/ppp3.10554
Sturchio, M. A., Macknick, J. E., Barron-Gafford, G. A., Chen, A., Alderfer, C., Condon, K., et al. (2022). Grassland productivity responds unexpectedly to dynamic light and soil water environments induced by photovoltaic arrays. Ecosphere 13:e4334. doi: 10.1002/ecs2.4334
Suuronen, A., Muñoz-Escobar, C., Lensu, A., Kuitunen, M., Guajardo Celis, N., Espinoza Astudillo, P., et al. (2017). The influence of solar power plants on microclimatic conditions and the biotic community in Chilean desert environments. Environ. Manag. 60, 630–642. doi: 10.1007/s00267-017-0906-4
Tanner, K. E., Moore-O'Leary, K. A., Parker, I. M., Pavlik, B. M., and Hernandez, R. R. (2020). Simulated solar panels create altered microhabitats in desert landforms. Ecosphere 11:e03089. doi: 10.1002/ecs2.3089
U.S. Climate Data. (2023). Climate data for the United States. Available at: https://www.usclimatedata.com
Uldrijan, D., Černý, M., and Winkler, J. (2022). Solar park: opportunity or threat for vegetation and ecosystem. J. Ecol. Eng. 23, 1–10. doi: 10.12911/22998993/153456
Uldrijan, D., Kováčiková, M., Jakimiuk, A., Vaverková, M. D., and Winkler, J. (2021). Ecological effects of preferential vegetation composition developed on sites with photovoltaic power plants. Ecol. Eng. 168:106274. doi: 10.1016/j.ecoleng.2021.106274
Uldrijan, D., Winkler, J., and Vaverková, M. D. (2023). Bioindication of environmental conditions using Solar Park vegetation. Environments 10:86. doi: 10.3390/environments10050086
US Department of Energy. (2021) Solar futures study. Available online at: https://www.energy.gov/sites/default/files/2021-09/Solar%20Futures%20Study.pdf (Accessed June 11, 2024)
US Fish and Wildlife Service. (2014). Holocarpha macradenia (Santa Cruz tarplant). 5-year review: summary and evaluation.
Valle, B., Simonneau, T., Sourd, F., Pechier, P., Hamard, P., Frisson, T., et al. (2017). Increasing the total productivity of a land by combining mobile photovoltaic panels and food crops. Appl. Energy 206, 1495–1507. doi: 10.1016/j.apenergy.2017.09.113
Vaverková, M. D., Winkler, J., Uldrijan, D., Ogrodnik, P., Vespalcová, T., Aleksiejuk-Gawron, J., et al. (2022). Fire hazard associated with different types of photovoltaic power plants: effect of vegetation management. Renew. Sust. Energ. Rev. 162:112491. doi: 10.1016/j.rser.2022.112491
Weigelt, A., Mommer, L., Andraczek, K., Iversen, C. M., Bergmann, J., Bruelheide, H., et al. (2021). An integrated framework of plant form and function: the belowground perspective. New Phytol. 232, 42–59. doi: 10.1111/nph.17590
Weselek, A., Bauerle, A., Zikeli, S., Lewandowski, I., and Högy, P. (2021). Effects on crop development, yields and chemical composition of celeriac (Apium graveolens L. var. rapaceum) cultivated underneath an agrivoltaic system. Agronomy 11:733. doi: 10.3390/agronomy11040733
Wu, C., Liu, H., Yu, Y., Zhao, W., Liu, J., Yu, H., et al. (2022). Ecohydrological effects of photovoltaic solar farms on soil microclimates and moisture regimes in arid Northwest China: a modeling study. Sci. Total Environ. 802:149946. doi: 10.1016/j.scitotenv.2021.149946
Wynne-Sison, T., Devitt, D. A., and Smith, S. D. (2023). Ecovoltaics: maintaining native plants and wash connectivity inside a Mojave Desert solar facility leads to favorable growing conditions. Land 12:1950. doi: 10.3390/land12101950
Yang, L., Gao, X., Lv, F., Hui, X., Ma, L., and Hou, X. (2017). Study on the local climatic effects of large photovoltaic solar farms in desert areas. Sol. Energy 144, 244–253. doi: 10.1016/j.solener.2017.01.015
Yavari, R., Zaliwciw, D., Cibin, R., and McPhillips, L. (2022). Minimizing environmental impacts of solar farms: a review of current science on landscape hydrology and guidance on stormwater management. Environ. Res. 2:032002. doi: 10.1088/2634-4505/ac76dd
Yue, S., Guo, M., Zou, P., Wu, W., and Zhou, X. (2021). Effects of photovoltaic panels on soil temperature and moisture in desert areas. Environ. Sci. Pollut. Res. 28, 17506–17518. doi: 10.1007/s11356-020-11742-8
Keywords: solar tracking system, single-axis photovoltaic, microclimate, soil temperature, soil moisture, vegetation, invasion ecology, best management practices
Citation: Li Y, Armstrong A, Simmons C, Krasner NZ and Hernandez RR (2025) Ecological impacts of single-axis photovoltaic solar energy with periodic mowing on microclimate and vegetation. Front. Sustain. 6:1497256. doi: 10.3389/frsus.2025.1497256
Edited by:
Mohsen Saeedi, University Canada West, CanadaReviewed by:
Ahmad Jamshidi, Tarbiat Modares University, IranZahra Moradi, University Canada West, Canada
Copyright © 2025 Li, Armstrong, Simmons, Krasner and Hernandez. This is an open-access article distributed under the terms of the Creative Commons Attribution License (CC BY). The use, distribution or reproduction in other forums is permitted, provided the original author(s) and the copyright owner(s) are credited and that the original publication in this journal is cited, in accordance with accepted academic practice. No use, distribution or reproduction is permitted which does not comply with these terms.
*Correspondence: Yudi Li, ZXZvbGlAdWNkYXZpcy5lZHU=; Rebecca R. Hernandez, cnJoZXJuYW5kZXpAdWNkYXZpcy5lZHU=
†ORCID: Yudi Li, orcid.org/0000-0002-7143-838X
Alona Armstrong, orcid.org/0000-0001-8963-4621
Christopher Simmons, orcid.org/0000-0002-4551-5011
Noah Z. Krasner, orcid.org/0009-0006-4928-3920
Rebecca R. Hernandez, orcid.org/0000-0002-8031-2949