- 1Environmental Innovation Centre (EIC), Auckland, New Zealand
- 2Environmental Solutions Research Centre (ESRC), Unitec – Part of Te Pūkenga, Auckland, New Zealand
- 3School of Future Environments, Auckland University of Technology (AUT), Auckland, New Zealand
Introduction: In New Zealand, the construction sector is responsible for a large proportion of waste sent to landfill. The plastic profile of construction waste is varied and complex in comparison to other waste types (e.g. timber, concrete, metals, plasterboard). Therefore, the diversion of plastics from landfills is less straightforward, and there are less obvious benefits to recycling this low-density, low-value waste stream. Plastic waste generated by construction activities has not been well-characterised, which has affected opportunities for waste reduction, reuse and recycling. To fill this knowledge gap, this study characterised the plastic waste generated from a residential construction site. This was used to identify opportunities to address the full waste hierarchy through reduction, reuse and recycling and ultimately enable more sustainable plastic waste management.
Methods: Plastic waste generated from a construction site in Auckland, New Zealand (construction of eight terraced houses) was separated during the project into several categories (pipes, soft plastics, other plastics and hazardous waste). This was followed by in-depth auditing which further sorted waste types by main composition, followed by analysis for polymer type using fourier-transform infrared spectroscopy (FTIR). The research was phased to determine the plastic waste generated across each of the main construction stages. Once the main polymer types had been identified, local waste providers were contacted to establish opportunities for reuse or recycling.
Results: The total mass of plastics generated from all construction stages was 725 kg, 66.4% (by wt.) of which was recycled. Soft plastics, predominantly low-density polyethylene, were the most common plastic type; this was followed by pipes and expanded polystyrene. Plastic packaging, primarily soft plastics and polystyrene, accounted for 60% of total plastics and were mostly generated in the final stages of construction (i.e. fittings and fit-out). This characterisation of construction plastic waste can be used to demonstrate the feasibility of sustainable plastic waste management in Auckland and to identify construction plastic waste sources on an international scale. More studies on a variety of construction types (e.g. detached residential, apartment blocks, commercial) are required to address the full breadth of plastic materials used and to drive a more circular economy for this potential resource.
1 Introduction
On a global scale, construction and demolition (C&D) waste contributes significantly to landfilled waste, comprising 27% of landfilled waste in Canada (Yeheyis et al., 2013), 62% in the UK (2018) (Department for Environment, Food & Rural Affairs, 2023) and 30% in Australia (2016–2017) (Pickin et al., 2018). In Auckland (New Zealand), about 40% of all waste sent to landfill comes from C&D (Auckland Council, 2018), amounting to 570,000 tonnes of waste in 2019. The building and construction sector has a growing range of applications for plastics, including insulation, piping, window frames and interior design. It has been estimated that this sector consumes around 10 million tonnes of plastics, annually amounting to 20% of total European plastics consumption (Plastics Europe, 2022), and 26% in Canada (Santos et al., 2023). There is currently not enough official data available for Auckland or New Zealand to show variation in plastic C&D waste over time (i.e., Class 2 C&D waste landfills); the only estimate available is that C&D waste in New Zealand is comprised of approximately 4% of plastic materials (Ministry for the Environment, 2007). Although New Zealand’s C&D waste is relatively small compared to the USA, France and Australia, the plastic proportion is much higher (Figure 1). It is estimated that Auckland’s construction industry alone sends 25,000 tonnes of plastic waste to landfills each year (Hernandez et al., 2023), where they can take up large volumes, degrade into microplastics in landfills and enter the surrounding environment (Wojnowska-Baryła et al., 2022). As with other waste types, it is important to provide the quantity (i.e., measuring mass or volume of waste types) and characterisation (identifying waste type) of plastic waste to be able to create appropriate waste management plans (Villoria Sáez et al., 2012; Córdoba et al., 2019).
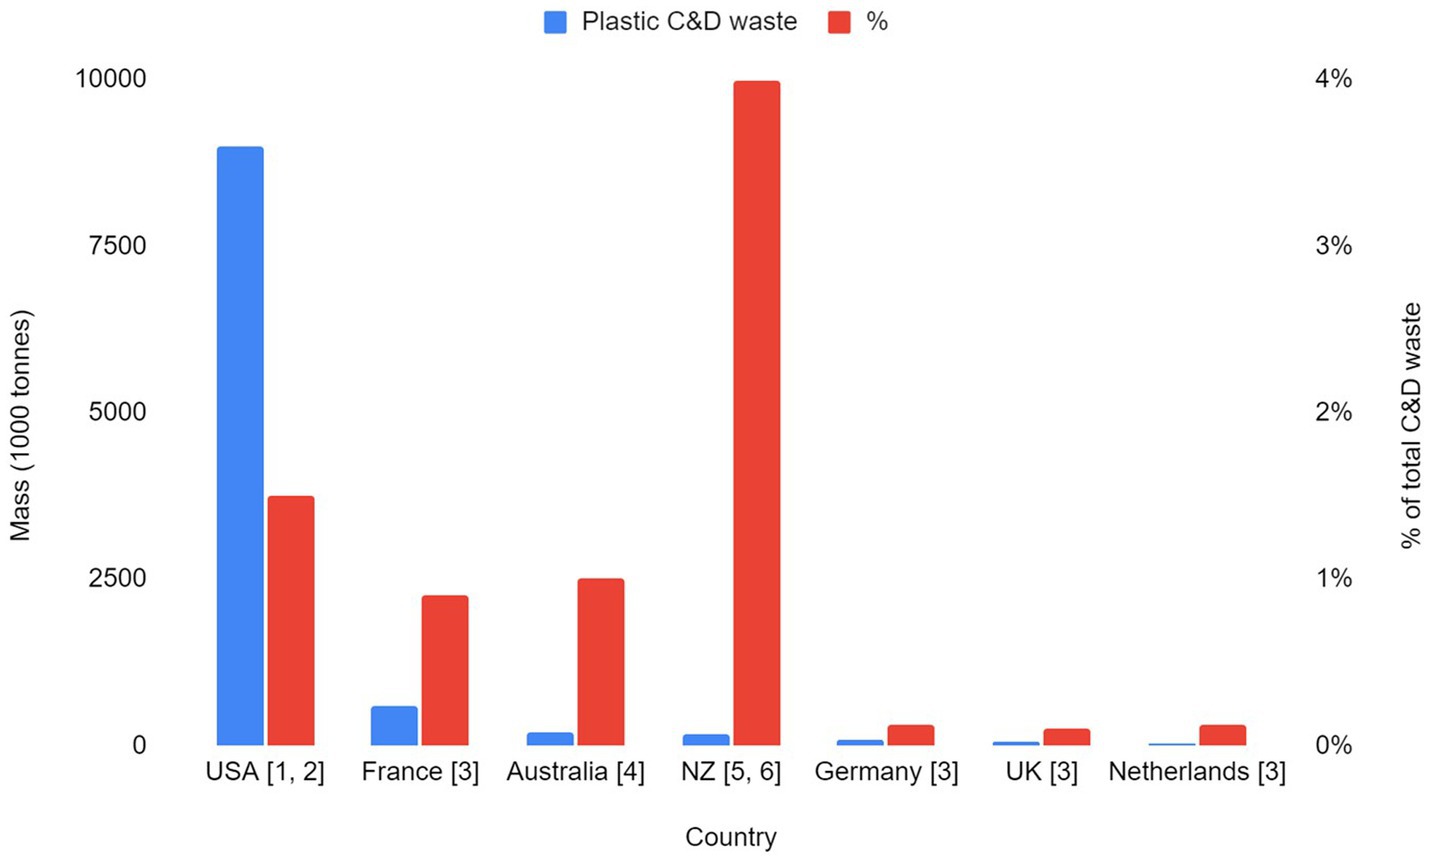
Figure 1. C&D waste and plastic proportion produced per country (1 – Coelho and de Brito, 2011; 2 – US EPA, 2020; 3 – Menegaki and Damigos, 2018; 4 – Wu et al., 2020; 5 – Ministry for the Environment, 2007; 6 – Wilson and Lewis, 2023).
Despite the high contribution of the C&D sector to plastic waste generation, there is a general lack of knowledge and focus on C&D plastic waste management. In New Zealand, advice and recommendations on the management of construction waste is relatively limited on a regional scale, and generally provided by local authorities on request. There is also a lack of infrastructure available for the recycling of construction waste plastics, in terms of both waste providers and transportation. Recycling is not the ultimate solution for plastic waste at its end-of-life; however, studies have found it to have the lowest Global Warming Potential and Total Energy Use when compared to disposal in landfills and incineration, making it the preferred solution from an environmental standpoint (Ferdous et al., 2021). There are options available to recycle and divert plastic construction waste from New Zealand landfills, albeit not widely established; therefore, research, investment and education are required to assess potential options. Additionally, in 2025, changes to New Zealand’s building regulations (Building Act 2004, 2009) will require waste management plans to be provided for the construction and demolition of buildings (Ministry of Business, Innovation and Employment, 2022) which will push the need for the identification and characterisation of C&D waste types.
The composition of C&D waste can vary greatly between sites due to the nature of the construction projects, construction stages and material selection, alongside regional, national and global variations. New Zealand’s houses are predominantly timber-based, e.g., for framing and flooring (BRANZ, 2020; Domingo and Batty, 2021; Finch et al., 2021). Timber-based weatherboard is also more popular than brick (clay and concrete) for wall cladding, with expanded polystyrene (EPS) as the dominant choice for concrete slab insulation (BRANZ, 2020). It is common for buildings to be covered by polyethylene building wrap (“shrink wrap”) during construction or renovation, which protects buildings from weather damage (Mclntosh and Guthrie, 2008). This variation may also be found in countries with similar climates and/or building typology, including England, Ireland, Sweden (Jonsson, 2009) and Australia (Navaratnam et al., 2020). Therefore, such countries may produce similar C&D waste profiles.
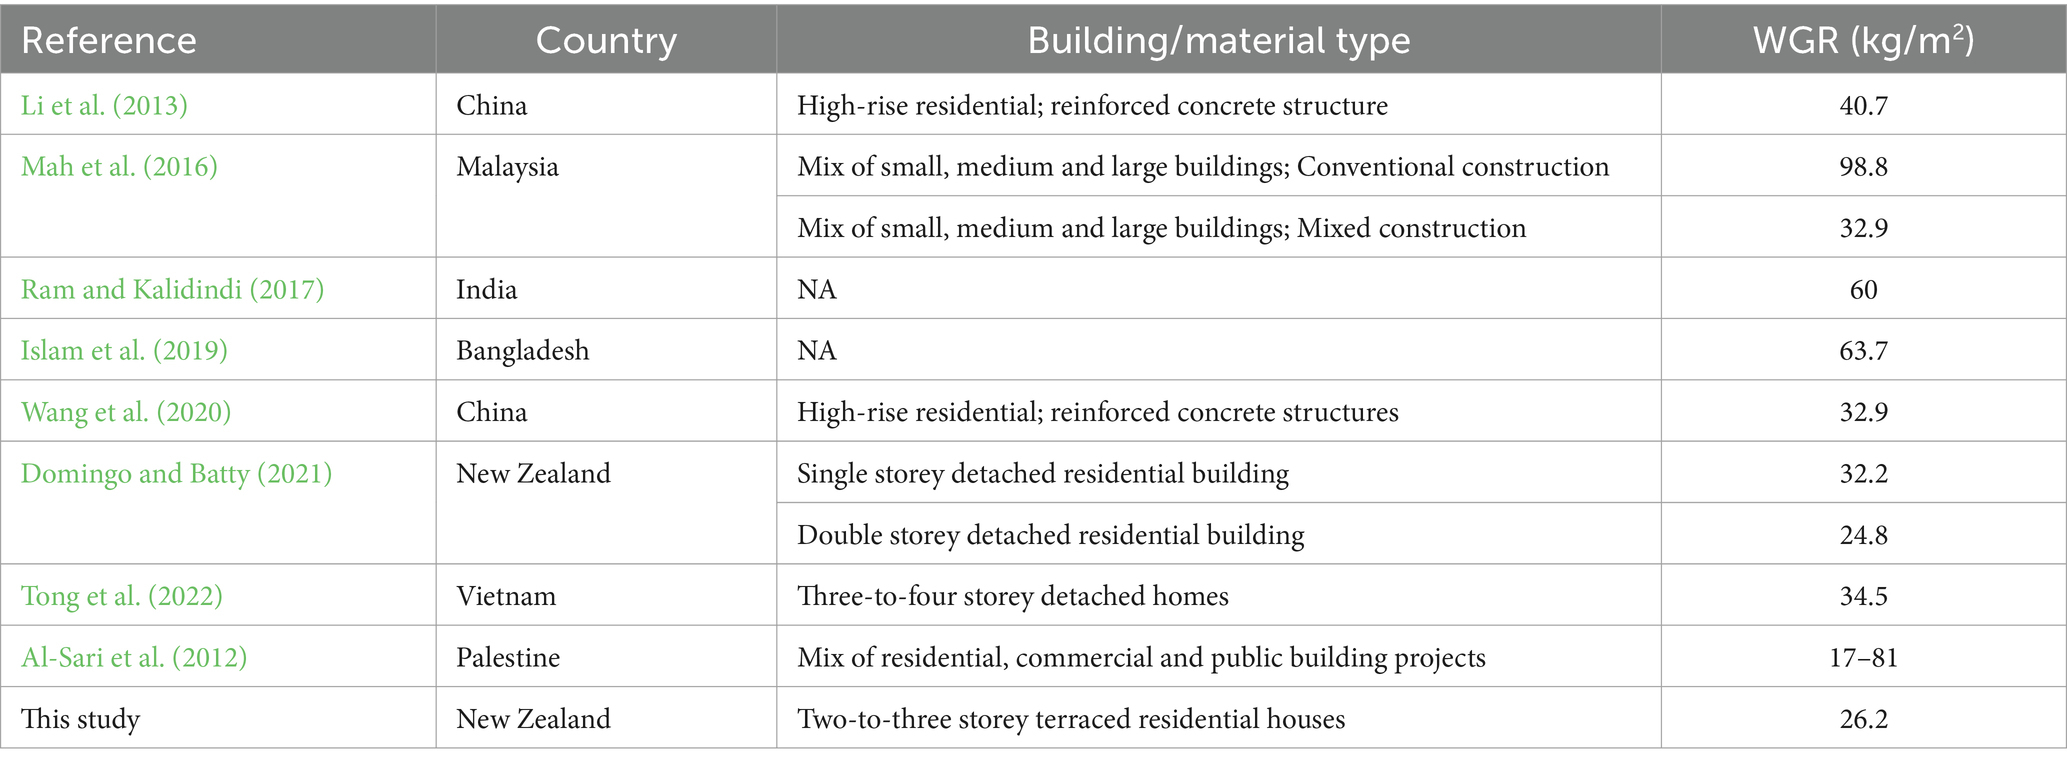
Qualitative characterisation is difficult to apply to construction waste due to the time and manual screening required due to high mass and volume (Córdoba et al., 2019). Waste may be directly weighed and measured, or indirectly calculated based on the site’s characteristics (e.g., of activities taking place on-site, building area and financial value of the project), lifetime analysis methods, and assumptions around material wastage in the region (Lau et al., 2008; Wu et al., 2014). Waste generation rates (WGR) for construction sites are commonly used to quantify construction waste at a country, regional or project level (Lu et al., 2011; Wu et al., 2014; Islam et al., 2019). Many of these studies have taken place in Asia, where high-rise buildings of reinforced concrete structures are common (Table 1). Currently, WGR data is both sparse and variable for different construction types, e.g., residential, commercial and infrastructural.
Previous studies have determined C&D waste types using sub-samples of C&D waste from construction sites (Katz and Baum, 2011; Llatas, 2011) or C&D waste landfills (da Silva and da Costa Marques Neto, 2021). Other studies have dealt with the smaller fractions of waste (in terms of mass) by combining waste streams, for example, plastics, cardboard and paper; partly based on their perceived recyclability (Lima and Cabral, 2013). However, this approach does not explore the variation within complex and diverse wastes, such as plastics. In 2019, Córdoba et al. used image analysis for their qualitative characterisation which proved to be efficient for the characterisation of samples with high-volume parts, such as beams, columns and concrete slabs but inefficient for other lower-volume C&D waste types, for example, plastic sheeting, cardboard and packaging (Córdoba et al., 2019). Lahtela et al. (2019) manually audited and analysed the polymer type of C&D waste from two Finnish waste companies, finding acrylonitrile-butadiene-styrene (ABS) to be the most common, followed by polypropylene (PP) and polyvinyl chloride (PVC). Prestes et al. (2012) also audited and analysed plastics by hand, from an inert landfill in Brazil, where they found PVC to account for the most plastic waste, followed by polyethylene-mixed plastic films and high-density polyethylene (HDPE) rigid plastics. The results of these two studies are varied; however, they are based on relatively small samples of plastic C&D waste from landfills, and the contribution from new building construction is unknown. Chauhan et al. (2023) manually audited all film plastic waste from three construction sites (apartment buildings); they found film plastic waste to account for 0.5–1% of the total waste mass. Their analysis took place over five stages of construction and concluded that plastic film waste was most common during the final stages of construction (encompassing interior work, mechanical, electrical & plumbing works and finishes and closures). Most of this was generated from furniture installation. In New Zealand, studies have characterised plastic waste from a new educational building (Berry et al., 2022) and across various stages of the construction of new commercial buildings (Hernandez et al., 2023).
Waste characterisation is essential to address challenges associated with managing plastic C&D waste, however, this has largely not been investigated (Santos et al., 2023). Physical and chemical characterisation is an important step before applying strategies for waste management or treatment strategies (Laadila et al., 2022). Understanding when and why plastic waste is generated requires examination of the whole waste stream, detailed quantification (plastic mass/volume) and qualification (plastic type).
Therefore, the main objective of this study is to provide a comprehensive characterisation of the plastic waste stream generated from the three stages of a residential construction project, which can help to identify appropriate waste reduction management strategies. These results may be used to estimate general waste generation rates of residential construction sites, set realistic targets for waste minimisation, and inform the implementation of waste management policies. On an international basis, this study will identify key products that contribute to plastic waste generation that should be targeted for reduction, replacement, reuse or recycling.
This study aims to answer the following questions:
1. What are the main types of plastic waste coming from a residential construction site, and what are their characteristics?
2. What is the plastic waste generation rate?
3. What proportions of plastic wastes are generated at different stages of the project?
4. How much plastic waste can be feasibly recycled in Auckland, and at what cost?
2 Research methodology
2.1 Site
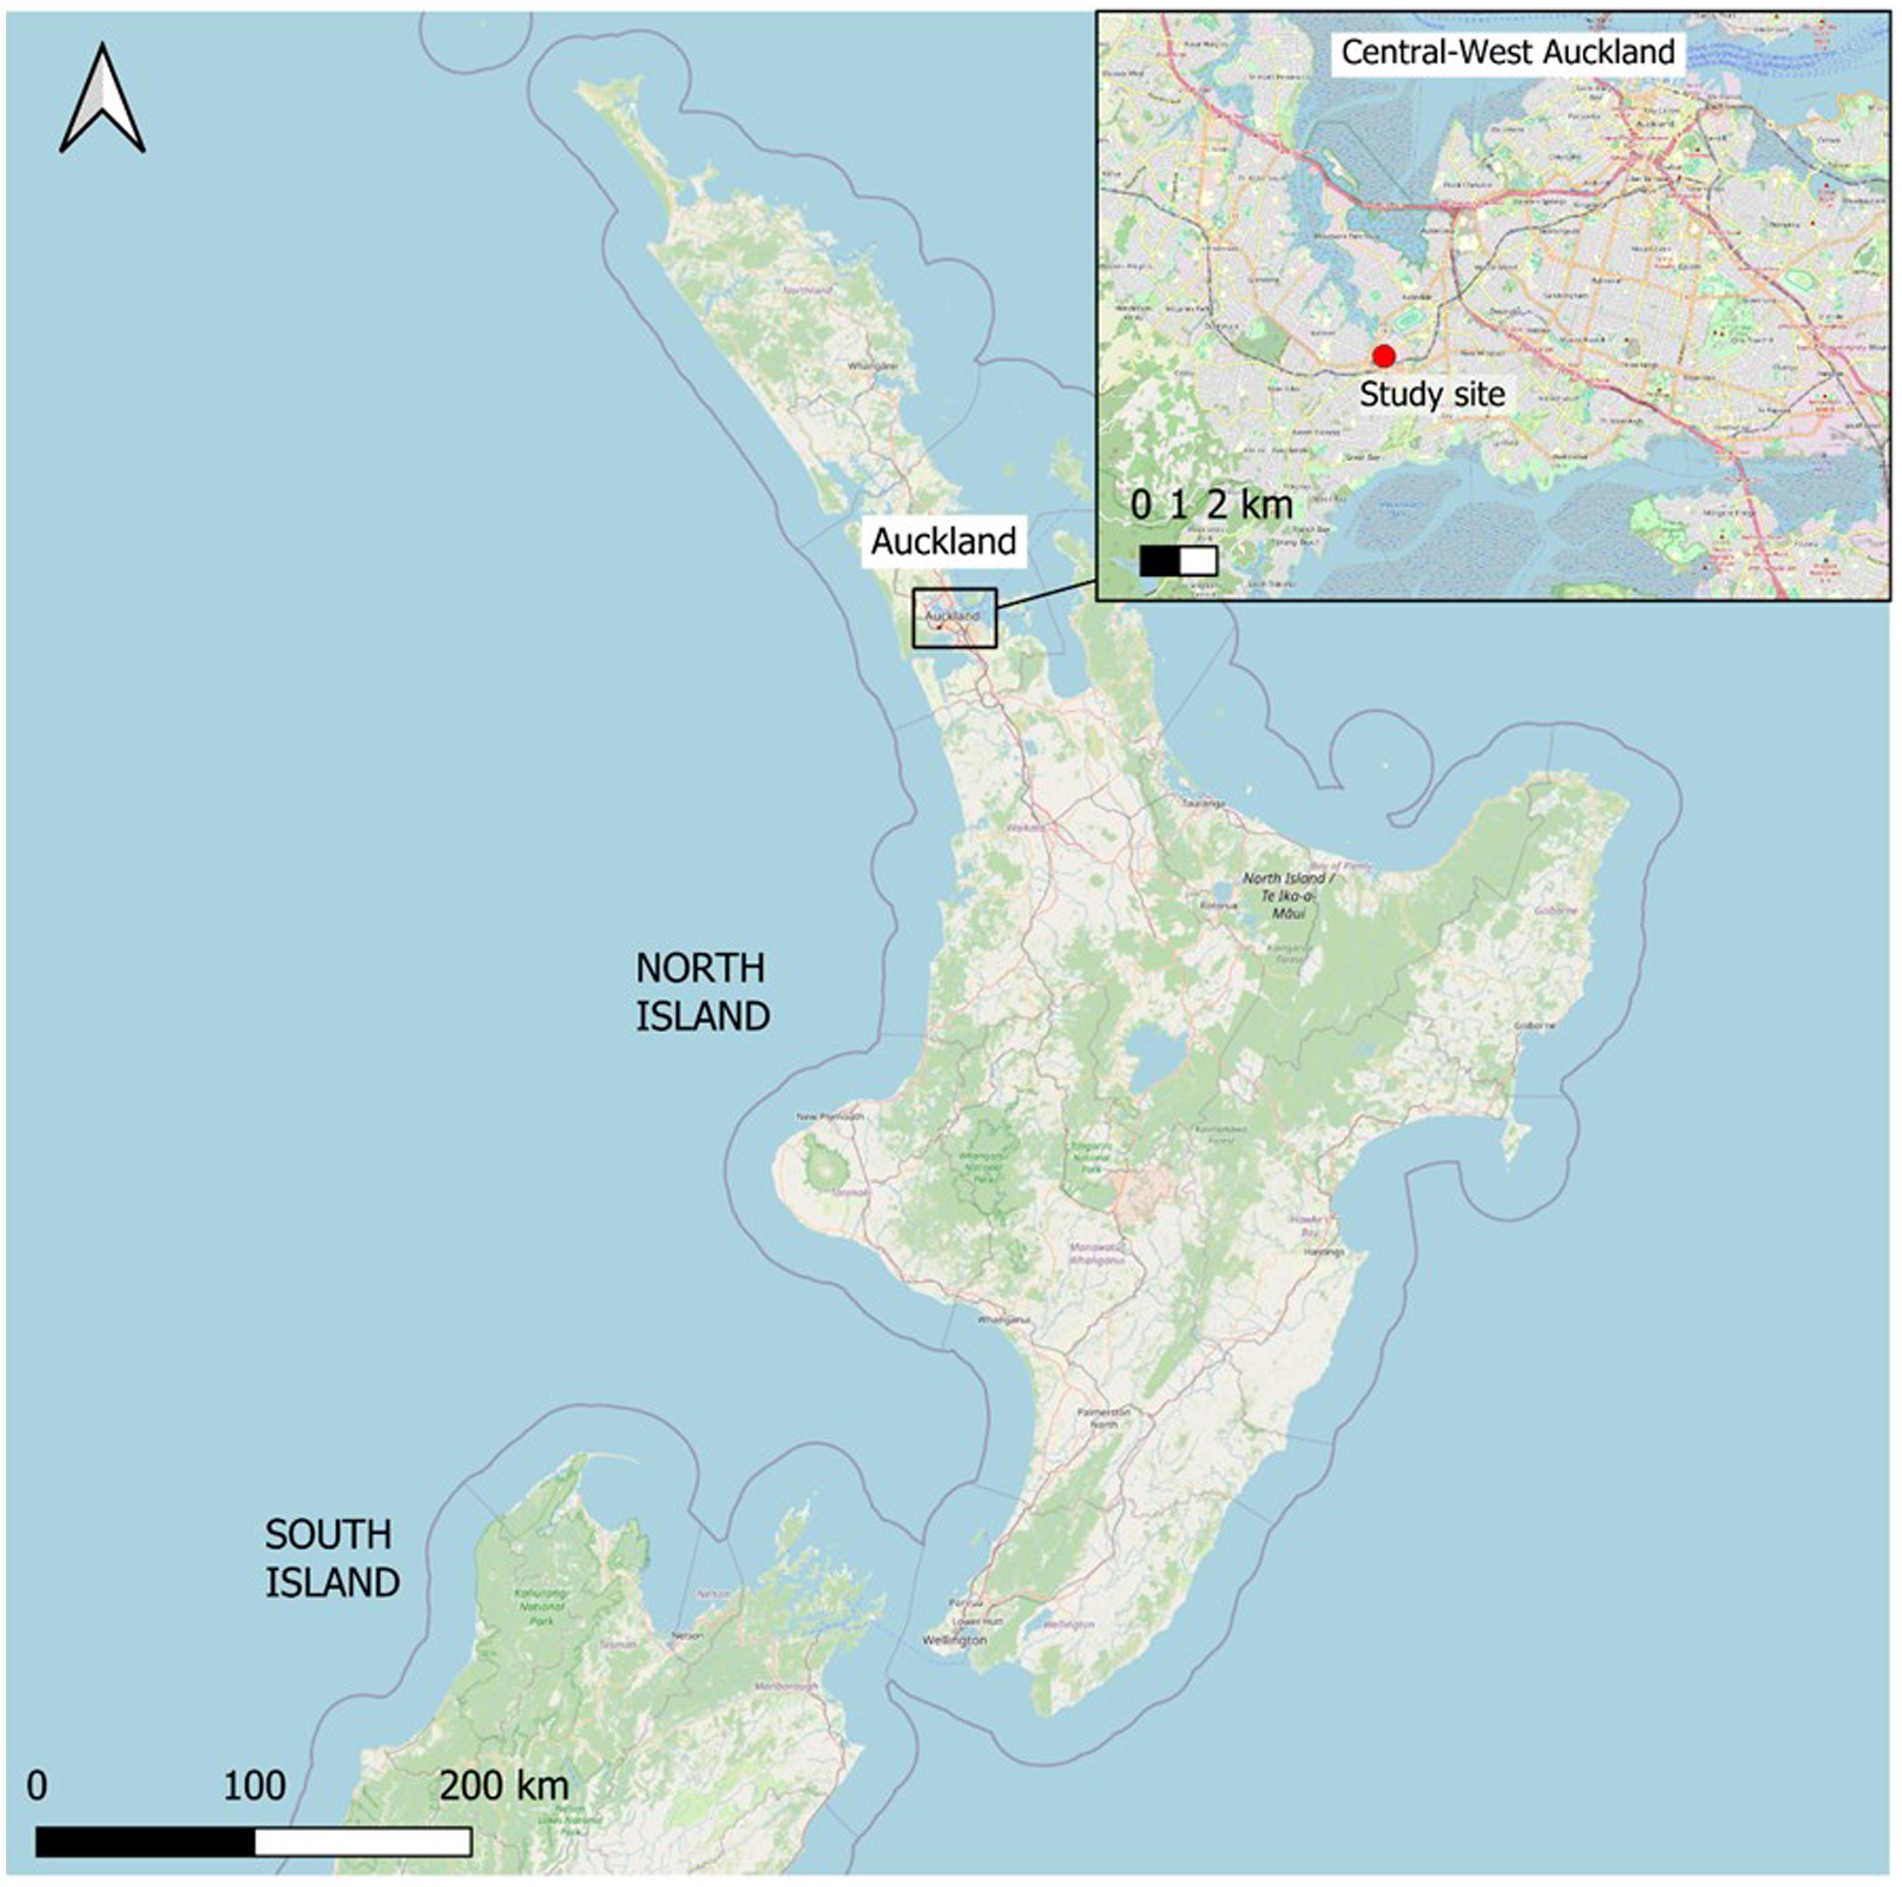
A new residential development of eight terraced houses was built from September 2021 to September 2022 in Auckland, New Zealand (Figure 2). This was led by a local construction company, who set a target to divert 90% of all construction waste from landfill disposal. The development was made up of six three-storey (terraced) and two two-storey units (duplex), constructed of timber framing, and with a total building coverage of 317 m2. The floor area of the two different units was 117.8 m2 and 75 m2 (respectively), giving a total floor area of 856.8 m2. No building wrap was used on this site. Before physical construction began, the research team and the site owner reached an agreement to use the site for the study, part of a Building Research Association of New Zealand (BRANZ) -funded project.
2.2 Site setup
In order to support the collection of plastics for the study, an initial waste management training session was conducted for both staff and subcontractors as part of the research project. This training took place during the physical construction works began, and before construction waste was generated. The training encompassed the classification of various types of plastics, waste storage conditions, and proper sorting methodologies. At the start of each week, a concise briefing on waste management was delivered to the staff to ensure smooth operations and gather feedback from them.
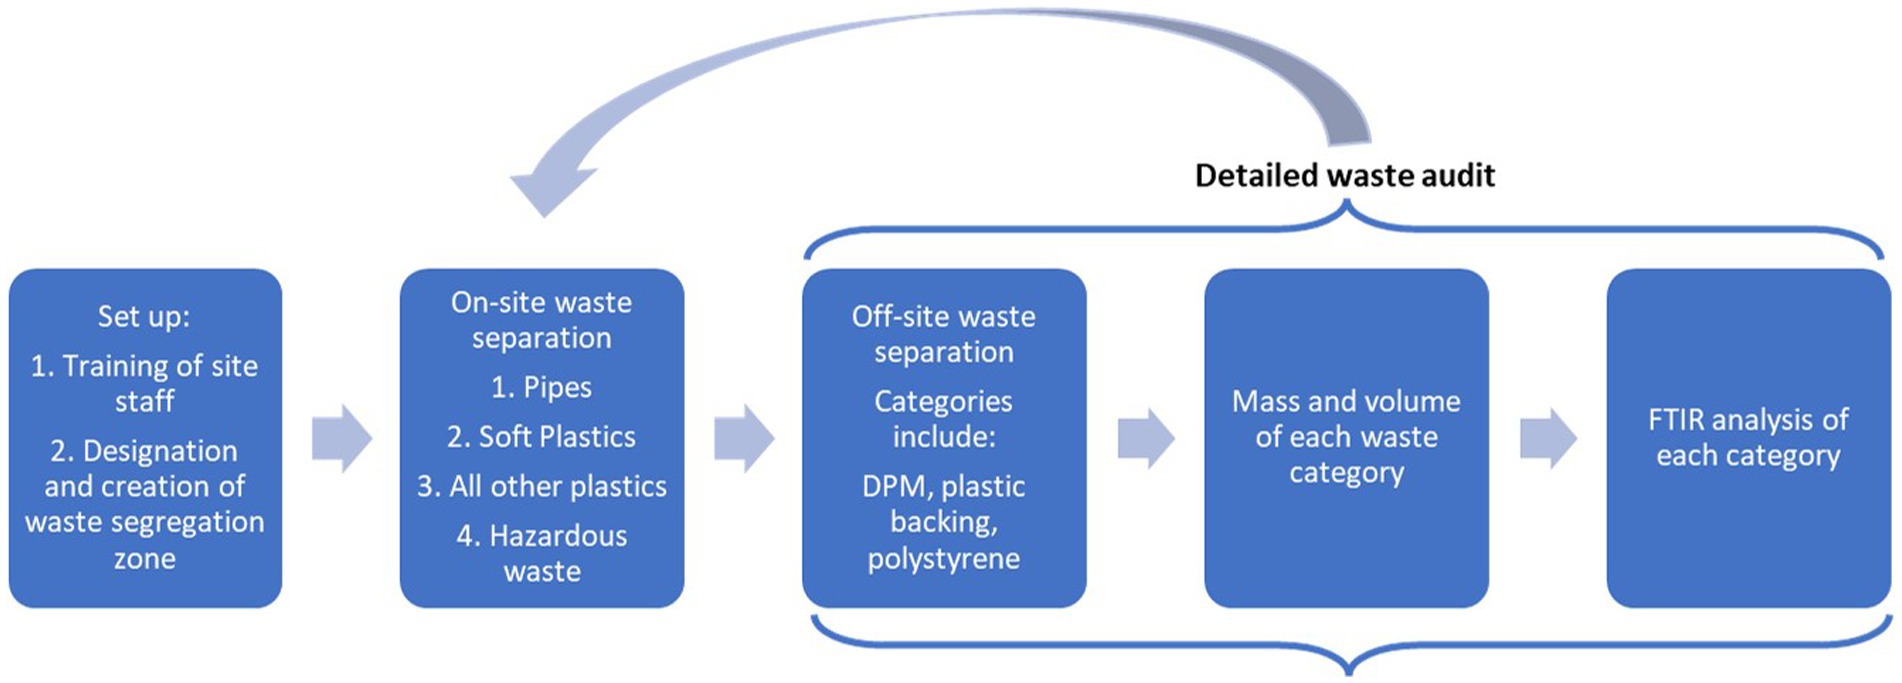
To facilitate effective waste separation, a waste station was established on the construction site premises. This station was equipped with four distinct categories, chosen to cause as little disruption as possible to the construction works; Pipes (polyvinyl chloride (PVC) and high-density polyethylene (HDPE)), Soft Plastics (low-density polyethylene (LDPE) and linear low-density polyethylene (LLDPE)), Other Plastics (plastics of any other category – e.g. HDPE, polypropylene (PP) and polyethylene terephthalate (PET)), and Hazardous Waste (e.g., adhesives, sealants and solvents) (Figure 3). Each category was accompanied by signage and a designated cubic metre bag. Additionally, the staff had access to a comprehensive waste plastic catalogue detailing the different types of plastic waste and their respective categories.
2.3 Waste separation and auditing
The waste separation procedure was conducted in two stages. Initially, construction staff segregated the waste on-site into the four plastic categories (Figure 3). In the second stage, these items went through a detailed waste audit off-site, where the research team segregated items into categories based on their respective functional attributes, composition, and potential for recyclability. Each category was weighed. Volumes were determined by weighing a full metre-cubed bag of each plastic waste material (based on plastic category). When this was not feasible, plastic density was used to calculate the volume, which varies depending on the polymer type. Samples of each plastic type had their polymer type identified using fourier transform infrared (FTIR) spectroscopy, with a ThermoFisher Nicolet iS50R spectrometer in the attenuated total reflectance (ATR) mode equipped with a diamond ATR crystal (method described by Berry et al., 2022). This analysis allowed for polymer types to be identified, and their subsequent categorisation and recycling. In total, 205 samples of plastics were analysed and sorted into 29 categories. Where possible, these audited plastics were then delivered to local recyclers. This process was conducted on a monthly basis, with flexibility for earlier auditing if waste stations reached capacity. Most of the non-plastic waste, including timber, metals, paper, and plasterboard, was separated, weighed, and managed by third-party waste management companies. This data was provided to the research team.
3 Results and discussion
3.1 All waste
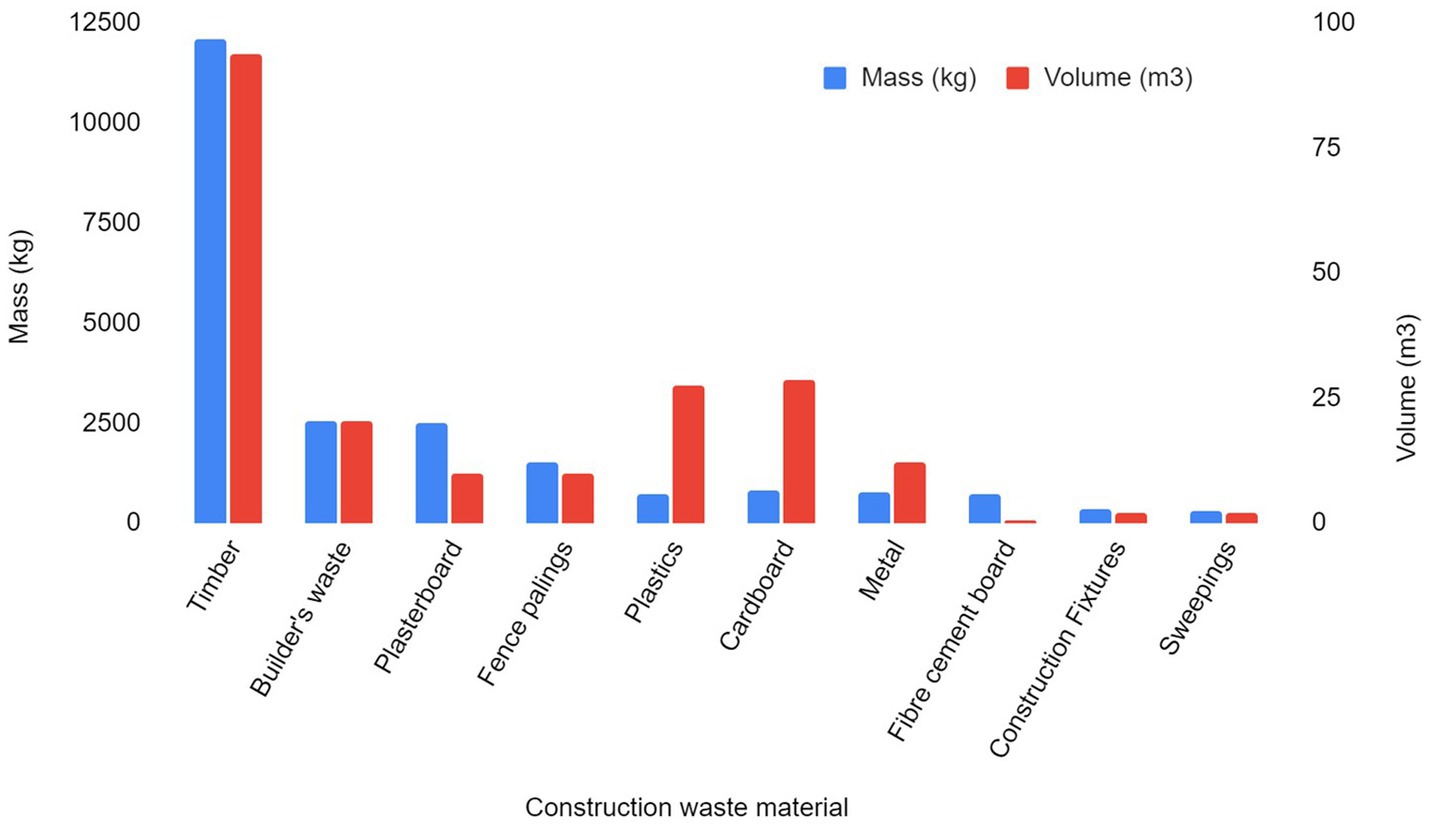
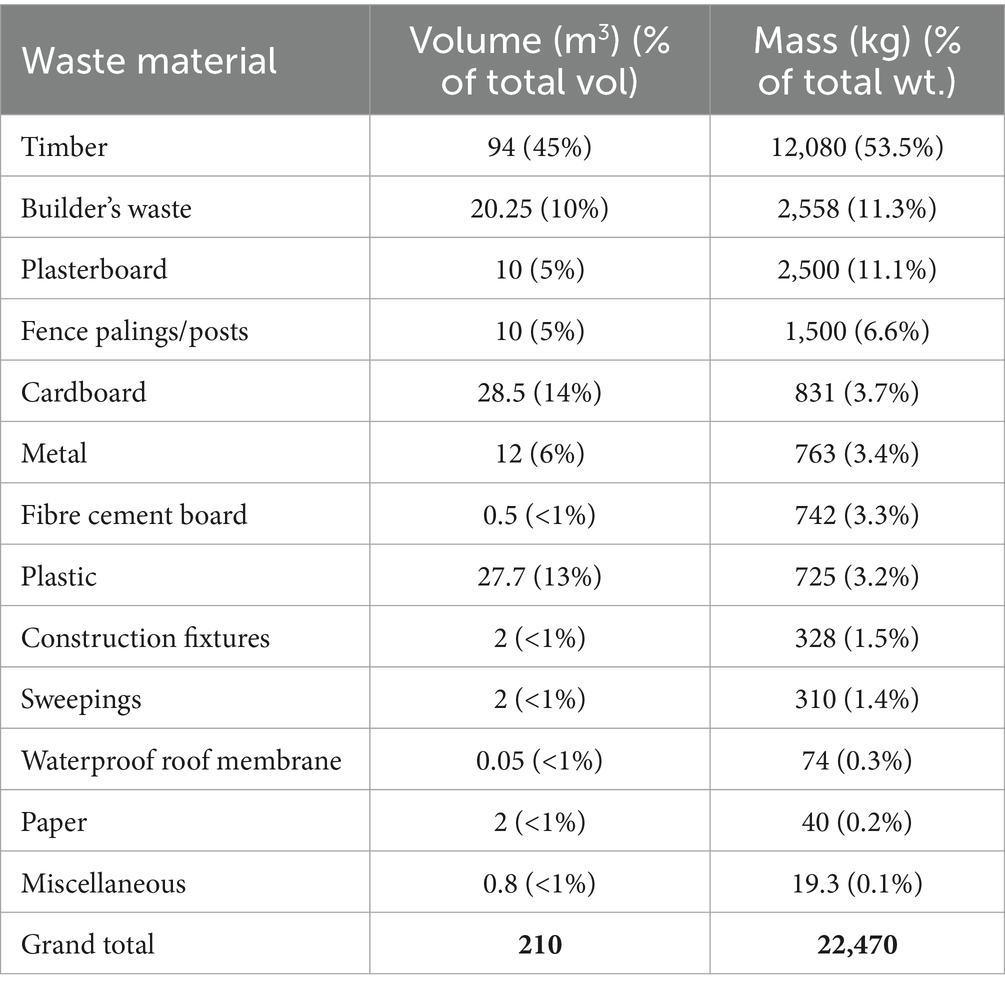
A total of 22,470 kg (210 m3) of waste materials were collected, sorted and audited from this site (Figure 4; Table 2). By mass, the most common material was timber, followed by builder’s waste and plasterboard. The dominance of timber as a waste material is unsurprising as the majority of New Zealand houses use timber for cladding, framing and floor joists (Domingo and Batty, 2021; BRANZ, 2020). Concrete waste was not recorded for this study; however, it was considered negligible as relatively little was generated, and any excess was returned via supplier trucks or used as backfill. Plastics accounted for 3.2% (wt.) of the total waste. Of the total waste generated, 84% (wt.) was diverted from landfills.
By volume, timber waste was most generated, followed by cardboard and plastic waste (Figure 4; Table 2). Note that waste volume refers to the uncompressed volume of waste; the unprocessed form in which the waste is disposed of.
Nelson et al. (2022) estimated the waste generated from the construction of average, single-storey residential building envelopes in New Zealand. This was based on the estimated mass of materials used in an average detached house (area of 195 m2) and approximate waste generated by construction (Figure 5). The average waste generated for an average house was 3,003 kg of waste – the majority of this was concrete, plasterboard and timber.
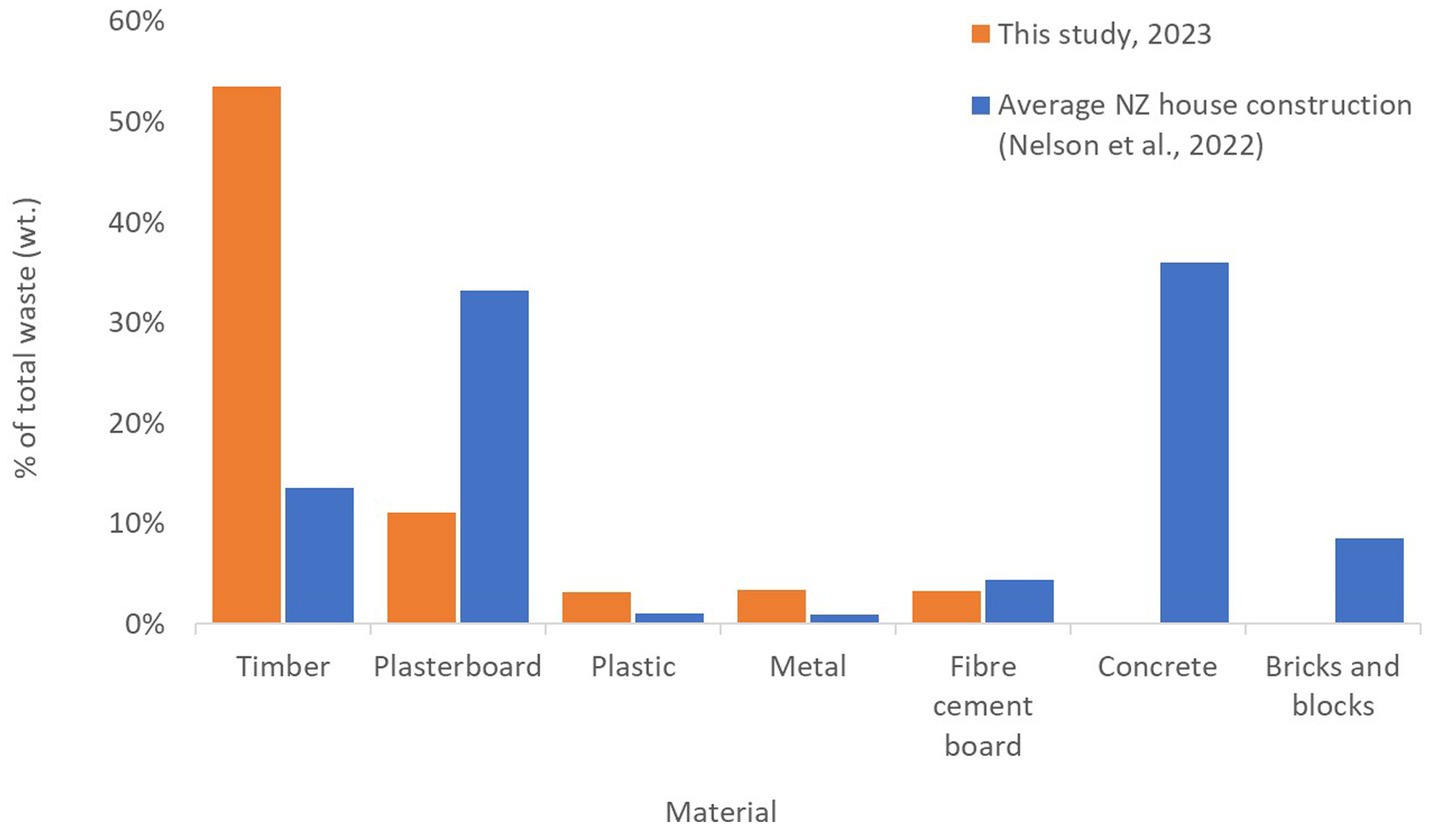
Figure 5. Comparison of waste generation for this study and construction of the average NZ house (Nelson et al., 2022).
In comparison, this study had an average area of 96.4 m2 and generated about 2,808 kg of waste per terraced house. More timber was generated than that estimated by Nelson et al., less plasterboard and less plastic (Table 2). However, these studies are not directly comparable as the size and type of the houses are different. Additionally, Nelson et al.’s estimate are solely for the building envelope of a detached house, thus excluding electrical wiring, plumbing, internal fixings, and kitchen and bathroom componentry.
The average WGR of this study’s site was 26.2 kg/m2 (assuming all units produced the same amount of waste), which is lower than those reported in the literature on high-rise residential buildings (Table 1). The differences in WGR may be due to differences in general construction practices for each country, waste management regulations, environmental awareness and GDP (Tam and Lu, 2016). Domingo and Batty (2021) estimated that the WGR for a typical, timber-framed, detached New Zealand home was 32.2 kg/m2 for a single-storey house, and 24.8 kg/m2 for a double-storey house (Table 1). The WGR of this project’s (26.2 kg/m2) multi-storey terraced houses sits between these two values; however, the WGR can only be taken for the eight units as a whole, as the waste generated could not be assigned to each of the different units (i.e., two-storey and three-storey; duplex or terraced homes). Despite this, the WGR comparison between this study and Domingo & Batty’s study suggests that these terraced, multi-storey homes produce more waste than a double-storey, detached home. This is somewhat surprising, as it may be expected that the terraced nature of the units would reduce the amount of waste produced, relative to detached homes – as indicated by Carpio et al. (2016), who found that detached single-unit family homes produced less building construction waste than semi-detached (i.e., duplex dwelling) home. The reason for this may be that six of the eight units had three storeys instead of two – as such, it would be useful to compare this study’s WGR to that of a detached three-storey house. Additionally, using the volumetric unit of kg/m3 may provide a fairer comparison for the waste generation of multi-storey buildings and apartments.
3.2 Plastic waste
3.2.1 Plastic waste generated
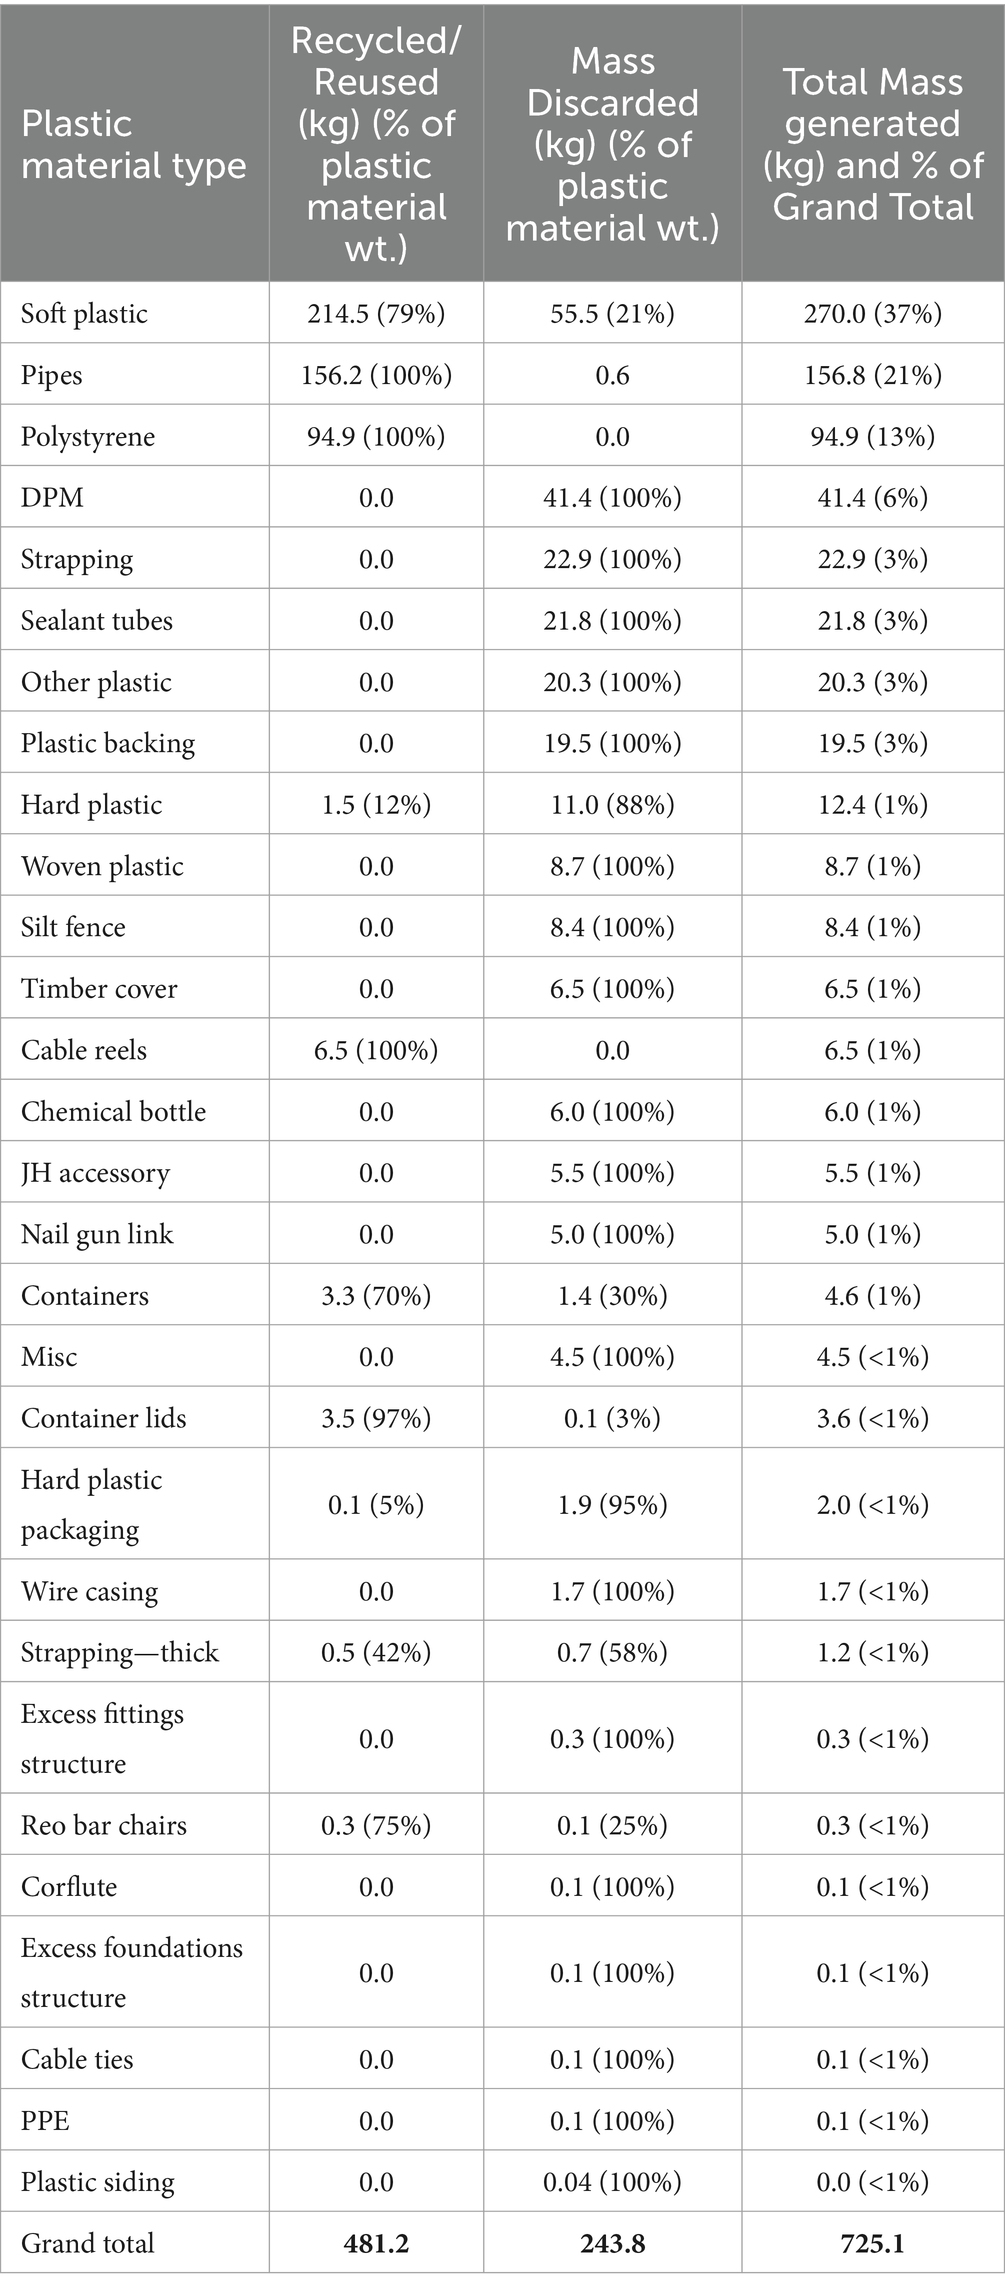
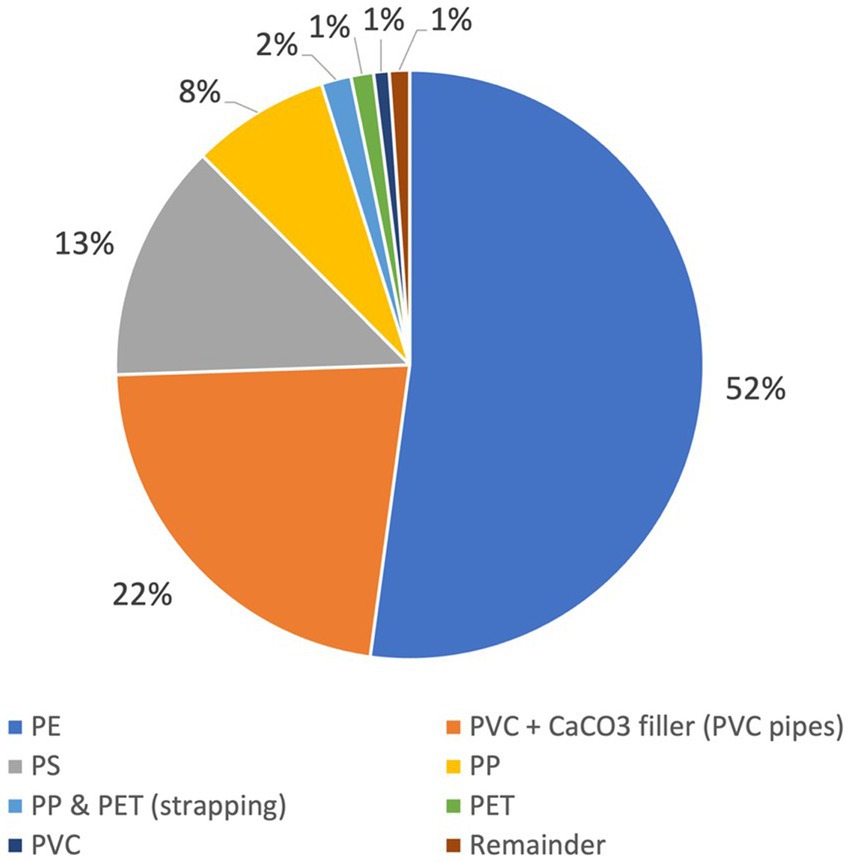
A total of 725.1 kg of plastic waste was generated by this site, giving a plastic WGR of 0.85 kg/m2. Soft plastics were the most common plastic type, with a total mass of 270 kg (Table 3). These were predominantly bags, film and wrap used in the packaging and protection of construction materials, made of low-density polyethylene (LDPE). Soft plastics accounted for 1.2% of the total waste mass, which is similar to that (0.5–1%) reported by Chauhan et al. (2023) study. The second most common plastic was pipes made of HDPE and PVC, followed by expanded polystyrene (EPS) and damp proof membrane (DPM – made of PE) and strapping (made of PET or PP). These results are also reflected in Figure 6, which shows the results of our FTIR analysis of each sample. This result has some similarity to Prestes et al. (2012) study of C&D landfill waste, where 33% of plastic waste was PVC, 23.2% came from mixed PE plastic films, and 18.5% from HDPE. However, the specific type of construction for Prestes et al.’s study (e.g., building construction, demolition) is unknown, therefore the results are not directly comparable. The dominance of PE and PVC in plastic waste was also reported by both Berry et al.’s plastic characterisation of a new educational building (Berry et al., 2022) and Hernandez et al.’s study of new commercial buildings (Hernandez et al., 2023).
3.2.2 Plastic waste recycled and discarded
Of the total plastics generated and audited, 66% was recycled by weight and 73% by volume. Soft plastics were the most-recycled plastic type, followed by pipes and EPS (Table 3). These three types have recyclers willing to specifically recycle construction plastic waste within Auckland. Of the total plastic mass discarded or unresolved, the majority were soft plastics followed by DPM and strapping (Table 3). The soft plastics and DPM discarded were typically too contaminated with dirt or paint to recycle. Strapping does not currently have a recycler in Auckland due to its often-tangled and woven structure which is difficult to physically process, and the general lack of non-food grade PET recyclers.
3.2.3 Plastic categorisation – use type and construction stage
All plastic materials were classified as being used for either:
1. Plastic packaging (used to hold construction materials together during purchase/transportation, e.g., soft plastic bags, strapping, containers, timber covers, and packaging EPS).
2. Construction components (used in the building itself, e.g., offcuts or excess DPM, EPS insulation pods, and pipes).
3. Building protection & tools (used for the construction process, e.g., gloves, safety glasses, silt fences, and safety fences).
They were also sorted into three construction stages:
1. Initial stage – until floor level, including earth works and foundations (~3 months).
2. Mid stage – timber framing and roofing (~2 months).
3. Final stage – interior & exterior finishings, fixtures and fit-out (~7 months).
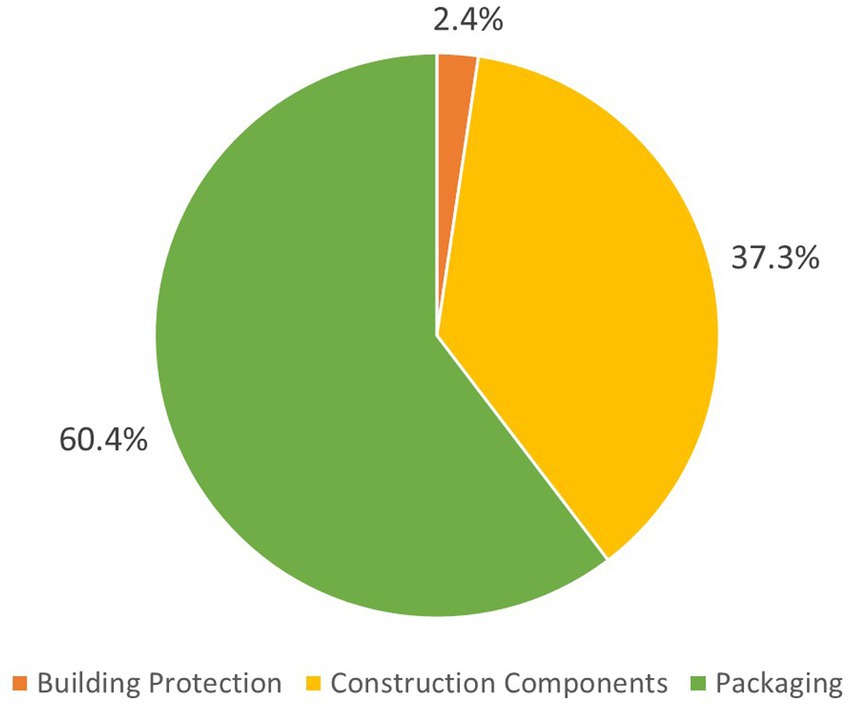
The majority of plastic waste generated was used for “product packaging”, followed by “construction components” and “building protection & tools” (Figure 7). On this study’s residential, multi-unit site, product packaging may have been higher due to the larger number of bathroom and kitchen fixtures and fittings used per unit area, thus increasing the overall proportion of plastic packaging. This differs from the result found by Berry et al. (2022), where construction components made up the majority of plastic waste on a commercial construction site (68% wt.). This may be due to the difference in building type and, thus, differences in the volume of fixtures and fittings used. Additionally, a roll of unused vinyl flooring accounted for the majority (59%) of construction components in Berry et al.’s study, which may not be seen on a typical site.
Plastic packaging is mostly generated in the final stage. Soft plastic was the most common plastic type for the mid and final stages (Figure 8). EPS waste was almost evenly split between waste from building insulation pods in the initial stage (49%) and packaging waste (51%) for kitchen whiteware and bathroom installations in the final stage (Figure 8). Strapping was also most common in the final stages. In comparison, the generation of plastic packaging materials was relatively consistent between the three stages of the study by Berry et al. (2022) ranging between 36 and 58 kg. In terms of construction stages, both studies found that the greatest plastic generation occurred in the final stages (Figure 9). The stage at which pipes were generated was not captured in this study; however, they were mostly generated in the final stage (31.2 kg) of the study by Berry et al. (2022).
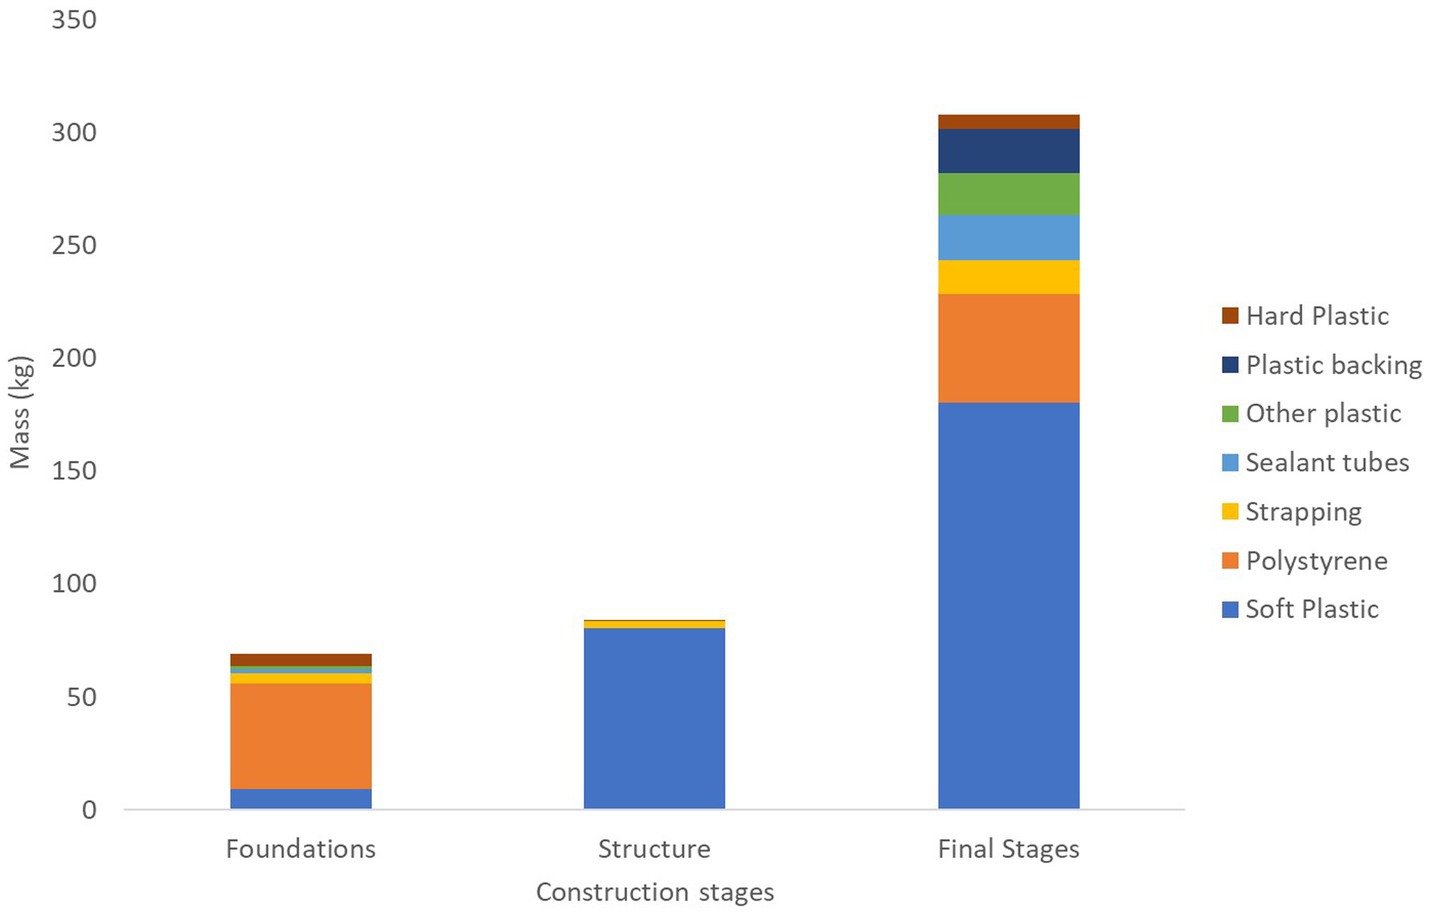
Figure 8. Plastic waste types generated in each construction stage (top seven waste types for case study site) (Note: pipes are not included in this graph as their time of collection was not recorded).
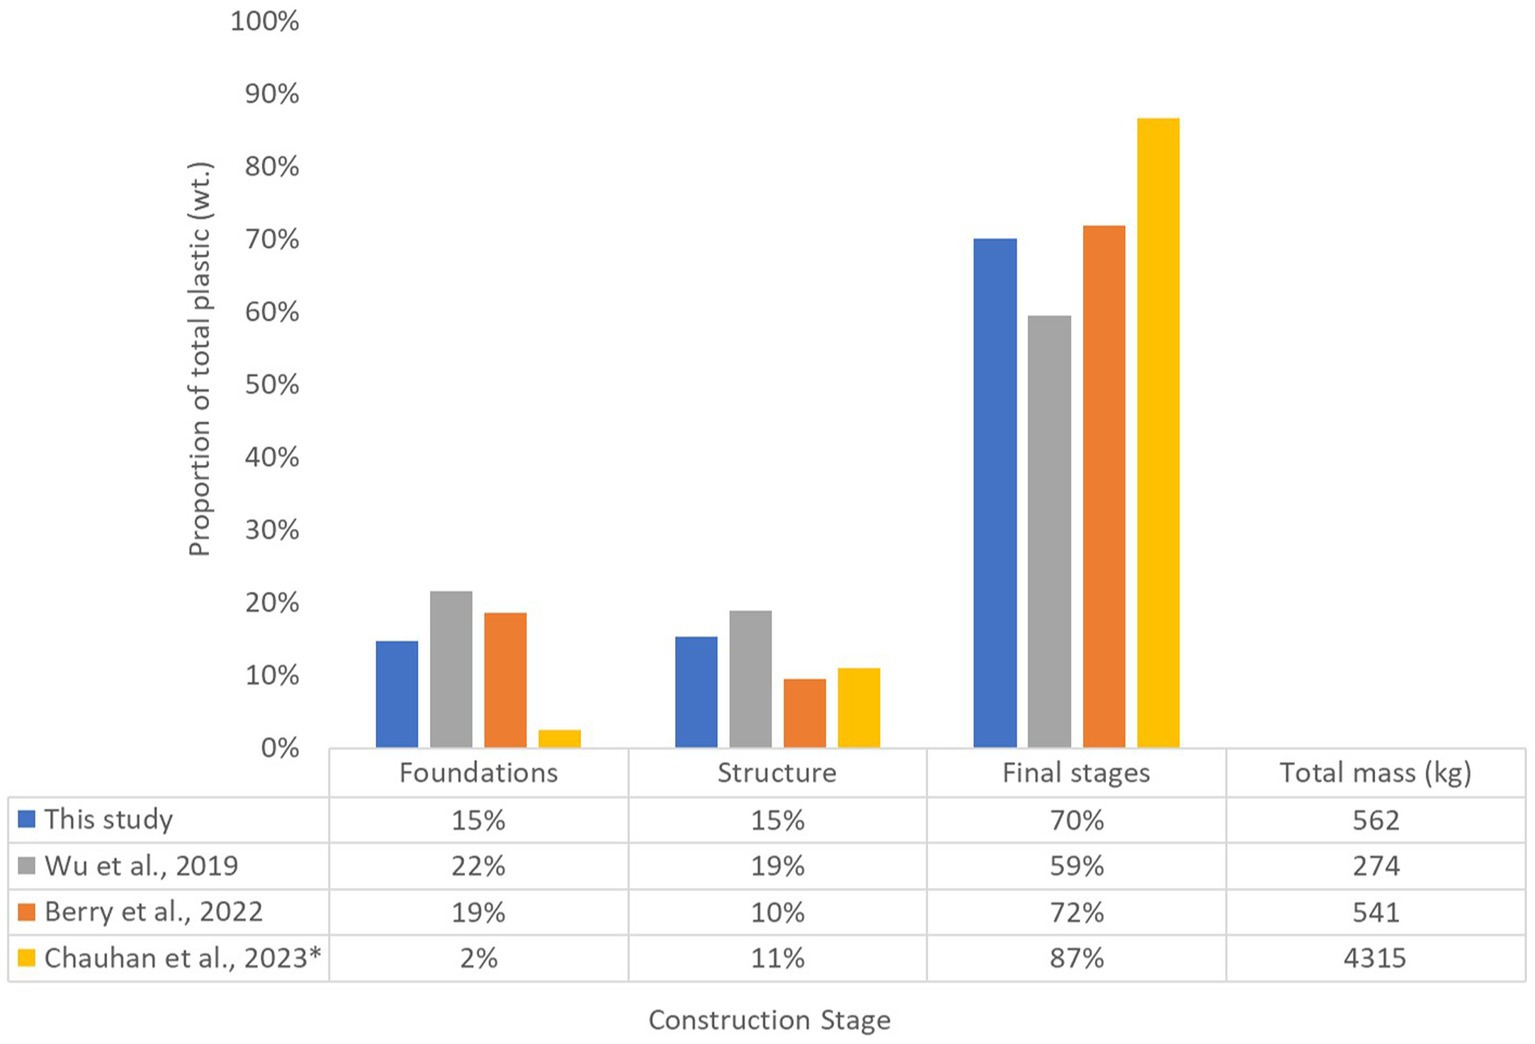
Figure 9. Comparison of total plastic waste generated in each construction stage (* = only investigating plastic films).
Wu et al. (2019) also audited the waste from three stages of three different construction sites in Hong Kong. Their results were similar to the findings of this study, where plastic waste (Plastic & Rubber, Nylon and Styrofoam/EPS waste) generated in the final stage greatly outweighed that of the mid and initial stages (Figure 9). However, 85% of all EPS was generated in the final stage of Wu et al.’s study; this difference may be due to differences in construction styles (e.g., using little to no EPS for building insulation in the initial stages). Chauhan et al. (2023) study of apartment buildings also found plastic films (i.e., soft plastics) to be most commonly generated in the final stages of construction (during interior work and mechanical, electrical and plumbing work) (Figure 9).
The data from this study can be used to inform construction sites in New Zealand and other countries. For example, the increase in soft plastic and polystyrene waste due to packaging, especially during the final stages of construction, would not be specific to residential construction or to New Zealand (Chauhan et al., 2023). Interior and exterior furnishings of any building type often come wrapped in soft plastic bags and polystyrene for product protection (Wu et al., 2019). As such, site managers can prepare for this by asking suppliers/installers to collect this packaging on their departure, or by collecting these plastics during the fitout stage and sending it to local recyclers where possible.
3.3 Costs and other benefits
After the project was completed, site staff expressed that they found on-site waste separation to be easier than anticipated. While it did increase time and cost compared to the use of a traditional skip, it was also an effective method for reducing waste-related hazards, keeping the site tidy, and diverting waste from landfill.
The total cost of the project (including design, regulatory and construction costs and excluding cost of land) was approximately NZD $3 million. Waste management on this site, including recycling costs and transportation of waste to recyclers, cost approximately NZ $20,000 (0.61% of total project cost). The plastic waste management itself was estimated to cost NZ $3,750 (0.11% of total project cost). This included costs and time of transporting plastics to the recycler but excluded additional labour costs of construction site staff for waste separation and handling (which was reported to be minor).
In comparison, we calculated that the cost of traditional waste management (all waste into commingled “skip” bins) would cost $9,000 (0.27% of total project cost) and require a total of twenty-three 9 m3 skips for disposal.
A common barrier to sustainable waste management and waste separation is the conception that it is expensive (Tam, 2008; Yuan, 2013; van der Lans et al., 2023). This project shows that the cost difference between on-site waste separation and using traditional commingled skips for waste disposal was 0.33%. In our case study, implementing sustainable strategies resulted in higher costs (NZD $11,000); however, the cost difference between traditional and sustainable waste management depends on factors such as the waste suppliers used, available regional transportation, and local recycling costs. Costs are also likely to increase with site size. The perceived reasonableness of waste management costs will vary by region and site owner, though the site owner in this study found the costs reasonable. The additional cost passed on to each homebuyer was calculated to be NZD $1,400, representing 0.16% of the house’s selling price.
The New Zealand government has announced its commitment to a low-emissions, low-waste society built upon a circular economy by 2050 (Ministry for the Environment, 2024a). To support this transition, the waste disposal levy has increased from NZ $10 per tonne in 2009 to NZ $60 in 2024 and will continue to increase to NZ $75 in 2027. Waste management plans for construction sites are currently only required in certain regions, (Wellington City Council, 2020; New Plymouth District Council, n.d.), however, they will eventually be mandated across the country (Ministry of Business, Innovation and Employment, 2022). In addition, the New Zealand government has declared plastic packaging as a “priority product”, requiring action to manage its waste. This can involve implementing a product stewardship scheme and/or regulating its sale or disposal (Ministry for the Environment, 2024b). The construction industry, which uses large quantities of soft plastic packaging such as timber covers, will need to contribute to this effort.
3.4 Limitations
This data was collected from a single construction site. Due to factors such as location, materials used and construction style, the plastic profile of this site is not necessarily representative of typical New Zealand or international construction sites; therefore, more studies are needed to produce a more representative profile of plastic waste generated on construction sites. However, inferences can be made from some of the findings, such as the stages in which plastics are generated (e.g., final stages of construction) as well as the prevalence of some plastic types (e.g., soft plastics). This information can be used to manage plastic waste sustainably on construction sites on a national and international scale.
The researchers audited the plastic waste generated off-site, which was provided by the site owner; as such, some plastic waste may not have been captured if they were not separated into the corresponding collection bags by site staff.
3.5 Significance of the results
Existing research in this field investigates certain plastic types and the effect of the construction stage on C&D plastic waste; however, research is relatively limited as these characteristics are seldom investigated together. This research is an in-depth study of construction plastic waste, giving a full characterisation of plastic types, polymer type and use category. Waste generation has been related to construction stage and provides a plastic waste profile of a new residential building. The key findings may be useful for other countries with similar building typologies and can be used by site managers to achieve more sustainable waste management. This includes more targeted plastic waste collection and recycling during final stages of construction and addressing the largest contributors to plastic waste generation, such as soft plastics, pipes and expanded polystyrene.
4 Conclusion
This study describes the plastic waste profile of a residential construction site based in New Zealand, including a timeline for the generation of specific plastic categories. This is a unique area of research which has not been previously investigated in detail. Across all waste categories generated, timber was the dominant waste material, representing 54% (wt.) of the total waste generated. Plastic waste accounted for only 3.2% of the total waste mass; however, by volume, it was the third-most generated waste type (13% of all waste). This underscores the need to manage and address plastic construction waste, which is a low density material that can occupy significant volumes in landfills.
The findings demonstrate that on-site waste separation can yield positive outcomes, resulting in an 84% (wt.) diversion of all waste from landfills, and 66% (wt.) diversion of plastic waste. Waste management costs were less than 1% of the total project costs, which challenges the common perception that sustainable waste management is prohibitively expensive.
The study site had a plastic WGR of 0.85 kg/m2 and an overall WGR of 26.2 kg/m2, similar to the reported overall WGR for double and single-storey houses in New Zealand. Soft plastics (largely PE) were the most generated plastic waste type, followed by pipes and EPS; these waste materials contributed 72% (wt.) of the total plastics generated and 97% of the recycled plastics. As such, targeting these three types of plastics on New Zealand construction sites for waste separation would likely have the greatest impact on plastic waste diversion. The largest volume of plastic waste was generated during the final stages of construction, particularly soft plastics and polystyrene – therefore, planning for the collection and diversion of these plastics during the final stages would improve site waste management and landfill diversion rates.
As New Zealand moves towards stricter waste management regulations, the insights from this study can inform policy and practices within the construction sector. While the results are based solely on this construction site, the findings can be generalised to advise plastic waste management on other construction sites in New Zealand and other countries. More studies of different construction site types (e.g., commercial, infrastructural, detached residential, and apartment blocks) are needed to identify other plastic types which may not have been captured in this study and to calculate WGR, which can be used for waste management planning. Additionally, conducting waste audits at construction sites across various locations would give a more representative plastic profile of local sites, as differences in building materials, typology and available waste management services can impact waste generation rates.
Data availability statement
The raw data supporting the conclusions of this article will be made available by the authors, without undue reservation.
Author contributions
JL: Writing – original draft, Writing – review & editing. GH: Writing – original draft. T-AB: Writing – review & editing.
Funding
The author(s) declare that financial support was received for the research, authorship, and/or publication of this article. Funding for this research initiative comes from the Building Research Levy and has been granted by the Building Research Association of New Zealand (BRANZ), with an expected end date in August 2024.
Acknowledgments
We would like to thank BRANZ and acknowledge financial assistance from the Building Research Levy, and to Laura Tammaro and Casimir MacGregor for their review of the article. A big thank you Nigel Benton and his team Caleb Douglas, Josh Brake, Joe Doran and Shane Wright for their invaluable support and for collaboration with us on this project. We would also like to thank Ruth Boyes, David Knight and Junk Run for their collaboration and sharing their data for the site.
Conflict of interest
The authors declare that the research was conducted in the absence of any commercial or financial relationships that could be construed as a potential conflict of interest.
Publisher’s note
All claims expressed in this article are solely those of the authors and do not necessarily represent those of their affiliated organizations, or those of the publisher, the editors and the reviewers. Any product that may be evaluated in this article, or claim that may be made by its manufacturer, is not guaranteed or endorsed by the publisher.
References
Al-Sari, M. I., Al-Khatib, I. A., Avraamides, M., and Fatta-Kassinos, D. (2012). A study on the attitudes and behavioural influence of construction waste management in occupied Palestinian territory. Waste Manag. Res. 30, 122–136. doi: 10.1177/0734242X11423066
Auckland Council (2018). Auckland’s waste assessment 2017 : Auckland Council Available at: https://www.aucklandcouncil.govt.nz/plans-projects-policies-reports-bylaws/our-plans-strategies/topic-based-plans-strategies/environmental-plans-strategies/docswastemanagementplan/waste-assessment-2017.pdf (Accessed February 8, 2023).
Berry, T.-A., Low, J. K., Wallis, S. L., Kestle, L., Day, A., and Hernandez, G. (2022). Determining the feasibility of a circular economy for plastic waste from the construction sector in New Zealand. IOP Conf. Ser. Earth Environ. Sci. 1122:012002. doi: 10.1088/1755-1315/1122/1/012002
BRANZ . (2020). Research now physical characteristics of new buildings #1. Available at: https://www.branz.co.nz/pubs/research-now/physical-characteristics/1-materials-houses/ (Accessed June 21, 2023).
Building Act 2004 . (2009). Available at: https://legislation.govt.nz/act/public/2004/0072/latest/DLM306036.html?search=ts_act_building+act_resel_25_a&p=1
Carpio, M., Roldán-Fontana, J., Pacheco-Torres, R., and Ordóñez, J. (2016). Construction waste estimation depending on urban planning options in the design stage of residential buildings. Constr. Build. Mater. 113, 561–570. doi: 10.1016/j.conbuildmat.2016.03.061
Chauhan, K., Peltokorpi, A., and Seppänen, O. (2023). Analysing film plastic waste in residential construction project, 509–520. Available at: https://iglc.net/Papers/Details/2152 (Accessed December 13, 2023).
Coelho, A., and de Brito, J. (2011). Distribution of materials in construction and demolition waste in Portugal. Waste Manag. Res. 29, 843–853. doi: 10.1177/0734242X10370240
Córdoba, R. E., Marques Neto, J. C., Santiago, C. D., Pugliesi, E., and Schalch, V. (2019). Alternative construction and demolition (C&D) waste characterization method proposal. Engenharia Sanitaria e Ambiental 24, 199–212. doi: 10.1590/S1413-41522019179720
da Silva, L. P., and da Costa Marques Neto, J. (2021). Analysis and characterization of the composition of construction waste in the city of Ribeirão Preto-SP. Gestão & Produção 28:e5237. doi: 10.1590/1806-9649-2020v28e5237
Department for Environment, Food & Rural Affairs (2023). UK statistics on waste : GOV.UK Available at: https://www.gov.uk/government/statistics/uk-waste-data/uk-statistics-on-waste.
Domingo, N., and Batty, T. (2021). Construction waste modelling for residential construction projects in New Zealand to enhance design outcomes. Waste Manag. 120, 484–493. doi: 10.1016/j.wasman.2020.10.010
Ferdous, W., Manalo, A., Siddique, R., Mendis, P., Zhuge, Y., Wong, H. S., et al. (2021). Recycling of landfill wastes (tyres, plastics and glass) in construction – a review on global waste generation, performance, application and future opportunities. Resour. Conserv. Recycl. 173:105745. doi: 10.1016/j.resconrec.2021.105745
Finch, G., Marriage, G., Pelosi, A., and Gjerde, M. (2021). Building envelope systems for the circular economy; evaluation parameters, current performance and key challenges. Sustain. Cities Soc. 64:102561. doi: 10.1016/j.scs.2020.102561
Hernandez, G., Low, J., Nand, A., Bu, A., Wallis, S. L., Kestle, L., et al. (2023). Quantifying and managing plastic waste generated from building construction in Auckland, New Zealand. Waste Manag. Res. 41, 205–213. doi: 10.1177/0734242X221105425
Islam, R., Nazifa, T. H., Yuniarto, A., Shanawaz Uddin, A. S. M., Salmiati, S., and Shahid, S. (2019). An empirical study of construction and demolition waste generation and implication of recycling. Waste Manag. 95, 10–21. doi: 10.1016/j.wasman.2019.05.049
Jonsson, R. (2009). Prospects for timber frame in multi-storey house building in England, France, Germany, Ireland, the Netherlands and Sweden (52) : Växjö University Available at: https://www.academia.edu/53904984/Prospects_for_timber_frame_in_multi_storey_house_building_in_England_France_Germany_Ireland_the_Netherlands_and_Sweden (Accessed December 8, 2023).
Katz, A., and Baum, H. (2011). A novel methodology to estimate the evolution of construction waste in construction sites | Elsevier enhanced reader. Waste Manag. 31, 353–358. doi: 10.1016/j.wasman.2010.01.008
Laadila, M. A., LeBihan, Y., Caron, R.-F., and Vaneeckhaute, C. (2022). Physical and chemical characterization of construction, renovation and demolition waste in the Quebec province. Clean. Waste Syst. 1:100002. doi: 10.1016/j.clwas.2022.100002
Lahtela, V., Hyvärinen, M., and Kärki, T. (2019). Composition of plastic fractions in waste streams: toward more efficient recycling and utilization. Polymers 11:69. doi: 10.3390/polym11010069
Lau, H. H., Whyte, A. A., and Law, P. (2008). Composition and characteristics of construction waste generated by residential housing project. Int. J. Environ. Res. 2:2.
Li, J., Ding, Z., Mi, X., and Wang, J. (2013). A model for estimating construction waste generation index for building project in China. Resour. Conserv. Recycl. 74, 20–26. doi: 10.1016/j.resconrec.2013.02.015
Lima, A., and Cabral, A. (2013). Characterization and classification of construction waste in Fortaleza (CE). Engenharia Sanitaria e Ambiental 18, 169–176. doi: 10.1590/S1413-41522013000200009
Llatas, C. (2011). A model for quantifying construction waste in projects according to the European waste list. Waste Manag. 31, 1261–1276. doi: 10.1016/j.wasman.2011.01.023
Lu, W., Yuan, H., Li, J., Hao, J. J. L., Mi, X., and Ding, Z. (2011). An empirical investigation of construction and demolition waste generation rates in Shenzhen city, South China. Waste Manag. 31, 680–687. doi: 10.1016/j.wasman.2010.12.004
Mah, C. M., Fujiwara, T., and Ho, C. S. (2016). Construction and demolition waste generation rates for high-rise buildings in Malaysia. Waste Manag. Res. 34, 1224–1230. doi: 10.1177/0734242X16666944
Mclntosh, J., and Guthrie, C. (2008). Structural insulated panels: a sustainable option for house construction in New Zealand? Int. J. Hous. Sci. Appl. 32, 15–27. Available at: https://web.p.ebscohost.com/ehost/detail/detail?vid=0&sid=bb174297-cb62-495c-a924-1f1d4e62e2c9%40redis&bdata=JnNpdGU9ZWhvc3QtbGl2ZSZzY29wZT1zaXRl#AN=31741762&db=a9h (Accessed July 21, 2023).
Menegaki, M., and Damigos, D. (2018). A review on current situation and challenges of construction and demolition waste management. Curr. Opin. Green Sustain. Chem. 13, 8–15. doi: 10.1016/j.cogsc.2018.02.010
Ministry for the Environment (2007). Targets in the New Zealand waste strategy: 2006 review of progress (ME 802) : Ministry for the Environment Available at: https://environment.govt.nz/publications/targets-in-the-new-zealand-waste-strategy-2006-review-of-progress/. (Accessed February 3, 2023).
Ministry for the Environment (2024a). Aotearoa New Zealand waste strategy : Ministry for the Environment Available at: https://environment.govt.nz/what-government-is-doing/areas-of-work/waste/aotearoa-new-zealand-waste-strategy/ (Accessed October 4, 2024).
Ministry for the Environment (2024b). Priority product stewardship : Ministry for the Environment Available at: https://environment.govt.nz/what-government-is-doing/areas-of-work/waste/product-stewardship/priority-product-stewardship/ (Accessed October 4, 2024).
Ministry of Business, Innovation and Employment (2022). Proposed building for climate change amendments released : Building Performance Available at: https://www.building.govt.nz/about-building-performance/all-news-and-updates/proposed-building-for-climate-change-amendments-released/ (Accessed December 11, 2023).
Navaratnam, S., Humphreys, M., Mendis, P., Nguyen, K. T. Q., and Zhang, G. (2020). Effect of roof to wall connection stiffness variations on the load sharing and hold-down forces of Australian timber-framed houses. Structure 27, 141–150. doi: 10.1016/j.istruc.2020.05.040
Nelson, J. M. B., Elliot, G., Pickering, K. L., and Beg, M. D. (2022). Preliminary materials flow analysis for Aotearoa New Zealand’s building construction sector (Āmiomio Aotearoa). Ministry for Business, Innovation and Employment (MBIE): Āmiomio Aotearoa – The University of Waikato.
New Plymouth District Council . (n.d.). Construction waste reduction plan: a guide. New Plymouth District council. Available at: https://www.npdc.govt.nz/zero-waste/waste-minimisation/waste-minimisation-at-work/construction-waste/#:~:text=NPDC%20Construction%20Waste%20Reduction%20Plan%20%E2%80%93%20a%20requirement%20for%20commercial%20building%20projects&text=From%20August%202021%2C%20anyone%20applying,Plan%20to%20NPDC%20for%20approval (accessed October 4, 2024).
Pickin, J., Randell, P., Trinh, J., and Grant, B. (2018). National Waste Report 2018 (P863) : Department of the Environment and Energy Available at: https://www.dcceew.gov.au/environment/protection/waste/publications/national-waste-reports/2018.
Plastics Europe (2022). Building & construction • plastics Europe : Plastics Europe Available at: https://plasticseurope.org/sustainability/sustainable-use/sustainable-building-construction/ (Accessed December 14, 2023).
Prestes, S. M. D., Mancini, S. D., Rodolfo, A., and Keiroglo, R. C. (2012). Construction and demolition waste as a source of PVC for recycling. Waste Manag. Res. 30, 115–121. doi: 10.1177/0734242X11413329
Ram, V., and Kalidindi, S. N. (2017). Estimation of construction and demolition waste using waste generation rates in Chennai, India. Waste Manag. Res. 35, 610–617. doi: 10.1177/0734242X17693297
Santos, G., Esmizadeh, E., and Riahinezhad, M. (2023). Recycling construction, renovation, and demolition plastic waste: review of the status quo, challenges and opportunities. J. Polym. Environ. doi: 10.1007/s10924-023-02982-z
Tam, V. W. Y. (2008). On the effectiveness in implementing a waste-management-plan method in construction. Waste Manag. 28, 1072–1080. doi: 10.1016/j.wasman.2007.04.007
Tam, V. W.-Y., and Lu, W. (2016). Construction waste management profiles, practices, and performance: a cross-jurisdictional analysis in four countries. Sustainability 8:190. doi: 10.3390/su8020190
Tong, K. T., Nguyen, N. T., Nguyen, G. H., Ishigaki, T., and Kawamoto, K. (2022). Management assessment and future projections of construction and demolition waste generation in Hai Phong City, Vietnam. Sustainability 14:9628. doi: 10.3390/su14159628
US EPA (2020). Advancing sustainable materials management: 2018 fact sheet : U.S. Environmental Protection Agency Available at: https://www.epa.gov/sites/default/files/2021-01/documents/2018_ff_fact_sheet_dec_2020_fnl_508.pdf (Accessed December 12, 2023).
van der Lans, P. A., Jensen, C. A., and Oraee, M. (2023). Overcoming head contractor barriers to sustainable waste management solutions in the Australian construction industry. Buildings 13:Article 9. doi: 10.3390/buildings13092211
Villoria Sáez, P., del Río Merino, M., and Porras-Amores, C. (2012). Estimation of construction and demolition waste volume generation in new residential buildings in Spain. Waste Manag. Res. 30, 137–146. doi: 10.1177/0734242X11423955
Wang, Q., Chen, L., Hu, R., Ren, Z., He, Y., Liu, D., et al. (2020). An empirical study on waste generation rates at different stages of construction projects in China. Waste Manag. Res. 38, 433–443. doi: 10.1177/0734242X19886635
Wellington City Council (2020). Solid waste management and minimisation bylaw 2020 : Wellington City Council Available at: https://wellington.govt.nz/your-council/plans-policies-and-bylaws/bylaws/solid-waste-bylaw-2020 (Accessed October 4, 2024).
Wilson, D., and Lewis, A. (2023). Waste and resource recovery infrastructure and services Stocktake and gap analysis—full summary report : Eunomia Research & Consulting Ltd (NZ) Available at: https://environment.govt.nz/publications/waste-and-resource-recovery-infrastructure-and-services-stocktake/ (Accessed December 12, 2023).
Wojnowska-Baryła, I., Bernat, K., and Zaborowska, M. (2022). Plastic waste degradation in landfill conditions: the problem with microplastics, and their direct and indirect environmental effects. Int. J. Environ. Res. Public Health 19:13223. doi: 10.3390/ijerph192013223
Wu, Y., Li, G., Yang, Y., and An, T. (2019). Pollution evaluation and health risk assessment of airborne toxic metals in both indoors and outdoors of the Pearl River Delta, China. Environ. Res. 179:108793. doi: 10.1016/j.envres.2019.108793
Wu, Z., Yu, A. T. W., Shen, L., and Liu, G. (2014). Quantifying construction and demolition waste: An analytical review. Waste Manag. 34, 1683–1692. doi: 10.1016/j.wasman.2014.05.010
Wu, H., Zuo, J., Yuan, H., Zillante, G., and Wang, J. (2020). Cross-regional mobility of construction and demolition waste in Australia: An exploratory study. Resour. Conserv. Recycl. 156:104710. doi: 10.1016/j.resconrec.2020.104710
Yeheyis, M., Hewage, K., Alam, M. S., Eskicioglu, C., and Sadiq, R. (2013). An overview of construction and demolition waste management in Canada: a lifecycle analysis approach to sustainability. Clean Techn. Environ. Policy 15, 81–91. doi: 10.1007/s10098-012-0481-6
Keywords: construction waste, plastic recycling, material composition, waste generation rate, residential construction, waste audit, on-site separation
Citation: Low JK, Hernandez G and Berry T-A (2024) Plastic waste characterisation to maximise landfill diversion from a New Zealand residential construction site. Front. Sustain. 5:1455480. doi: 10.3389/frsus.2024.1455480
Edited by:
T. A. Kurniawan, Xiamen University, ChinaReviewed by:
Issam A. Al-Khatib, Birzeit University, PalestineTalib E. Butt, Northumbria University, United Kingdom
Copyright © 2024 Low, Hernandez and Berry. This is an open-access article distributed under the terms of the Creative Commons Attribution License (CC BY). The use, distribution or reproduction in other forums is permitted, provided the original author(s) and the copyright owner(s) are credited and that the original publication in this journal is cited, in accordance with accepted academic practice. No use, distribution or reproduction is permitted which does not comply with these terms.
*Correspondence: Joanne K. Low, am9hbm5lQGVudmlyb25tZW50YWwtaW5ub3ZhdGlvbi5ueg==
 Joanne K. Low
 German Hernandez1,2
 Terri-Ann Berry