 Griffin Wilson
 Bazyl Horsey
- Department of Industrial and Manufacturing Systems Engineering, Iowa State University, Ames, IA, United States
Introduction: The global turkey market represents a sector of increasing growth in the previous decade, and projections for the next decade reflect the probable continuation of this growth. Industry trends also indicate the globalization of turkey meat production, as the loci of production has continually shifted from one dominated by the United States to one with an increasing number of production units globally. In contrast with other popular meat products, comparatively fewer resources have been devoted to academic research concerning the growth, production, distribution, and sale of turkey and turkey products. This lack of research is particularly notable in the area of supply chain management and environmental sustainability. Given the increasing volume of turkey production and lower volume of academic interest, it stands to reason that there remain many opportunities for improvement across the value chain in this industry.
Methods: In this paper, we take a “green logistics” approach and use data provided by one of the largest turkey producers in the United States to formulate a mixed-integer program aimed at minimizing the environmental impact of turkey products in a segment of the product supply chain.
Results: Implementation of the resulting brooder-finisher farm assignments developed by the model would yield an average 50% decrease (184 metric ton) in greenhouse gas emissions at the operation under investigation while also addressing other areas of significant vulnerability for the industry (production costs, biosecurity risk, and animal wellbeing).
Discussion: As consolidated turkey meat production systems continue to expand globally, we argue that a similar approach could readily be deployed by these growing and emerging production systems.
1 Introduction
In the last two decades, a significant volume of research has arisen with the objective of reducing the greenhouse gas (GHG) emissions across the global value chain. While many models and frameworks have been developed, more work is needed in detailing practical changes that firms might readily deploy in their continual effort toward minimizing emissions (Bratt et al., 2021). Concurrent with these research endeavors surrounding green logistics, which may be defined as “the systematic measurement, analysis, and ultimately, mitigation of the environmental impact of logistics activities,” a gradual transformation has occurred in the global turkey market (Blanco and Sheffi, 2017). While global turkey production volume has increased gradually over the last decade, the loci of production and consumption has continually shifted from a market dominated by the United States (US) toward a market that has an increasing number of global producers and consumers (Kálmán and Szollosi, 2023). This transition presents a unique opportunity to implement “green” supply chain solutions as additional production units continue to emerge.
An outline of the paper may be summarized as follows: firstly, after providing additional context surrounding the global turkey market (Section 2.1) and the turkey market's challenges (Section 2.2), we aim to describe the supply chain associated with the production of turkey products (Section 2.3). Secondly, after providing some additional context related to green logistics (Section 2.4), we formulate a mixed-integer programming (MIP) model with the goal of minimizing the GHG emissions associated with a segment of the turkey production supply chain (Section 3). Thirdly, using data provided by one of the largest turkey producers in the United States (US), which we refer to as “the Company,” we apply the MIP model and compare the resulting green logistics model with historical data (Section 4.1). Finally, we discuss the limitations of this green logistics model and the significance of the findings for other large turkey manufacturers (Sections 4.2 and 5).
The output generated by the MIP model described herein develops optimal brooder-finisher assignments1 in a turkey growth and production network. We argue that implementation of this model at any large turkey manufacturer would result in an organization of their supply chain in such a way that would respond to the preeminent challenges faced by the turkey industry, including a reduced Global Warming Potential (GWP, the kg of CO2-equivalents generated per kg of goods manufactured) of turkey products, increased biosecurity, and increased animal wellbeing. Previous research in the turkey industry directed at improving these parameters has focused heavily on optimizing feed efficiency,2 modifying feed composition or farm worker behavior, and manipulating a variety of environmental factors (stocking density, temperature, light/chemical exposure, etc.).3 However, there remains a notable gap in the foregoing academic research in the area of supply chain solutions for the turkey industry. Moreover, even a description of the supply chain processes analyzed in this paper has previously been confined to popular press articles and industry manuals, and not as an object of academic investigation. Thus, this paper finds its primary contribution in the successful application of a well-studied solution methodology (the Vehicle Routing Problem) to a “new” industry and, in doing so, provides a framework that other turkey manufacturers might readily adopt.
2 Background
The recorded history of the turkey spans some 500 years, with the bird having served as an important staple to the Native American diet for thousands of years prior. Archaeological evidence suggests that several Native American groups had domesticated the bird before European arrival in the Americas, and records indicate that the bird was then domesticated in Europe shortly thereafter (Brant, 1998; Peres and Ledford, 2016). In the most recent century, turkey has remained a commodity that enjoys significant seasonality due to its association with Thanksgiving and Christmas holidays. Additionally, owing to a favorable nutritional profile, adaptability to various climactic conditions, lack of religious constraints, and increased globalization, turkey products have become increasingly popular throughout the year and around the world (Henrikson et al., 2018; Famous et al., 2019; Khatko and Shirokova, 2022).
2.1 The global turkey market
Concurrent with advancements in genetics, feed science, and animal husbandry, the global turkey market has become increasingly productive, saturated, and competitive (Herendy et al., 2003). In 1962, turkey production in the US comprised nearly 61.1% of global output; in 2022, US production consisted of only 40.8% of global output (FAO, 2024). In the last 15 years, US production has remained relatively constant at 2.7 (+/−0.2) million metric tons while global production has increased from 5.5 million tons in 2007 to 6.2 million tons in 2021 (IndexBox, 2024; USDA, 2024b). Additional countries which hold significant share in the global turkey market and have seen a decline in production and market share in recent years include France (38% decrease in production between 2011 and 2021, 6.8% global market share in 2021), Germany (12.3% decrease, 6.3% share), Brazil (48% decrease, 2.8% share), and the United Kingdom (29% decrease, 2.3% share; FAO, 2024).
As the US, Brazil, and many western European countries have seen either stable or declining production, a variety of other players have emerged on or strengthened their position in the global market. Between 2011 and 2021, Russia increased production the most with an increase of 350,000 tons (Kálmán and Szollosi, 2023). This represents a 615% increase from 2011 and a 6.5% share of global production in 2021. Other nations increasing their production over the same time period include Poland (55% increase, 6.7% share), Spain (64% increase, 5.0% share), Morocco (52% increase, 4.1% share), and Tunisia (78% increase, 2.4% share; FAO, 2024). Nations which represent a notable (1–5%) share of the market and have demonstrated consistent production in the last 10 years include Argentina, Australia, Canada, Hungary, Italy, and Israel (FAO, 2024).
Top importing countries include Mexico, Germany, and Benin while top exporting countries include the US, Poland, and Germany (Kálmán and Szollosi, 2023). Global per capita consumption has remained relatively constant at ~0.75 kg/capita-year for the last decade (~5% of global poultry consumption); Israel held the greatest per capita consumption at 9.56 kg/capita-year in 2021, with Qatar, the US, Germany, and the Bahamas having the next greatest per capita consumption rates (Kálmán and Szollosi, 2023).
Continuous increases in turkey production and consumption are expected in the next 5–10 years. Roiter et al. (2021) project a 10–12% increase in finished turkey product consumption in Russia by 2030, as increasing turkey production represents an important aspect of Russia's long-term food security strategy (Zimnyakov and Dmitrieva, 2018; Askerov et al., 2021). In comparison, EU production is expected to continue to decline due to increasing domestic and environmental costs while US production is projected to remain relatively stable as in the previous decade (OECD/FAO, 2022; IBIS, 2024). Global turkey consumption of 6.7 million tons is projected for 2025, an 8% increase from 2021 (Hristakieva, 2021). More broadly, global meat consumption is projected to reach 377 tons by 2031, a 48% increase from a 255 ton 2019–2021 baseline; the greatest share of this growth (42.7%) is expected to come from increases in poultry consumption, particularly in developing countries (OECD/FAO, 2022). This livestock expansion is expected to be fueled by an increased consolidation of production units, indicating a continuous shift from small, local farms toward those resembling integrated growth and manufacturing systems as described in Section 2.3 of this paper (OECD/FAO, 2022).
We conclude this section by emphasizing the following points: (1) global turkey meat production has increased steadily over the last decade and is expected to continue to increase over the next decade, (2) this increased production has been and is expected to continue to be fueled by a disproportionately large increase in new production units in developing nations which offset the decline in production units seen in many developed nations, and (3) these new production units will likely resemble the integrated systems such as the one shown in Figure 1. As a result, the turkey supply chain will become increasingly homogenized, representing an opportunity for global manufacturers to more readily implement “greener” supply chain solutions such as the one described in Section 3 of this paper.
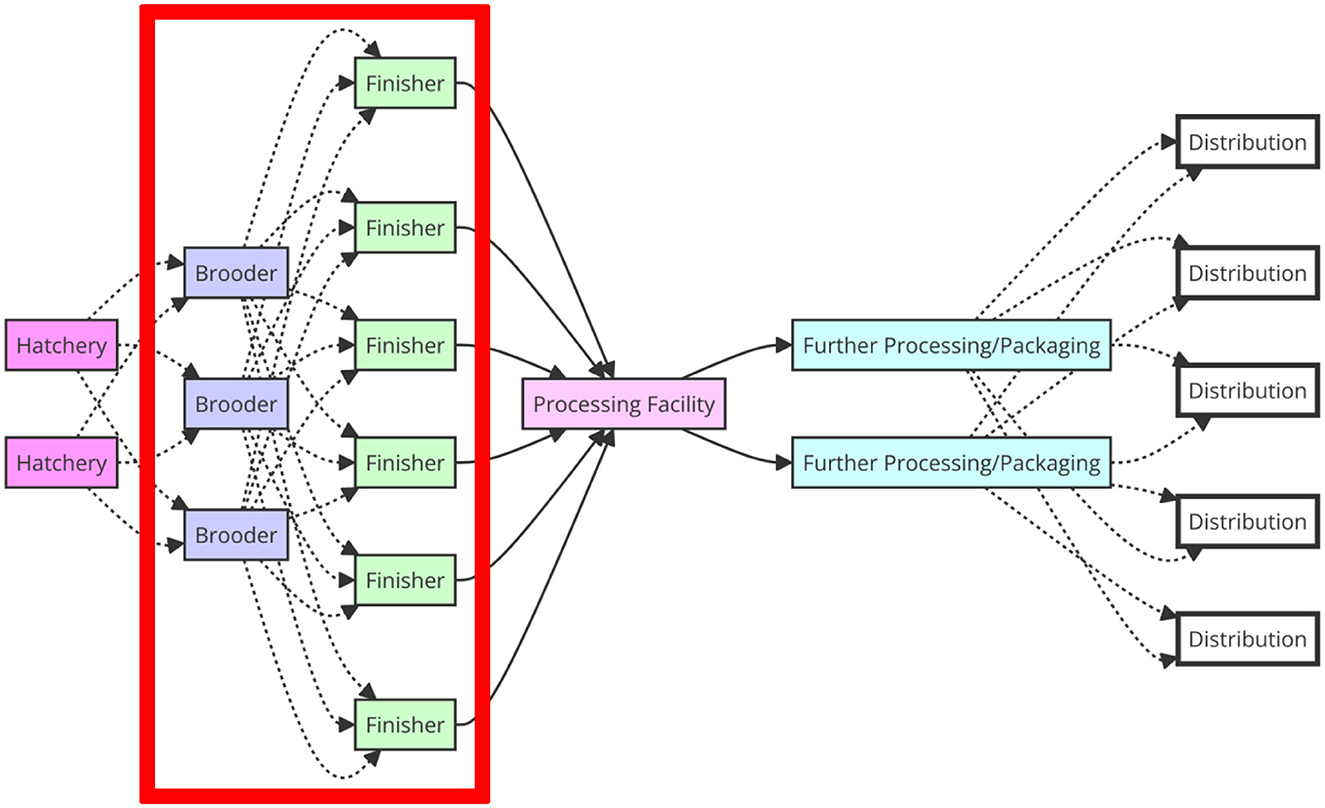
Figure 1. Depiction of the turkey product supply chain. The segment of the supply chain analyzed in this paper is highlighted in red.
2.2 Challenges facing the turkey market
Despite the historical and expected continual growth of the turkey market, there remain many challenges manufacturers face when beginning, maintaining, and expanding production. Aside from the economic challenges associated with meeting increased global demand, manufacturers must contend with social challenges including pressure from consumer concerns over animal wellbeing, challenges related to biosecurity, and challenges related to environmental sustainability.
2.2.1 Social
As the technology and practices utilized in large-scale meat production have changed in the last several decades, a significant body of literature has arisen characterizing consumer attitudes, preferences, and understanding relating to animal welfare. Notwithstanding limited knowledge surrounding the animal husbandry systems utilized by large producers, consumers consistently rate animal welfare as important to them (Verbeke and Viaene, 2000; Frewer et al., 2005; Fleming et al., 2020). Tonsor et al. (2009) demonstrated that media coverage in the US related to animal husbandry and welfare increased between 1982 to 2008, and that there was a statistically significant relationship between negative coverage and decreased demand. The majority of consumers in developed countries receive substantial information about food products from television, the popular press, and social media, thus, large producers suffering from negative media coverage related to poor animal welfare practices face a significant risk of lost revenue (Kalaitzandonakes et al., 2004; Coleman et al., 2022). Few articles discuss public perception of turkey welfare and production processes, however, Bir et al. (2019) found that, for turkey, poor nutrition and illness rank as the top concerns amongst US consumers.
Given the link between public perception and demand, manufacturers clearly have an incentive to maintain a high level of wellbeing for their turkey flocks. Supplementing this incentive is the fact that less diseased, less stressed, more energetic, and better-fed flocks result in fewer mortalities, greater feed efficiency, and greater yield for the manufacturer (Erasmus, 2018). As such, optimizing flock performance via improved animal welfare is an area of significant interest for academia and industry alike. The effects of hot and cold exposure, chemical exposure, stocking density, lighting, antibiotic use, feed composition, and various transportation strategies are all topics of high and prolonged interest (Sherwin et al., 1999; Erasmus, 2017; Wein et al., 2017; Cândido et al., 2018). The relationship between travel distance and mortality rates (for the Company) is explained further in Section 4.1.2 of this paper. Transport represents one of the most stressful events in poultry husbandry and, as such, any supply chain solution or modification must consider the potential impact on animal wellbeing (Marchewka et al., 2013).
2.2.2 Biosecurity
A significant threat to meeting the large and increasing demand on the global turkey meat supply is presented by communicable disease outbreaks, particularly Exotic Newcastle Disease (END, also called Paramoxyvirus) and Highly Pathogenic Avian Influenza (HPAI; Frame, 2010; WOAH, 2024). Due to a natural susceptibility to respiratory infections, both END and HPAI pose significantly greater risks to turkey populations than other forms of poultry (Russell et al., 1989). In one study, Aldous et al. (2010) found turkey to be over 200 times more susceptible than chicken to two recent strains of HPAI. Given the ease of transmission, high prevalence, high mortality rate, and the often-low efficacy of inoculation for these pathogens, the implications of an uncontrolled and widespread outbreak are severe. Consequently, the US Department of Agriculture, EU, and Russian Ministry of Agriculture (as a few case examples) have developed sizeable regulatory frameworks, research programs, monitoring networks, and emergency response procedures aimed at curtailing the risk (Code of Federal Regulations, 2006; Cardona et al., 2018; European Food Safety Authority, 2021; Vorotnikov, 2024).
Preventative measures taken to reduce the risks of infectious disease include proper facility siting (away from water, other livestock), pest control, limiting access to farms, personal protective equipment requirements for farm workers, sanitization procedures (for farm equipment and personnel, replacing litter between flocks), allowing “down time” between flocks, farm climate control, removal of dead livestock, and frequent flock surveillance (USDA, 2013; van Staaveren et al., 2020; Islam et al., 2024). In their assessment evaluating the risk of HPAI infection throughout the turkey-growing process, Cardona et al. (2018) identify transportation and load-out of birds as the segment of the process which poses the greatest risk to spreading infection. Thus, any satisfactory supply chain change or solution must contend with potential impacts on biosecurity.
2.2.3 Environmental sustainability
Agricultural production accounts for 19–29% of global anthropogenic GHG emissions, a significant proportion of which (up to 80%) may be attributed to meat production (Fiala, 2008; Vermeulen et al., 2012; Barthelmie, 2022). As noted in Section 2.1 of this paper, global meat consumption is expected to increase 48% (122 tons) by 2031, with the largest share of this change coming from increased poultry consumption. Accordingly, reducing the GWP of poultry products represents a critical component of improving the sustainability of the world's food supply. Numerous Life Cycle Assessments (LCAs) have been conducted estimating the environmental sustainability of chicken, and authors have calculated GWP values ranging from 1.06 kg CO2-e to 9.98 kg CO2-e with a mean of 4.12 kg CO2-e (de Vries and de Boer, 2010; Clune et al., 2017; Costantini et al., 2021). Comparatively fewer LCAs for turkey are available for analysis, however, Leinonen et al. (2016) and Kheiralipour et al. (2017) estimated the GWP for turkey at 3.63 kg CO2-e and 4.57 kg CO2-e, respectively. In a 2023 LCA commissioned by the Turkey Farmers of Canada, the agri-food analysis firm Groupe AGÉCO calculated the GWP for turkey at 3.50 kg CO2-e, with 77% of these emissions coming from the growing of the bird. The largest contributing factors to emissions, both in turkey growing and in the overall product life cycle, are attributable to feed (~35% total emissions), energy for farm upkeep (~17% total emissions), and transportation (~12% total emissions; MacKimmie, 2023).
Many groups advocate for sweeping dietary changes as an effective method of curbing climate change (Yue et al., 2017; United Nations, 2024). In comparison with beef (average GWP: 28.73 kg CO2-e) and other ruminant meat, turkey presents a promising alternative (Clune et al., 2017). Hallström et al. (2015) calculated that replacing ruminant meat with monogastric meat (chicken, pork, turkey, etc.) would result in a 20–35% decline in GHG emissions from dietary sources. Nonetheless, turkey holds a significantly higher GWP than most plant-based sources (with GWPs ranging from 0.20–1.50 kg CO2-e; Clune et al., 2017). Given the increasing rates of turkey consumption, turkey's high relative GWP when compared to plant-based sources, and the sizeable contribution of transportation to turkey's GWP, implementing sustainable supply chain solutions remains an imperative for the turkey industry.
2.3 The turkey supply chain
As further context for the MIP model and ensuing discussion, this section aims at characterizing the turkey supply chain, with a special emphasis on steps two to three of the process described below. A brief overview of the supply chain in its entirety may be described as follows (also depicted in Figure 1)4:
1. Incubation of eggs at a hatchery.
2. Delivery of 1-day-old chicks to farms termed “brooders” in the industry. These farms are specially outfitted to care for birds in their first 4–6 weeks of life.
3. Upon sufficient maturation of the juvenile turkeys (also called “poults”), the livestock is transported from the brooder to a farm referred to as a “finisher” farm. At the finishers, birds are raised to full maturity, which could be expected to take a further 15 weeks.
4. Upon reaching full maturity, grown turkeys are then sent from the finisher to the processing facility where they are harvested.
5. Following the harvesting of the animal, the assortment of products gathered from the bird are then sent to other facilities for further processing and packaging, as differing products (thigh meat, breast meat, offal, etc.) may be allocated to different commodities (sausage, hot dogs, sandwich meat, pet food, etc.). As an alternative to this step, some larger manufacturers have combined processing and finished product facilities.
6. Finished product is sent to distribution warehouses and customers.
In comparison with industries representing a greater share of global meat consumption such as chicken, pork, and cattle, less information relating the turkey production process and supply chain is publicly available. Much of this information is derived from the author's personal experience working in the industry, from historical data provided by the Company, and from consulting with Company farm managers and production planners, however, additional and confirmatory details may be found in USDA (2013) and Cardona et al. (2018).
As stated above, the MIP model formulated in this paper aims to reduce transportation distance and subsequent GHG emissions from the movement of poults between brooders and finishers (steps two and three). The following points are important in clarifying to the reader the details of this process and in generating assumptions and constraints for the model described in Section 3.3 of this paper.
The Importance of Brooders, Former Utilization of “Brood to Finish” Farms: the brooder to finisher step in the turkey supply chain is one element which distinguishes this commodity from other types of poultry, such as chicken or duck. In comparison to the ~20-week life cycle and 20 kg harvest weight for turkey at the Company, commercial broiler chicken may take only 7 weeks to grow and weigh a comparative 3 kg at harvest (USDA, 2024a). Thus, manufacturers find it convenient to have chicken spend their entire life cycle in one building. Such a production model was formerly favored in the turkey industry via the use of so-called “brood to finish” farms, however, this model has fallen out of favor, mainly due to the increased biosecurity risk, higher cost, and poor utilization of space associated with “brood to finish” growing schemes.
Farm Capacity: as implied by Figure 1 and explained in Section 3 of this paper, the number of brooder farms is generally significantly less than the number of finisher farms. Brooders and finishers also have varying capacities of flock sizes they accommodate. It remains important to note that the demand is fixed at the brooder to finisher level, as contracts with the turkey hatcheries supplying the brooders are negotiated years in advance. Historical data (3 years) and production forecasts (2 years) provided by the Company indicate that demand at the hatchery to brooder level is also consistent, further validating this fixed-demand assumption.
Timing: some elements related to this constraint have been discussed in previous sections. The amount of time required to raise the turkey would depend on the breed, the sex, the feeding schedule, and a variety of other factors. The turkeys utilized by the Company in this problem spent an average of 5 weeks in the brooder prior to transfer to a finisher, where the livestock was grown for a further 15 weeks. This schedule may be extended or condensed to some extent dependent upon the performance of the flock and the processing facility, however, every effort is made to harvest the birds at a weight of 20 kg, which, in the case of the Company, is the design specification of the turkey harvesting equipment at the processing facility; too great of a deviation from this weight results in decreased yield. Due to the concern for biosecurity, there is also a need to sanitize farm equipment and replace litter between each flock. The time allotted for this would depend slightly on the production schedule and flock performance, but, for the Company's farms, this historically took 3–4 weeks for brooder farms and 2–3 weeks for finisher farms. The time to completely turnaround a brooder farm for a new flock shall be taken as 60 days (35 days growing, 25 days sanitization/preparation) and the time taken to completely turnaround a finisher farm shall be taken as 120 days (105 days growing, 15 days sanitization/preparation). Thus, the model will formulate an “A/B” system wherein each brooder farm will be assigned to two groups of finisher farms; this could be contrasted against the Company's current “first available” system in which poults from a brooder are sent to whichever finishers are currently available, without consideration for distance traveled.
Biosecurity: the importance of this constraint was discussed at length in Section 2.2.2. As it relates to its application in this problem, the primary biosecurity concern taken into account in the model formulation is that different brooder flocks may not be combined upon transfer to the finisher (finisher farms are comprised of multiple barn buildings). While it may be efficient from a logistical point of view to allow brooders to “share” finisher assignments, this would result in an unacceptable biosecurity risk. Thus, finishers may be assigned to only one brooder.
Further Remarks on Transportation Between Brooders and Finishers: upon the transfer of birds from brooders to finishers, poults are loaded into trailers at the brooder farm and then unloaded at one of a few finishers. Trailers used for transfer hold up to 3,000 poults. Thus, a brooder with a capacity of 120,000 would require 40 trailer trips to empty to a set of finishers, a finisher with a total capacity of 33,000 would require 11 trips to fill, and so on.
2.4 Previous research in green logistics and application in the present study
Prior to the 1960's, relatively little concern in academic literature was given to the environmental degradation caused by freight transport, and a common assumption was held that the environment's ability to effectively absorb wastes and replace resources was effectively infinite (Murphy et al., 1995). However, as the environmental externalities associated with freight transport continued to mount throughout the latter half of the twentieth century this erroneous assumption was increasingly cast aside, and an increasing number of logistics publications and corporations began to investigate methods of decreasing the negative environmental impacts of their supply chains (Aronsson and Huge-Brodin, 2006; Mckinnon, 2015). In a more recent review by Ma and Kim (2023), the researchers reveal that “green logistics” has become a vibrant area of scholarly inquiry. They demonstrate the rapid growth of the field from only a few 100 publications annually in the mid-2000's to almost 3,500 in 2021, and identify “optimization analysis of low-carbon vehicle routing and time” (the subject of this paper) as one of the most active research topics in the last few years.
Although many definitions of varying scope have been proposed for the term “green logistics,” for the purposes of this paper we utilize the definition provided by Blanco and Sheffi (2017): “the systematic measurement, analysis, and ultimately, mitigation of the environmental impact of logistics activities.” This might encompass supply chain activities involved in purchasing, warehousing, production, transportation, delivery, or reverse logistics. One might reasonably assume that any type of cost-reduction effort realized by a more “efficient” supply chain could be considered “green,” however, this is not the case. As many studies have shown, some supply chain “efficiencies” including centralization of inventory, wider sourcing of materials, and just-in-time inventory systems come with a greater environmental cost (Whitelegg, 1994; Garnett, 2003; Matthews and Henrickson, 2003). Nevertheless, implementing green logistics solutions are frequently associated with decreased cost and improved financial performance (Rao and Holt, 2005; Wang and Sarkis, 2013; Ahmad et al., 2022). In PwC/APIC's 2013 survey of 162 supply chain professionals representing large US companies, “cost reduction” was cited as the top benefit derived from sustainable supply chain initiatives (PwC and APIC, 2014).
In this study, we develop a MIP model with the objective of reducing the distance traveled (and, subsequently, GHG emissions) when transporting turkey poults from brooders to finishers. This transportation problem may be classified as a Vehicle Routing Problem (VRP), a class of problems first described in 1959 by Dantzig and Ramser which seeks to determine the least-cost delivery route from a facility to a set of geographically disbursed customers; this class of problem has seen numerous successful applications (Dantzig and Ramser, 1959; Laporte, 2009). The Pollution Routing Problem (PRP), is a variation of VRP in which variables such as speed of travel, terrain, equipment characteristics, load weight, loading time, and congestion are utilized in the construction of the optimal network design (Bektaş and Laporte, 2011). While in this model we do consider equipment characteristics in the overall GHG emissions calculation, factors such as speed of travel, terrain, and congestion are assumed to be negligible due to homogeneity of the vehicles used in transport and the flatness of terrain and lack of congestion in the area surrounding the farms located in this study. As such, the way we formulate this problem more accurately resembles a traditional VRP.
Several authors have applied a variety of mathematical modeling approaches toward improving the efficiency and/or sustainability of chicken processing and distribution operations, although none have ventured to apply similar methods to turkey growing. A significant proportion of these studies apply linear programming approaches to either nutrition delivery (Chagwiza et al., 2016; Alqaisi et al., 2017) or manure management (Ma et al., 2018; Deng et al., 2022). Islam et al. (2016) applied a MIP approach to the poultry industry in Bangladesh, effectively assigning retailers to manufacturers with the objective of maximizing profits to retailers. Boudahri et al. (2011) approached a chicken processing facility and chicken farm citing problem wherein processing facilities were allocated to areas around customer clusters and farms allocated around processing facilities; this was done in such a way to minimize the transportation costs in the network. While both of these studies approach similar problems as those addressed in this study (assignment and transportation cost minimization), neither adequately approximates the circumstances.
Expanding the scope of this literature review beyond just the poultry industry, one may—in some respects—find a greater similarity between the pre-processing animal transport supply chain of cattle and turkey than between chicken and turkey. In the cattle industry, calves are raised with their mothers for ~6 months prior to being weaned (for 2 months on average) and then transported to feedlots; additional transport nodes and logistics stopovers are possible at auction markets, classification centers, or health checkpoints (Miranda-de la Lama et al., 2014; Machado and Michael, 2022). This may be contrasted against the transport nodes found in the pre-processing turkey supply chain (hatcheries, brooders, finishers, and processing facility). In an attempt to optimize this aspect of the cattle supply chain, a variety of authors taken approaches similar to the one we present in this paper. Frisk et al. (2018) deployed a MIP via the RuttOpt route optimization system for the purposes of solving a pick-up and delivery problem with the objectives of minimizing transport time and distance driven. Morel-Journel et al. (2021) effectively assigned weaned calves to sorting centers via an algorithm that could be classified as an MIP with Time Windows (TW) with the objective minimizing transport distance. As a final case example, Gebresenbet et al. (2011) utilized the commercially available Route LogiX software to simulate and arrange transportation assignments between feedlots and an existing and prospective new processing facility. A summary of the objectives, methodology used, and results obtained by some of the foregoing research relevant to our paper is reviewed below in Table 1.
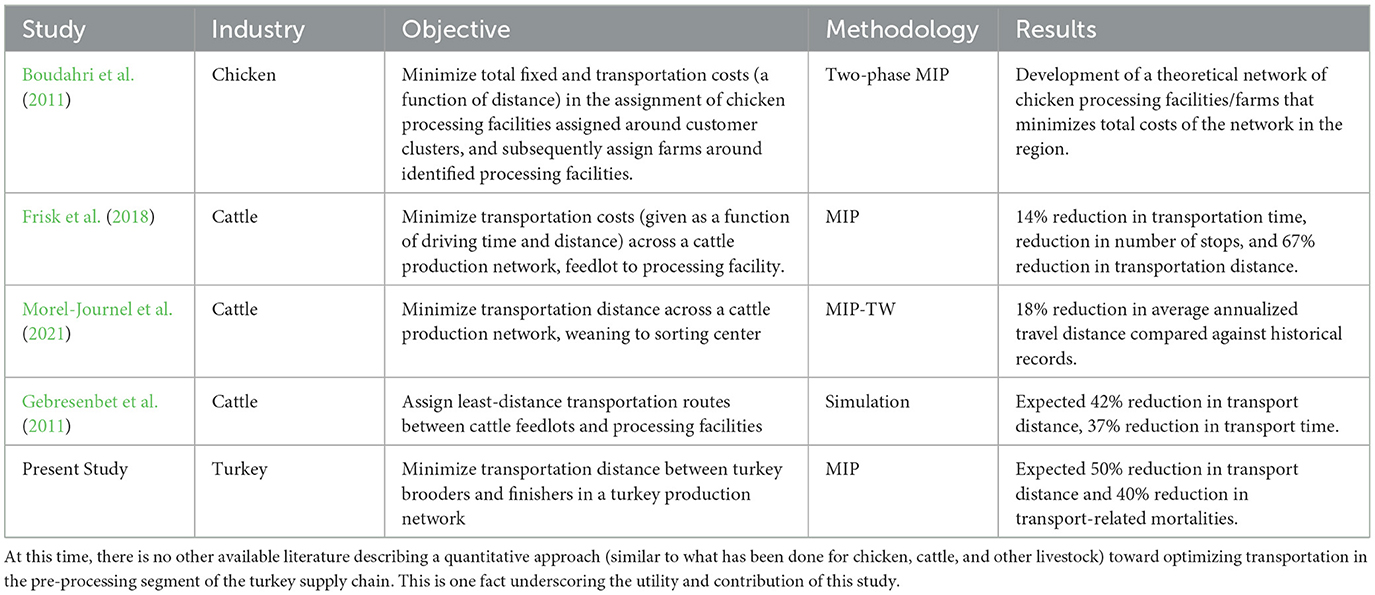
Table 1. Summary of related research.
From this review of green logistics and some recent applications, we conclude that (1) implementing supply chain solutions directed at reducing GHG emissions is a topic of increasing importance and interest, (2) amongst a variety of approaches, the use of VRP MIPs for the purposes of solving assignment problems has been successful in similar industries, and (3) no similar approach to optimizing the turkey growing supply chain has yet been proposed. Thus, a significant contribution of this study lies in its novel application of a well-proven and applied method to the turkey industry.
3 Problem formulation
Now that the reader has been provided with a sufficient level of background information necessary to understand the challenges faced by the turkey industry, the energy-intensive nature of transporting poults between brooders and finishers, and the potential for application of green logistics in this process, we propose the following MIP model formulated as a VRP.
3.1 Symbol descriptions
Let i denote the index of brooders and j denote the index of finishers. The capacity of brooder i shall be given as ai and the capacity for finisher j shall be given as bj. The number of trailer trips required to fill finisher j would be equal to the capacity of finisher j divided by the number of poults delivered to the finisher by each trailer trip (3,000). Thus, a finisher with a capacity of 33,000 would take 33,000/3,000 = 11 trailer trips to fill. The number of trailer trips times the distance between brooder i and finisher j would equal the total travel distance required to fill finisher j from poults provided by brooder i, a value which shall be described as dij. The binary decision variable xij shall be equal to 1 if finisher j is assigned to receive poults from brooder i and 0 otherwise. The notation for this VRP is summarized in Table 2.
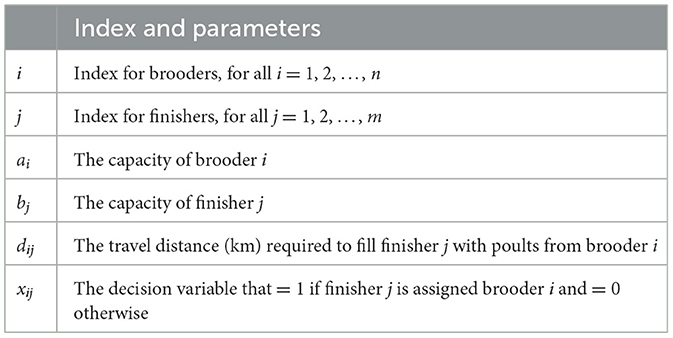
Table 2. Notation for the brooder-finisher VRP.
3.2 Data collection
The dataset used in the application of this model may be found in the Supplementary material. All data related to capacity and distance is based on the operational and geographical data provided by one of the largest turkey manufacturers in the US (referred to as “the Company”). The Company operates 10 brooder farms with a capacity of 110,000 to 187,000 birds/farm and 66 finisher farms with a capacity of 22,000, 33,000, 44,000, or 55,000 birds/farm. The distances between brooder and finisher farms ranges from 1.5 to 135 km. On an annual basis, this collection of farms would be expected to grow ~9 million turkeys/year.
3.3 Model formulation and solution methodology
The objective function applied to optimize brooder-finisher routing is described in Equation (1):
The model is subject to the following constraints:
Equation (1) seeks to minimize the total travel distance between brooders and their assigned finishers. The constraints represented by Equations (2) and (4) ensure that each finisher may be assigned to only one brooder while the constraint represented by Equation (3) ensures the collective capacity in those finishers assigned to brooder i is sufficient to accept two flocks of brooder poults. This also ensures that assignments intrinsically allow any output to observe the timing constraints, since the turnaround time for finishers is twice that of brooders. Additionally, as argued in the following section, the use of Equation (3) results in a system organization that better promotes biosecurity than a “first available” production model.
The solution methodology we employ for solving this MIP is exemplified by the combination of root relaxation and the branch-and-bound algorithm. Initially, the root node is determined via root relaxation, wherein the integer constraints are relaxed, allowing the variables to assume continuous values. As the branch-and-bound algorithm progresses, cutting planes are employed to further tighten the bounds and eliminate fractional solutions, thereby enhancing the efficiency of the search process.
4 Results and discussion
The objective function and constraints described in the previous section were built into a program utilizing the Gurobi Optimizer software (output and parameters may be found in the data availability statement). This model was then solved utilizing the capacity and distance data provided by the Company as well as the solution methodology just described.
4.1 Model results
Solving the foregoing model with the given constraints yields the optimal brooder-finisher assignments (Data and code may be found at this repository: https://github.com/bazylhorsey/livestock-logistic-optimizer). This output details the exact assignments of brooders to each finisher given the objective and constraints detailed above. For example, brooder 2 in this case is assigned to send poults to finishers 8, 16, 22, 23, 24, 33, 40, 46, and 64. The capacity of the identified finishers would enable the associated brooder to continuously supply these finishers indefinitely given a constant production demand, a reasonably justifiable assumption given 3 years of historical production records and the 2-year production forecast (see Section 2.3).
With this derived set of brooder-finisher assignments, the expected annual travel distance may easily be calculated and compared against historical records. The value of the solution obtained by the model is 27,856.1 km. Note that this is the travel distance for trailers going to the finisher from the assigned brooder once. Thus, the expected value of the annual travel distance may be calculated by multiplying the solution value by the number of times per year each finisher could be expected to receive birds , and again by two to account for return trips. Executing this calculation yields the following:
Given that the brooder-finisher production supply chain arrangement is shared by most large turkey manufacturers, this model could be readily re-applied by another manufacturer, given considerations to some of the parameters that may not be shared in common between manufacturers (breed, growing time, farm capacity, etc.—further discussed in Section 4.2). Turkey manufacturers implementing the framework provided by this model could expect operational improvements including a reduction in GHG emissions/costs from transportation and improved animal wellbeing and biosecurity, as demonstrated in the two sub-sections below.
4.1.1 Reduction in GHG emissions and transport costs
Based on records provided by the Company, a total of 371,825 and 309,978 km were traveled (delivery and return trips) in their 2020 and 2021 fiscal years, respectively. This could be contrasted against the 169,458 km of expected travel distance determined by the optimal assignment model constructed by the MIP. A performance comparison between the optimal assignment model and previous years is demonstrated in Table 3.
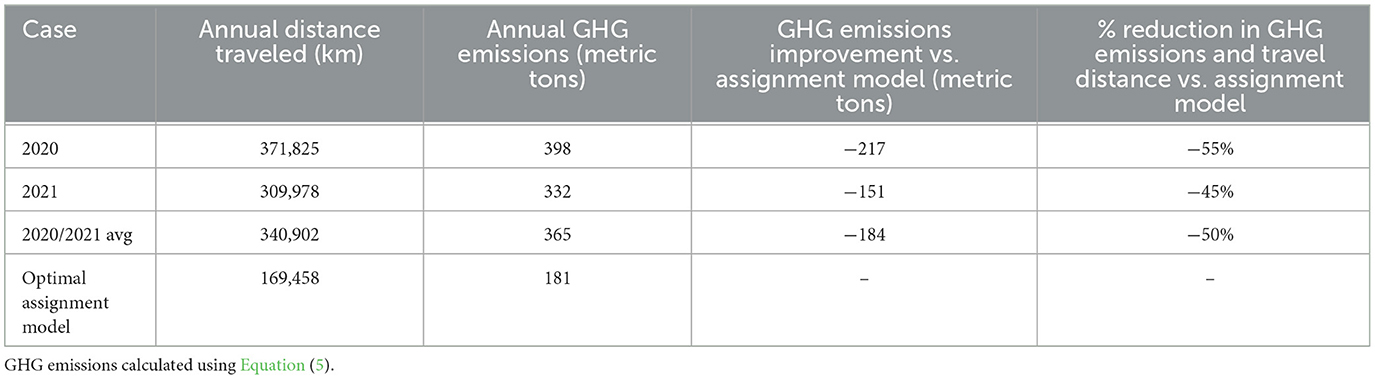
Table 3. Distance/GHG emissions performance under optimal assignment model compared to previous years.
There exist a variety of popular methods for calculating GHG emissions from freight transport. These include fuel-based, distance-based, and weight-distance based methods. Fuel-based approaches require knowledge of total fuel consumption, which is not a metric tracked by the Company, and thus not a viable approach for calculations in this study. Weight-distance methods are generally applied when using shared modes of transportation or when only a minimal amount of information (related to the exact vehicle used and route) is known about a shipment (Blanco and Sheffi, 2017). Thus, the most appropriate calculation for GHG emissions in this study would be the distance-based approach using the appropriate emissions factor (EF, as defined by the GHG Protocol) of for diesel-powered articulated heavy goods vehicles (IPCC, 2017). Thus, calculating GHG emissions in this problem is executed as follows:
As shown by Table 3, implementation of the brooder-finisher assignments according to the model results would yield an ~50% reduction in travel distance and GHGs emitted. Other benefits which could be reasonably associated with adoption of the results of this model would include reduction in driver labor costs (fewer drivers required, less time driving), reduction in costs associated with vehicle repair and maintenance, and reduction in the comparatively high administrative production planning overhead affiliated with a “first available” system.
4.1.2 Improved wellbeing and biosecurity
As emphasized in Section 2.2.1, transportation of turkey poults from brooders to finishers represents a very stressful event for the livestock. Upon transport, poults are removed from their environmentally-regulated pens by laborers and loaded into trucks. During this process, the poults are subjected to the psychological and physical stresses of being handled by laborers as well as the stresses associated with exposure to the outside environment. As the transportation distance between brooders and finishers increases, the time poults spend exposed to these psychological and climactic conditions increases. Table 4 exhibits this association. As demonstrated by the historical data collected by the Company (columns 2–4 of Table 4), poult mortality rate is heavily associated with transport distance. Columns 5 and 6 of Table 4 demonstrate the expected number of trips taken in each distance category and the subsequent number of moralities due to transport (given similar trip mortality rates as previous years) over 1 year. The estimate of total mortalities after adoption of the brooder-finisher MIP model results indicates that an annual mortality reduction of almost 40% (~7,000 fewer mortalities per year) could likely be achieved. This reduction in mortalities would indicate an overall improvement in animal wellbeing because the poults would find themselves subjected to the stresses associated with transport for significantly less time.
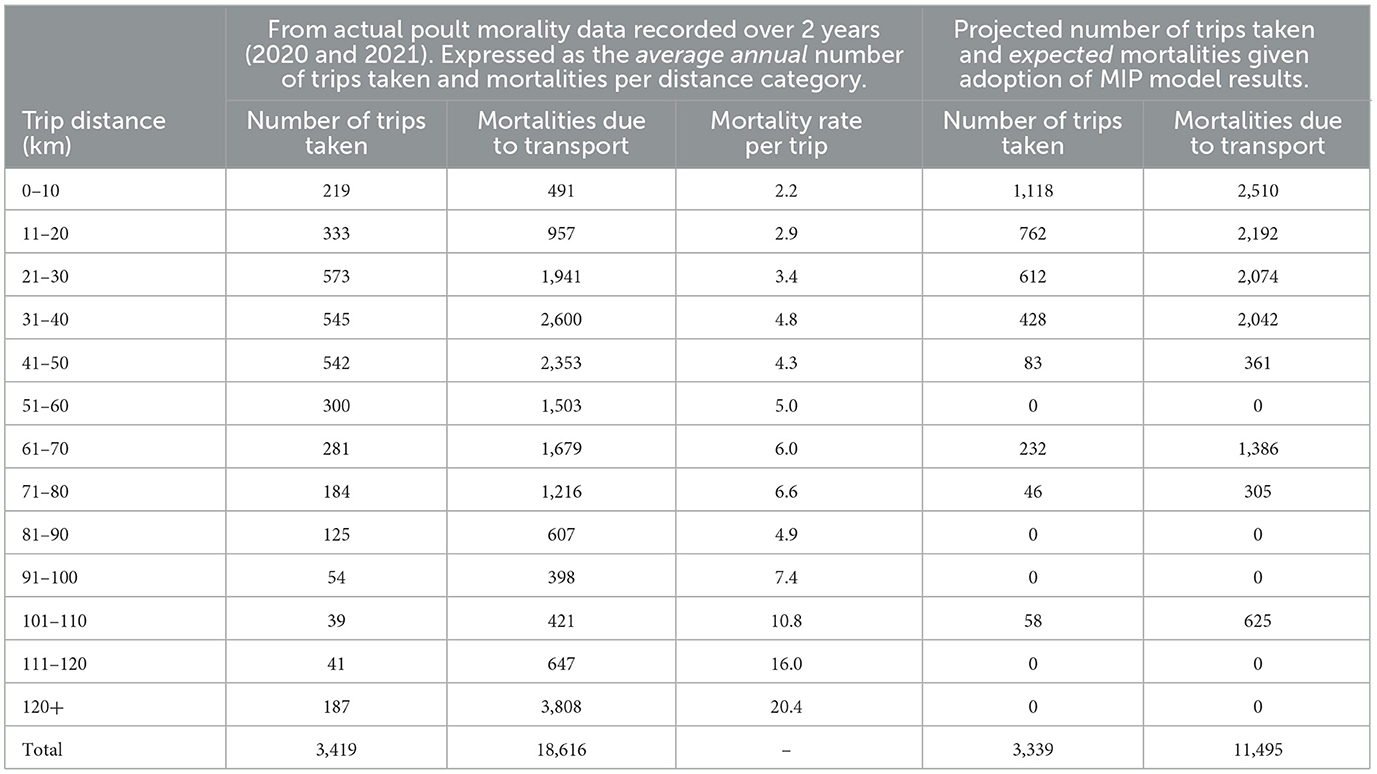
Table 4. Comparison of historical poult mortality rates during transport and expected mortality rates after adoption of MIP model results.
A significant additional benefit of the “A/B” assignment model formulated by the MIP over the “first available” system currently used at the Company could be attributed to reduced biosecurity risk. Figure 2 shows an modified depiction of the turkey supply chain given adoption of the MIP model assignments. A visual comparison of Figures 1, 2 indicates this potential biosecurity improvement. Under a “first available” system, poults are sent to a finisher which formerly received birds from a different brooder, whereas in the supply chain arrangement organized by the MIP each brooder-finisher group is segregated. Despite sanitization efforts between finisher flocks, variants of the HPAI virus possess a demonstrated ability to persist in a variety of media for over a month (Cardona et al., 2018). Thus, in the event of an infectious disease outbreak, a “first available” system leaves poults from an incoming flock at risk of contracting a disease that may have formerly been confined to only the flocks associated with a different brooder farm. Adoption of segregated brooder-finisher groups generated by the MIP model would thus represent a more effective way of confining disease outbreaks.
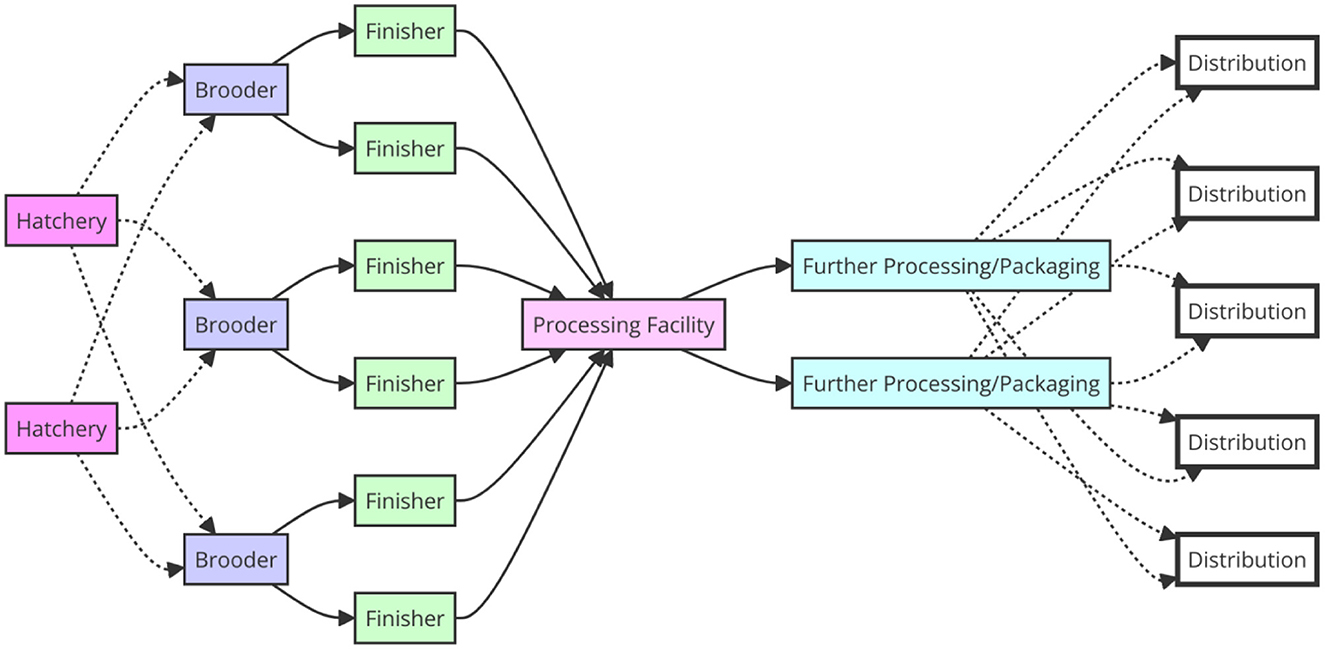
Figure 2. Modified depiction of turkey supply chain given adoption of MIP model results.
4.2 Study limitations
The primary limitations of this study could be categorized into three main groups. Firstly, assumptions related to brooder-finisher turnaround time and a variety of other related factors (bird breed/sex, farm capacity, network design, etc.) are derived from only one turkey manufacturer. The second broad category of limitations could be ascribed to the difficulty of implementation pre-existing turkey manufacturers may face when attempting to transition from a “first available” brooder-finisher turkey growing system to one resembling optimal brooder-finisher assignments formulated by a MIP. Finally, more accurate and comprehensive methods of measuring GHG emissions may yield improved results.
In addressing the first limitation described in the preceding paragraph, a turkey manufacturer must consider the breed and sex of the turkeys which they grow, the feed efficiency which they are able to realize, and the potential flexibility of the sanitization times and processing facility schedule. These factors all contribute to the overall turnaround time of a brooder or finisher, and the performance of this or any similar model would be sensitive to a modification in these parameters. Production delays at the processing facility or an underperforming finisher flock might require a delay in the processing of a given finisher flock or group of finisher flocks, which would in turn delay the arrival of a new finisher flock from the finisher's respective brooder and thus require a more condensed sanitization schedule for both finisher and brooder farms. Despite the near-inevitability of such delays in any manufacturing operation, the Company analyzed in this study demonstrated significant flexibility when faced with such challenges. For example, historical data reveal that the sanitization time for brooders and finishers could be condensed to as little as 1 week or extended to as much as 4 or 6 weeks, respectively; this could be contrasted against the greater-than 3-week and 2-week brooder/finisher sanitization time assumptions adopted in the foregoing model. The growing time of poults at a brooder had also historically been extended for up to an additional week. Furthermore, operating the processing facility for an additional shift (a common practice at the Company) would constitute another strategy for addressing a surplus of fully-grown finisher flocks. A stochastic MIP model was considered in an attempt to capture this variability, however, on account of the fixed hatchery → brooder → finisher → processing facility growing/production volume (see Section 2.3) and the operational flexibility just described, a stochastic model was determined to have little additional benefit. Sensitivity analyses examining the effects of turnaround time modification (again, generally a function of a combination of bird breed and sex, feed composition, feed efficiency, husbandry practices, and labor availability) or siting of additional farms may demonstrate improvements in the model, or require modifications to the model constraints and input variables. In summary, any change in the turnaround time or capacity assumptions described in Section 2.3 would necessitate a change in or additions to Equations (2, 3) of the foregoing model. However, the overall framework of the model could nonetheless see adoption by any turkey manufacturer, given that the manufacturer operates under the industry standard practice of having standalone brooder and finisher farms.
The second, and perhaps foremost, limitation could briefly be encapsulated as “difficulty of implementation for existing manufacturers.” The model formulated above generates the optimal brooder-finisher assignments, but does not detail how a manufacturer might transition from a “first available” or other system to this more sustainable system. When attempting to implement the results of this more sustainable production and transportation system, and existing manufacturer might: (1) cease growing and production for a period of several months before re-starting under the brooder-finisher assignments resulting from model execution or (2) engage in a carefully-planned slow transition (likely spanning at least 2–3 years) from the manufacturer's current practices to the arrangements identified by the MIP model output. Barring anomalous circumstances, the first option would likely present an untenable solution to most large manufacturers. Thus, in implementing the recommended solution from the model designed in this paper an existing manufacturer would likely need to select the second option, which represents the approach currently being taken by the Company in this study. Further research in this area, describing how a turkey manufacturer might quickly transition from their current state to a more sustainable state, would constitute an auspicious area of inquiry. Ideally, a manufacturer would consider the sustainability of a potential new turkey growing and processing operation prior to construction of the network; the review in Section 2.4 of this paper as well as reviews conducted by other authors indicate that manufacturers are increasingly considering sustainability in their network design (Joshi, 2022). In such a case, the prospective manufacturer would be able to more easily execute and implement a similar MIP model as the one described herein.
In this study, the distance-based method was utilized in calculating GHG emissions. This represents an inferior approach to the fuel-based method (not used due to a lack of data), but a superior approach to the weight-distance based method (in this case). Factors related to congestion and landscape were considered as negligible to the overall GHG emissions. Given the geographical setting of the Company, this was an appropriate assumption, however, this assumption may not be valid in a re-application of this approach. Additionally, factors such as vehicle idling time, vehicle speed, and road characteristics were not considered. Consequently, the GHG emissions reduction calculations presented in this paper likely present an underestimate of the actual reductions realizable upon implementation. With additional data related to road characteristics, vehicle characteristics, and idling time, the objective function might be reformulated as a PRP (with factors affecting GHG emissions in the objective function) rather than a VRP. PRPs constitute a new and developing area of academic inquiry, and reformulation of the objective function to account for the assortment of variables affecting GHG emissions in freight transport presents a promising direction for future research (Marrekchi et al., 2019).
5 Conclusion
In this paper, we develop a MIP model aimed at reducing the travel distance and subsequent GHG emissions in a network of turkey brooders and finishers. This model is then applied to a network owned by one of the largest turkey manufacturers in the US. Implementation of the ensuing model results could be expected to reduce GHG emissions in the network by ~50% (a 184 metric ton CO2-e reduction) while also favorably addressing the other preeminent challenges currently facing the turkey sector (cost of production, biosecurity, and animal wellbeing). The foremost limitation of this model may be identified as the difficulty an existing manufacturer might face when implementing the model results. However, it must be pointed out that trends in the global turkey market indicate the sustained increase in new production units in developing countries. As such, this timely publication may enable these new and expanding turkey operations an avenue by which to decrease the environmental impact of their products. This opportunity is underscored by the model's simplicity and subsequent ease of execution when supplied with a new data set. Furthermore, this study provides a broader contribution to the existing literature by describing and analyzing the supply chain of turkey products, a commodity whose supply chain had previously only been sparsely described in the popular press and industry manuals.
Data availability statement
The datasets presented in this study can be found in online repositories. The names of the repository/repositories and accession number(s) can be found in the article/supplementary material.
Author contributions
GW: Conceptualization, Data curation, Formal analysis, Investigation, Methodology, Project administration, Validation, Visualization, Writing – original draft, Writing – review & editing. BH: Formal analysis, Methodology, Software, Visualization, Writing – review & editing. RS: Resources, Supervision, Writing – review & editing.
Funding
The author(s) declare that no financial support was received for the research, authorship, and/or publication of this article.
Conflict of interest
The authors declare that the research was conducted in the absence of any commercial or financial relationships that could be construed as a potential conflict of interest.
Publisher's note
All claims expressed in this article are solely those of the authors and do not necessarily represent those of their affiliated organizations, or those of the publisher, the editors and the reviewers. Any product that may be evaluated in this article, or claim that may be made by its manufacturer, is not guaranteed or endorsed by the publisher.
Footnotes
1. ^See Section 2.3 for a detailed description of the turkey production process, including definitions of the terms “brooder” and “finisher.”
2. ^Feed efficiency is a measure of how much saleable product is produced per unit of feed consumed.
3. ^See Section 2.4 for a more thorough treatment of this topic.
4. ^Statements related to timing are specific to the data provided by the Company. However, the time required to raise a turkey would generally depend on the sex, the breed, the feed efficiency, and the health of each flock.
References
Ahmad, A., Ikram, A., Rehan, M. F., and Ahmad, A. (2022). Going green: impact of green supply chain management practices on sustainability performance. Front. Psychol. 13:973676. doi: 10.3389/fpsyg.2022.973676
Aldous, E., Seekings, J., McNally, A., Nili, H., Fuller, C. M., Irvine, R. M., et al. (2010). Infection dynamics of highly pathogenic avian influenza and virulent avian paramyxovirus type 1 viruses in chickens, turkeys and ducks. Avian Pathol. 39, 265–273. doi: 10.1080/03079457.2010.492825
Alqaisi, O., Ndambi, O. A., and Williams, R. B. (2017). Time series livestock diet optimization: cost-effective broiler feed substitution using the commodity price spread approach. Agricult. Food Econ. 5:9. doi: 10.1186/s40100-017-0094-9
Aronsson, H., and Huge-Brodin, M. (2006). The environmental impact of changing logistics structures. Int. J. Logist. Manag. 17, 394–415. doi: 10.1108/09574090610717545
Askerov, P. F., Rabadanovich, A., Kibirov, K. G., Tolparov, E. B., Bondarenko, O. V., and Khairbekov, A. U. (2021). Role and importance of turkey meat production in poultry farming in Russia: prospects for further development. Entomol. Appl. Sci. Lett. 8. 15–20. doi: 10.51847/IE9jQz8ugz
Barthelmie, R. J. (2022). Impact of dietary meat and animal products on GHG footprints: the UK and the US. Climate 10:43. doi: 10.3390/cli10030043
Bektaş, T., and Laporte, G. (2011). The pollution-routing problem. Transport. Res. B 45, 1232–1250. doi: 10.1016/j.trb.2011.02.004
Bir, C., Davis, M., Widmar, N., Zuelly, S., and Erasmus, M. (2019). Perceptions of animal welfare with a special focus on turkeys. Front. Vet. Sci. 6:413. doi: 10.3389/fvets.2019.00413
Blanco, E. E., and Sheffi, Y. (2017). “Green logistics,” in Sustainable Supply Chains: A Research-Based Textbook on Operations and Strategy (Berlin: Springer), 147–187.
Boudahri, F., Sari, Z., Maliki, F., and Bennekrouf, M. (2011). “Design and optimization of the supply chain of agri-foods: application distribution network of chicken meat,” in 2011 International Conference on Communications, Computing and Control Applications (CCCA).
Brant, A. W. (1998). A brief history of the turkey. World's Poult. Sci. J. 54, 365–373. doi: 10.1079/WPS19980027
Bratt, C., Sroufe, R., and Broman, G. (2021). Implementing strategic sustainable supply chain management. Sustainability 13:8132. doi: 10.3390/su13158132
Cândido, M. G. L., Xiong, Y., Gates, R. S., Tinôco, I. F. F., and Koelkebeck, K. W. (2018). Effects of carbon dioxide on turkey poult performance and behavior. Poult. Sci. 97, 2768–2774. doi: 10.3382/ps/pey128
Cardona, C., Alexander, C., Bergeron, J., Bonney, P., Culhane, M., Goldsmith, T., et al. (2018). An Assessment of the Risk Associated with the Movement of Turkeys to Market Into, Within, and Out of a Control Area during a Highly Pathogenic Avian Influenza Outbreak in the United States. University of Minnesota Digital Conservancy. Available online at: https://hdl.handle.net/11299/200961 (accessed March 24, 2024).
Chagwiza, G., Chivuraise, C., and Gadzirayi, C. T. (2016). A mixed integer programming poultry feed ration optimisation problem using the Bat Algorithm. Adv. Agricult. 2016, 1–6. doi: 10.1155/2016/2313695
Clune, S., Crossin, E., and Verghese, K. (2017). Systematic review of greenhouse gas emissions for different fresh food categories. J. Clean. Prod. 140, 766–783. doi: 10.1016/j.jclepro.2016.04.082
Code of Federal Regulations (2006). Title 9: Animals and Animal Products. Subchapter B: Cooperative Control and Eradication of Livestock or Poultry Diseases.
Coleman, G. J., Hemsworth, P. H., Hemsworth, L. M., Munoz, C. A., and Rice, M. (2022). Differences in public and producer attitudes toward animal welfare in the red meat industries. Front. Psychol. 13:875221. doi: 10.3389/fpsyg.2022.875221
Costantini, M., Ferrante, V., Guarino, M., and Bacenetti, J. (2021). Environmental sustainability assessment of poultry productions through life cycle approaches: a critical review. Trends Food Sci. Technol. 110, 201–212. doi: 10.1016/j.tifs.2021.01.086
Dantzig, G. B., and Ramser, J. H. (1959). The truck dispatching problem. Manag. Sci. 6, 80–91. doi: 10.1287/mnsc.6.1.80
de Vries, M., and de Boer, I. J. M. (2010). Comparing environmental impacts for livestock products: a review of life cycle assessments. Livestock Sci. 128–3, 1–11. doi: 10.1016/j.livsci.2009.11.007
Deng, B., Chen, T., Pu, Z., Peng, X., Qin, X., Zhan, X., et al. (2022). A transportation network optimization model for livestock manure under different terrains considering economic and environmental benefits. Sustainability 14:137721. doi: 10.3390/su14137721
Erasmus, M. A. (2017). A review of the effects of stocking density on turkey behavior, welfare, and productivity. Poult. Sci. 96, 2540–2545. doi: 10.3382/ps/pex075
Erasmus, M. A. (2018). “Chapter 13: welfare issues in turkey production,” in Advances in Poultry Welfare (Cambridge, MA: Woodhead Publishing), 265–282.
European Food Safety Authority (2021). Annual Report on Surveillance for Avian Influenza in Poultry and Wild Birds in Member States of the European Union in 2020, 19.
Famous, M., Islam, O., Khatun, S., Rahman, M. M., and Ferdoushi, T. (2019). Feeding and management system of turkey in the Sylhet region, Bangladesh. Vet. Sci. 5:65. doi: 10.17582/journal.vsrr/2019/5.2.58.65
FAO (2024). Food and Agriculture Organization of the United Nations Statistics Division Database. Available online at: www.fao.org (accessed March 16, 2024).
Fiala, N. (2008). Meeting the demand: an estimation of potential future greenhouse gas emissions from meat production. Ecol. Econ. 67, 412–419. doi: 10.1016/j.ecolecon.2007.12.021
Fleming, P. A., Wickham, S. L., Barnes, A. L., Miller, D. W., and Collins, T. (2020). Varying opinions about animal welfare in the Australian live export industry: a survey. Animals 10:101864. doi: 10.3390/ani10101864
Frame, D. (2010). Biosecurity Principles: Protecting the Utah Turkey Industry. Utah State University Cooperative Extension. Available online at: https://digitalcommons.usu.edu/cgi/viewcontent.cgi?article=1314&context=extension_curall (accessed March 24, 2024).
Frewer, L. J., Kole, A., Kroon, S. M., and de Lauwere, C. (2005). Consumer attitudes towards the development of animal-friendly husbandry systems. J. Agricult. Environ. Ethics 18, 345–367. doi: 10.1007/s10806-005-1489-2
Frisk, M., Jonsson, A., Sellman, S., Flisberg, P., Ronnqvist, M., and Wennergren, U. (2018). Route optimization as an instrument to improve animal welfare and economics in pre-slaughter logistics. PLoS ONE 13, 1–21. doi: 10.1371/journal.pone.0193223
Garnett, T. (2003). Wise Moves: Exploring the Relationship Between Food, Transport and CO2. Transport 2000 Trust, London. Available online at: https://urbanfutures.co.uk/Wise%20Moves%20-%20Linking%20Food%20and%20Fuel.pdf (accessed March 23, 2024).
Gebresenbet, G., Bosona, T., Ljungberg, D., and Aradom, S. (2011). Optimisation analysis of large and small-scale abattoirs in relation to animal transport and meat distribution. Austr. J. Agricult. Eng. 2, 31–39. doi: 10.3316/informit.267341167036540
Hallström, E., Carlsson-Kanyama, A., and Börjesson, P. (2015). Environmental impact of dietary change: a systematic review. J. Clean. Prod. 91, 1–11. doi: 10.1016/j.jclepro.2014.12.008
Henrikson, Z. A., Vermette, C. J., Schwean-Lardner, K., and Crowe, T. G. (2018). Effects of cold exposure on physiology, meat quality, and behavior of turkey hens and toms crated at transport density. Poult. Sci. 97, 347–357. doi: 10.3382/ps/pex227
Herendy, V., Süto, Z., and Horn, P. (2003). Characteristics of improvement in the turkey production in the last 30 years. Agriculturae Consepectus Scientificus 68, 127–130.
Hristakieva, P. (2021). Current state of turkey meat production in the world and in Bulgaria—a review. Zhivotnovadni Nauki 58, 42–49. doi: 10.5555/20210255680
IBIS (2024). Chicken and Turkey Meat Production in the US - Market Size, Industry Analysis, Trends and Forecasts (2024-2029). Available online at: https://www.ibisworld.com/united-states/market-research-reports/chicken-turkey-meat-production-industry/ (accessed March 16, 2024).
IndexBox (2024). Global Turkey Meat Production—Period 2007-−2015. Available online at: www.indexbox.io (accessed March 16, 2024).
IPCC (2017). IPCC Emissions Factor Database. Available online at: https://www.ipcc-nggip.iges.or.jp/EFDB/main.php (accessed April 1, 2024).
Islam, A., Monjurul, I., Dutta, P., Rahman, A., Al Mamun, A., Khan, A. K. M. D., et al. (2024). Association of biosecurity and hygiene practices with avian influenza A/H5 and A/H9 virus infections in turkey farms. Front. Vet. Sci. 11:1319618. doi: 10.3389/fvets.2024.1319618
Islam, M. K., Uddin, M. F., and Alam, M. M. (2016). Supply chain optimization by mixed integer program for manufacturer and retailer system of poultry firm in Bangladesh. GANIT: J. Bangladesh Math. Soc. 34, 75–87. doi: 10.3329/ganit.v34i0.28556
Joshi, S. (2022). A review on sustainable supply chain network design: dimensions, paradigms, concepts, framework and future directions. Sustain. Operat. Comput. 3, 136–148. doi: 10.1016/j.susoc.2022.01.001
Kalaitzandonakes, N., Marks, L. A., and Vickner, S. S. (2004). Media coverage of biotech foods and influence on consumer choice. Am. J. Agricult. Econ. 86, 1238–1246. doi: 10.1111/j.0002-9092.2004.00671.x
Kálmán, Á., and Szollosi, L. (2023). Global tendencies in turkey meat production, trade and consumption. Acta Agraria Debreceniensis 2, 83–89. doi: 10.34101/actaagrar/2/12594
Khatko, Z. N., and Shirokova, A. S. (2022). Prospects for the production of culinary products from turkey meat (a review). N. Technol. 18, 93–105. doi: 10.47370/2072-0920-2022-18-1-93-105
Kheiralipour, K., Payandeh, Z., and Khoshnevisan, B. (2017). Evaluation of environmental impacts in turkey production system in Iran. Iran. J. Appl. Anim. Sci. 7, 507–512. doi: 10.5555/20173328273
Laporte, G. (2009). Fifty years of vehicle routing. Transport. Sci. 43, 408–416. doi: 10.1287/trsc.1090.0301
Leinonen, I., Williams, A. G., and Kyriazakis, I. (2016). Comparing the environmental impacts of UK turkey production systems using analytical error propagation in uncertainty analysis. J. Clean. Prod. 112, 141–148. doi: 10.1016/j.jclepro.2015.06.024
Ma, Q., Paudel, K. P., and Cui, L. (2018). A multi-objective optimization problem for using poultry litter in electricity production. Appl. Energy 228, 1220–1242. doi: 10.1016/j.apenergy.2018.06.109
Ma, R., and Kim, R. J. (2023). Tracing the evolution of green logistics: a latent dirichlet allocation based topic modeling technology and roadmapping. PLoS ONE 18:290074. doi: 10.1371/journal.pone.0290074
Machado, V. S., and Michael, A. B. (2022). Overview of common practices in calf raising facilities. Transl. Anim. Sci. 6:txab234. doi: 10.1093/tas/txab234
MacKimmie, M. (2023). Turkey Farmers of Canada Completes Lifecycle Assessment of the Turkey Sector. Turkey Farmers of Canada. Available online at: https://www.turkeyfarmersofcanada.ca/media-room/news-releases/turkey-farmers-breeders-the-feed-industry-and-processing-sector-across-canada-came-together-to-participate-in-a-lifecycle-assessment-lca-of-the-turkey-industry-the-study-was-conducted-by-groupe-ageco-this-is-an-important/ (accessed March 30, 2024).
Marchewka, J., Watanabe, T. T. N., Ferrante, V., and Estevez, I. (2013). Review of the social and environmental factors affecting the behavior and welfare of turkeys (Meleagris gallopavo). Poult. Sci. 92, 1467–1473. doi: 10.3382/ps.2012-02943
Marrekchi, E., Besbes, W., and Dhouib, D. M. (2019). An overview of the recent solution approaches in the green vehicle routing problem. Solv. Transp. Probl. 2019:ch5. doi: 10.1002/9781119686750.ch5
Matthews, H. S., and Henrickson, C. T. (2003). The economic and environmental implications of centralized stock keeping. J. Industr. Ecol. 6, 71–81. doi: 10.1162/108819802763471799
Mckinnon, A. (2015). “Environmental sustainability: a new priority for logistics managers,” in Green Logistics: Improving the Environmental Sustainability of Logistics, 3–30. Available online at: https://www.alanmckinnon.co.uk/uploaded/PDFs/Papers/Green%20Logistics%20(3rd%20ed%202015)%20-%20chap%201%20(McKinnon).pdf (accessed March 30, 2024).
Miranda-de la Lama, G. C., Villarroel, M., and Maria, G. A. (2014). Livestock transport from the perspective of the pre-slaughter logistic chain: a review. Meat Sci. 98, 9–20. doi: 10.1016/j.meatsci.2014.04.005
Morel-Journel, T., Vergu, E., Mercier, J. B., Bareille, N., and Ezanno, P. (2021). Selecting sorting centres to avoid long distance transport of weaned beef calves. Sci. Rep. 11:14. doi: 10.1038/s41598-020-79844-4
Murphy, P. R., Poist, R. F., and Braunschweig, C. D. (1995). Role and relevance of logistics to corporate environmentalism. Int. J. Phys. Distribut. Logist. Manag. 25, 5–19. doi: 10.1108/09600039510083916
Peres, T. M., and Ledford, K. L. (2016). Archaeological correlates of population management of the eastern wild turkey (Meleagris Gallopavo Silvestris) with a case study from the American South. J. Archaeol. Sci. 10, 547–556. doi: 10.1016/j.jasrep.2016.11.014
PwC and APIC (2014). Sustainable Supply Chains: Making Value the Priority. Available online at: https://www.apics.org/docs/default-source/scc-non-research/final_pwc-whitepaper_web.pdf?sfvrsn=80055edf_4 (accessed March 31, 2024).
Rao, P., and Holt, D. (2005). Do green supply chains lead to competitiveness and economic performance? Int. J. Operat. Prod. Manag. 25, 898–916. doi: 10.1108/01443570510613956
Roiter, L. M., Vedenkina, I. V., and Eremeeva, N. A. (2021). Analysis of the market potential of poultry meat and its forecast. IOP Conf. Ser. 937:22104. doi: 10.1088/1755-1315/937/2/022104
Russell, P. H., Awang, I. P. R., Parsons, G., and Alexander, D. J. (1989). Pathogenicity of PMV-3/Turkey/England/Midland poultry holdings/1981 for chickens and Turkeys. Avian Pathol. 18, 125–134. doi: 10.1080/03079458908418585
Sherwin, C., Lewis, P., and Perry, G. (1999). The effects of environmental enrichment and intermittent lighting on the behaviour and welfare of male domestic turkeys. Appl. Anim. Behav. Sci. 62, 319–333. doi: 10.1016/S0168-1591(98)00215-9
Tonsor, G., Widmar, N., and Wolf, C. (2009). “Media coverage of animal handling and welfare: influence on meat demand,” in Agricultural and Applied Economics Association, 2009 Annual Meeting. Milwaukee, WI. Available online at: https://ageconsearch.umn.edu/record/49338/files/AAEA_2009_TonsorOlynkWolf__7.15.09_.pdf (accessed March 24, 2024).
United Nations (2024). Food and Climate Change: Healthy Diets for a Healthier Planet. United Nations. Available online at: https://www.un.org/en/climatechange/science/climate-issues/food (accessed March 23, 2024).
USDA (2013). Poultry Industry Manual. Available online at: https://www.aphis.usda.gov/animal_health/emergency_management/downloads/documents_manuals/poultry_ind_manual.pdf (accessed March 24, 2024).
USDA (2024a). Poultry Slaughter. Available online at: https://downloads.usda.library.cornell.edu/usda-esmis/files/3197xm04j/zk51x4831/6q1848316/psla0324.pdf (accessed March 24, 2024).
USDA (2024b). US Department of Agriculture World Agricultural Supply and Demand Estimates. Available online at: https://www.usda.gov/oce/commodity/wasde/wasde0324.pdf (accessed March 24, 2024).
van Staaveren, N., Leishman, E. M., Adams, S. M., Wood, B. J., Harlander-Matauschek, A., and Baes, C. F. (2020). Housing and management of turkey flocks in Canada. Animals 10:1159. doi: 10.3390/ani10071159
Verbeke, W., and Viaene, J. (2000). Ethical challenges for livestock production: meeting consumer concerns about meat safety and animal welfare. J. Agricult. Environ. Ethics 12, 141–151. doi: 10.1023/A:1009538613588
Vermeulen, S. J., Campbell, B. M., and Ingram, J. S. I. (2012). Climate change and food systems. Ann. Rev. Environ. Resour. 37, 195–222. doi: 10.1146/annurev-environ-020411-130608
Vorotnikov, V. (2024). Russia Embarks on a New Veterinary System to Fight Bird Flu. Poultry World. Available online at: https://www.poultryworld.net/health-nutrition/health/russia-embarks-on-a-new-veterinary-system-to-fight-bird-flu/ (accessed March 23, 2024).
Wang, Z., and Sarkis, J. (2013). Investigating the relationship of sustainable supply chain management with corporate financial performance. Int. J. Product. Perform. Manag. 62, 871–888. doi: 10.1108/IJPPM-03-2013-0033
Wein, Y., Geva, Z., Bar-Shira, E., and Friedman, A. (2017). Transport-related stress and its resolution in turkey pullets: activation of a pro-inflammatory response in peripheral blood leukocytes. Poult. Sci. 96, 2601–2613. doi: 10.3382/ps/pex076
Whitelegg, J. (1994). Freight Transport, Logistics and Sustainable Development, World Wide Fund for Nature. London. Available online at: https://citeseerx.ist.psu.edu/document?repid=rep1&type=pdf&doi=235454dbb1888d9b37924990712d89fcefeb3799 (accessed March 30, 2024).
WOAH (2024). Avian Influenza. Available online at: https://www.woah.org/en/disease/avian-influenza/ (accessed March 23, 2024).
Yue, Q., Xu, X., Hillier, J., Cheng, K., and Pan, G. (2017). Mitigating greenhouse gas emissions in agriculture: from farm production to food consumption. J. Clean. Prod. 149, 1011–1019. doi: 10.1016/j.jclepro.2017.02.172
Keywords: optimization, mixed-integer programming, green logistics, agriculture, poultry, turkey
Citation: Wilson G, Horsey B and Stone R (2024) Implementing concepts from green logistics in the turkey production supply chain. Front. Sustain. 5:1416964. doi: 10.3389/frsus.2024.1416964
Received: 13 April 2024; Accepted: 21 June 2024;
Published: 10 July 2024.
Edited by:
Slawomir Wycislak, Jagiellonian University, PolandReviewed by:
Enrica Vesce, University of Turin, ItalyBikash Koli Dey, Hongik University, Republic of Korea
Copyright © 2024 Wilson, Horsey and Stone. This is an open-access article distributed under the terms of the Creative Commons Attribution License (CC BY). The use, distribution or reproduction in other forums is permitted, provided the original author(s) and the copyright owner(s) are credited and that the original publication in this journal is cited, in accordance with accepted academic practice. No use, distribution or reproduction is permitted which does not comply with these terms.
*Correspondence: Griffin Wilson, Z213aWxzb25AaWFzdGF0ZS5lZHU=