 Alfonso Biondi1
 Enrico Sciubba
94% of researchers rate our articles as excellent or good
Learn more about the work of our research integrity team to safeguard the quality of each article we publish.
Find out more
ORIGINAL RESEARCH article
Front. Sustain. , 06 June 2024
Sec. Quantitative Sustainability Assessment
Volume 5 - 2024 | https://doi.org/10.3389/frsus.2024.1397416
Improving building efficiency is essential for reducing energy consumption, greenhouse gas emissions, and operational costs. In OECD Countries the average share of the Residential and Commercial Sector for space conditioning accounts for 30–37% of the cumulative final energy use. The current situation is somewhat typical of post-industrialized Countries: while the technology for reducing the external thermal losses and for installing more energy-conscious devices and procedures (including real-time monitoring and better design of the enclosures) is readily available, the cost of such measures is often perceived as excessive for the private user. For this reason, some governments have resolved to launch incentivization campaigns to encourage both private and public actors to invest in building efficiency. This strategy has been successful and its large-scale application -even if enacted on a preliminary basis- led to substantial reductions of the energy load per square meter −50 to 100 kWh/(m2yr)- so that subsidies and incentives are likely to assume a major role in shaping the energy conversion market. Technologies that are deemed “more environmental benign” or “of strategic interest” will receive institutional funding to promote their implementation, the funds being allocated both to design techniques, new materials and less energivorous devices. Since the funding is usually provided in the form of tax rebates, this approach is not devoid of problems: in fact, previous campaigns at regional and national level in the primary Energy Conversion and in the Transportation Sector have resulted in monumental failures. While it is clearly in the interest of a community to enact a reduction of their final energy uses, it is also true that such incentivization plans, if not properly and carefully implemented, may constitute an economic and ecological “doping” of the market (detail price increases, material and components shortages, etc.). This paper is a follow-up of a previous study conducted in 2021–22 that proposed a rational and thermodynamic-based approach to the issue: in that paper we presented an innovative cost/benefit procedure that considers the primary exergy savings of an “energy saving” intervention and the installation/operation costs and combines them with the statistically foreseeable savings in the improvement of the building seismic class. The method is intended to serve as a possible model for future policy decisions, and it makes use of the fundamental principles of Exergy Analysis augmented by a conventional cost/benefit analysis and by basic resilience considerations. The case study analyzed in the previous paper is re-examined here in the light of some recent normative developments the Eco-Sisma-Bonus (“Superbonus”), the incentivization plan launched between 2014 and 2020 by the Italian Government.
Improving building efficiency is essential for reducing final energy uses, greenhouse gas emissions, and operational costs. The combined share of the commercial and residential buildings in OECD Countries is around 30 to 37% (International Energy Agency, 2019; Reiff, n.d). Several strategies and incentives can be employed to incentivize individuals, businesses, and real estate developers to invest in building efficiency: a concise list is presented here below.
Governments may offer tax incentives to property owners and businesses that make energy-efficient improvements to their buildings. These tax credits can reduce the overall cost of upgrades. As an example, in 2020 Germany launched a tax incentivization plan for homeowners who implement energy efficient renovations. The plan consists in a possible tax deduction of 20% of the costs for renovations of up to EUR 40,000.1
Various local, state, and federal programs provide grants and rebates to help cover the upfront costs of energy-efficient projects.
Governments and financial institutions may offer low- or even zero interest loans specifically for energy efficiency projects [ref]. Greece awards an incentive equal to the interest paid on a loan used for the revamping of buildings built before 1989 [ref]. Romania has a similar zero-interest plan plus a State guarantee on the loan.
Many utilities offer financial incentives to customers who install energy-efficient equipment, such as HVAC systems, insulation, or lighting.
Utilities and Public Agencies may provide financial incentives to commercial and industrial customers who participate in demand response programs, which reduce final energy use during peak periods. Denmark subsidizes the installation of “intelligent electricity meters.”
Buildings that meet specific energy efficiency criteria improve their Energy Class label, which can enhance a property’s value and marketability.
The Leadership in Energy and Environmental Design (LEED) program provides certification for green and sustainable buildings, which can attract tenants and investors.
1. Regulatory Compliance: Local and national governments can require building owners to meet specific energy efficiency standards, which can serve as both an incentive and a regulatory requirement.
2. Energy Benchmarking: Most Governments require both commercial and residential buildings to publicly disclose their final energy use data (unfortunately referred to by the thermodynamic erroneous denomination of “energy consumption”), encouraging owners to invest in efficiency measures to maintain a positive image and competitiveness.
3. Performance Contracts: Some governments and organizations use performance-based contracts, such as Energy Savings Performance Contracts (ESPCs), where a contractor (usually an Energy Service company, ESCO) guarantee a certain level of energy savings, making it a low-risk investment for building owners: the ESCO is compensation from a Public Agency in proportion to the savings w.r.t the status quo ante [ref].
4. Public Recognition: Recognizing and promoting buildings and businesses that demonstrate leadership in energy efficiency can create a sense of competition and motivate others to follow suit.
5. Net-Zero Goals: Some regions set ambitious goals for achieving net-zero energy consumption in buildings, which can drive investments in energy-efficient technologies.
These incentives can be implemented at various levels, including initiative at local, regional, and Country level, utility programs, and voluntary actions by building owners and operators. The combination of financial benefits, recognition, and regulatory requirements can create a powerful incentive for improving building efficiency.
Since in the past similar incentivization plans at the national scale, markedly the “greening” of the Energy Conversion sector and the decarbonization of the Transportation Sector, have been plagued by substantial failures, the subsidies to the Residential Sector have been criticized by both politicians, industrialists and other interest groups. Aside from the objections raised by vested interest parties, the most common critique by economists is that an extended recourse to such incentivization plans may constitute an economic and ecological “doping” of the market and result in a negative long-range cost/benefit assessment. Furthermore, doubts have been expressed about the expected environmental benefits. This paper presents a rational approach to the issue: taking as a case in point the recent efficiency-improvement funding programs for the Residential Sector, we propose a cost/benefit procedure that combines the primary exergy savings, the installation/operation costs, and the statistically foreseeable savings in the improvement of the building seismic class.
It must be remarked that this paper follows the basic guidelines of a previous and more limited study [ref], and its goal is to demonstrate a method that may become a model for future policy decisions: it has the merit of combining the fundamental principles of Thermo-Economics with basic engineering- and resilience considerations. It must be stressed that the most important novelty of the paradigm we propose consists in its metric: the quantification of monetary expenses/benefits, of labor, environmental effects and of the effects of seismic risks is condensed into a thermodynamic quantity, called Extended Exergy Accounting, EEA (not discussed here, see [ref]), whose value (in kWH/yr. or similar) assesses the relative merit of different energy scenarios w.r.t. the cumulative primary resource consumption (Sciubba, 2021).
It would be in the common interest of the citizens (the “final users”!) that scholars and decision makers adopt a common method to assess the actual influence of monetary incentives on the degree of sustainability of different production chains and to provide a scientifically rigorous quantification of their effectiveness.
The incentivization plan that we shall analyze in this study includes partial or total refunds of the expenses incurred by owners in improving the final energy use efficiency and in improving the seismic resilience of their buildings: the two types of expenses are treated -and funded- separately, and there is no obligation for a user that has applied for the seismic incentive to apply for the energy one, and viceversa. For the correct application of the analysis performed here, it is irrelevant whether the incentives cover the entire certified expenses or a portion of them, whether the funds are available as tax rebates or cash contributions and whether they are aimed at the entire sector or only a portion of it (for example, buildings over a certain age).
We propose to separately evaluate the benefits deriving from an improvement of the building final energy use (lower heating and cooling loads, lower electricity consumption for lighting and auxiliaries) and those deriving from an improvement of the building resilience to possible seismic events. The calculation of the former is relatively straightforward and we shall follow the usual procedures; but to quantify the results of a seismic improvement we propose a novel procedure based on the monetization of a statistical risk and of the intensity of an event.
Another innovative aspect of our approach is the use of Thermodynamic quantifiers to measure both costs and benefit. This is possible by adopting the Thermo-Economic Analysis method (TE in the following).
TE is based on two fundamental principles (Wepfer, 1980; Tsatsaronis, 1984; Bejan et al., 1995; El Sayed, 2003):
a. As a result of the unavoidable irreversibility in any technological chain that leads from raw materials to final product, the materials mass flowrate continuously decreases along the production line. Similarly, since every production step requires a certain amount of energy input, some of this input is wasted into irreversible entropy generation;
b. A simple First Law analysis would not correctly assess the degree of irreversibility of the production line, because, for example, it would assign the same value to 1 kW of wasted thermal energy and to 1 kW of dissipated electrical energy, while it is clear that the latter has been generated using primary resources with an efficiency lower than that of generating the former. To this extent, it is possible to use as the common quantifier of material and energy flows a quantity called exergy [Sciubba and Wall, 2007];2
c. Once all the streams participating to a process have been quantified by their exergy content (kJ/kg or kJ/kJ), it is convenient to calculate the monetary budget of the process by considering each stream’s specific Thermo-Economic cost rather than their volume-, mass-, energy or monetary equivalent. This simple change of quantifier allows for a more rigorous allocation of the real costs of irreversibility.3
Let a generic product “P” be a manufactured item of known mass, volume, and composition or an immaterial commodity like electricity or thermal power: its production requires as fuels (“F”) some raw materials mi [kg/s] and some energy streams Ej [kW]. The production cost includes also Labor (ZL), Operation and Maintenance (ZO&M) and Environmental Remediation costs (ZO), all expressed here in €/yr. Let TIC be the Capital costs associated with the design, construction and start-up of the plant (Bejan et al., 1995). For a given economic scenario, the TIC is associated with a cash flow ZK = R*TIC, R being the capital discount rate at the interest rate for N years (the technical amortization period). Assuming we know the specific exergy costs of all “fuels,” in kJ/kg for the mi, in kJ/kJ for the Ej, the cost balance reads:
Where J is the total cost rate associated with the product P (we assume here for simplicity that there is a single product and no by-product). All terms in eqtn. (1) have dimensions [€/yr].
The exergy flows of the streams that participate to the process, ExF and ExP, are:
if Fi is a material stream.
if Fi is an immaterial stream: WFi is a power and ξ a conversion factor, like (kWh/s)/(kJ/yr) etc.
And the same goes for the product P.
The specific exergies exFi, exPi are expressed in [kJ/kg] or [kJ/kJ] for material and immaterial streams, respectively, and depend on the composition and physical state of the former and on the energy quality (i.e., form in which the energy is transferred) of the latter. Several databases exist for the specific exergy costs of a large variety of materials and energy types (Szargut et al., 1988). Eq. (1) is solved for cP. If there are more than one product or by-products and more than one fuel, specific allocation rules apply (Valero and Lozano, 1997).
We propose to use the TE balance in a “before-and-after” configuration of the same building. Now the ZK is the capital repayment rate originated by the revamping cost (which is now the equivalent of the TIC), and the operational costs ZL, ZO&M and ZO must be assessed for two different configurations: the building before renovation and after it. If the suffix sq (status quo ante) indicates the building state before the intervention, the difference between the “product” cost before and after the efficiency improvement can be conveniently expressed as (Biondi et al., 2022):
Assuming that there are only minor differences due to the amortization of the TIC and to the social costs of Labor:
Where TICrev is the cost of the revamping. The intervention has a positive economic effect (a “benefit”) if i.e., if:
The calculation of the left hand side of eqtn.(5) is straightforward, since it is based on the data related to the current system. On the right-hand side, the “fuel” costs can be calculated from the final energy balance after the intervention, the O&M costs from the new maintenance plan, and the environmental remediation costs depend in part on the reduced energy intensity of the building, and in part on the type and quantity of materials employed in the revamping. A significant advantage of the method is that it is no longer necessary to define what the “product” really is, and this disposes of the difficult task of defining an “exergy of the comfort zone” and other possibly biased/subjective indicators.
According to IEA (International Energy Agency, 2019), about 30% of the 2019 final energy use in OECD Countries was allocated to the residential sector: 64% of this amount was used for space heating, 15% for water heating, 14% for lighting and appliances, 6% for cooking and 0.4% for space cooling. The main energy carriers were natural gas (32.1%), electricity (24.7%) and renewables (19.5%). Globally, 75% of the EU natural gas consumption was used for space heating (International Energy Agency, IEA, 2023). In Italy, the space heating load was a little higher (66.3%), as was the share of natural gas for households (about 52%). In 2022, the total gas imports to Italy amounted to 66 109 m3 (vs the 72 109 in 2019), of which 14.2% from the Russian Federation,4 a noticeable reduction w.r.t. the 47% of 2019: the difference was compensated by an increase in imports from Algeria, Azerbaijan and Qatar.
Since natural gas is by far -with few exceptions- the most used fuel for space heating and electricity generation, these data underscore the need of a structural change in the final energy uses in the residential sector. In fact, energy efficiency is recommended by the International Energy Agency (IEA) as the main indicator in the planning of demand-side interventions for GHG reduction (International Energy Agency, 2021). The consequences of the recent Ukrainian invasion obviously worsened the problem, and it is becoming increasingly clear that more “fossil-free,” or more realistically more “energy efficient” buildings, are essential to reduce the dependence of EU (and especially Italy) on foreign natural gas. At present, two lines of action are being actively followed: (a) reducing the final energy demand and (b) expanding the recourse to renewable energy sources. The first option implies enacting a reduction of the heat dispersions from buildings, by replacing windows and doors, improving the thermal insulation of the outer surface, and installing more efficient heating devices. The second option is most easily attained locally, by installing solar panels (thermal and/or photovoltaic -or hybrid) on the building’s roofs. A serious limitation to the widespread applications of these good practices is their cost, perceived as excessive by the majority of homeowners, both private and public.
In an attempt to solve this efficiency/cost stalemate, the Italian government -following previous legislative initiatives dated 2007 and 2013- launched in 2020 an incentivization plan in the form of a specifically targeted tax credits (Legislative Decree No.34, 2020), the so-called “Superbonus 110%”: the plan foresees a 5-years annual income tax deduction that covers the 110% of the total amount of certified expenses incurred in the upgrading of the energy efficiency of a building. To access the subsidy it is necessary that the intervention includes the installation of a thermal envelope of the building or/and the replacement of the heating system. Other “secondary” measures are also covered, like the substitution of fixtures, installation of photovoltaics, solar screens, building domotics and others. To qualify for the Superbonus, the intervention must improve the energy performance of the building equivalent to at least two “final energy use classes” identified by the European Directive for the Energy Performance of Buildings: roughly, each class upgrade corresponds to an improvement of 20 to 40 kWh/(m2yr), so a successful intervention must guarantee 40 to 80 kWh/(m2yr) of final energy savings.
It is useful to adopt a line of reasoning proposed toward the end of the 19th century as “society’s metabolism” and later adapted to buildings (Fischer-Kowalski and Hüttler, 1998), namely that of “building metabolism.” The concept is illustrated in Figure 1 (Biondi et al., 2022): the building (including its internal space) is considered as a thermodynamic system interacting with an external environment via a system boundary, i.e., its external envelope, that allows for exchanges of material and energy streams. There are three sources of thermal input, the solar radiation (QS), the internal “heat” generated by the inhabitants (QM), and the thermal discharge of the appliances (QOE). Their combined contribution increases the internal energy of the building. The difference between the inside temperature (TINSIDE) and the external one (T0) controls the heat exchanges that takes place mainly via convection and radiation: a positive (TINSIDE-T0) drives a heat flux from the building to the environment and a negative one causes an additional heat flux into the structure. The thermal flux can be transmitted through the envelope (QT) or conveyed by ventilation, artificial or natural (Qv). The Air Conditioning System (ACS), that is the space heating and cooling plant, provides the necessary heating (QH) or cooling (QC) power, excluding thermodynamic losses, in order to maintain a constant temperature inside the household.
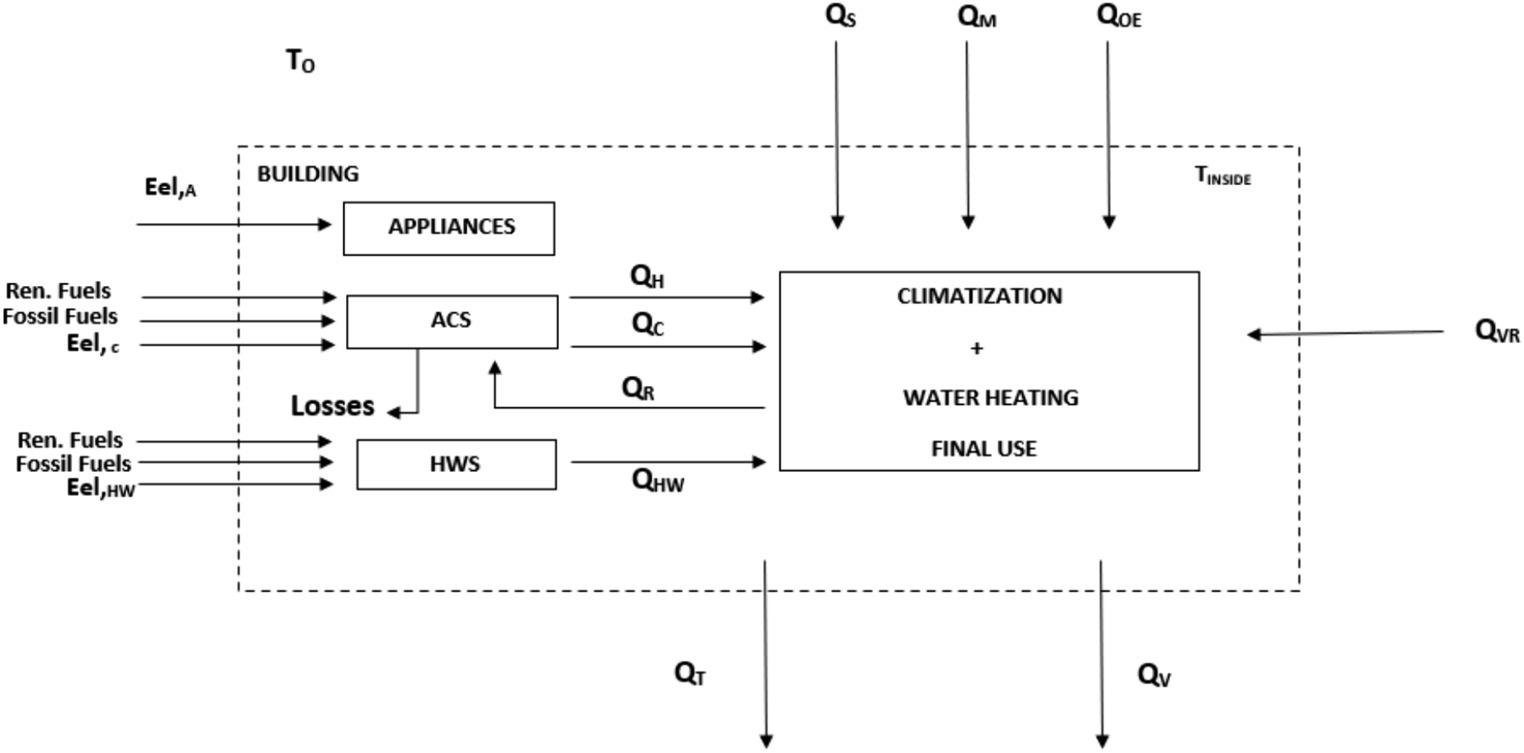
Figure 1. A schematic representation of the metabolism of a building (Biondi et al., 2022). HWS, water heating system; ACS, air conditioning system.
QH and QC (and electrical energy for auxiliaries etc.) must be supplied externally (except for buildings having an “internal” power generation system like a solar panel or an autonomous thermoelectric generator etc.). Common “heating systems” include hot air- or hot water systems: the former is powered by electricity and the latter by a fossil- or renewable fuelled boiler. Cooling is generally obtained by electrically driven devices. Several possibilities exist for introducing active or passive recovery systems whose net result is a decrease of the external energy load (electricity + thermal energy) of the “system building” on the society in which it is integrated.
The Energy Performance Certification of the building is based on a global energy performance indicator (EP) measured in kWh/(m2yr) or kWh/(m3yr). The indicator is calculated as (Italian UNI/TS Norm 11300-1, 2014):
Where EPW and EPS refer to winter and summer climatization respectively, EPHW to the water heating and EPILL to lighting. Each term of Eq. (6) is evaluated at prescribed intervals (most commonly, every month) and for each “Thermal Zone,” TZ, that identifies the climatic of the surroundings. While T0 (i.e., its monthly average) depends on TZ, TINSIDE is conventionally set by local regulations: in our calculations we assumed TINSIDE = 26°C in summer and 20°C in winter. The period of heating and cooling seasons depends on the geographical position of the building and is prescribed by specific regulations.
In brief, the classification consists of 7 performance classes in function of EP, with possible identification of subclasses. The most efficient building is labeled “class A,” and the least efficient “class G” (Tsatsaronis, 1984).
The rationale behind the subsidized interventions is clear: in order to increase the energetic class of the building (by at least two levels to be eligible for the incentive) it is necessary to reduce the use of fossil fuels by enforcing:
• A decrease in QH by improving the thermal insulation of the envelope, substituting windows and doors as needed and installing sunscreens;
• A decrease in QC by improving the air circulation inside of the envelope, substituting windows and doors as needed and installing sunscreens: since in general these measures -at least in southern Europe climates- are not sufficient, a more energy efficient space cooling unit must be installed to replace -for example- the usual electrical window-mounted air-conditioners;
• The installation of more efficient Boilers, Heaters and Coolers to obtain the same space conditioning performance with a lower final energy use;
• The implementation of mechanical ventilation systems, for the same goal as above;
• The installation of renewable energy devices (thermal or photovoltaics solar panels), combined with a revamping of the existing plants, to decrease the use of fossil fuels.
The energy analysis is best performed by means of one of the available dedicated software packages, which also usually calculate the energy share (in terms of kWh/yr. for each individual unit and by primary source). All packages require the same database, like the building geolocalization, layout and structure, the physical properties of the envelope, the type of fixtures and their orientation, technical specs of the energy supply system, etc.
As customary in such calculations, all energy-related outputs are provided in terms of “enthalpic” flows, i.e., in a First Law perspective. The conversion of these fluxes into their equivalent exergy values proposed in 2i is the following:
a. For immaterial streams (electricity and heat fluxes by convection, conduction and radiation) use is made of a specific exergy factor: one electrical kWh possesses an exergy of 1 kWh (i.e., the conversion factor is unity), one kWh of radiating energy has an exergy content of about 0.95 (Petela, 2010), etc.
b. For material streams, after identifying the chemical composition of each item, use is made of the Styrylska-Szargut exergy tables (Szargut and Styrilska, 1964).
c. The specific material and labor costs were adapted from data available on institutional websites.
The evaluation of the post-intervention costs is carried out along the same lines.
National and international hazard maps identify geographical areas classified as “high risk” and prescribe procedures for building vulnerability assessment that include an ante and post operam seismic analysis. The quantification of a seismic risk indicator depends in a complex fashion on the ascertained earthquake hazards and on the vulnerability index of individual buildings. Therefore, the cost/benefit analysis must be based on the enforcement of proper structural design standards coupled with a performance-based approach. Buildings seismic response is indicated by 8 performance classes: from a high seismic-performance -class A- to a seismic-sensitive building -class G-. Each class is identified by a Life Safety Index (IS-V) (Cosenza et al., 2018). The method we chose to adopt in this study is a sort of a monetary revisitation of a recent approach based on the structural responses to the specific Limit States (Cecchi and Calvi, 2011; Calvi et al., 2014) that identify the effects of a seismic occurrence of a certain strength on the building: these LS vary from a “Demolition LLS” to a “no-effect LS” and depend on the seismic resilience of the building. On this basis it is possible to quantify the “direct economic loss” affecting the building after a possible seismic damage (Figure 2). To this extent, the first task is to quantify the monetary costs of damage via an Expected Annual Loss index EAL (Ottonelli et al., 2017). In our approach, the EAL is linked to the Economic Loss (EL 0 to 100%) that expresses the expected damage during the estimated building life.
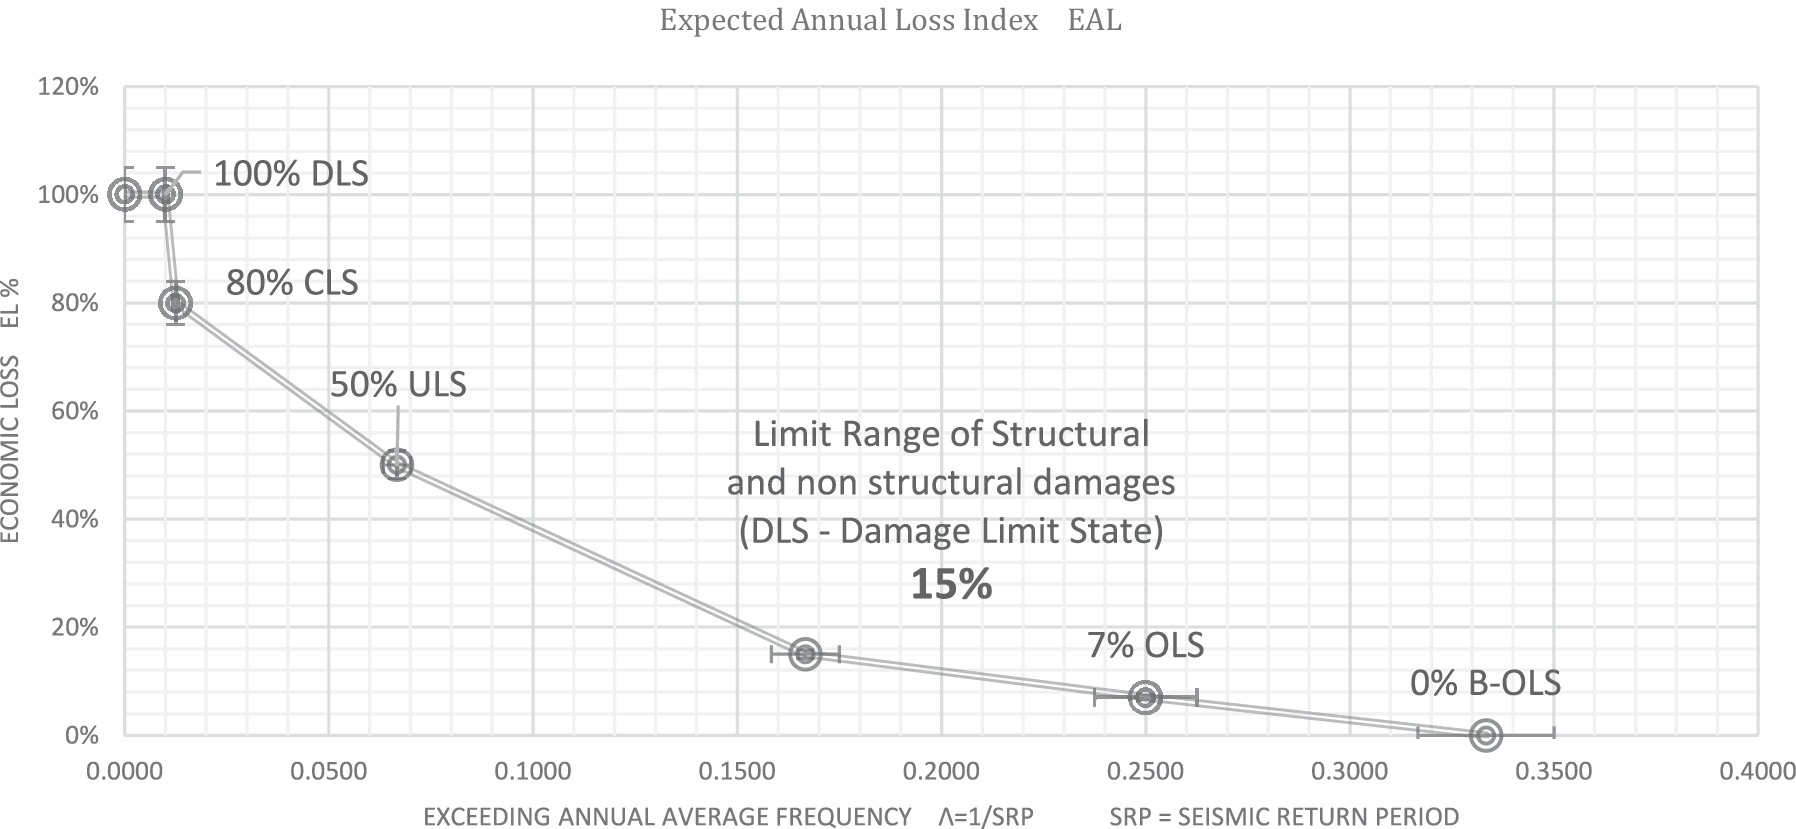
Figure 2. For the calculation of the cost of a seismic damage. 100%: DeLS, demolition limit state; 80%: CLS, collapse limit state; 50%: ULS, ultimate limit state (life hazard); 15%: DaLS, damage limit state (structural and non-structural damage); 7%: OLS, operative limit state; 0%: B-OLS, “As is” operative limit State.
Obviously, the more frequent the seismic events, the higher the EAL and the EL: therefore it is convenient to define an “Excess Annual Average Frequency” (λ) as the reciprocal of the Seismic Return Period (λ = 1/SRP), the latter being the -statistically determined- return period of an earthquake of a given strength that causes the economic loss associated with each Limit State. In practice, the EL is measured by the area below the segments connecting the points identified in the diagram (λ/EL): this area is proportional to the building restoration cost and quantifies the seismic classification adopted here.
In the present study, we posit that the structural and non-structural Damage Limit State (DLS) amounts to 15% of the Economic Loss of a complete reconstruction of the building (Dolce and Manfredi, 2015). For the evaluation of the benefits of such an intervention the same steps shown in section 3.1 are followed, so that it is necessary to compile a list of the materials used to enhance the seismic class of the building, using a “conversion table” that assigns to each material a proper embodied exergy.
The case study is a historical building in the city of Fiuggi, in central Italy. The structure dates to the first decades of the past century and was originally a hotel that after a substantial revamping was converted into an apartment building. It currently consists of 108 residential units, heated by a 275 kW central, NG-fuelled boiler. The envelope consists of stone walls with single glass fixtures with a wood frame. A detailed description is provided in Biondi et al. (2022).
The electrical consumption was calculated to amount to 2,415 kWh/year for each household, so that the yearly electrical energy consumption totals 260.820 kWh/year. The building is currently labeled “Class G” -that is, its overall thermal load is higher than 160 kWh/(m2 yr)- and the amount of natural gas used, calculated by a commercial computer software that operates on a digital building map, amounts to 122.048 m3/yr. (about 1.250.000 kWh/yr). The cost of the electrical kWh is cel = 0.15 €/kWh (Eurostat, 2021) and that of methane (in 2022) cCH4 = 0.05 €/m3 (Eurostat, n.d.). The exergy factor for electrical energy is 1, for methane is 1.04 (Szargut and Styrilska, 1964). The heating load is 923.596 kWh/yr.
Since the building is classified as one “of historical value,” it is not possible to operate on its external envelope or add external mechanical ventilation devices, so that the only possible energy efficiency improvement consists in the substitution of the methane-fuelled thermal plant with heat pumps. Additional feasible interventions are the substitution of windows and the installation of photovoltaic panels on the roof to drive the heat pumps: consider that this lowers the specific intervention costs (in €/m3), so that our example is conservative, because in “standard” residential buildings there would be an added cost brought about by the material and labor required by the installation of isolating panels on the external envelope. The revamping consists in the substitution of the central boiler with two new units rated 200 kW each, in the installation of 80 kWp of photovoltaics on the roof and in the substitution of the fixtures with triple glass windows with a PVC framework. The post-intervention simulation (run with the THERMOLOG package) provided the following results:
• An increase in the electrical energy demand (419.633 kWh/year) due to the added load required by the heat pumps;
• The complete elimination of natural gas heating;
• A reduction of 31% of the heating load, due to the substitution of fixtures;
• An extra self-generation of 106.381 kWh/yr. by the photovoltaic panels;
• An improvement in the building energetic class from G to E [more specifically, from 183.92 to 124.27 kWh (m2yr)];
• The net extra electrical consumption amounts to 313,300 kWh/yr. and has GHG impact of 167 tonCO2/yr.;
• The elimination of the gas heating leads to a reduction of 337 tonCO2/yr. in the equivalent GHG emissions. Therefore, the net environmental advantage, represented as GHG avoided emissions, amounts to 170 tonCO2/yr.
In the computation of the exergy costs, an identical procedure is applied to the status quo ante scenario (APE, ante operam) and to the improved one (PPE, post operam). For purchased equipment (boilers, heat exchangers, solar panels, etc.) unit costs are provided in the Contractor’s offer. The exergy embodied in each unit has been approximated considering its content of metals and non-metals: the details are discussed in Biondi et al. (2022). Since the unit cost of each item (in €/kg, €/unit or €/kg, depending on the item) is regulated by a specific ECOBONUS price list (Italian Ministry of Ecological Transition, 2022), the monetary cost of the revamping could be calculated as 495.273 €. The monetary savings were computed by first calculating, on a year-by-year basis, their equivalent monetary value from the above listed “energy savings,” and then actualizing the respective cash flows to year 2022, using an estimated constant prime rate of 1.25%, an extra rate due to inflation of 2%/yr. and cost escalation of 3%/yr., also assumed constant over the window of observation. The present value of the savings amounts to 690.241€, which results in a simple payback PB of 7.9 years and in a ROI of 39.4%.
For the site under study and the vulnerability class of the building, simulations indicate that every 10 years (SRP) there will be a seismic event that will cause a reconstruction cost (DLS) equal to about 15% of the present reconstruction value of the building. According to the outcome of an ante operam structural analysis (run with the ABAQUS software), seismic upgrading interventions were designed that include the application of reinforced mortar on wall surfaces and the installation of a FRCM (Fabric-Reinforced Cementitious Matrix) system and of glass-fiber strips inserted along the entire building perimeter (Table 1): the details are again provided in Biondi et al. (2022). FRCM materials are thin −1.2 cm- cementitious composites that consist of continuous fabrics of high-end synthetic fibers, such as glass embedded in an inorganic matrix. The results of the seismic resilience analysis from Ante and Post simulations are reported in Table 2. Under the statistically determined 24 years Seismic Return Period, the EAL index classification for the ante operam provides a G class and for the post operam a D-class (these are Seismic Classes and have nothing to do with the Energy Efficiency classes mentioned in Sections 3.1 and 4.1). The post operam reinforcements thus result in an improvement of the seismic building class by 3 levels.
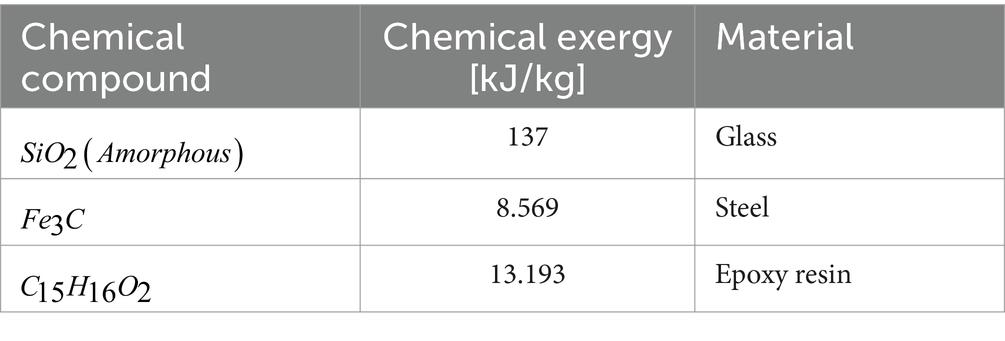
Table 1. Basic elements representing the materials involved in the energy intervention.
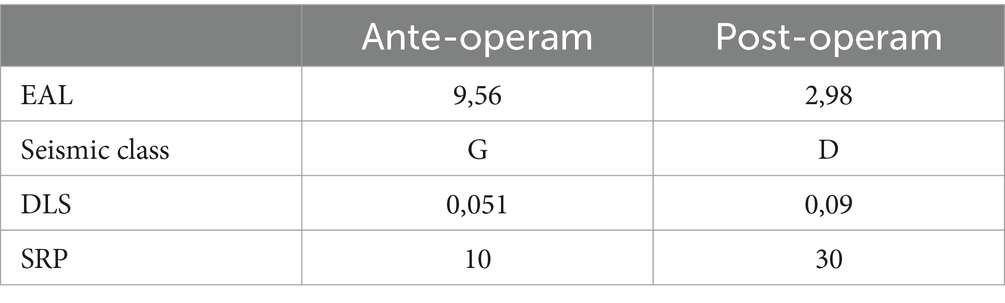
Table 2. Effects of seismic interventions: ante- vs. post-operam.
Considering a time-frame of 10 years and using the same economic data as in section 4.2, the total present cost of the seismic damage costs for the building as built is calculated to amount to 1.083.967 €, the cost of the seismic improvement being 458.000 €, and the present value of the savings 625.967 €. In conclusion, the seismic improvement alone leads to a payback of 4.3 years and to an ROI of 36.6%. The materials involved in the exergy assessment of the intervention are shown in Table 3.
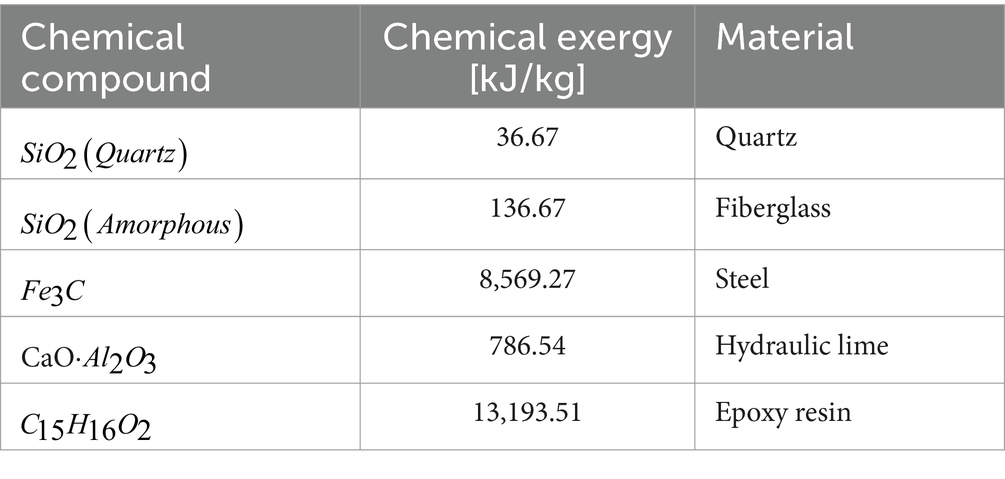
Table 3. Basic elements representing the materials involved in the Seismic intervention.
Combining the results obtained in the above two sections, a global cost/benefit assessment of the proposed intervention can be calculated:
a. total revamping costs = 495.272 € + 458.000€ =2.113.327 €
b. present value of the savings: 690.241 € + 625.967 € =1.119.139 €
c. Payback for the energy revamping: 7.9 yrs.
d. Payback for the seismic revamping: 4.3 yrs.
e. ROI of the energy revamping: 39.4%
f. ROI of the seismic revamping: 36.6%
Perhaps the most important result of the large-scale implementation of the above-described building revamping interventions lies in the global primary energy savings attainable by the energy efficiency improvement.
As of January 31, 2024, the ENEA (Italian DOE) reported a total of over 472,000 successfully completed or almost (75%) completed energy efficiency interventions with a gross cost for the Italian Treasury of 135 billion €5. The revamping includes of course a broad range of improvements, and cannot be directly related to the calculations reported in section 4.1: nevertheless, a preliminary comparison of the available data leads to an estimated total effect equivalent to that of about 150,000 buildings like the one represented in the above case study. This implies that an approximate cumulative 18 109 m3/yr. of natural gas will be saved yearly, corresponding to the 22% of the 2021 -and to 28% of the 2023 Italian total consumption. These are -in a more rigorous perspective- still to be considered “gross savings,” for the revamping makes use of resource flows that ought to be subtracted from this budget, like transportation, additional manufacturing etc.: while a more accurate calculation can be made only ex-post, i.e., after December 2024, such preliminary result is extremely encouraging and demonstrates the strategic advantage of the incentivization project. Furthermore, the seismic improvement guarantees additional future savings due to reconstruction costs avoidance (not considering the possible social implications). Since the subsidy is awarded ex-post, i.e., after the revamping has been completed, a portion of the investment returns to the Treasury in the form of income tax (currently estimated to average 35–40%) the gross 135 billion € expenditure reduces to about 88 billion of net outflow. Over 20 years, this sum correspond to a yearly rate of about 10 billion €/yr. A simple calculation -absolutely preliminary at this stage, especially considering the volatile situation of the energy market-, shows that the savings from the reduction of the gas bill amount to about 6 billion € [gas price July 2023 (Szargut, 2005; Statista, 2023)]; estimating in 1.7 billion €/yr. the savings due to the CO2 tax [CO2tax at 70€/(tonCO2 yr)], the net burden for the Treasury would be reduced to less than 3 to 2.3 billion €/yr. This seems to be an acceptable price to show compliance with the 17 goals of the UN 2023 agenda.
From our point of view though, the most important issue is the reduction of the global load posed on the environment: considering that each cubic meter of gas distributed to final users corresponds to about 1.05–1.08 cubic meters at extraction site (National Energy Technology Laboratory, NETL, Office of Fossil Energy, 2014), the net savings, on a lifetime perspective, induced by the 18 109 cubic meters saved corresponds to a reduction of 19 to 19.5 109 cubic meters at the well, i.e., to about 644 1012 kJ/yr. (i.e., about 180 billions of kWh/yr): the scale of the reduction of the environmental footprint is impressive.
It must be again stressed that the above calculations are perforce affected by a degree of inaccuracy due to the numerous assumptions they are based on: an exact calculation is not possible at the current state of affairs, and this task is left for future study. A more complete -and strategically useful- calculation can be performed considering the entire conversion chain of the Country, to identify the actual effects on the primary exergy consumption.
A cost/benefit assessment methodology for combined revamping interventions aimed at the improvement of the energy efficiency and of the seismic resilience of a building is proposed. The procedure is based on a Thermo-Economic calculation of the revamping costs and of the related savings. The use of Thermo-Economics and of the EAL method is new in the present context and supports our idea that more rational methods ought to be employed in the assessment of similar incentivization plans implemented at Country level. There are several sides to this issue: first, reducing the final energy use in the Residential Sector has a large positive impact on the “energy bill” of a Nation, and in fact actions in this direction are recommended by the 17 goals of the Agenda 2030. Second, aside from purely monetary considerations, any reduction in the primary fossil sources used to cover residential final energy demands leads to a reduction of the resource load it places on the Environment and thus contributes to an increase of the Country’s “degree of sustainability.” Finally, as in the case study, the substitution of fossil sources with renewable ones is performed at a local level, avoiding many of the problems linked to the direct connection of non-fossil electricity to the existing network. The direct consequence is that the GHG emissions are also drastically reduced: considering that -on the average- the Residential Sector contributes by about 30% to the primary fossil consumption, and that the reduction in CO2 emissions is almost linear with any reduction of this amount, the implications on climate control issues are also quite evident.
The original contributions presented in the study are included in the article/supplementary material, further inquiries can be directed to the corresponding author.
AB: Conceptualization, Funding acquisition, Methodology, Project administration, Supervision, Writing – review & editing. PC: Data curation, Investigation, Methodology, Software, Writing – original draft. CC: Methodology, Writing – original draft. ES: Conceptualization, Project administration, Writing – review & editing.
The author(s) declare that financial support was received for the research, authorship, and/or publication of this article. The authors declare that this study received funding from MPES srl in the form of a doctoral grant for one of the Authors (AB). The funder was not involved in the study design, collection, analysis, interpretation of data, the writing of this article or the decision to submit it for publication.
The authors declare that the research was conducted in the absence of any commercial or financial relationships that could be construed as a potential conflict of interest.
All claims expressed in this article are solely those of the authors and do not necessarily represent those of their affiliated organizations, or those of the publisher, the editors and the reviewers. Any product that may be evaluated in this article, or claim that may be made by its manufacturer, is not guaranteed or endorsed by the publisher.
1. ^https://www.smacna.org (Accessed April 2024).
2. ^https://www.iea.org/policies/11633-tax-deductions-for-building-renovations (Accessed April 2024).
3. ^TE leads also to the definition of an exergy cost, expressed by the ratio of the resources used to generate a certain stream and the exergy of that stream. This method is actually more rigorous that the TE “Exergo-monetary” cost, but it would be very difficult to apply it to the scenario represented in this paper.
4. ^https://www.ceicdata.com/en/indicator/italy/natural-gas-imports (Accessed October 2023).
5. ^https://www.edilportale.com/news/2024/03/mercati/superbonus-i-dati-enea-a-fine-gennaio (Accessed April 2023).
Bejan, A., Tsatsaronis, G., and Moran, M. J. (1995). Thermal Design & Optimization. NY: J.Wiley & Sons.
Biondi, A., Caponi, P.M., Cecere, C., and Sciubba, E. (2022). A preliminary analysis of the effects of public incentives on the primary resource use efficiency of the residential sector, the Proceedings of ECOS 2022, Copenhagen, 3–7 July.
Calvi, M., Sullivan, T. Y., and Welch, D. P. (2014). A seismic performance classification framework to provide increased seismic resilience. Persp. Eur. Earthquake Eng. Seismol. 34, 361–400. doi: 10.1007/978-3-319-07118-3_11
Cecchi, R., and Calvi, M. (2011). Guidelines for evaluation and mitigation of seismic risk to cultural heritage paperback. Ministry for Cultural Heritage and Activities: Gangemi Publ.
Cosenza, E., Del Vecchio, C., Di Ludovico, M., Dolce, M., Moroni, C., Prota, A., et al. (2018). The italian guidelines for seismic risk classification of constructions: technical principles and validation. Bull. Earthq. Eng. 16, 5905–5935. doi: 10.1007/s10518-018-0431-8
Dolce, M., and Manfredi, G. (2015). White paper on private reconstruction outside the historical centers in the municipalities affected by the Abruzzo earthquake of 6 April 2009. (technical report) Italian.
Eurostat . (2021). Household electricity Price statistics. Available at: (Accessed February, 2022 https://ec.europa.eu)
Eurostat . Natural gas statistics. Available at: https://Ec.Europa.Eu (Accessed February, 2022).
Fischer-Kowalski, M., and Hüttler, W. (1998). The intellectual history of materials flow analysis, part II, 1970-1998. J. Ind. Ecol. 2, 107–136,
International Energy Agency (2019). Total final consumption by sector, OECD countries, 1971–2019. Paris, France: IEA Publications.
Italian Ministry of Ecological Transition . (2022). Attachment “A” to legislative decree Superbonus.
Legislative Decree No.34 . (2020). 110% Tax Deduction for Energy Efficiency and Photovoltaics. Italian Government (in Italian).
National Energy Technology Laboratory, NETL, Office of Fossil Energy . (2014). Life Cycle Analysis of Natural Gas Extraction and Power Generation, DOE/NETL-2014/1646.
Ottonelli, D., Cattari, S., and Lagomarsino, S., (2017). Loss assessment procedure of unreinforced masonry buildings. 16th world Conf. (Proceedings) Earthquake engineering, January 9–13, Santiago, Chile.
Reiff, N. : Zero-interest home improvement loans: what to know. Available at: https://www.investopedia.com (Accessed April 2024).
Sciubba, E. (2021). A thermodynamic measure of sustainability. Front Sustain 2:739395. doi: 10.3389/frsus.2021.739395
Sciubba, E., and Wall, G. (2007). A brief commented history of exergy from the beginnings to 2004. Int. J. Thermodyn. 10, 1–26,
Statista . (2023). Breakdown of natural gas price for an annual average domestic consumption of 1,400 cubic meters in the regulated market in Italy from October 2022 to July 2023
Szargut, J. (2005). The exergy method: Technical and ecological applications. Southhampton, England: WIT press.
Szargut, J., Morris, D. R., and Steward, F. R. (1988). Exergy analysis of thermal, chemical, and metallurgical processes. New York: Hemispere Pub.
Szargut, J., and Styrilska, T. (1964). 1964: approximate evaluation of the exergy of fuels. Brennst. Wärme Kraft 16, 589–596,
Tsatsaronis, G. (1984). Combination of Exergetic and economic analysis in energy-conversion processes, proc. European Congr. Energy Economics & Management in industry, Algarve, Portugal, April 2-5. Pergamon Press 1, 151–157,
Valero, A., and Lozano, M.-A. (1997). “An introduction to thermoeconomics” in Development in the Design of Thermal Systems (Cambridge, UK: Cambridge University Press), 203–223.
Keywords: residential subsidies for energy efficiency, exergy analysis, thermo-economics, seismic damage, primary resource exploitation
Citation: Biondi A, Caponi P, Cecere C and Sciubba E (2024) An exergy-based analysis of the effects of public incentives on the so-called “energy efficiency” of the residential sector, with emphasis on primary resource use and economics of scale. Front. Sustain. 5:1397416. doi: 10.3389/frsus.2024.1397416
Edited by:
Lambros Doulos, Hellenic Open University, GreeceReviewed by:
Nikolaos Skandalos, University of Patras, GreeceCopyright © 2024 Biondi, Caponi, Cecere and Sciubba. This is an open-access article distributed under the terms of the Creative Commons Attribution License (CC BY). The use, distribution or reproduction in other forums is permitted, provided the original author(s) and the copyright owner(s) are credited and that the original publication in this journal is cited, in accordance with accepted academic practice. No use, distribution or reproduction is permitted which does not comply with these terms.
*Correspondence: Enrico Sciubba, ZW5yaWNvLnNjaXViYmFAZm9uZGF6aW9uZS51bmlyb21hMS5pdA==
Disclaimer: All claims expressed in this article are solely those of the authors and do not necessarily represent those of their affiliated organizations, or those of the publisher, the editors and the reviewers. Any product that may be evaluated in this article or claim that may be made by its manufacturer is not guaranteed or endorsed by the publisher.
Research integrity at Frontiers
Learn more about the work of our research integrity team to safeguard the quality of each article we publish.