 Olivia Florence Godber
 Kirsten Workman
 Kristan Reed
 Quirine M. Ketterings
- 1Department of Animal Science, Cornell University, Ithaca, NY, United States
- 2PRO-DAIRY, Cornell University, Ithaca, NY, United States
New York (NY) state is one of five states that collectively produce >50% of the annual milk supply within the United States. The local environment allows farmers to integrate crop and livestock systems, facilitating cycling of manure nutrients back to cropland. Thus, dairy provides NY with benefits, opportunities, and challenges in terms of environmental sustainability, climate resiliency, and a circular agricultural economy. Improved balancing of crop nitrogen (N) and phosphorus (P) needs and supply with manure and fertilizer, is key for a circular agricultural economy. The objectives of this study were to calculate and evaluate (1) regional and county level N and P balances of harvested cropland; and (2) contribution of manure to a circular agricultural economy for NY. Nutrient balances were calculated for 2017 (most recent Census year) as the difference in the amount of nutrient input through purchased fertilizer and recoverable manure, and the amount removed in harvested crops. Atmospheric N deposition and legume N fixation, and manure nutrient losses during collection, transfer, storage, and treatment were estimated too. The 2017 P balance was 10 kg P ha−1 (9 lb. P ac−1). The N balance was between 39 kg N ha−1 (35 lb. N ac−1) and 95 kg N ha−1 (85 lb. N ac−1), depending on the proportion of legume cropland assumed to receive manure. Redistribution and application of manure to meet P-removal on non-legume cropland only leaves a surplus of 3 kg P ha−1 (3 lb. P ac−1). Applying surplus manure to legume and non-legume cropland results in a slight, state-level, P deficit. In both scenarios, the large N deficit that cannot be met through legume N fixation alone indicates purchased fertilizer is required. These results show NY’s ability to capitalize on the value of manure without excessive risk to the environment. Greater circularity of agricultural production in NY will need to consider benefits and trade-offs of applying manure to legume cropland. As milk production increases in the state, implementation of advanced manure treatment, storage, and manure application and livestock feeding practices will be needed to increase the circularity and sustainability of the agricultural sector in NY.
1 Introduction
Agriculture is under increasing pressure to minimize its environmental footprint globally, resulting in efforts to increase all three pillars of sustainability: environmental, economic, and social. To remain competitive in the global market and contribute to a more circular economy, a growing number of agricultural sectors across continents and countries have set sustainability targets for greenhouse gas (GHG) emission reduction, water use, climate resiliency and biodiversity (Holly et al., 2018). One such example is the commitment by the dairy industry in the United States (US) to reach GHG neutrality, optimize water use while maximizing recycling, and improve water quality by 2050 (US Dairy Net Zero Initiative, 2023).
A circular economy moves away from linear, short-chain, processes towards integrated systems that form a closed loop (Ellen MacArthur Foundation, n.d.). In disconnected animal and crop systems, the principles of a circular agricultural economy are hard to achieve, particularly for nutrient cycling. In contrast, integrated crop-livestock systems have a particularly good opportunity to establish a circular agricultural economy due to the intrinsic ability to cycle nutrients within the system (Franzluebbers et al., 2021). For the US, this concept of nutrient cycling has been referred to as manure sheds (Spiegal et al., 2020; Flynn et al., 2023).
The state of New York (NY) is a prominent agricultural state in the US. At the time of the 2017 Census of Agriculture, NY ranked third for milk production, third for maize silage production, and in the top five for apples, cabbage, grapes, snap beans, squash, cherries, blueberries, and maple syrup. The integrated crop-livestock system gives NY many advantages. With almost 2.8 million ha (6.9 million ac) of agricultural land, 625,000 dairy cows producing 6.8 billion kg (15 billion lb.) of milk in 2017, NY agriculture produces a large amount of nutritious dairy products, along with a large amount of nutrient-rich manure.
Nutrient balance assessments are needed to evaluate the long-term sustainability of producing crops with manure and fertilizer inputs. Such balance assessments compare the amount of nutrients entering and leaving a system. This can be done at a variety of scales, including field, farm, waterbody, watershed, county, state, sector or nation (Sharara et al., 2022). By assessing nutrient imports and exports, or inputs and removal, nutrient use can be monitored, and the efficiency of agricultural nutrient management assessed. In addition, nutrient balances can aid in the summary of nutrient flows and identification of imbalances at various scales to highlight areas of opportunity for improvement. Further uses can include assessment of the impact of nutrient management policy, implementation of fertility guidelines, extension education and knowledge transfer. Benefits also include the optimization of the use of nutrients for economic crop production and environmental protection.
Much work on nutrient balances focuses on nitrogen (N) and phosphorus (P) due to their agronomic importance to crop production and their potential for environmental harm. For example, excess P can contribute to the impairment and degradation of rivers and lakes, while N can impact air and water quality and ecosystem stability, and N losses also contribute to direct and indirect emissions of nitrous oxide (N2O), a potent GHG (Sharpley et al., 2019). Therefore responsible nutrient management is essential for sustainable agricultural production and particularly important for NY agriculture as it is situated within four major watersheds (Lake Erie, Lake Ontario, Lake Champlain, and the Chesapeake Bay).
There have been several studies of N and P balances at the US county, state and watershed level over the past 15 years (Kellogg et al., 2000; Swink et al., 2009, 2011; Khanal et al., 2014; Yang et al., 2016; Andersen and Pepple, 2017; Gronberg and Arnold, 2017; Peterson et al., 2017; Spiegal et al., 2020; Leytem et al., 2021; Roy et al., 2021; Flynn et al., 2023). Often, such studies focus on N and P individually as was done for the NY assessments (Swink et al., 2009, 2011). For states where animal agriculture dominates land use, evaluation of N and P balances together will be essential for policy development as manure applied to the land-base contains both N and P and managing for just one can cause unintended consequences. Spiegal et al. (2020) did calculate balances for both N and P but used 2012 data and this study did not include detailed analyses for NY. Nutrient balances for NY have not been calculated since (Swink et al., 2009, 2011) using 2002 data for P, and 2007 data for N. In the current paper, N and P balances are calculated together, allowing the impact of the N to P ratio of manure, manure application on legume cropland and how the characteristics of NY agriculture (predominantly dairy, with high production of forages and modest animal densities) all contribute to the region moving towards a circular agricultural economy.
The objectives of the current work are to calculate and evaluate the (1) 2017 NY regional and county level N and P balances (harvested crop nutrient removal minus supply with manure and fertilizer); and (2) contribution of manure to a circular agricultural economy in NY. The 2017 balances were estimated as 2017 is the most recent year in which the United States Department of Agriculture (USDA) Census of Agriculture (CoA) data have been released to the public.
2 Materials and methods
2.1 State, regions, and counties
While NY has 62 counties, the Long Island counties (7), Hamilton County (Northeast region), Putnam County (Southeast region), Rockland County (Southeast region), Warren County (Northeast region) and Westchester County (Southeast region) were excluded from balance analyses due to their lack of agricultural land (0.7% of the total harvested cropland and 0.3% of livestock AU of NY were located in these counties). Thus, analyses presented here were done using data for 50 counties.
The state was divided into nine regions according to the USDA Natural Resources Conservation Service (NRCS) regions; Central, Eastern, Long Island, Northeast, Northern, Southeast, Southern, Southwest, and Western, as was done in earlier balance summaries (Swink et al., 2009, 2011).
2.2 Crop production and nutrient removal
Harvested crop nutrient removal was determined using data from 2017 USDA CoA at the county and state level for harvested area and production (total yield) of field crops (alfalfa [Medicago sativa L.] hay and haylage, other (non-alfalfa) hay and haylage, corn [Zea mays L.] silage, corn grain, soybeans [Glycine max (L.) Merr.], wheat [Triticum aestivum L.] and oats [Avena sativa L.]), and area bearing or harvested for fruit and vegetable crops (apples [Malus sylvestris (Borkh.) Borkh.], cabbage [Brassica oleracea L.], grapes [Vitis vinifera L.], potatoes [Solanum tuberosum L.], snap beans [Phaseolus vulgaris L.], sweet corn, squash [Cucurbita spp.], pumpkins [Cucurbita spp.], strawberries [Fragaria spp.], peaches [Prunus persica (L.) Batsch], green peas [Pisum sativum L.], bell peppers [Capsicum annum L.], blueberries [Vaccinium spp.] and cherries [Prunus spp.]). Total production of fruit and vegetable crops at the county level was based on the state yields calculated from the USDA 2017 State Agriculture Overview for NY, rather than county specific yields, while a county-specific yield could be used for field crops. Selection of crops to include in the analysis was based on those listed in the USDA 2017 State Agriculture Overview for NY, which contains information for the crops contributing most to the total value (in US dollars) of crop production in NY. The crops included in the following analysis accounted for 97% of the harvested cropland in NY in 2017.
The USDA 2017 CoA defines harvested cropland as “land from which crops were harvested and hay was cut, land used to grow short rotation woody crops, Christmas trees, and land in orchards, groves, vineyards, berries, nurseries, and greenhouses.” Land from which two or more crops were harvested was counted only once. The following were not included: land occupied by tapped maple (Acer spp.) trees, defined as permanent pasture and rangeland (grazable land that does not qualify as woodland pasture or cropland pasture and cannot be cropped without improvements), defined as idle, used for cover crops or soil improvement but not harvested and not pastured or grazed, cropland on which all crops failed, cropland in summer fallow, and other pasture or grazing land that could have been used for crops without additional improvements (USDA NASS, 2019a).
Harvested crop nutrient removal values for forage crops were taken from the updated database of the Cornell Net Carbohydrate and Protein System v.6.5 (CNCPS; Higgs et al., 2015). For small grains, fruit and vegetable crops, the USDA NRCS PLANTS Database Crop Nutrient Tool (USDA NRCS, 2023; Table 1) was used. Atmospheric N deposition was estimated at 9.2 kg ha−1 (8.2 lb. ac−1) on all harvested cropland acres (legume and non-legume), in agreement with earlier N balance studies for NY (Swink et al., 2011). Assessment of atmospheric N fixation by legume crops (alfalfa, soybeans, snap beans, and green peas) was also kept consistent with the values used in Swink et al. (2011) and Meisinger and Randall (1991).
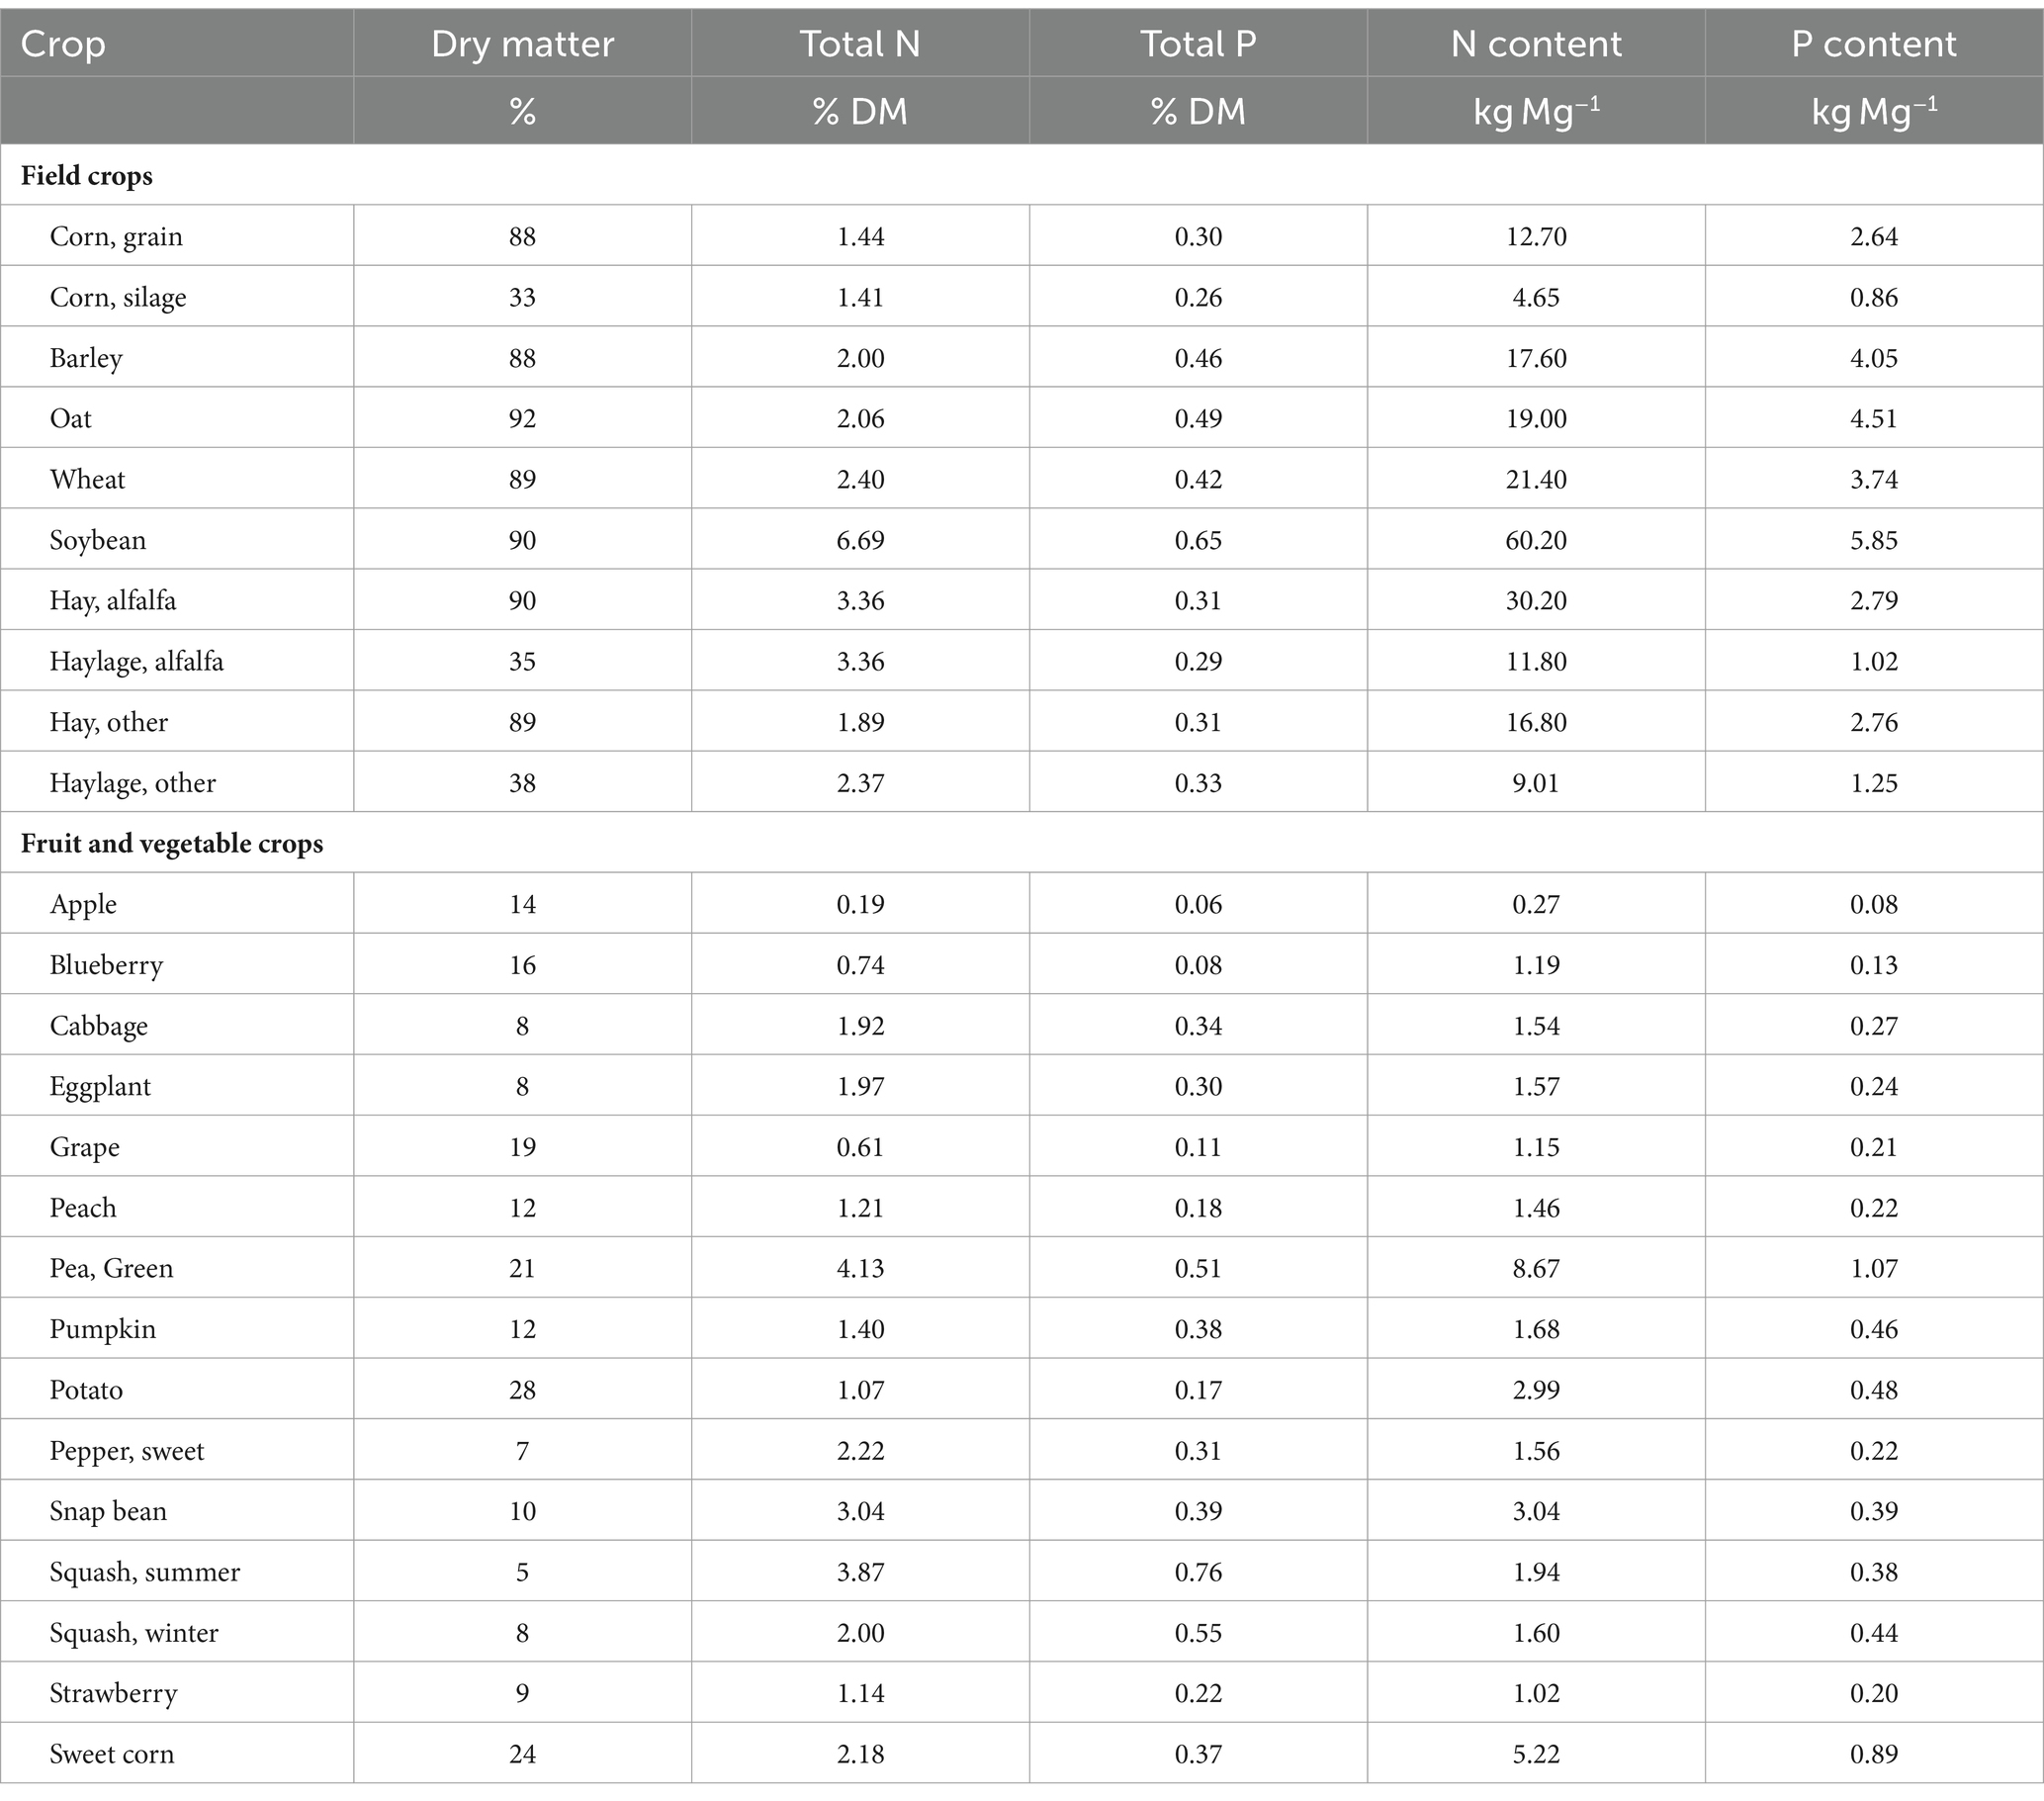
Table 1. The dry matter (DM), nitrogen (N) and phosphorus (P) content of the field, fruit and vegetable crops contributing most to the total value (in US dollars) of crop production in New York.
2.3 Fertilizer supply
Fertilizer sale estimates of the US Geological Survey (Falcone, 2021) were used due to a lack of recorded sales for the period of study. In this approach, eleven predictor variables (percentage of county cropland area in corn, pasture crops, N-fixing crops, small-grain crops, other miscellaneous crops, dollars spent on fertilizer divided by fertilizer-price index per county, mass of N or P from manure per county, annual evapotranspiration, annual precipitation, fertilized cropland area, and population density of the county) were used against AAPFCO-derived data in random forests decision-tree models for the USDA Census of Agriculture years 2002, 2007 and 2012. The proportion of farm versus non-farm fertilizer usage was calculated by relating the ratio of farm to non-farm usage to population counts from 2000 and 2010 (as counties with more urban areas tend to have a higher non-farm fertilizer usage), and those ratios were applied to 2017. Full details of the methodology can be found in Falcone (2021).
2.4 Livestock populations, manure production and nutrient supply
Livestock populations were taken from the 2017 USDA CoA, using end-of-year inventory (USDA NASS, 2019b). The categories of livestock available were milk cows, beef cows, other cattle, total hogs, poultry broilers, laying poultry, total turkeys, sheep (including lambs), goats and horses. These livestock categories were then subdivided to match the categories for which manure excretion rates are available (MWPS, 1993; ASAE, 2005). All inventories were given in number of head and were converted to animal equivalent units (AUs), where 1 AU equals 455 kg (1,000 lb) of live animal weight (Table 2; SRM, 2017).
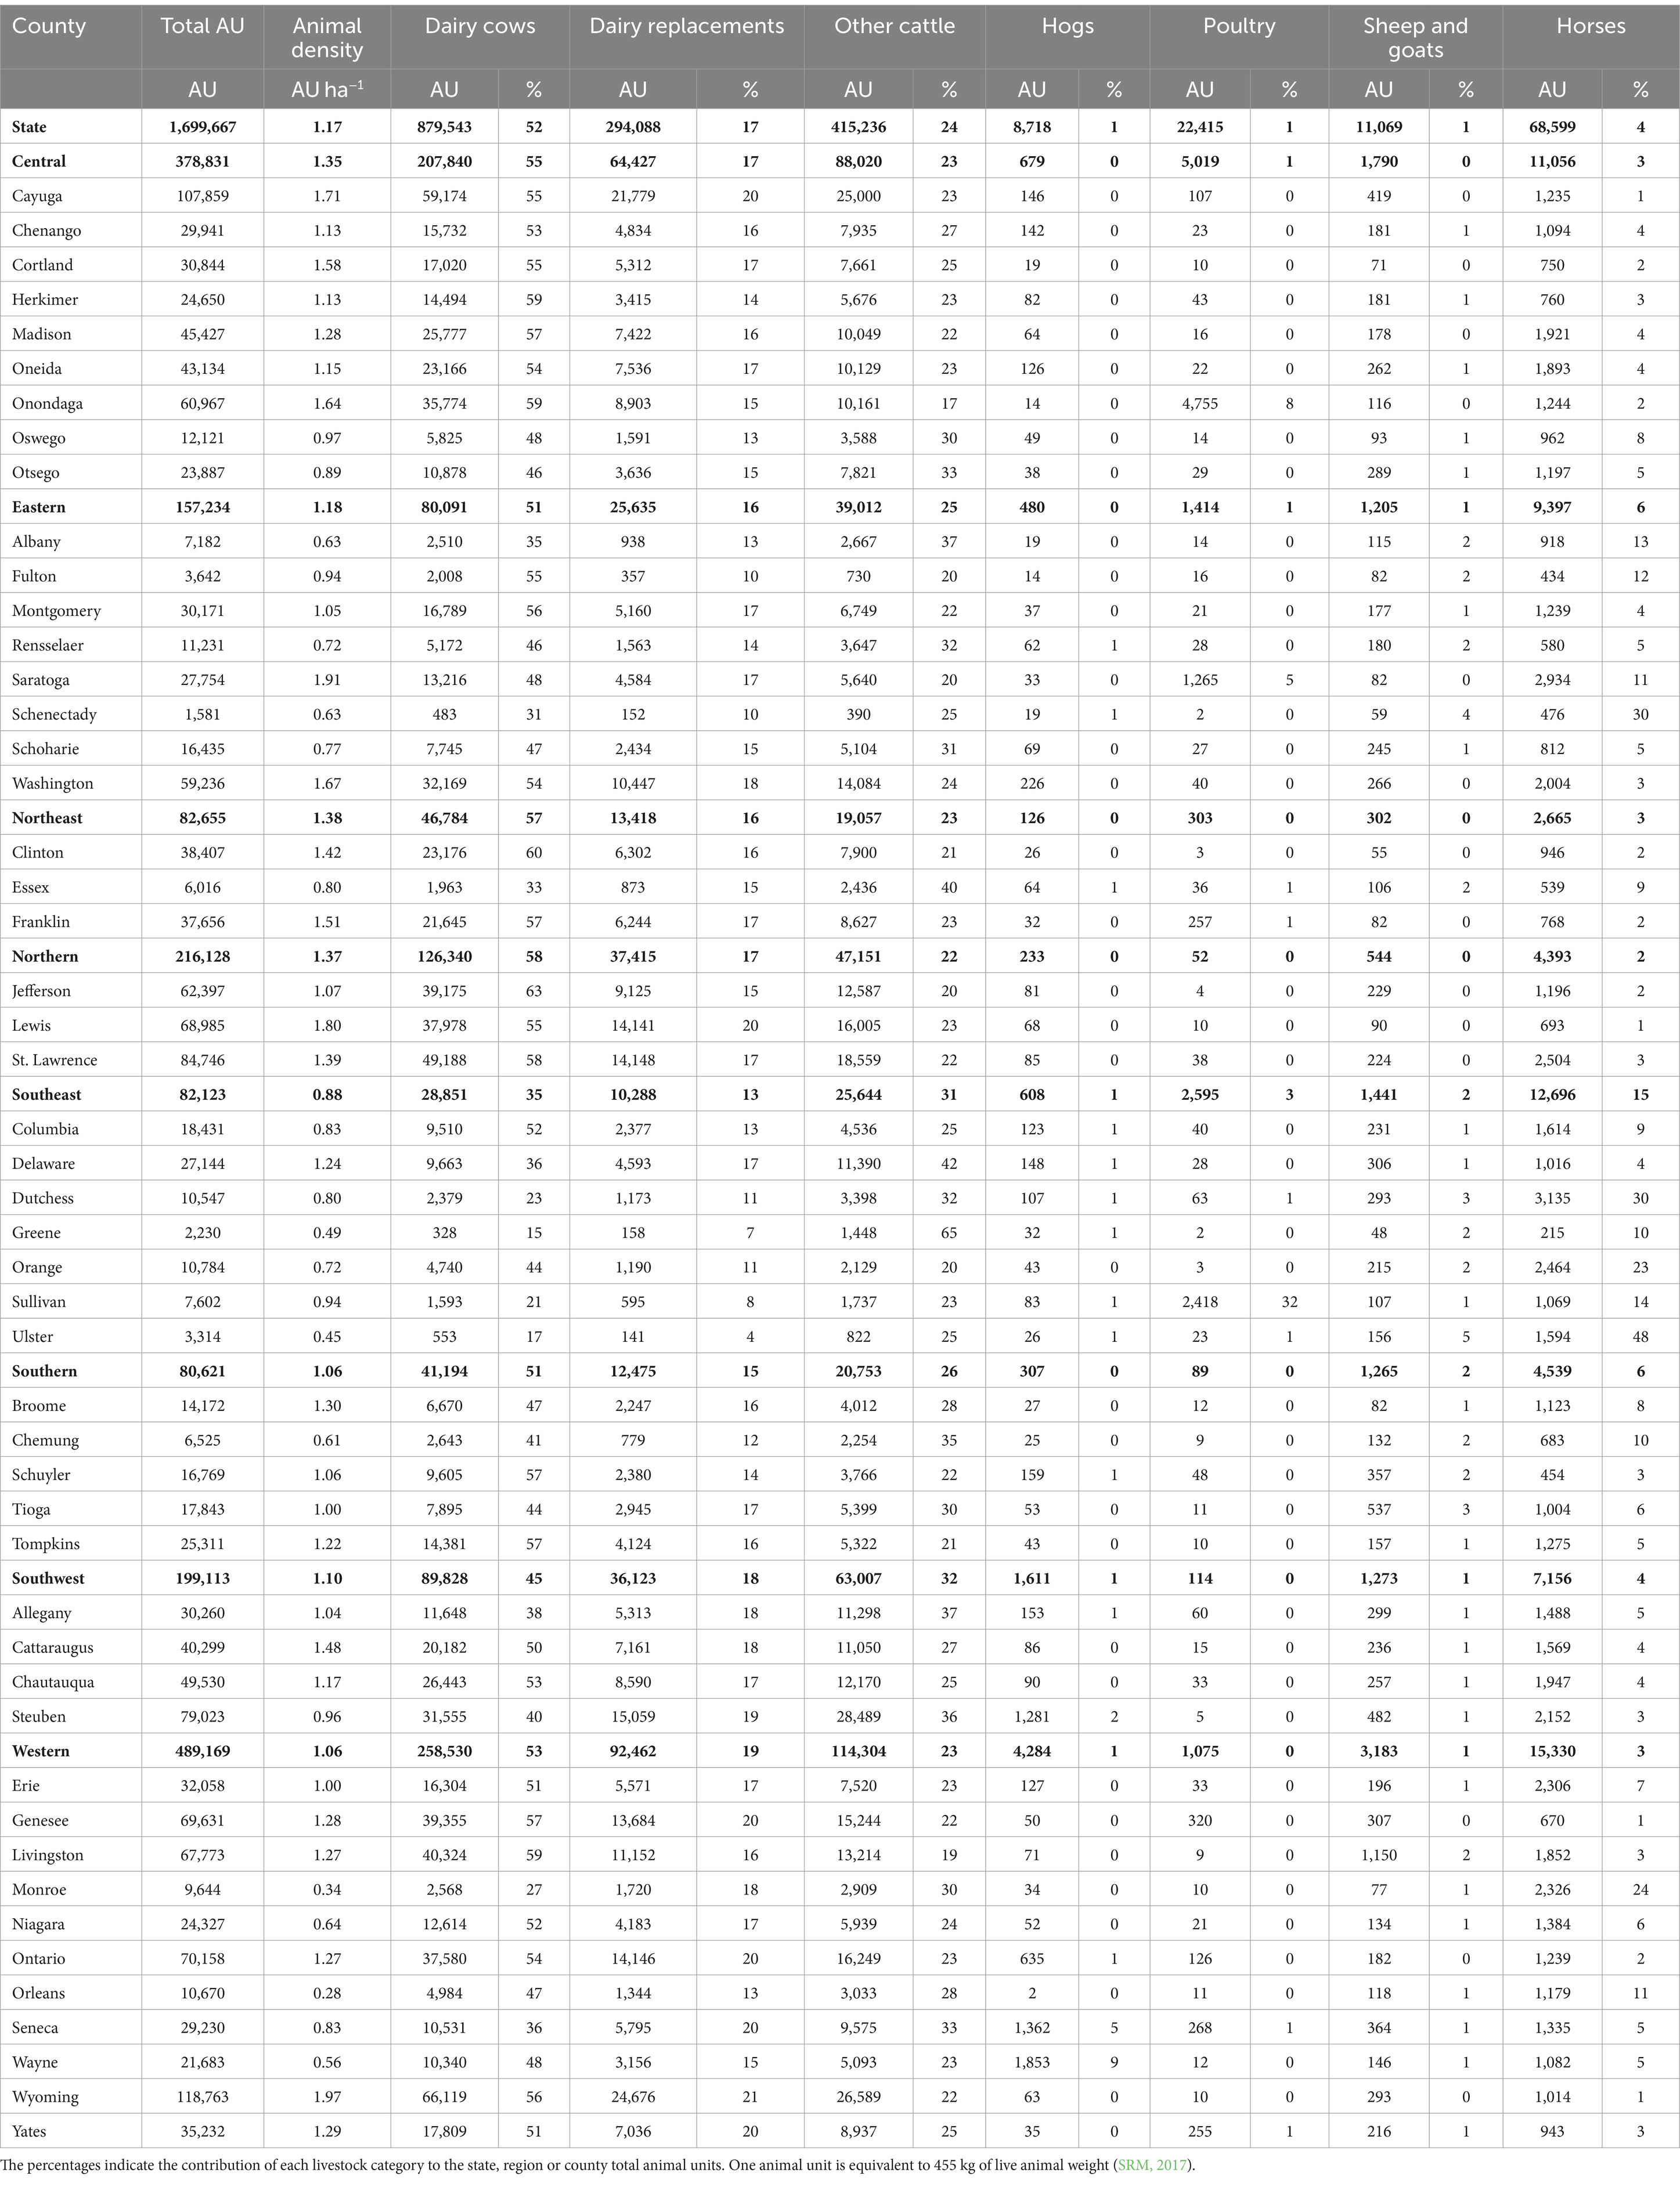
Table 2. The total animal units (AU) and animal density of livestock categories in New York at the state, regional and county level according to the 2017 United States Department of Agriculture Census of Agriculture.
Dairy cows were assumed to have a 60-day drying off period, hence 16% of the dairy cows were assigned to the dry dairy cow category and 84% to the lactating dairy cow category. Youngstock inventory (dairy heifers, growing beef cattle, and calves) was calculated as the total cattle inventory, minus dairy cow inventory, beef cow inventory and bulls (bulls were assumed to be equal to 5% of the dairy and beef cow numbers, which is equivalent to a 1 to 20 bull-to-cow ratio). This estimated youngstock inventory was divided into dairy youngstock and beef youngstock inventories at the same ratio as the dairy-to-beef cows. The dairy youngstock inventory was divided equally into males and females, with the males being moved into the beef youngstock inventory, and the females again divided equally into a less than one year old category (dairy calves) and a one to two years old category (dairy heifers). The beef youngstock were divided into pre-weaned calves (birth to approximately 10 months of age), growing cattle (approximately 10 to 30 months of age) and finishing cattle (approximately 31 to 36 months of age). Pre-weaned beef cattle were assumed to be equal in number to the number of beef cows, and finishing cattle were assumed to be equivalent to the cattle on feed category in the USDA Annual Bulletin data for NY in 2017, which accounted for 1.5% of the total cattle inventory. The remaining beef youngstock were assigned to the growing cattle category (USDA NASS, 2018).
For hogs, only the total end-of-year inventory was available. It was presumed that this remains constant throughout the year, and that the breeding herd represented 14% of the total inventory. This is in line with Kellogg et al. (2000), and USDA Survey data for NY in 2017, which gives the breeding inventory separate to the total inventory. A ratio of 1 to 20 boars-to-sows was assumed, and sows were assumed to have a gestation length of 114 days, and a farrow-to-weaning period of 35 days. Hence, 77% of the sows were assigned to the gestation category and 23% to the lactating category. Other hogs (87% of the total hog inventory) were subdivided into nursery hogs and grow-finish hogs. Based on the USDA Annual Bulletin data 32% of the total hog inventory was assigned to nursery hogs and 54% to grow-finish hogs (USDA NASS, 2018).
For poultry, the end-of-year inventory from the 2017 USDA CoA was used for both broilers and layers and assumed to be constant throughout the year. The end-of-year inventory for turkeys was divided equally into toms (males) and hens (females).
The total inventory of horses and ponies from the 2017 USDA CoA was divided equally between the sedentary and intense-exercise categories. The total inventory of sheep (including lambs) and goats from the 2017 USDA CoA was used without adjustment or differentiation between meat and dairy (USDA NASS, 2019b).
Manure and nutrient excretion rates (as-excreted; Table 3) and average animal bodyweights were taken from American Society of Agricultural and Biological Engineers (ASAE, 2005) for cattle, hogs and poultry, Mid-West Plan Service (MWPS, 1993) for horses and sheep, and the Intergovernmental Panel on Climate Change (IPCC, 2019) for goats. Beef cow excretion rates only account for non-lactating periods and the first six months of gestation. Although excretion rates and animal bodyweights may have changed since these data were first published, they are the most complete, currently available, data used in similar nutrient balance studies, allowing comparison across studies such as Andersen and Pepple (2017), Falcone (2021), Gronberg and Arnold (2017), Kellogg et al. (2000, 2014), Meisinger and Randall (1991), Saha et al. (2023), Spiegal et al. (2020), Swink et al. (2009, 2011) and Yang et al. (2016).
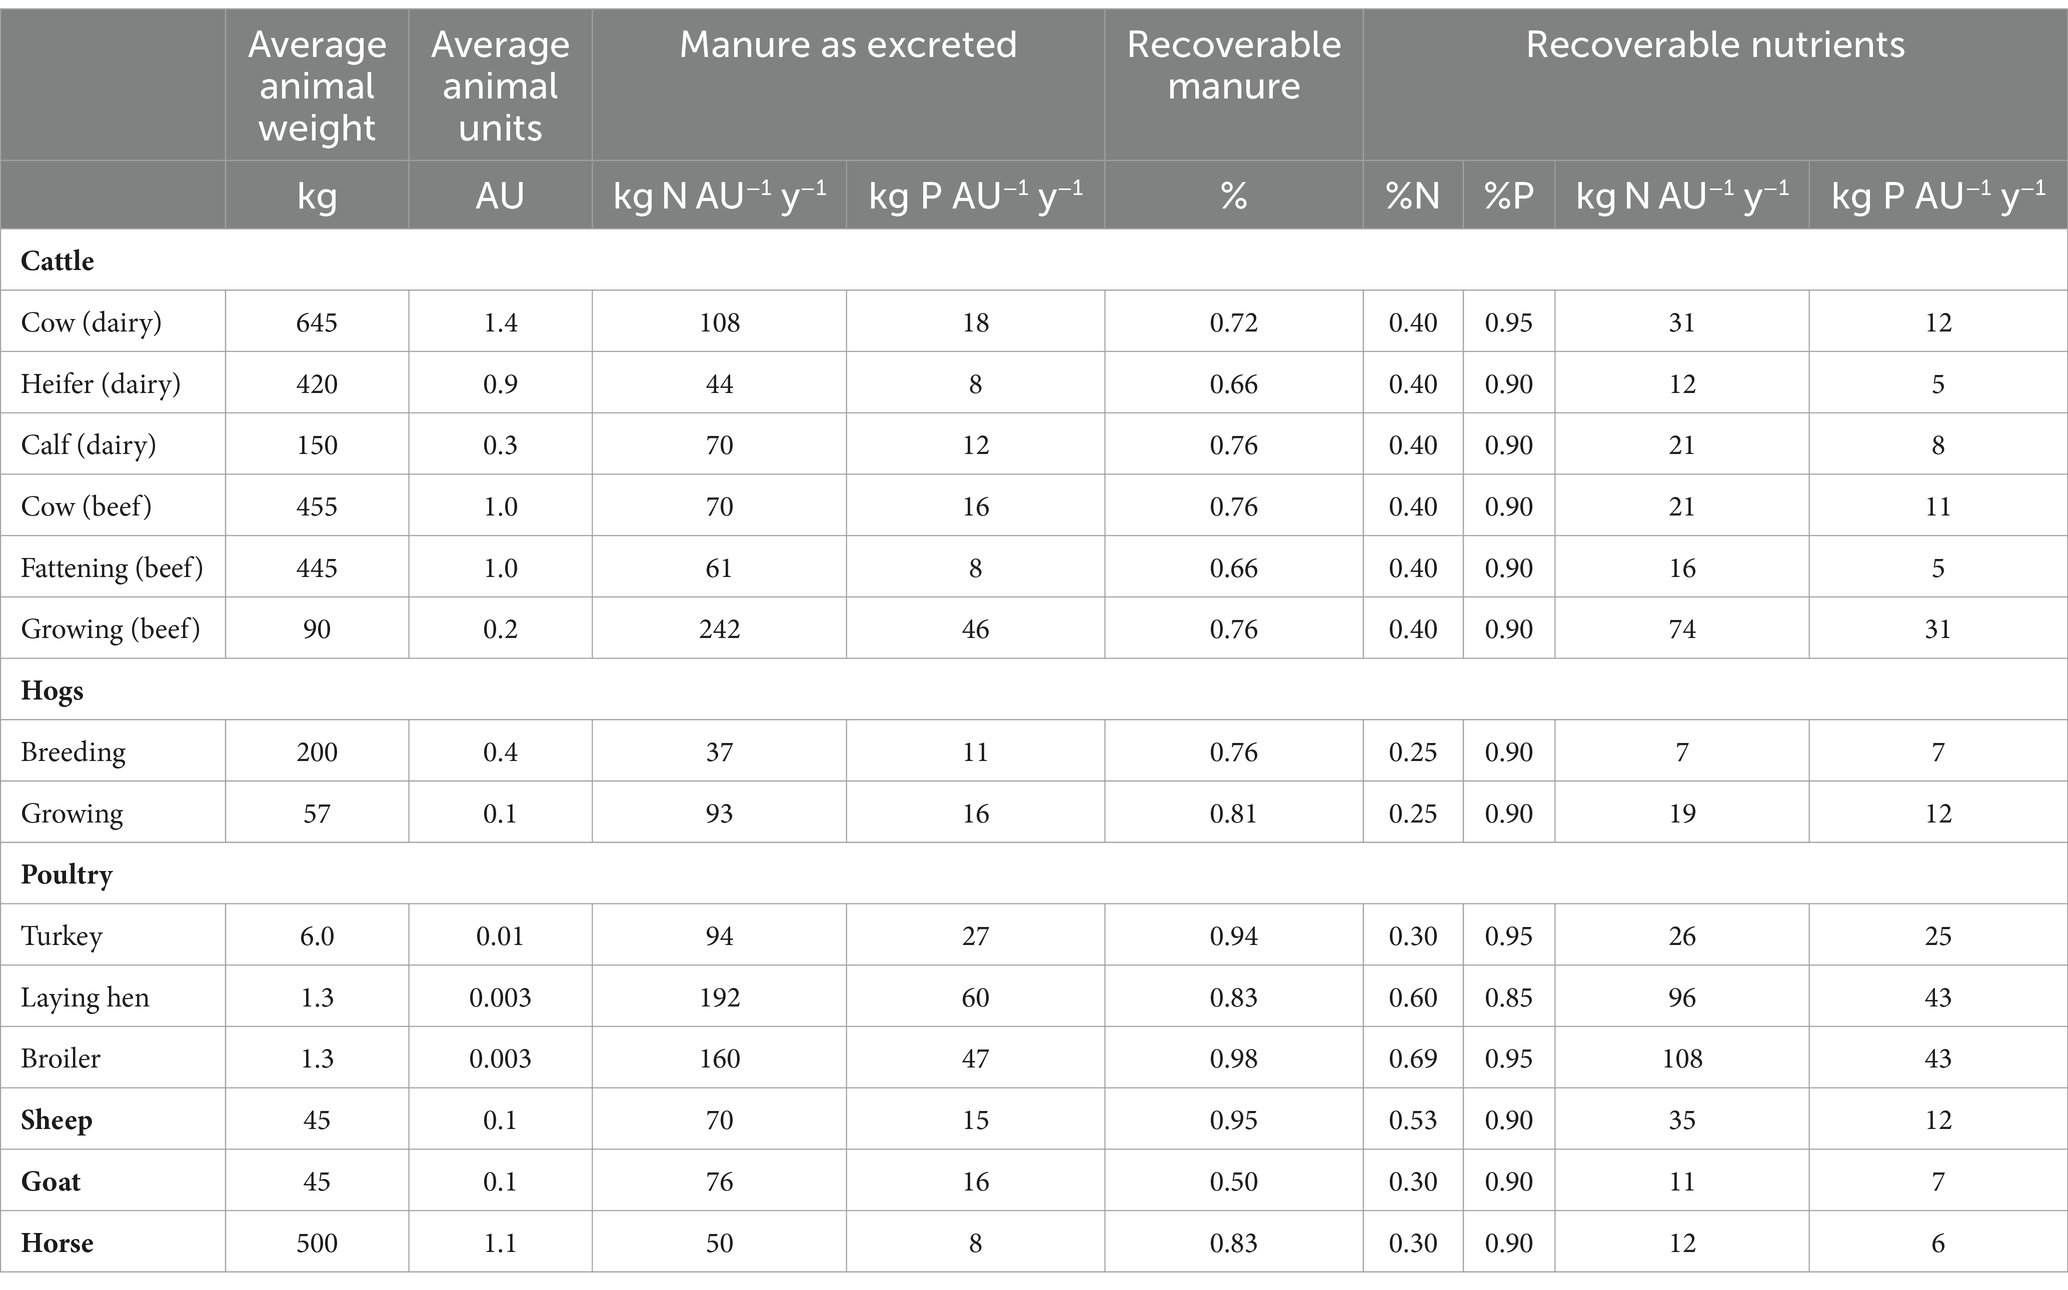
Table 3. Average animal weight, animal units (AU), nitrogen (N) and phosphorus (P) excreted in manure, fraction of recoverable manure, and fraction of recoverable nutrients for livestock categories in New York, where one AU is equivalent to 455 kg or 1.000 lb. of live animal weight (SRM, 2017).
The manure excretion rates were adjusted using recovery coefficients to account for the amount of manure that can be captured and is available for land application (amount of recoverable manure; Table 3). Recoverable manure from confined animals excludes any manure deposited on pasture or lost during handling, and varies over time, by region, and by farm size according to manure handling and management practices. The recovery coefficients used in this study were taken from Kellogg et al. (2014) who estimated recovery coefficients for 2017 based on time trend analysis of animal feeding operations (confined animals) with comprehensive nutrient management plans. Where possible, NY specific recovery coefficients were used (finishing cattle, poultry broilers and poultry layers). For all other categories, Northeast coefficients were used except for turkeys, for which the national value was used due to lack of any region-specific data. Where there were different recovery coefficients for different farm sizes, a weighted average was taken (based on the number of farms of each size).
A second calculation was done to determine recoverable manure nutrients, defined as the amount of nutrients in the recoverable manure after accounting for losses during collection, transfer, storage, treatment, spillages or incidental losses, and, for N, volatilization and denitrification (Table 3). The recoverable nutrient fractions were taken from Kellogg et al. (2014) for all animal categories with exception for milk cows. As noted by MacDonald et al. (2009), these calculations are based on assumptions of typical production practices. Actual manure and nutrient production can vary with feed characteristics, the feeding regimen, breeding, and animal performance. Losses during the land application process were not included. Finally, adjustments were made for available N, the amount of ammonium N available for plant uptake, which was set at 50% N availability based on Ketterings and Workman (2023).
2.5 Overall phosphorus balance
The overall P balance was initially calculated by dividing the difference between P supplied (in recoverable manure and purchased fertilizer) and harvested crop removal of P by the total harvested cropland (Equation 1). The balance was then recalculated considering P losses during storage and handling as well (Equation 2).
It should be noted that these are partial P balances as not all cropland P inputs and outputs can be accurately determined. It should be recognized that P balances are a snapshot, as both nutrient inputs and crop removal (or yield) will be impacted by the weather and management in a specific year.
2.6 Overall nitrogen balance
The overall N balances for individual counties, regions, and the state were estimated with and without inclusion of N fixation to account for two different assumptions of N application to legume fields. First, the N balances for the scenario where manure and N fertilizer were not applied to legume cropland (Nbalancemanure only on non-legume cropland before storage losses) were calculated by dividing the difference between N supplied (in recoverable manure and purchased N fertilizer, atmospheric deposition of N and legume fixation of N) and harvested crop removal of N by the total harvested cropland (Equation 3). This scenario assumes legumes received N inputs from atmospheric deposition and N fixation only.
A second scenario in which manure was applied to all cropland including legume cropland (Nbalancemanure on all cropland before storage losses; Equation 4) was calculated by dividing the difference between the N supplied (in recoverable manure, purchased N fertilizer and atmospheric deposition of N) and the harvested crop removal of N by all cropland, legumes included, by the total harvested cropland. This scenario assumes N needs of the legume crops is supplied by manure addition to legume cropland. Reality will lie between these two scenarios, as manure and purchased N fertilizer are likely to have been applied to some but not all legume cropland, and therefore some legume fixation of N will have occurred. Additionally, some studies suggest there could still be some legume fixation of N with fertilizer and manure applications, and even a higher rate of N fixation in some situations where manure was applied (Shi et al., 2021; Guo et al., 2023). Due to the uncertainty in the rate of manure N application and N fixation in legume cropland, only the extreme scenario of no N fixation was calculated.
From the recoverable manure, the N lost during storage due to volatilization and denitrification, and availability of N when applied to cropland, was calculated as well. As with the P balances, these are partial N balances as not all cropland N inputs and outputs can be accurately determined. For example, N inputs and soil credits from previous crops, use of cover crops, and mineralization of organic N from previous manure applications are not included.
2.7 Other calculations and limitations
To assess any potential impact of animal density and its interaction with source of nutrients (manure versus purchased fertilizer) and legume production, the following parameters were calculated for county, regional and state level assessments:
• Animal density or total AUs divided by the total harvested cropland area (where 1 AU is equal to 455 kg or 1,000 lb. of live animal weight; SRM, 2017).
• The ratio of manure N and P to purchased N and P.
• The N to P ratio of manure, purchased fertilizer, total nutrient input, and crop removal.
• The percentage of legume cropland.
• The percentage of manured cropland, and average manure N and P application rates.
• The percentage of cropland receiving purchased fertilizer, and average N and P fertilizer application rates (this assumes that all cropland reported as fertilized received both N and P applications, and the rates are therefore likely to be an underestimation).
• Manure P surplus or deficit (a) when compared to crop removal of non-legume cropland, and (b) when surplus manure P is applied to legume cropland in addition to non-legume cropland.
• Manure N surplus or deficit when manure is applied to crop P removal, with N application rate based on the manure N to P ratio.
This study assumes that all manure and fertilizer was applied in the county or region it was produced or purchased and that no N fixation occurs when legumes receive manure or fertilizer N. In addition, it should be recognized that:
• These results are a snapshot for the year 2017 and do not necessarily represent nearby years due to weather related variations in year-to-year crop yields, carryover of fertilizer nutrients into a following growing season, and crediting of multiple years of nutrient applications.
• Some data from the USDA CoA cannot be shared to avoid disclosure of information about individual farm operations. In these cases, data were taken from the previous (2012) USDA CoA when available or counted as zero when not available.
• Use of sexed semen in dairy production is likely to alter the ratio of male to female cattle youngstock inventories, which could not be accounted for in this assessment.
• Manure estimates and coefficients and AU may not fully represent feeding rations and manure management practices of all NY livestock farms.
• Nitrogen losses during manure application are not accounted for separately due to the wide range in N losses associated with different application methods (Ketterings and Workman, 2023), and a lack of available information on current manure application methods used in NY. Thus, nutrient losses from land application of manure are part of the balance.
• Nutrients in crop residue were not accounted for as a harvested crop nutrient export because the majority of cropland in NY is in forage crops (corn silage, alfalfa and grass) where whole plants are harvested leaving little crop residue of significance. In addition, corn grain and soybean residues are commonly left in the field and therefore not a nutrient removal. Small grains could leave straw that may be harvested but this is a small area and their residue is a minor contribution to nutrient balances.
3 Results
3.1 Characterization of NY agriculture
In 2017, the USDA CoA (USDA NASS, 2019b) shows that NY had almost 1.5 million ha (3.7 million ac) of harvested cropland of which approximately 30% were corn (split equally between corn grain and corn silage), 30% were non-alfalfa hay and haylage, and 20% were alfalfa hay and haylage. Approximately 10% were harvested for soybeans and small grains (predominantly wheat and oats) and 5% were harvested for fruit and vegetables (Figure 1A; Table 4).
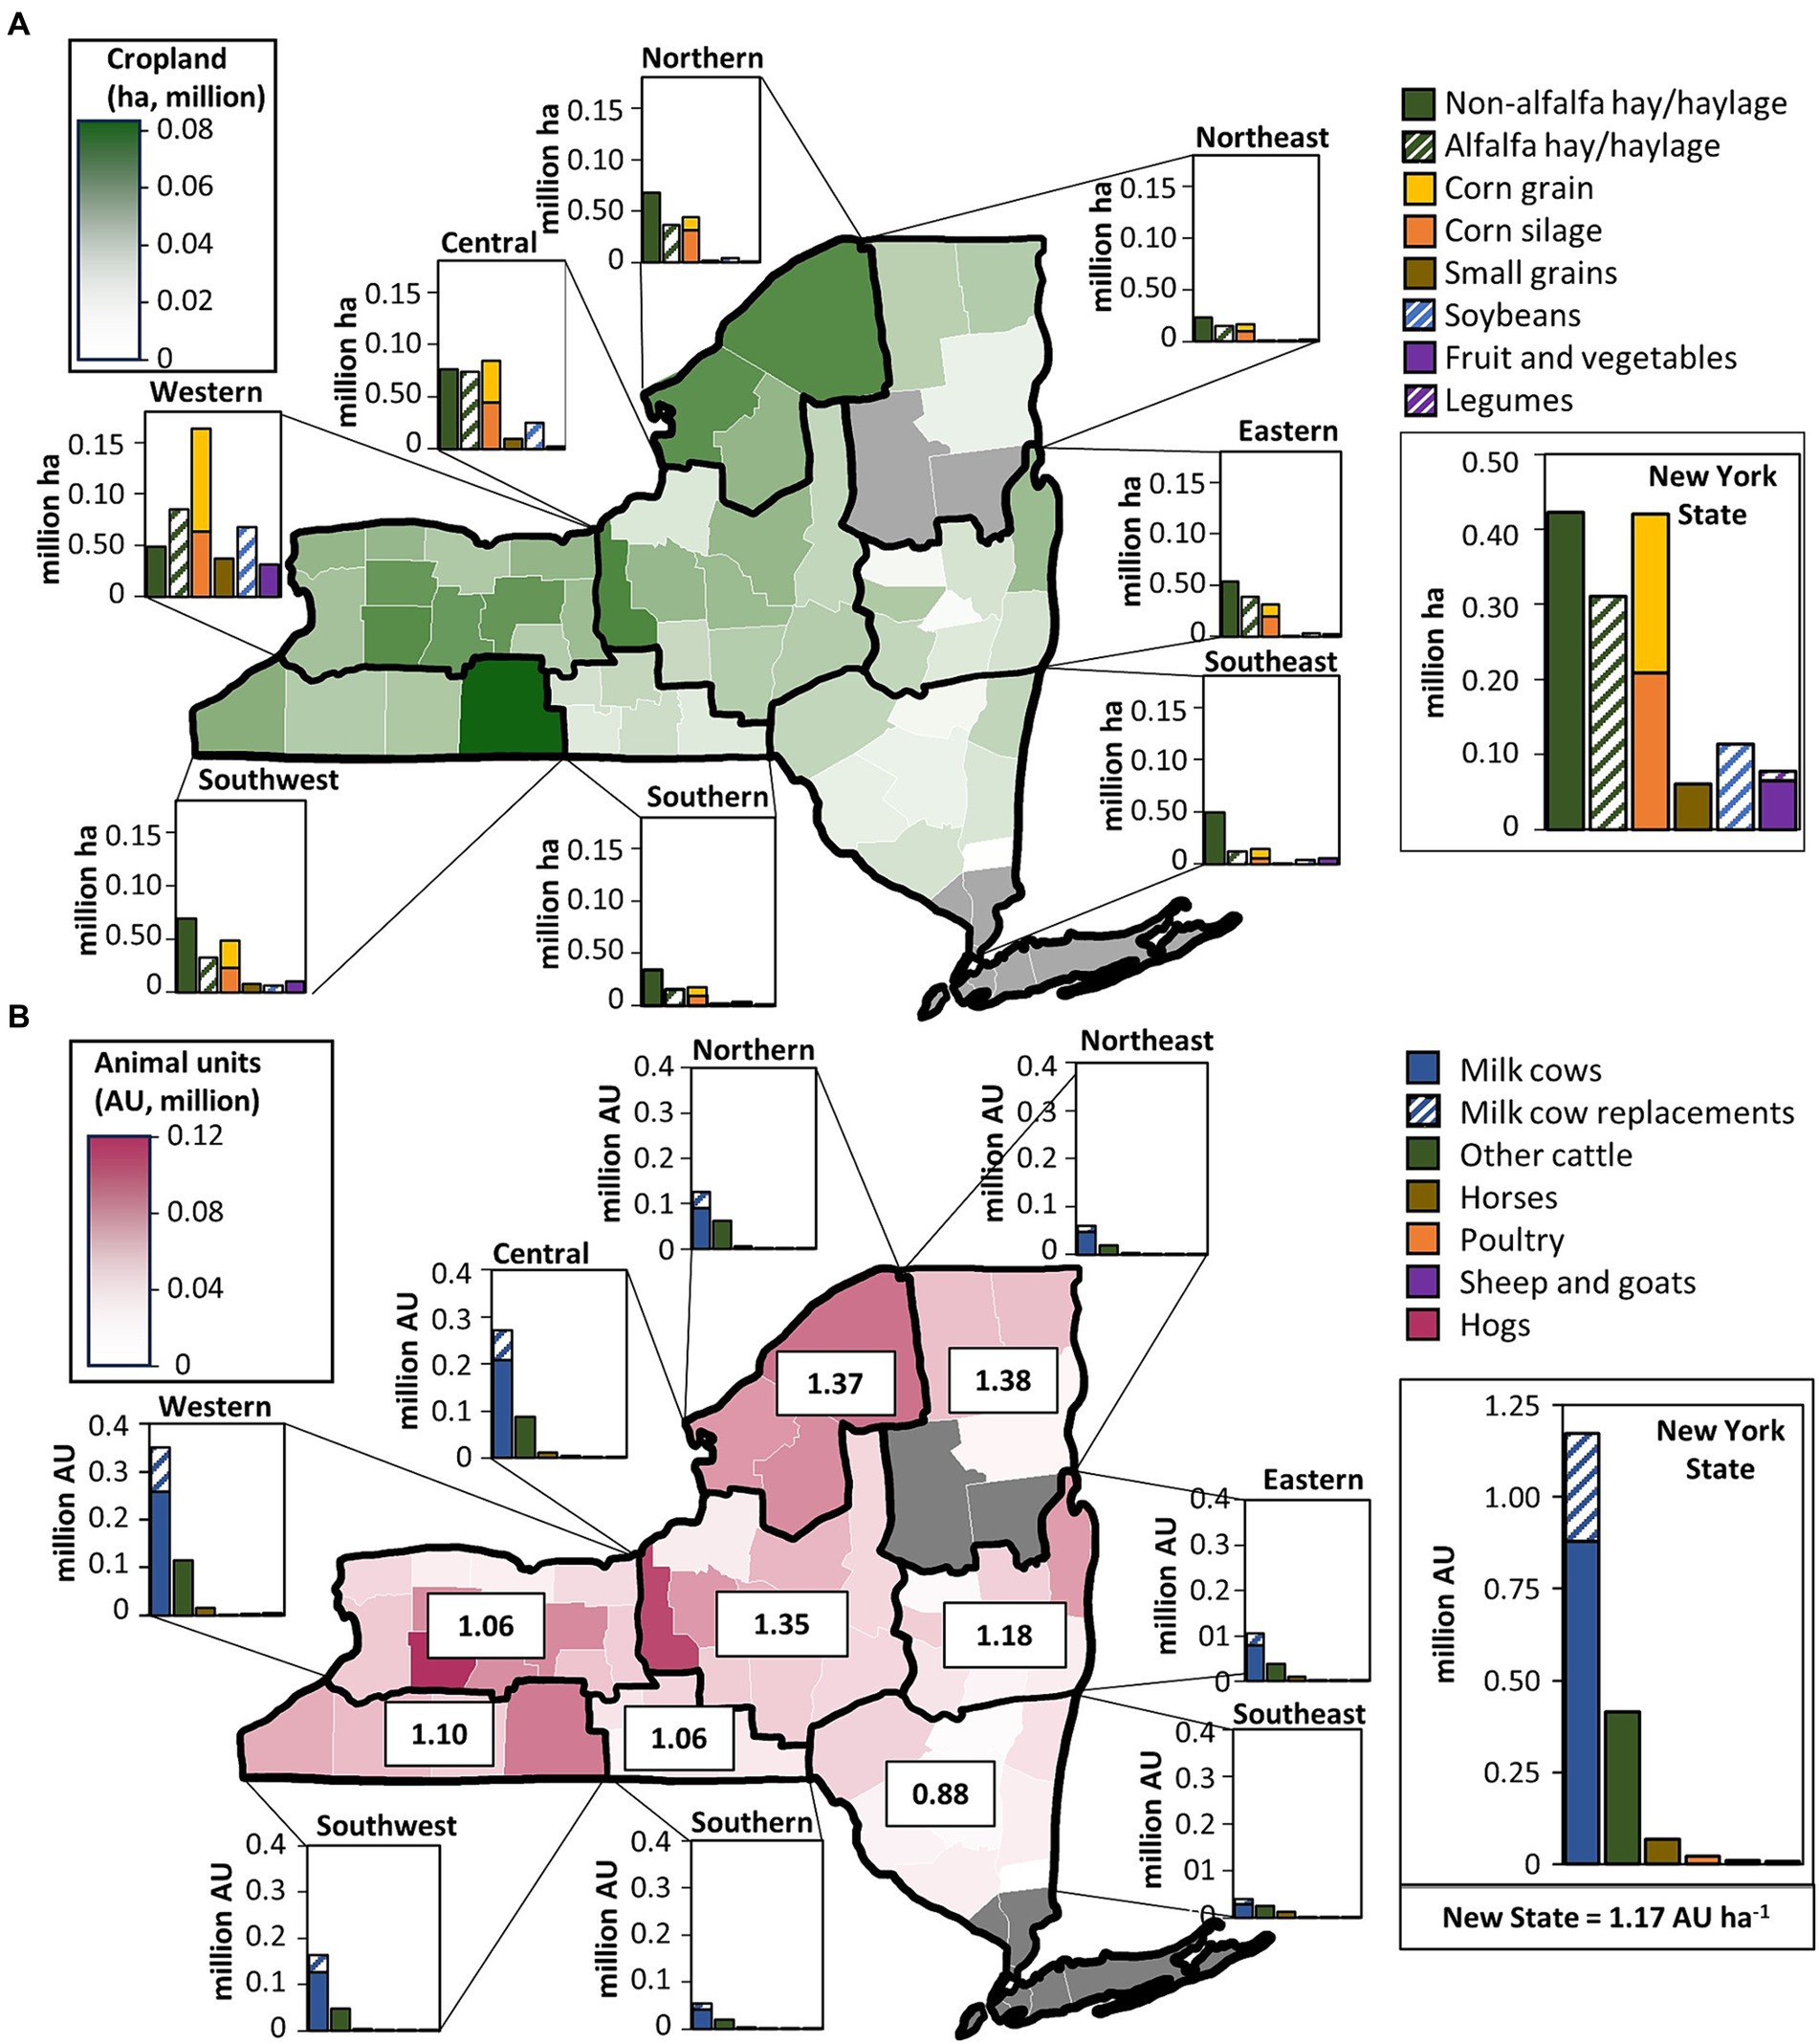
Figure 1. Total harvested cropland by county, and breakdown of the major crops harvested by region (A), and (B) total animal equivalent units (AU; 1 AU = 455 kg live animal weight; SRM, 2017) by county, breakdown of the main livestock types by region, and animal density (AU ha-1), according to the 2017 United States Department of Agriculture Census of Agriculture for New York.
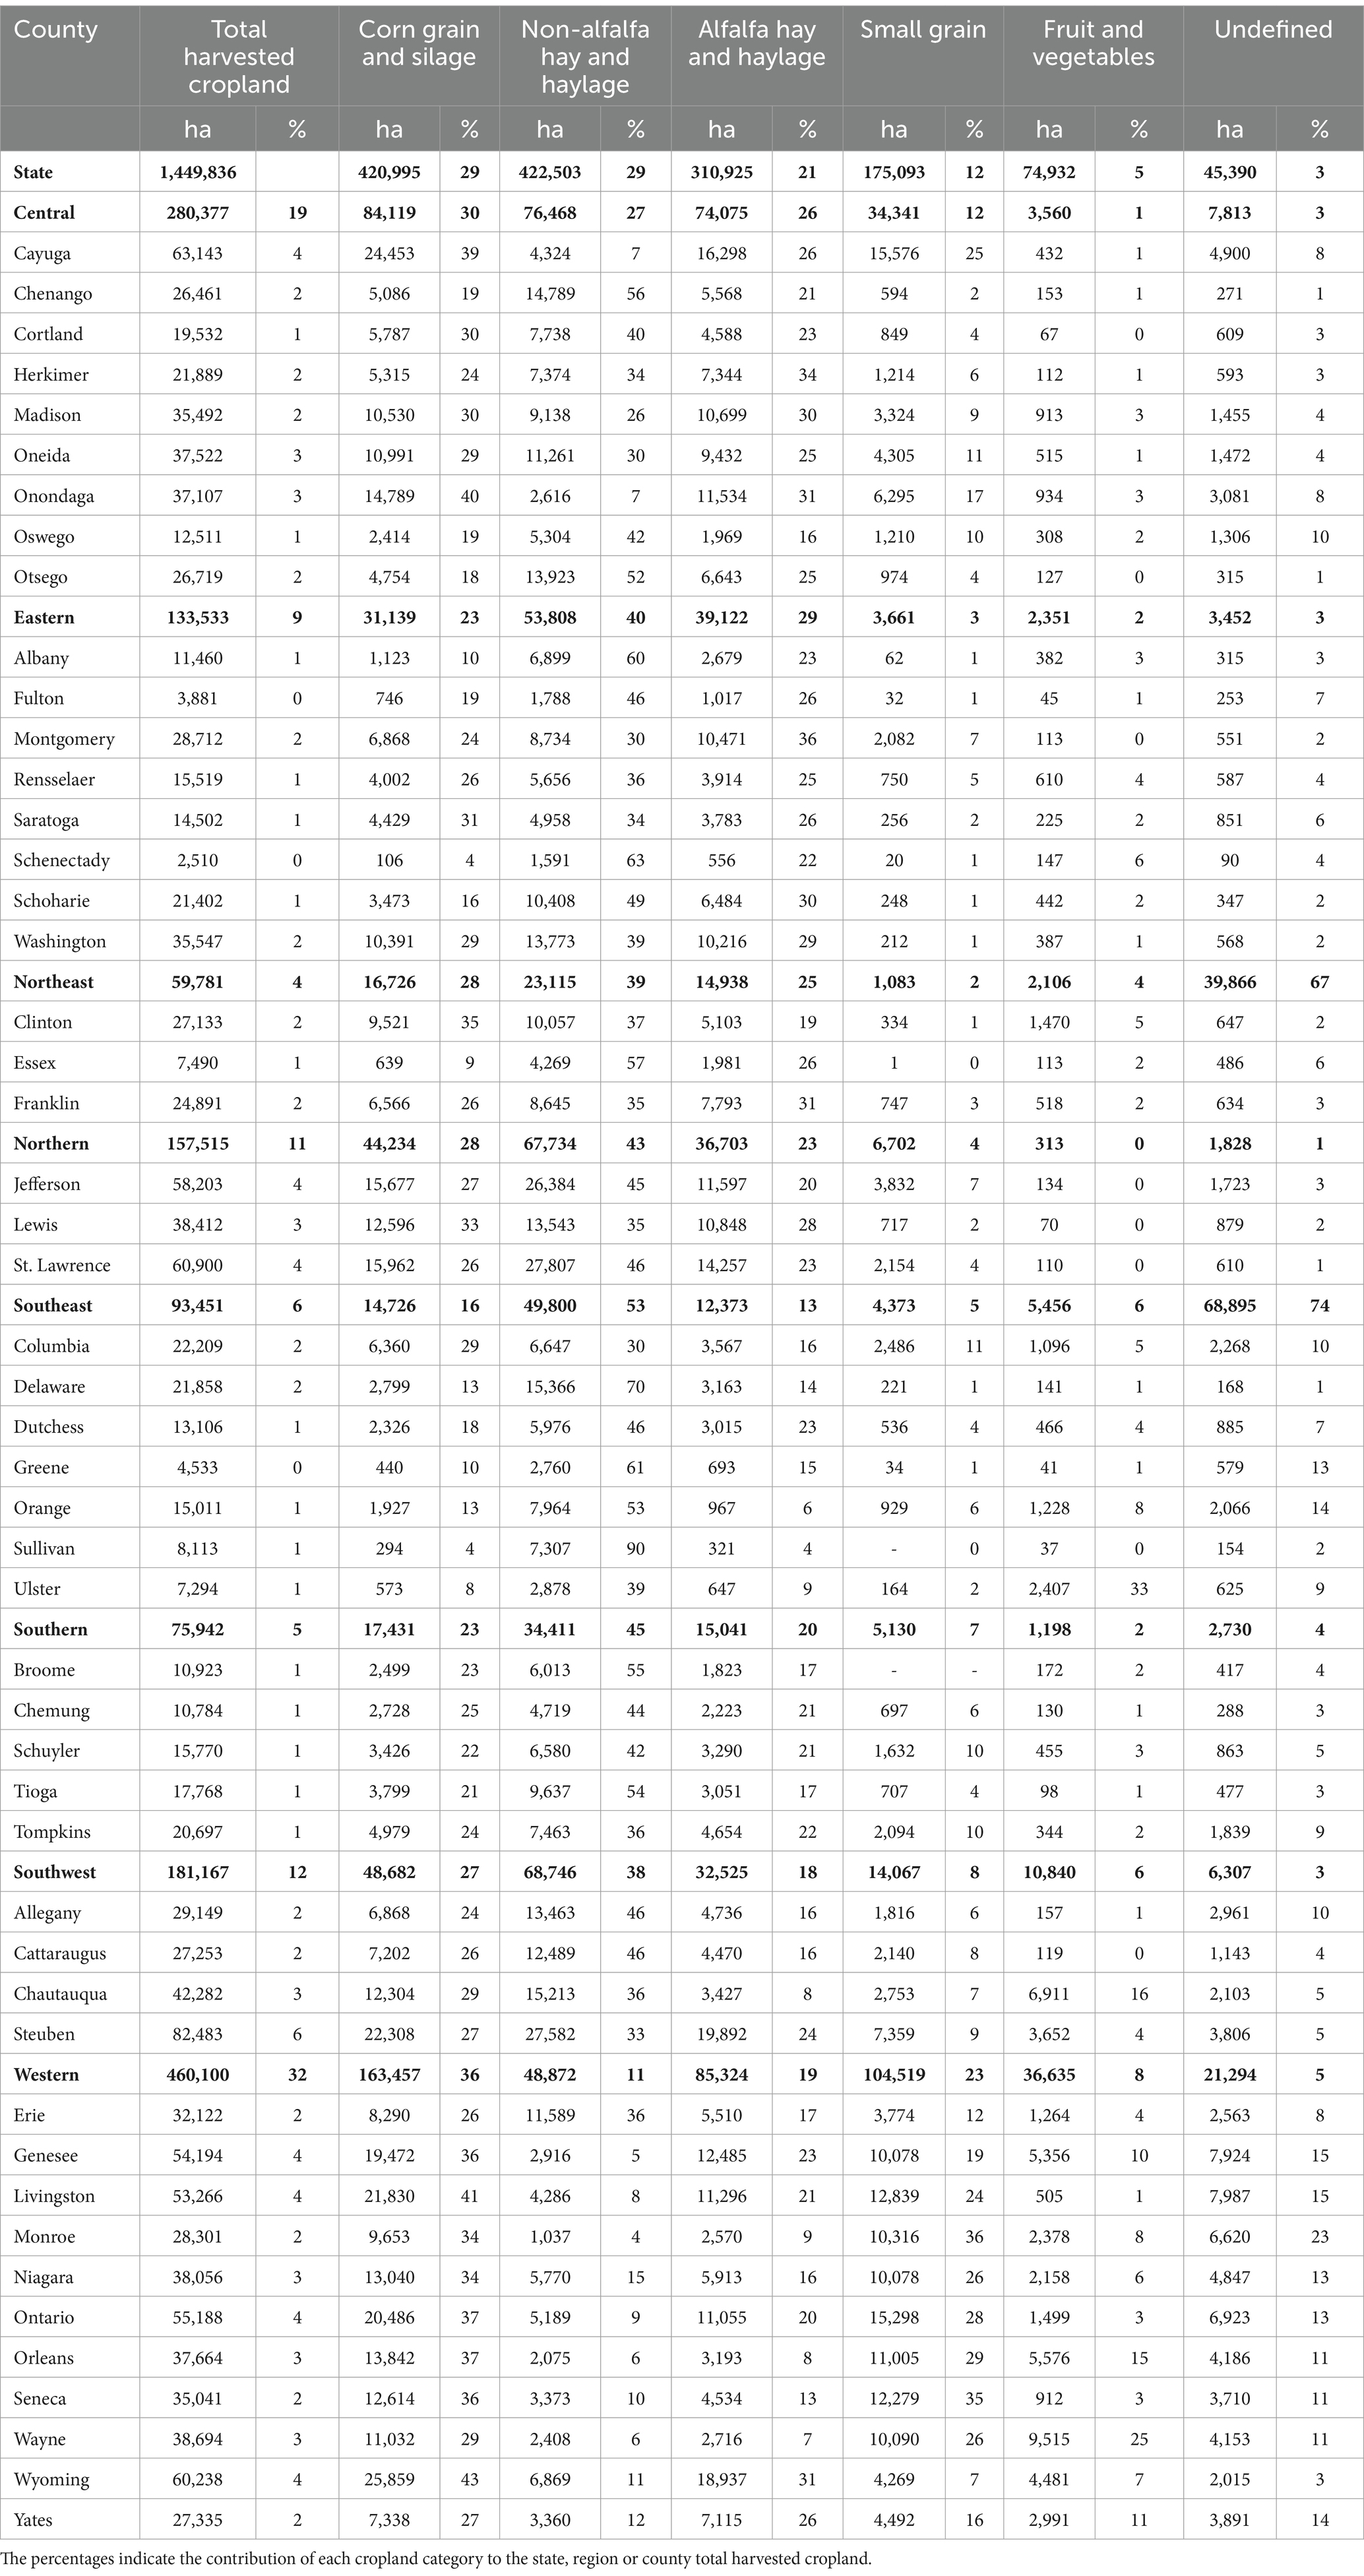
Table 4. The total harvested cropland for the major crops produced in New York at the state, regional and county level according to the 2017 United States Department of Agriculture Census of Agriculture.
The western region had the most harvested cropland in 2017 (almost 0.5 million ha or 1.2 million ac, a third of the total harvested cropland in NY), followed by the central region (almost 0.3 million ha or 0.7 million ac, and 20% of the total harvested cropland in NY) (Figure 1A). In contrast the northeast region had less than 60,000 ha (148,000 ac). The Adirondack Mountain range, within the northeast region, is largely unsuitable and unavailable for agricultural purposes.
Corn (for both grain and silage) was the prominent crop in the western region, while non-alfalfa hay and haylage production accounted for the largest proportion of harvested cropland in all other regions (Table 4). Alfalfa hay and haylage production accounted for at least 25% of cropland harvested in the central, eastern, and northeast regions. In total, 65% of the harvested cropland in NY produced forage, ranging from 86% in the northern region to 43% in the western region, and 30% of the total harvested cropland was for legume production, ranging from 36% in the central region to 17% in southern and southeast regions (Table 5).
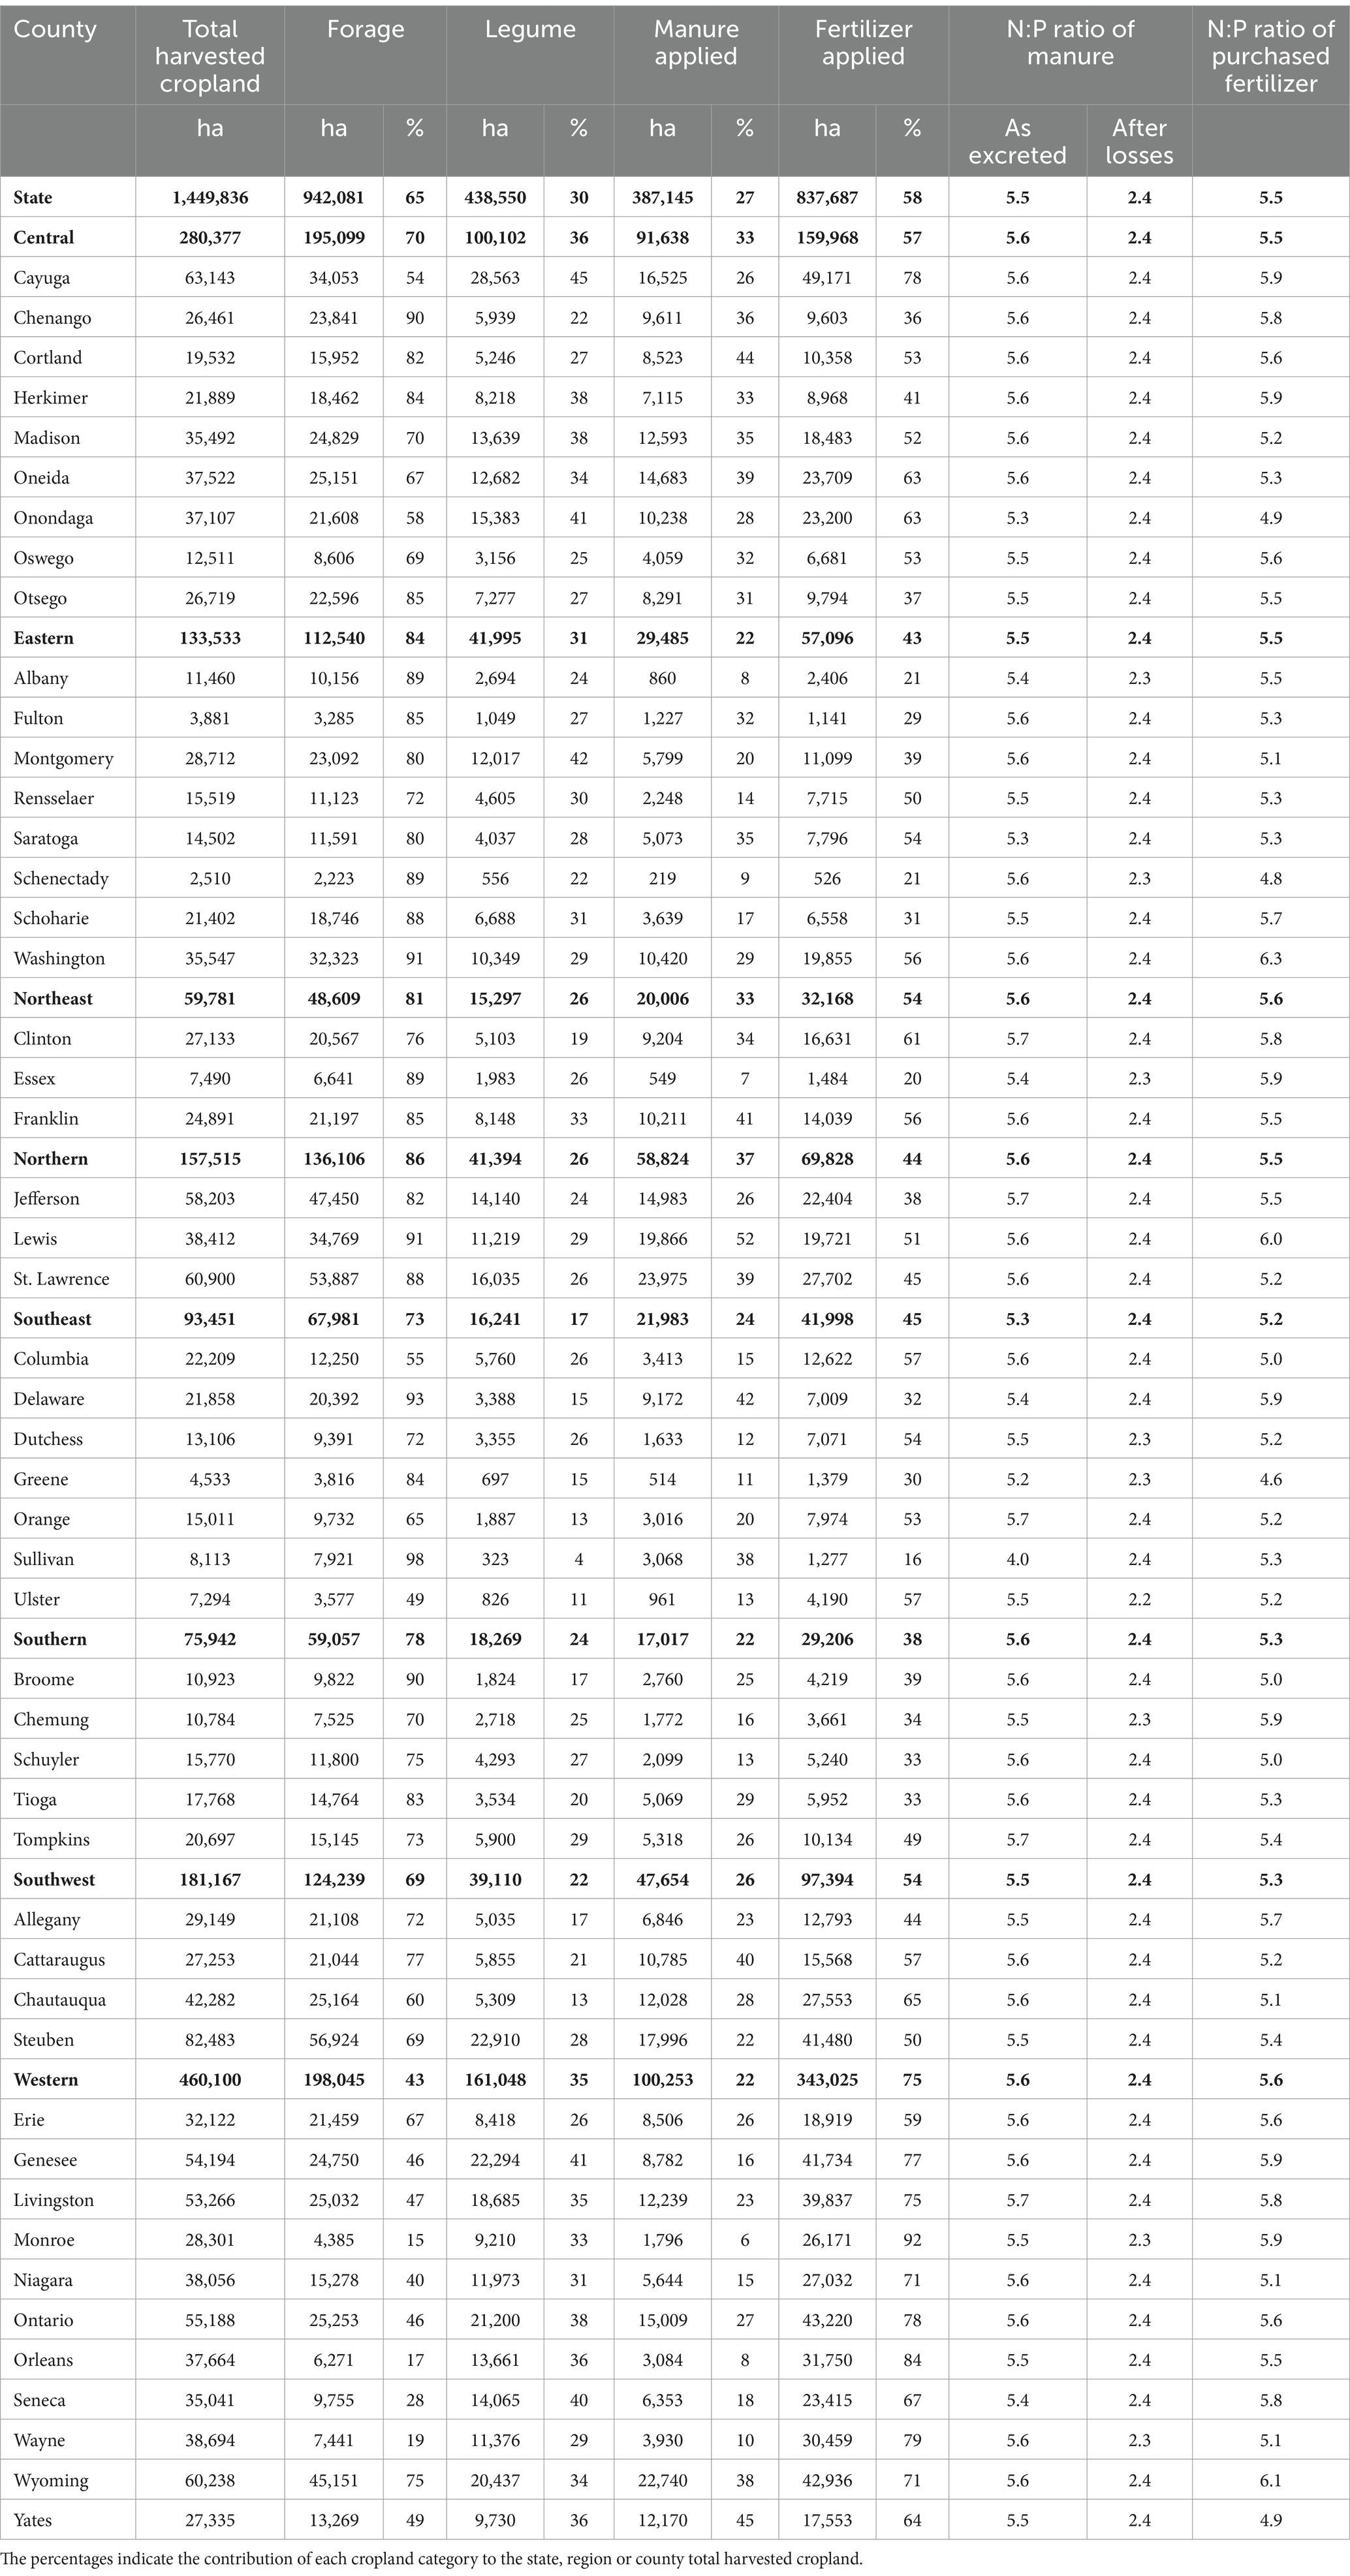
Table 5. The total harvested cropland, forage area, legume area, area receiving manure applications, area receiving purchased fertilizer applications, and the nitrogen (N) to phosphorus (P) ratio of manure as excreted and after losses during storage in New York at the state, regional and county level according to the 2017 United States Department of Agriculture Census of Agriculture.
In total, 58% of the harvested cropland in NY received purchased fertilizer in 2017 and 27% of harvested cropland received manure (Table 5); as some cropland will have received both manure and purchased fertilizer, this means that 16 to 42% of cropland did not receive nutrients in the form of manure or purchased fertilizer. At the state level, the manure to purchased fertilizer ratio was 0.46. Thus, more than double the amount of cropland received purchased fertilizer compared to manure. At the regional level, the manure to purchased fertilizer ratio was highest in the northern region at 0.84, and lowest in the western region at 0.29. At the county level, the highest manure to fertilizer ratio was 2.40 in Sullivan County (southeast region; impacted by poultry), and lowest in Monroe County (western region) at 0.07.
The average animal density in NY was 1.17 AU ha−1 (0.47 AU ac−1) (Figure 1B). At the regional level, animal density ranged from 0.88 AU ha−1 (0.36 AU ac−1) in the southeast region, to 1.38 AU ha−1 (0.56 AU ac−1) in the northeast region. At the county level, animal density ranged from 0.28 AU ha−1 (0.11 AU ac−1) in Orleans County (Western region), to 1.97 AU ha−1 (0.80 AU ac−1) in Wyoming County (also Western region).
Dairy cows accounted for over 50% of the AUs in 2017, and 69% of AUs if their replacements are included (Table 2). Other cattle accounted for an additional 24% of AUs in NY; the remaining 7% of AUs were made up of hogs, poultry, sheep, goats, horses, and ponies. At the regional and county level, the western region had the highest population of dairy cows at almost 260,000 head, and Wyoming County (situated in the Western region) had the highest population at the county level (over 66,000 head).
3.2 Phosphorus balances
The 2017 P balance for NY was 10 kg P ha−1 (9 lb. P ac−1), with 18 kg P ha−1 (16 lb. P ac−1) from livestock manure (before taking into account storage losses), 10 kg P ha−1 (9 lb. P ac−1) from purchased fertilizer, and − 18 kg P ha−1 (−16 lb. P ac−1) from crop removal (Figure 2). Phosphorus balances were highest in the central, northeast, and southeast regions (11 kg P ha−1 in all regions; 9 lb. P ac−1) and lowest in the southern region (6 kg P ha−1; 5 lb. P ac−1) (Table 6). At the county level, balances ranged from −3 kg P ha−1 (−3 lb. P ac−1) in Chemung County (southern region) to 24 kg P ha−1 (21 lb. ac−1) in Saratoga County (eastern region). Chemung County was the sole county with a negative P balance (Figures 2, 3).
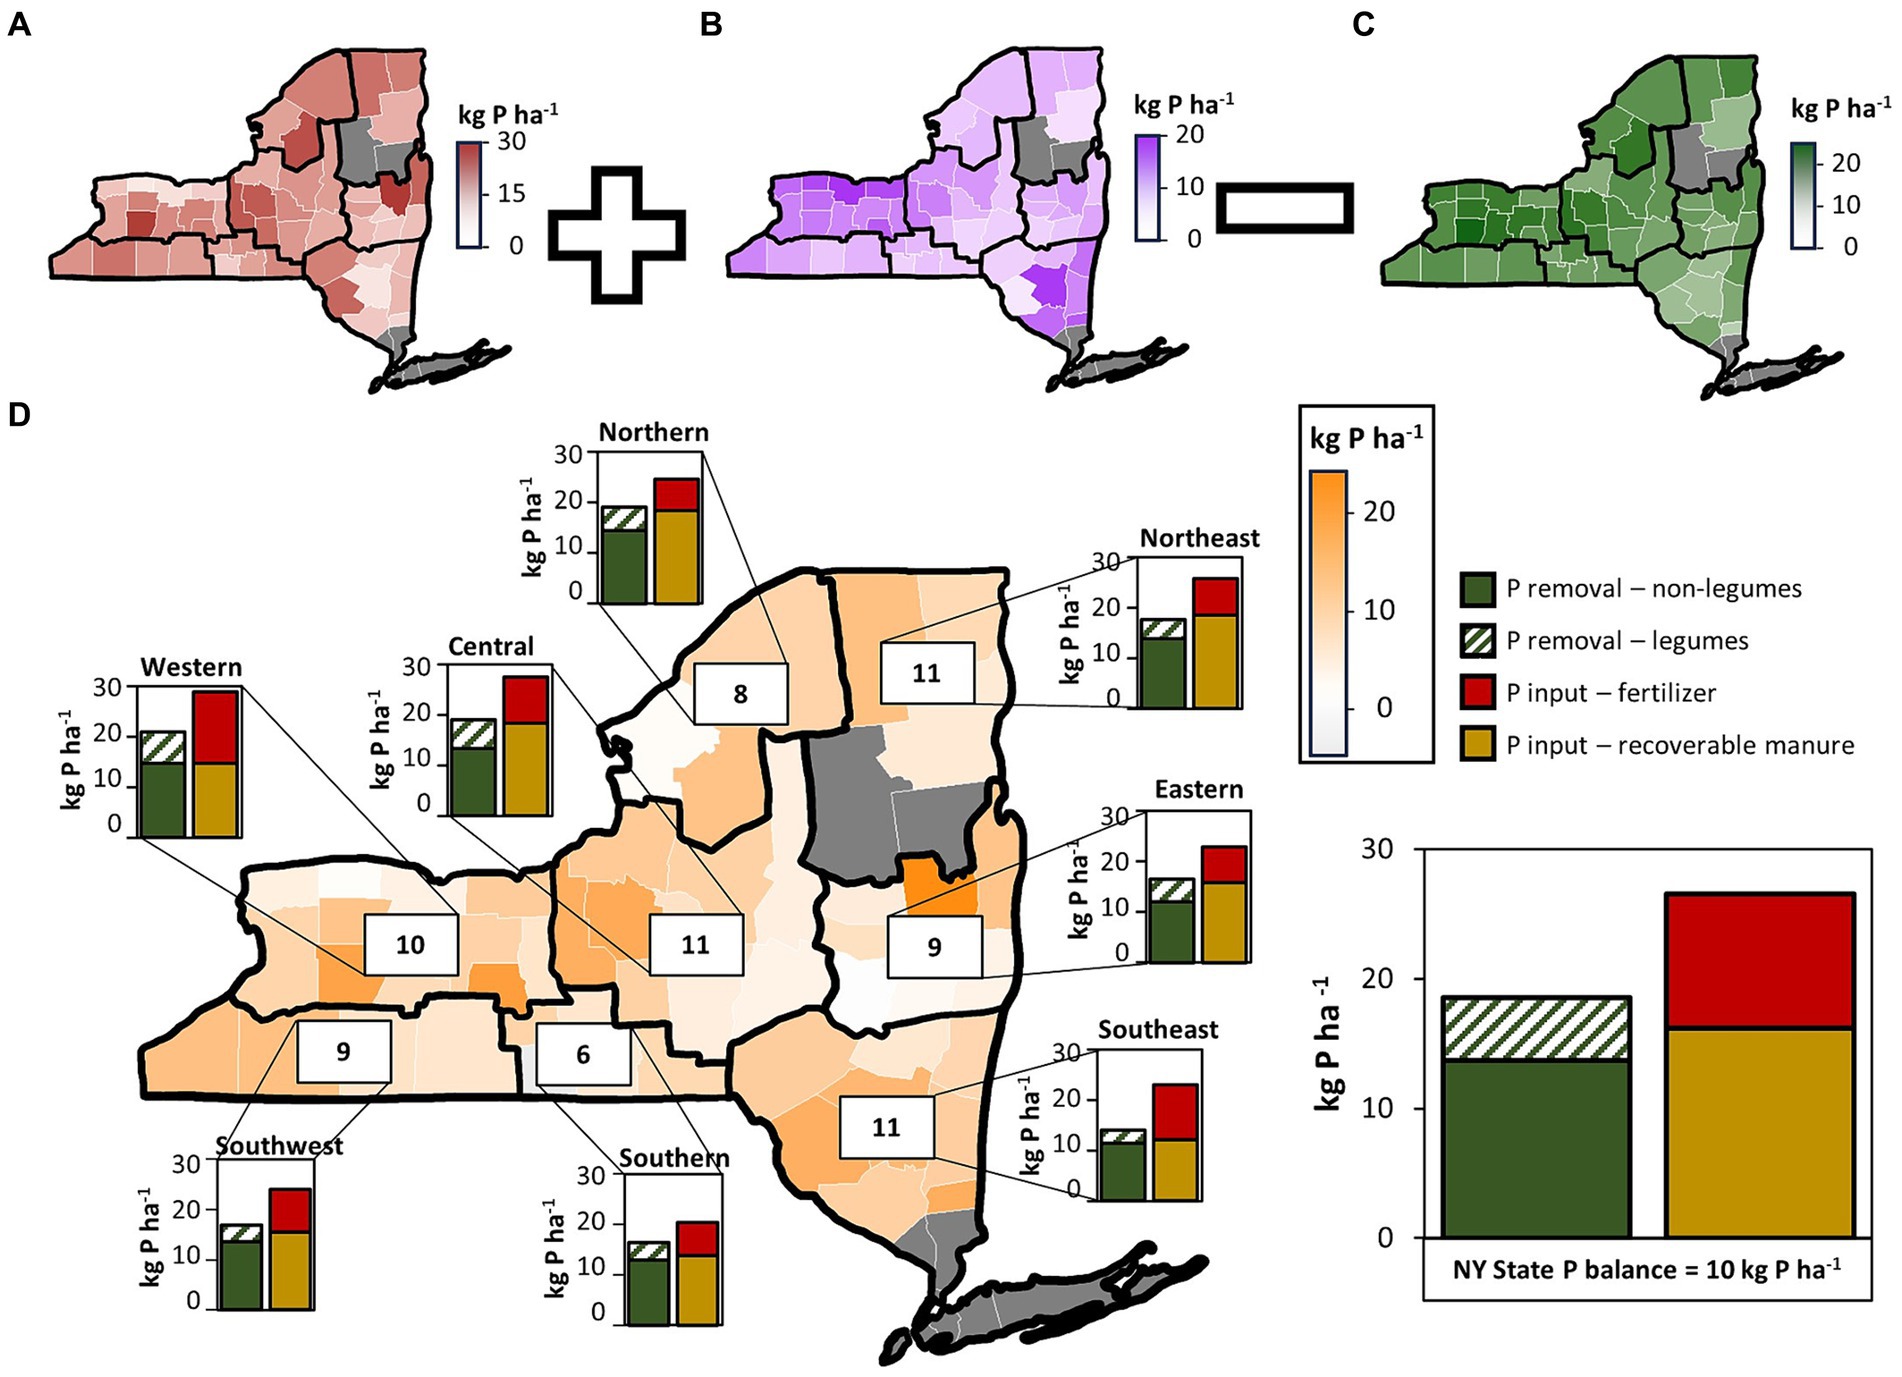
Figure 2. Manure phosphorus (P) (A), purchased fertilizer P (B) and crop removal of P (C) at the New York county level for 2017, and the available manure P, lost manure P, purchased fertilizer P, and crop removal by non-legume and all crops at the regional and state level (D), and the P balance at the county, regional and state level (D). Counties in gray were excluded from the analysis.
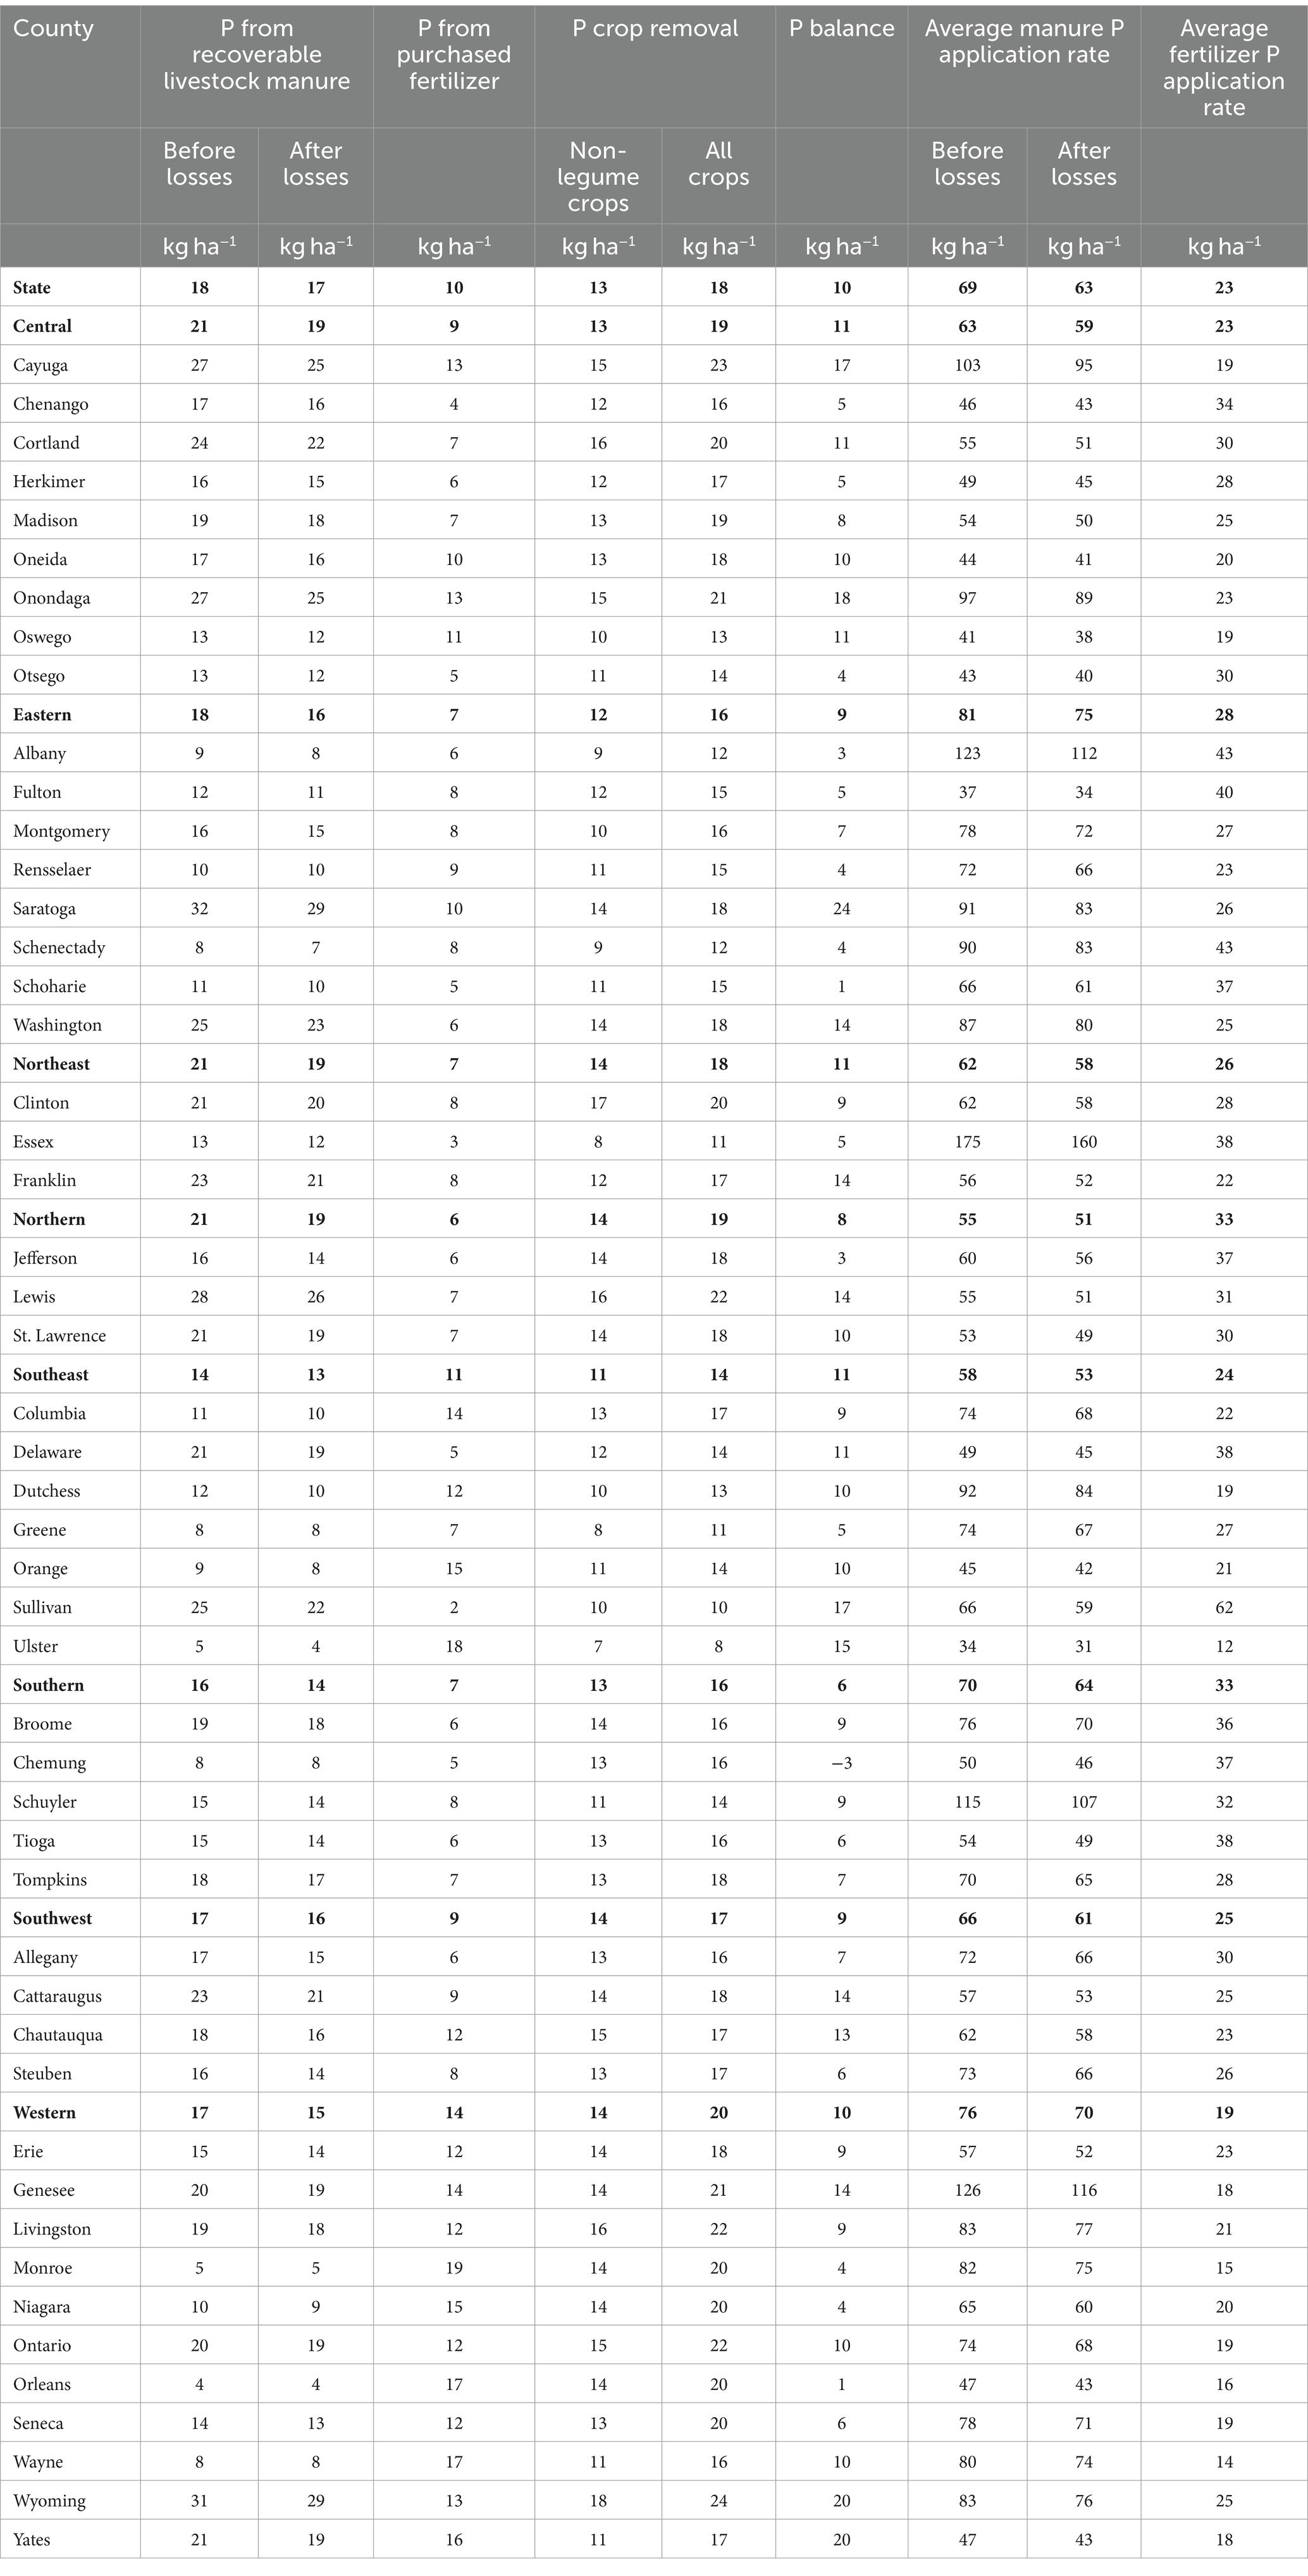
Table 6. The phosphorus (P) inputs, crop P removal, P balance, average manure P application rates and average purchased fertilizer P application rates for harvested cropland in New York at the state, regional and county level.
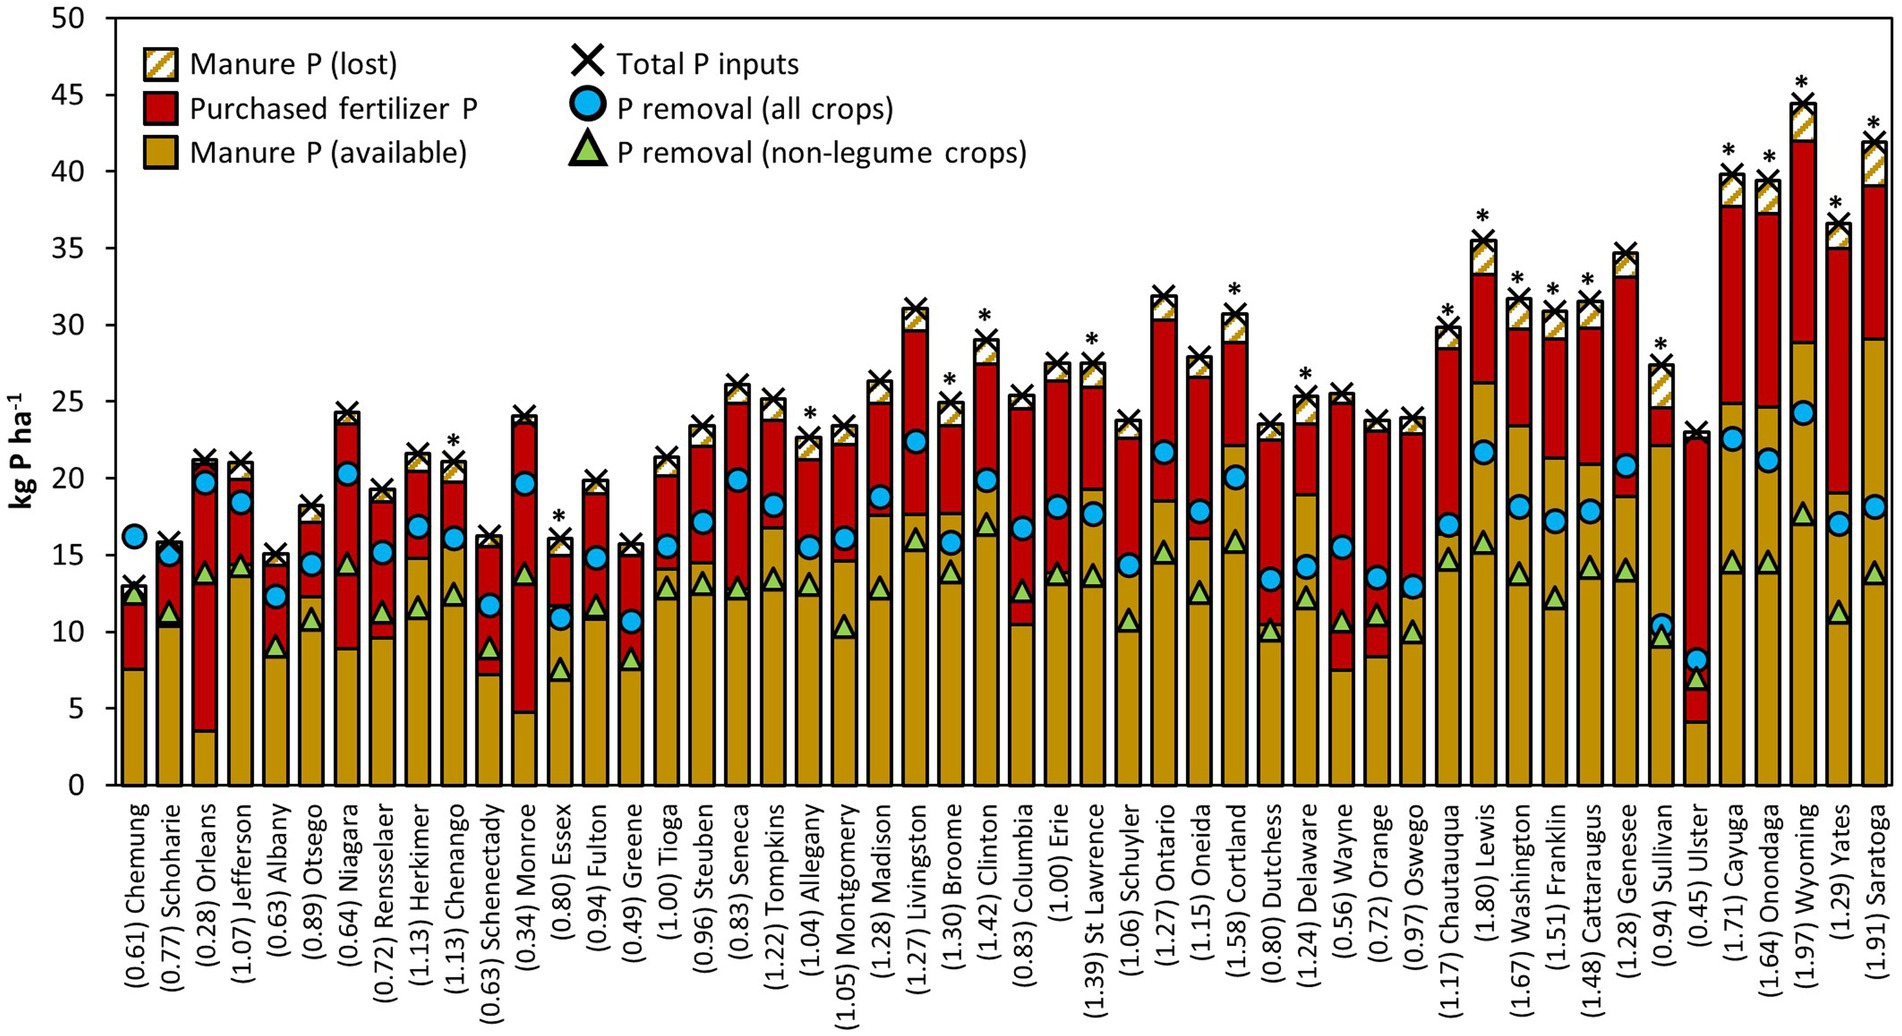
Figure 3. The available manure phosphorus (P), lost manure P, purchased fertilizer P, crop removal by non-legume and all crops or New York counties in 2017. Counties are ordered from lowest P balance (left of figure) to highest P balance (right of figure), where the P balance is equal to the difference between total P inputs and P removal (all crops). The number in parentheses indicates the animal density of the county in animal units (AUs) per ha, where 1 AU = 455 kg live animal weight (SRM, 2017). The asterisks indicate counties where the crop P requirement could be met by manure P alone, provided there are no further nutrient losses during application.
Land to which manure was applied received an average application rate of 63 kg P ha−1 (56 lb. P ac−1) for NY (after storage losses), ranging from 51 kg ha−1 (46 lb. P ac−1) in the northern region to 75 kg ha−1 (66 lb. P ac−1) in the eastern region (Table 6). At the county level, the lowest rate of manure P application was 31 kg P ha−1 (27 lb. P ac−1) in Ulster County (southeast region) and highest in Essex County (northeast region) at 160 kg P ha−1 (143 lb. P ac−1). As noted among study restrictions, these results assume all manure was applied in the county or region it was produced in.
Land that received applications of purchased fertilizer received it at a rate of 23 kg P ha−1 (21 lb. P ac−1) for NY as a whole, ranging from 19 kg P ha−1 (17 lb. P ac−1) in the western region, to 33 kg P ha−1 (29 lb. P ac−1) in the northern and southern regions (Table 6). At the county level, Ulster County (southeast region) had the lowest purchased fertilizer rate at 12 kg P ha−1 (11 lb. P ac−1), and Albany County and Schenectady County (both eastern region) had the highest at 43 kg P ha−1 (38 lb. P ac−1).
3.3 Nitrogen balances
The 2017 N balance for NY was between 39 kg N ha-1 (35 lb. N ac−1), assuming manure was applied to all cropland, and 95 kg N ha−1 (85 lb. N ac−1), when it was assumed that only non-legume cropland received manure (Figure 4). Both scenarios assume no losses of N through volatilization and nitrification during application and that all N in manure is available. For NY, 101 kg N ha−1 (90 lb. N ac−1) was from manure (before storage and land application losses), 57 kg N ha−1 (51 lb. N ac−1) was from purchased fertilizer versus −128 kg N ha−1 (−114 lb. N ac−1) from crop removal, of which −75 kg N ha−1 (−67 lb. N ac−1) is from non-legume crops (Table 7). Potentially, 9.2 kg ha−1 (8.2 lb. ac−1) could be added through atmospheric deposition and 56 kg N ha−1 (50 lb. N ac−1) through N fixation by legumes, with legume crops removing −53 kg N ha−1 (−47 lb. N ac−1).
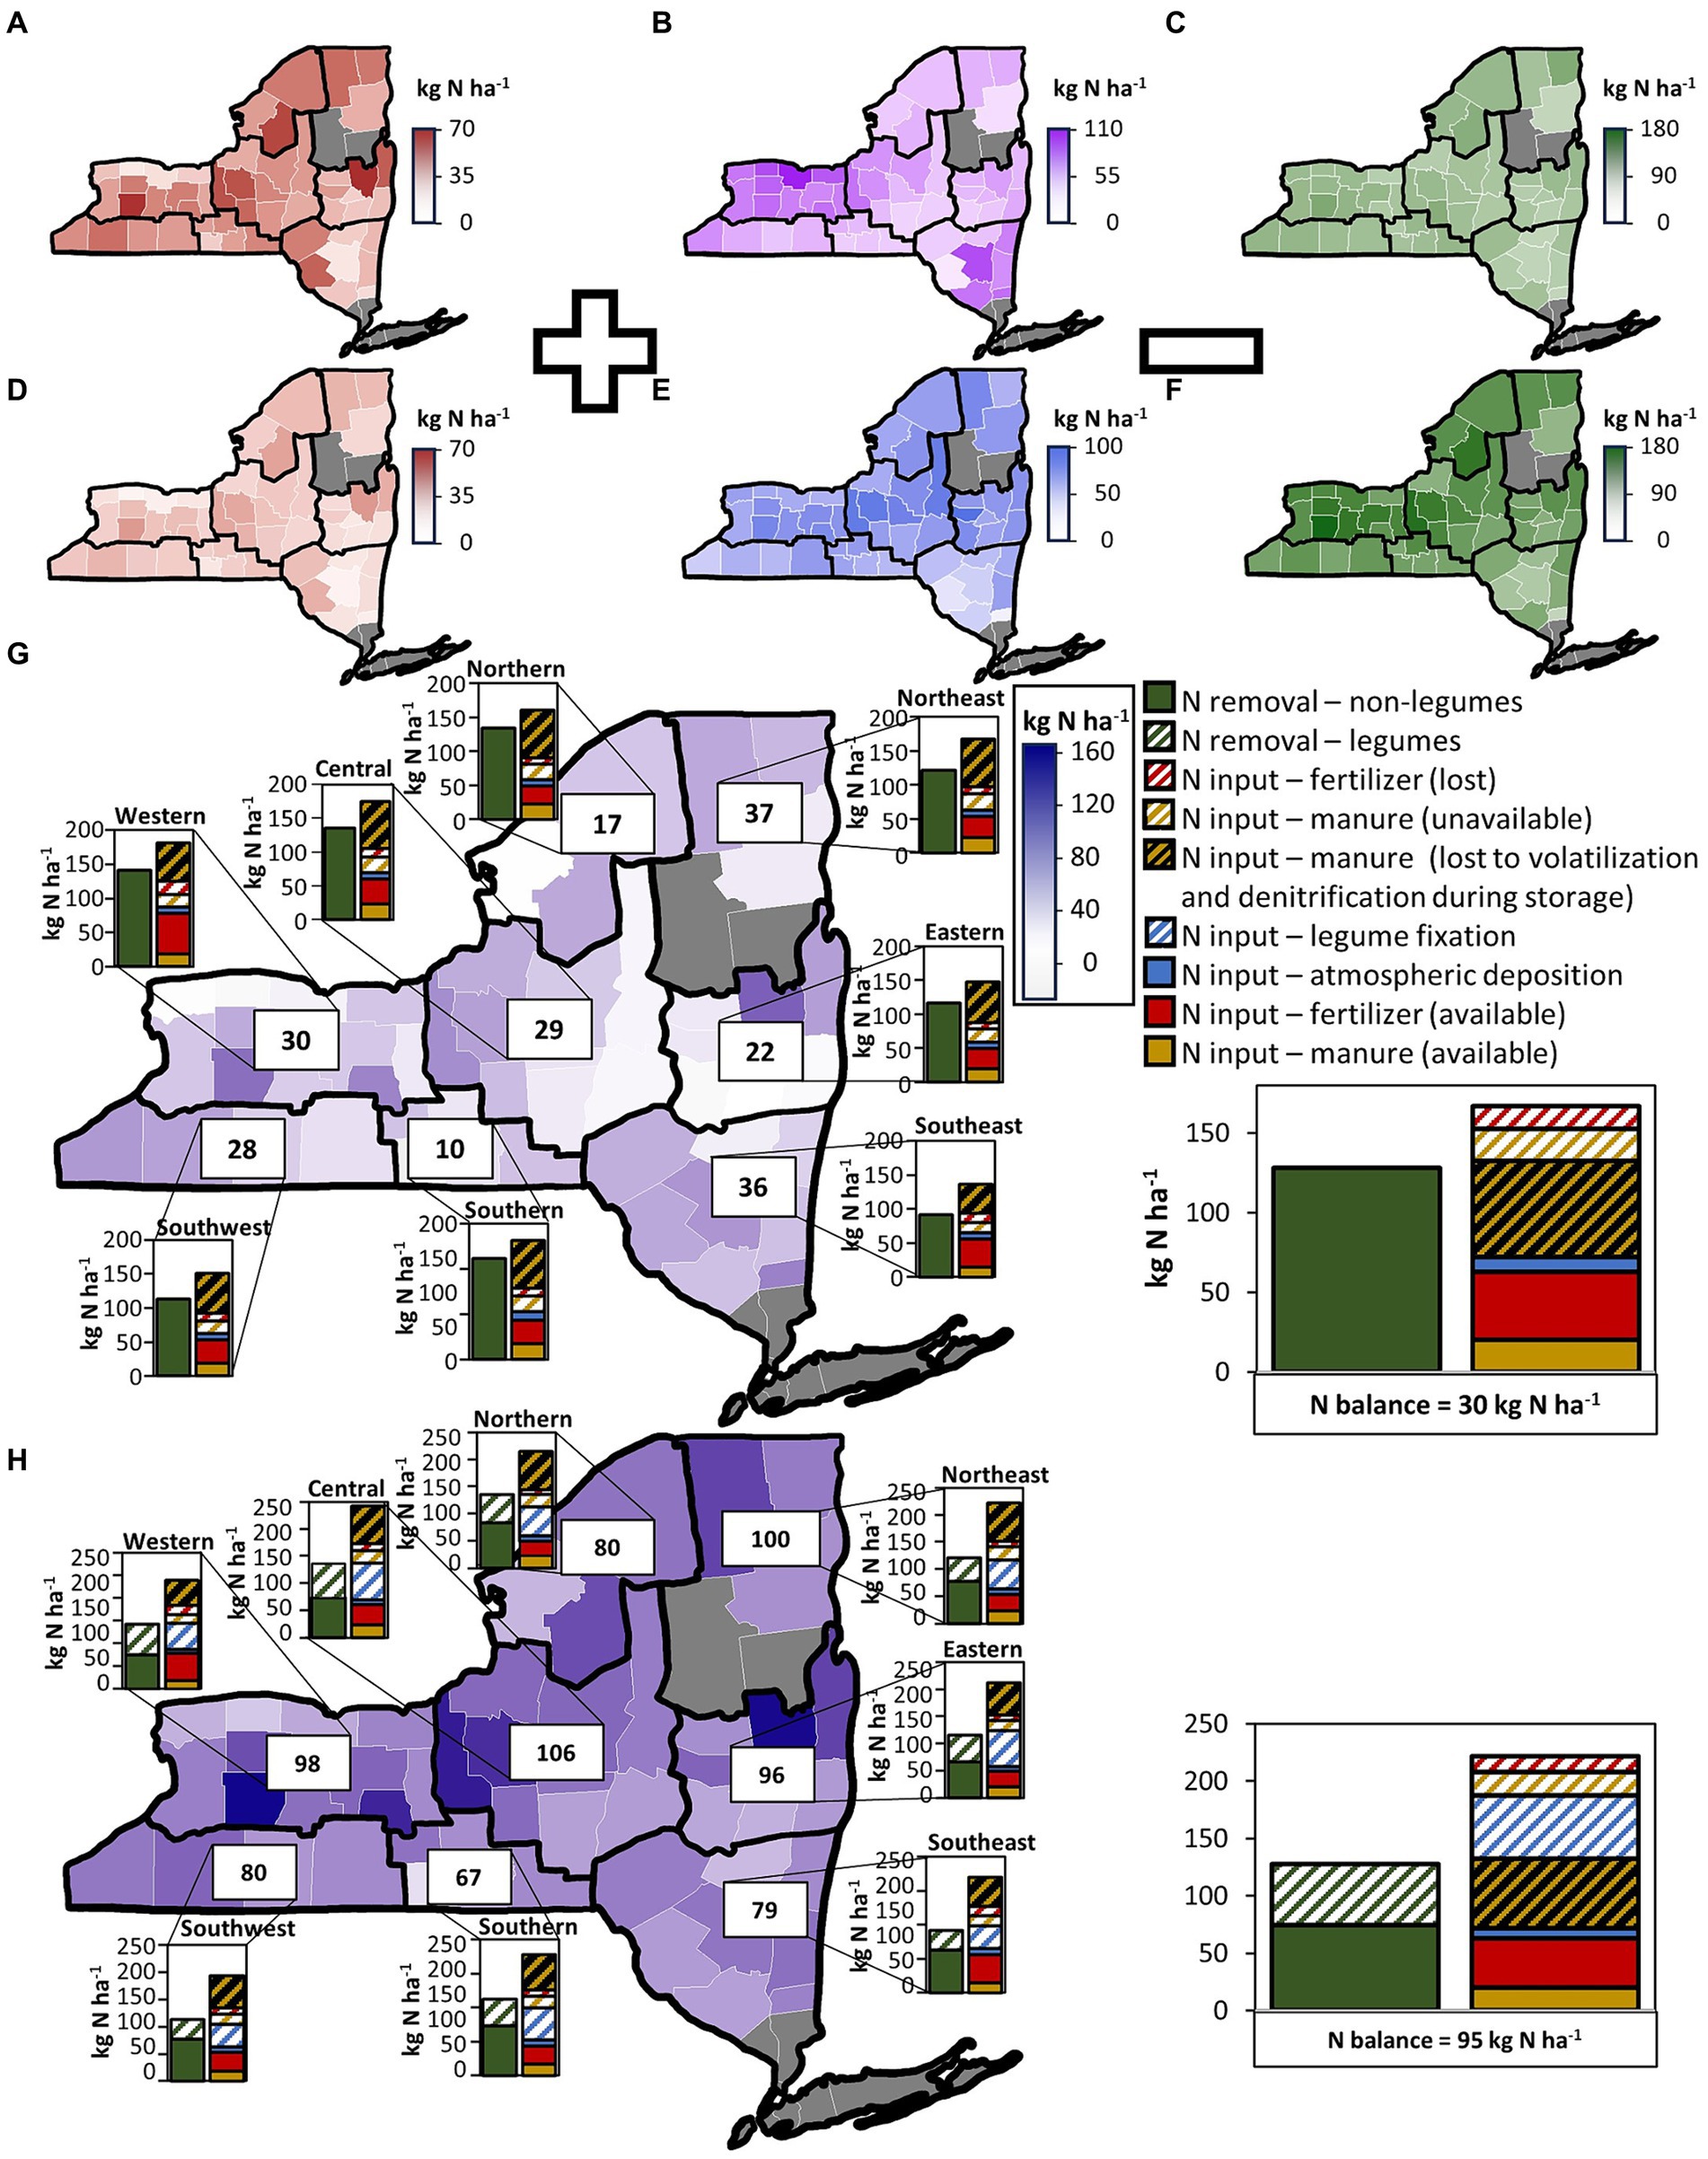
Figure 4. Manure nitrogen (N; total) (A); manure N available (B); purchased fertilizer N (C); atmospheric deposition and legume fixation of N (D); crop removal of N by non-legumes (E) and crop removal by all crops (F) by county for New York (2017) and the balance by county, and breakdown of the inputs and crop uptake of N by region, and for New York State (2017) for manure and purchased N applied to all cropland (G) and non-legume cropland only (H), which assumes that in (G) no legume fixation of N occurs, and in (H), all legume cropland receives N requirements through fixation. Counties in gray were excluded from the analysis.
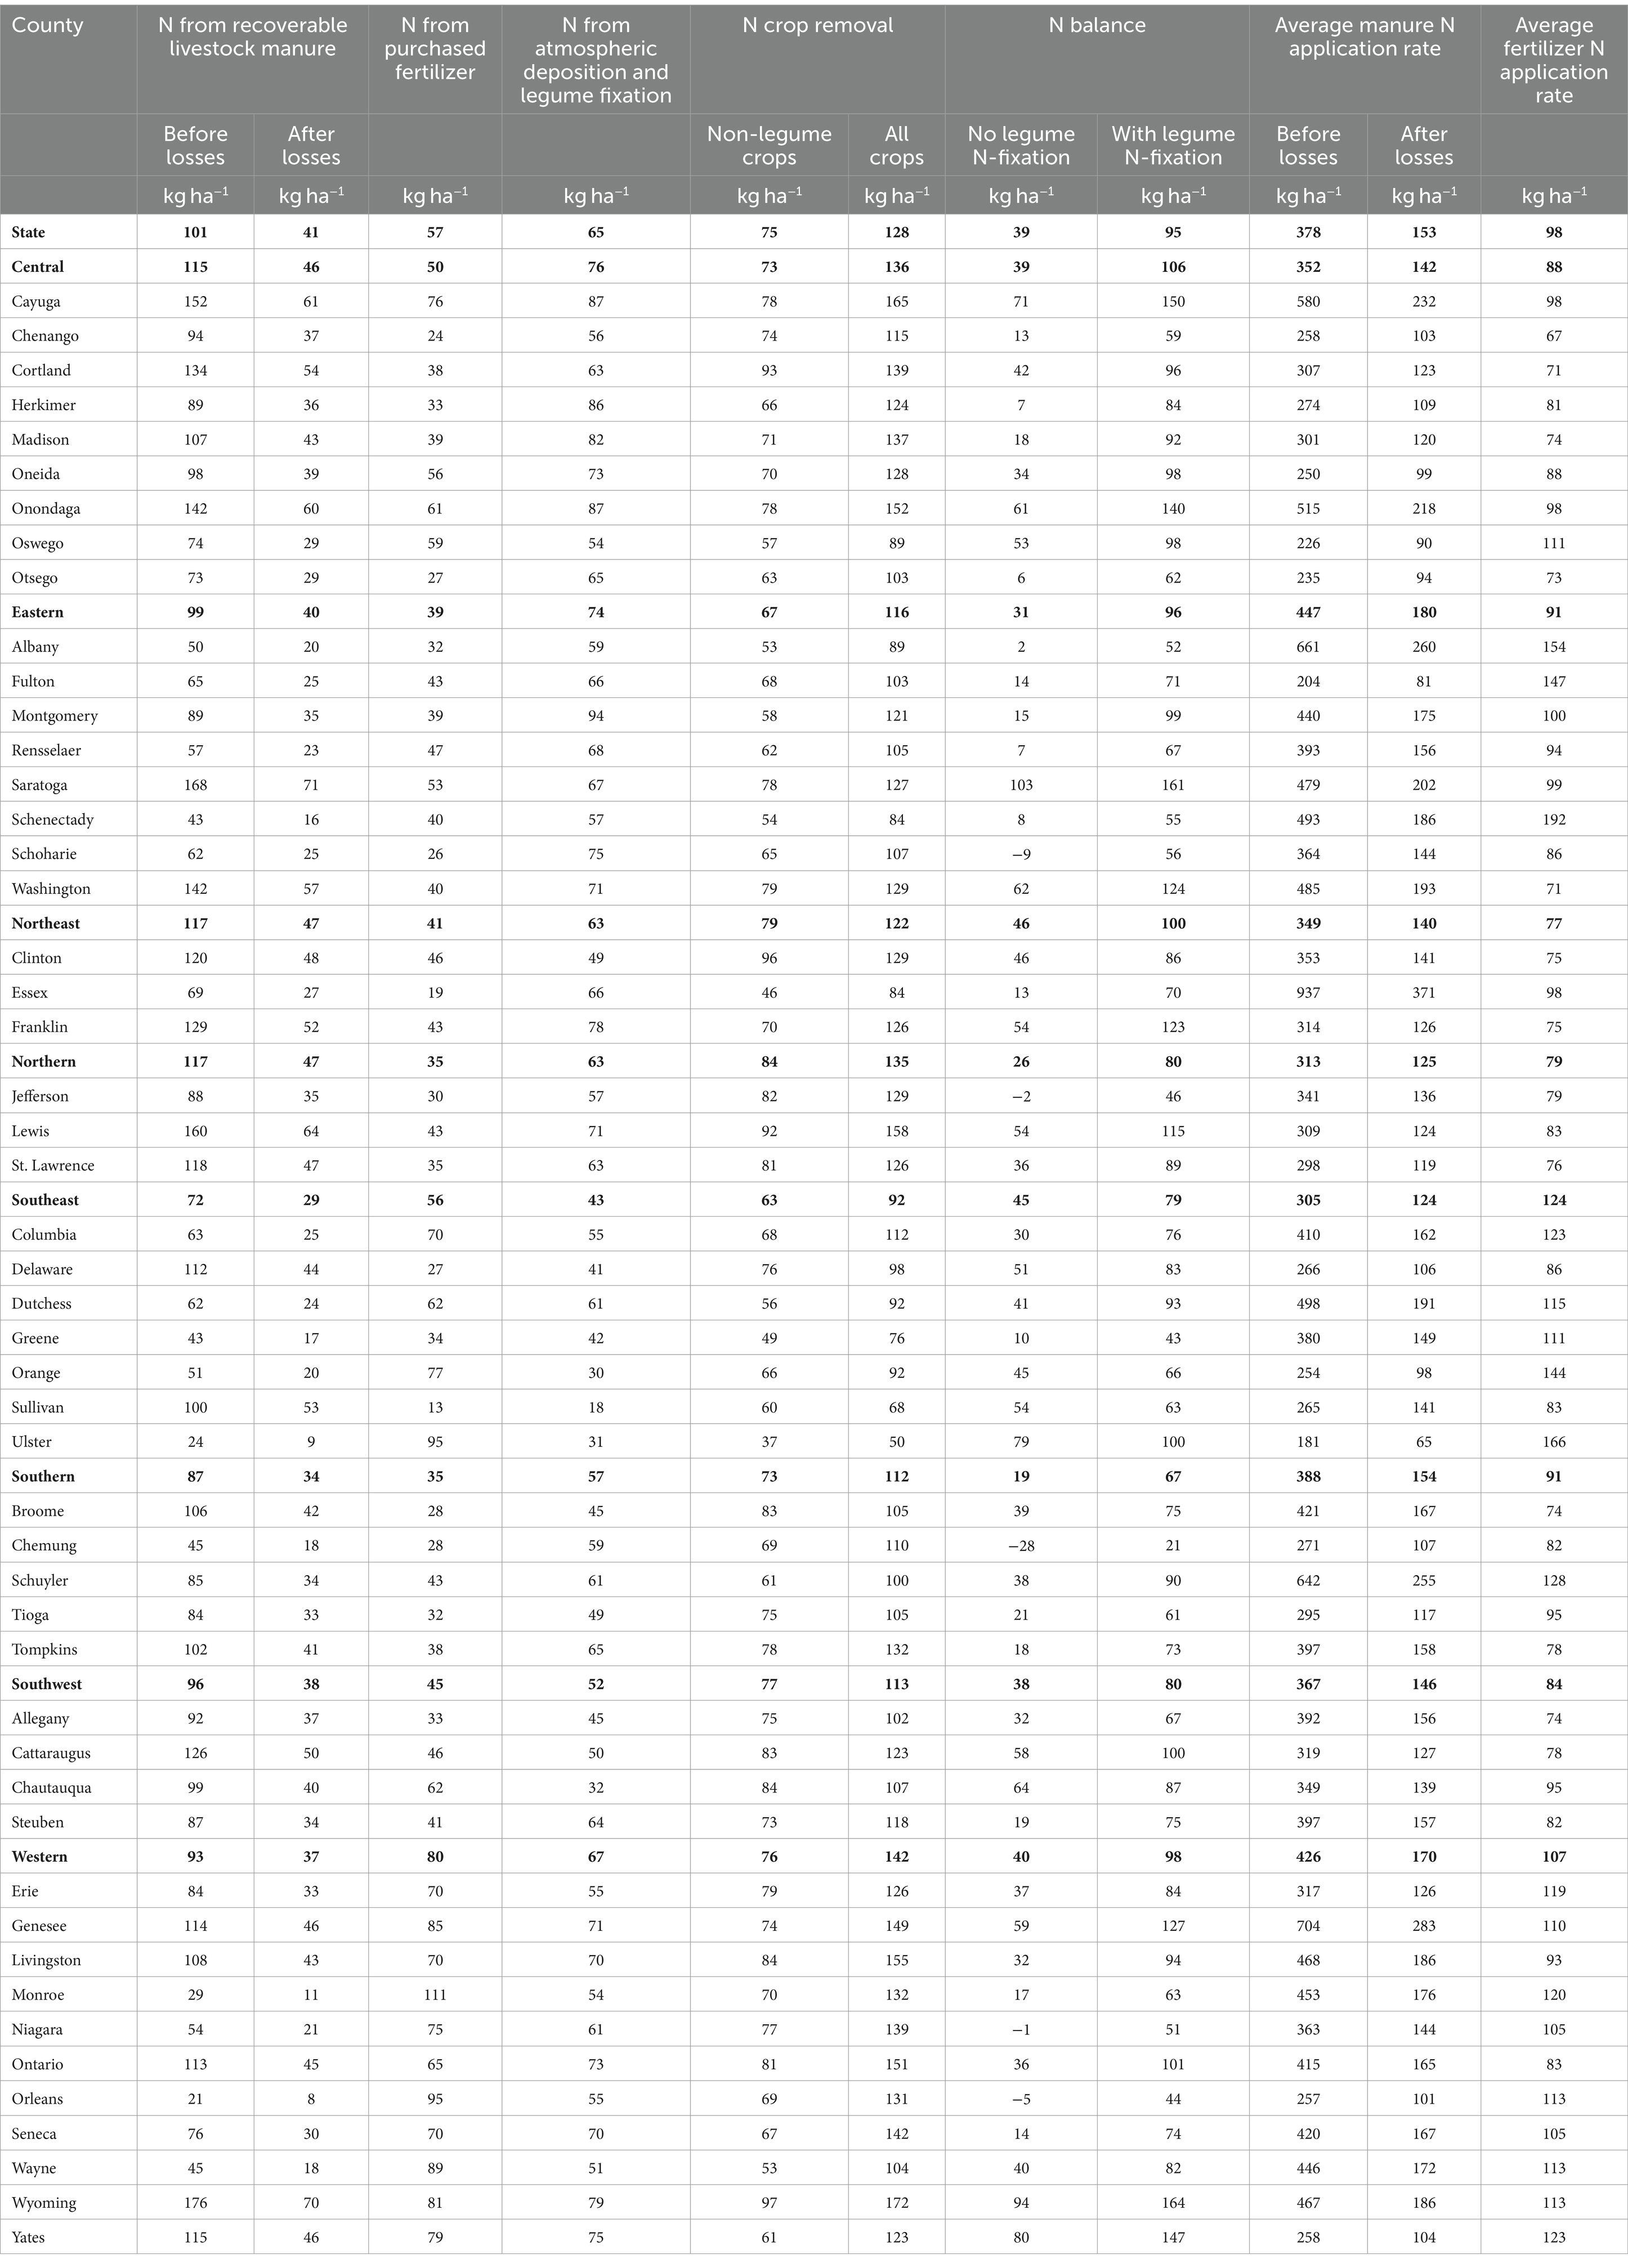
Table 7. The nitrogen (N) inputs, crop N removal, N balance, average manure N application rates and average purchased fertilizer N application rates for harvested cropland in New York at the state, regional and county level.
If it is assumed that none of the legume cropland received manure or purchased N, the highest N balance at the regional level was in the central region (106 kg N ha−1; 94 lb. N ac−1) and the lowest in the southern region (67 kg N ha−1; 60 lb. N ac−1) (Table 7). In a scenario where all cropland receives manure or purchased N fertilizer, the highest balance was in the northeast region (46 kg N ha−1; 41 lb. N ac−1), and the lowest was in the southern region (19 kg N ha−1; 17 lb. N ac−1).
At the county level, the highest N balance for the scenario where manure and purchased fertilizer N was applied only to non-legume cropland ranged from 21 kg N ha−1 (19 lb. N ac−1) in Chemung County (southern region) to 164 kg N ha−1 (146 lb. N ac−1) in Wyoming County (western region; Figures 4, 5). In the scenario where manure and purchased fertilizer was applied to all cropland (legume and non-legume) and N fixation was not accounted for, the lowest balance was still in Chemung County (−28 kg N ha−1; −25 lb. N ac−1, southern region), and the highest N balance was in Saratoga County (103 kg N ha−1; 92 lb. N ac−1, eastern region; Figures 4, 5).
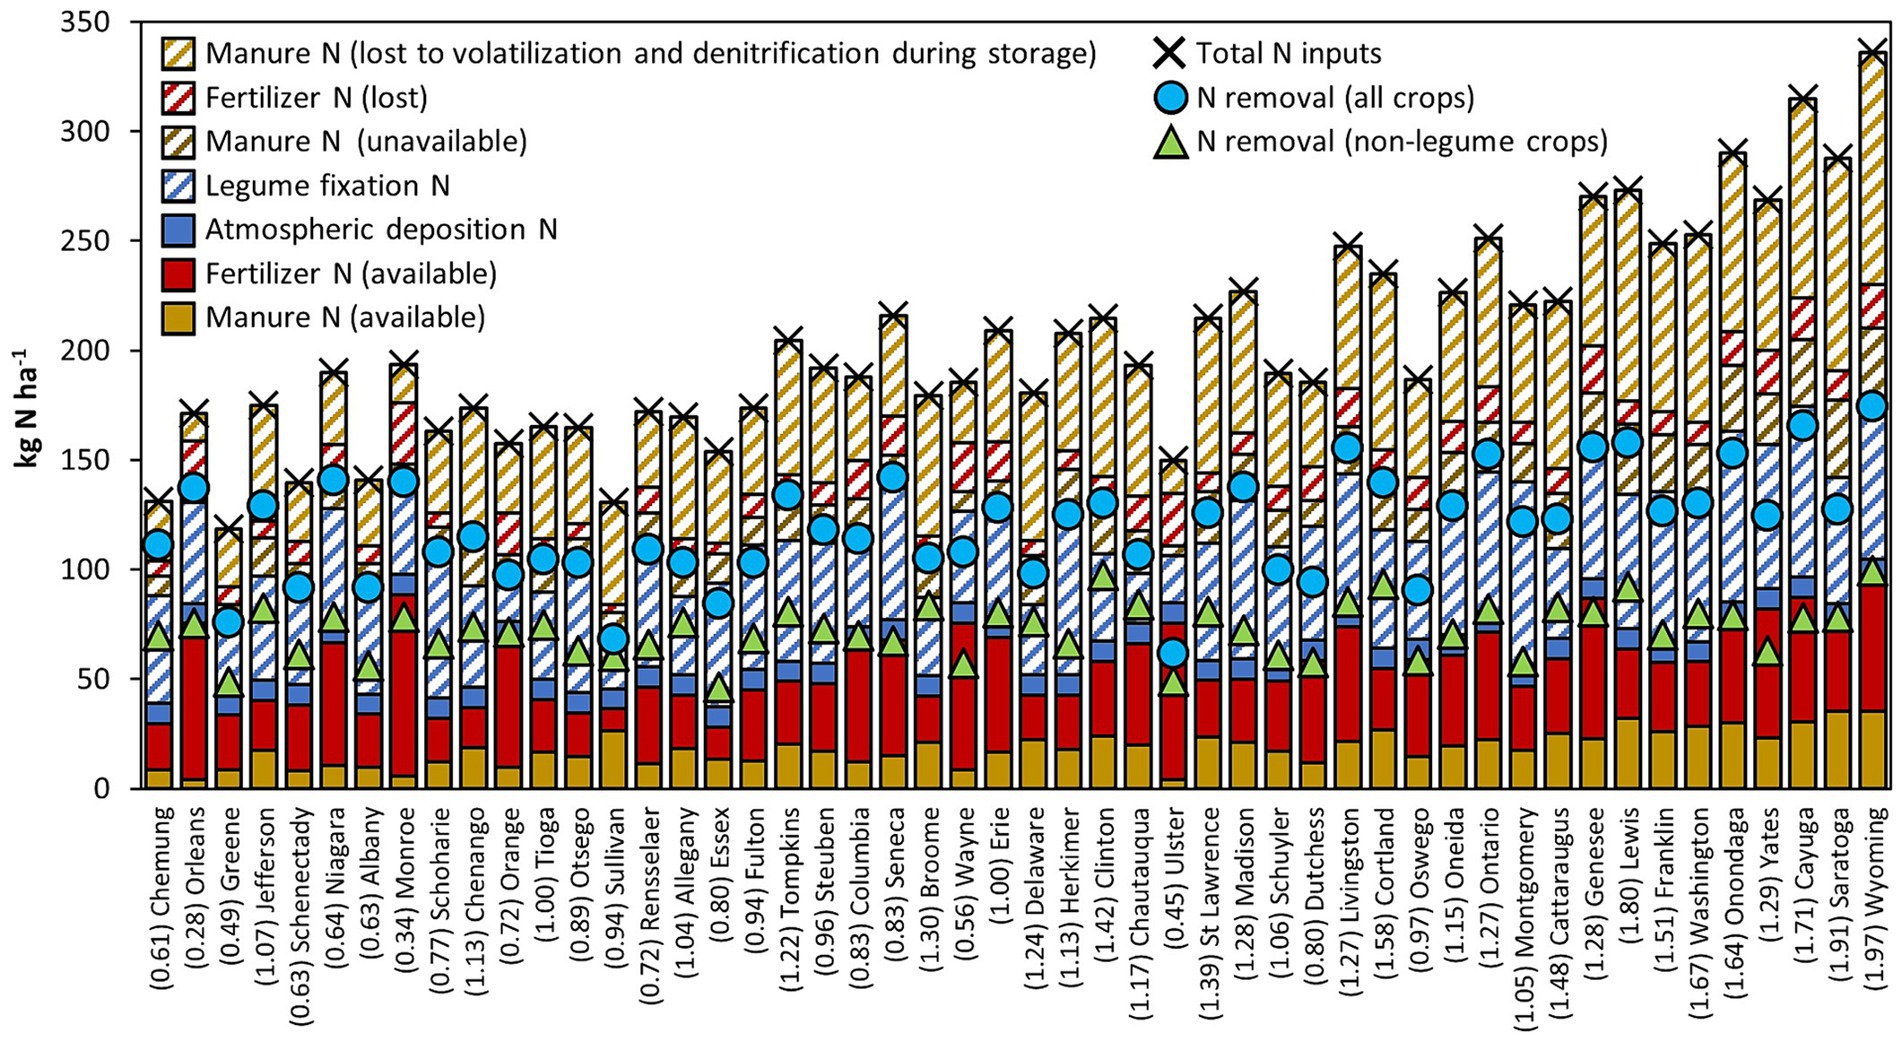
Figure 5. The manure and purchased fertilizer N inputs, atmospheric deposition of N, legume of fixation N, and crop uptake of N by non-legume and all crops for New York counties in 2017. Estimated N losses of manure N during storage through volatilization and identification are identified. Counties are ordered from lowest N balance (left of figure) to highest N balance (right of figure), where the maximum N balance is equal to the difference between total N inputs and crop N uptake (non-legume crops only), and the minimum N balance is the difference between total N inputs excluding legume fixation and crop N uptake (all crops). The number in parentheses indicates the animal density of the county in animal equivalent units (AUs) per ha, where 1 AU = 455 kg live animal weight (SRM, 2017).
The average N application with manure on cropland receiving manure according to the 2017 USDA CoA (USDA NASS, 2019b), was 378 kg N ha−1 (337 lb. N ac−1) before storage and land application losses, and 153 kg N ha−1 (136 lb. N ac−1) after storage losses (Table 7). At the regional level, manure N application rates ranged from 124 kg N ha−1 (111 lb. N ac−1) in the southeast region, to 179 kg N ha−1 (159 lb. N ac−1) in the eastern region, after storage losses. At the county level, manure N application rates after storage losses ranged from 65 kg N ha−1 (58 lb. N ac−1) in Ulster County (southeast region) to 371 kg N ha−1 (331 lb. N ac−1) in Essex County (northeast region) assuming all manure was applied in the county or region that it was produced. The 2017 USDA CoA does not separate legume and non-legume area that received manure, meaning that an application rate for the scenario where manure is only applied to non-legume cropland cannot be calculated.
The average purchased fertilizer application rate of N, considering the amount of cropland receiving fertilizer according to the 2017 USDA CoA (USDA NASS, 2019b), was 98 kg N ha−1 (88 lb. N ac−1). At the regional level, purchased fertilizer N application rates ranged from 77 kg N ha−1 (69 lb. N ac−1) in the northeast region, to 124 kg N ha−1 (111 lb. N ac−1) in the southeast region. At the county level, purchased fertilizer application rates ranged from 67 kg N ha−1 (60 lb. N ac−1) in Chenango County (central region), to 192 kg N ha−1 (171 lb. N ac−1) in Schenectady County (eastern region).
3.4 Nitrogen to phosphorus ratio
At the state level, the N to P ratio of manure supply before storage and land application losses was 5.5, meaning that for every kg of manure P ha−1, there were 5.5 kg of N ha−1. This ratio was 2.4 after storage losses were accounted for, and would be lower if application losses could also be included. There was little variation in this ratio for manure nutrients among regions and counties (Table 5).
The N to P ratio for purchased fertilizer at the state level was also 5.5, meaning that 5.5 kg N ha−1 was applied for every kg of fertilizer P ha−1. The highest N to P ratio for purchased fertilizer at the regional level was 5.6 (for both the northeast and western regions), and lowest was 5.2 (southeast region). At the county level, N to P ratios for purchased fertilizer ranged from 4.6 in Greene County (southeast region) to 6.3 in Washington County (eastern region; Table 5).
The N to P ratio of crop nutrient removal of all cropland, including legumes, was 7.0 at the state level. This ratio ranged from 6.7 (southwest region) to 7.2 (central and eastern regions) at the regional level, and from 6.1 (Ulster County, southeast region) to 7.7 (Essex County, northeast region) at the county level. The N to P ratio of crop nutrient removal of non-legume cropland was 5.5 at the state level, ranging from 5.3 (western region) to 5.8 (northern and southeast regions) at the regional level, and from 5.0 (Orleans and Wayne County; both western region) to 6.2 (Delaware and Sullivan County, both southeast region) at the county level. Note that there may have been a small additional amount of nutrients removed in crop residues from some small grain cropland.
When the maximum atmospheric deposition and legume fixation of N were included as nutrient inputs, the state level N to P ratios were 9.2 and 3.4, before and after manure N storage losses, respectively.
3.5 Impact of manure application to legume cropland
In NY, an estimated 27% of the total cropland received manure in 2017 (Table 5). If it is assumed that this manure was only applied to non-legume cropland (which accounted for 70% of cropland in the state), 57% of non-legume cropland received manure.
If it is assumed that manure was applied only to non-legume cropland, 15 of the 50 counties had a P deficit (after storage losses), still needing purchased P fertilizer to balance crop P removal in harvested product. If counties with manure P above crop removal only applied what was necessary to balance non-legume crop removal and excess manure was redistributed to counties within the same region that had a manure P deficit on non-legume cropland, no individual region would have a P deficit and the state manure P surplus would amount to just 3 kg P ha−1 (3 lb. P ac−1).
If it is assumed that manure was applied to all cropland (non-legume and legume), 35 of the 50 counties had a P deficit (after storage losses) and still required purchased P fertilizer to meet crop removal. If it is assumed that surplus manure (after application to crop P removal) at the county level was moved to other counties within the same region for application to both non-legume and legume cropland, the central, southern, southeast and western regions would have a P deficit (maximum of −5 kg P ha−1 in the western region; −4 lb. P ac−1), and require additional purchased P fertilizer to meet P removal with harvest. If manure was applied to all cropland and redistributed from counties and regions with a manure P surplus (after application to crop P removal) to those with a P deficit throughout NY, there would be a small P deficit of −1 kg P ha−1 (−1 lb. P ac−1). These estimations considered estimated storage losses. At the state level, there was sufficient manure P to supply 98% of the total (non-legume and legume) crop P removal before storage losses and 92% when storage losses were considered.
If manure is applied only to non-legume cropland at rates that do not exceed P removal by the crop, 38 of the 50 counties would have had an N deficit before storage and land application losses and all counties would have an N deficit once storage losses were considered, indicating a need for purchased fertilizer N to meet crop N removal in NY. If land application losses could be estimated accurately and separated within the balance, the deficit would be even greater. At the state level, if manure was applied to meet but not exceed crop P removal, manure N supplied 99% of the non-legume crop N removal before storage and land application losses, and 43% of non-legume N requirements after storage losses were considered. If it is assumed that only approximately 50% of this N was in ammonium form and available for crop removal, this resulted in an N deficit of 56 kg N ha−1 (50 lb. N ac−1) on non-legume cropland for the state, almost identical to the amount of purchased N fertilizer (57 kg ha−1; 51 lb. N ac−1).
Both P and N balances increased as animal density increased at the county level (Figures 6A,B). At the state level, 64% of P applied to cropland came from manure, and 25% of N (after storage losses and potential atmospheric deposition of N). Counties with higher animal densities tended to apply a higher proportion of their nutrients in the form of manure, although for both P and N this trend flattened above approximately 1.0 AU ha−1 (0.40 AU ac−1; Figure 6C).
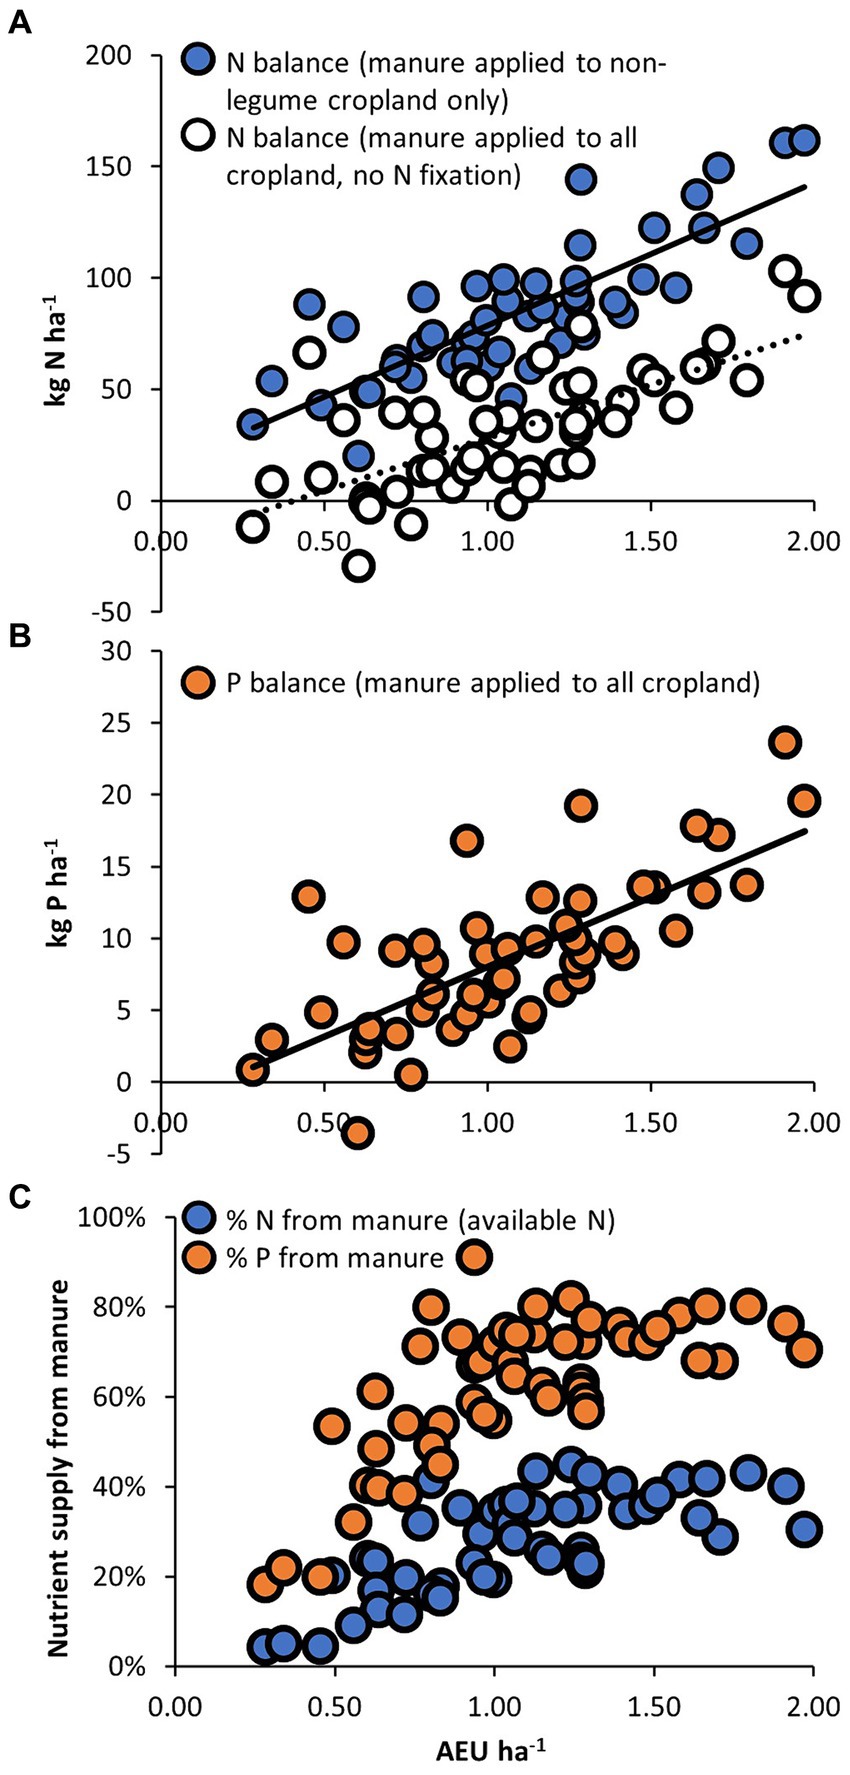
Figure 6. The nitrogen (N) balance calculated as the difference between total N inputs and crop N uptake (non-legume cropland only; closed circles), and the difference between total N inputs excluding legume fixation and crop N uptake (all cropland; open circles) of New York counties in 2017 (A), the phosphorus (P) balance calculated as the difference between total P inputs and crop P uptake (all cropland) (B), and the percentage (%) of N and P nutrients being supplied by manure versus purchased fertilizer, plotted against the number of animal units (AUs) per ha in those counties, where 1 AU is equal to 455 kg of live animal weight (SRM, 2017) (C).
4 Discussion
Dairy agriculture is prominent in NY, with dairy cows and their replacements accounting for 69% of the total AU and forage crops accounting for 65% of the harvested cropland. This is largely a result of proximity to major human populations, the moist, temperate climate of the region which facilitates good forage production for dairy cattle feed, and prominence of landscape and soil characteristics that do not necessarily support the wide-spread production of human-grade food crops. In 2017, between 58 and 84% of cropland received nutrient inputs in the form of manure, purchased fertilizer, or both. The results of the statewide assessment suggests that at least 16% of cropland did not receive any P inputs in the form of manure or fertilizer. These results suggest P applications are somewhat conservative and P is only applied when considered necessary, consistent with a statewide focus on reducing P losses and over application to forage cropland (Swink et al., 2009; Ketterings et al., 2012a; Cela et al., 2017).
The integrated crop-livestock system of NY, with a modest state average animal density of 1.17 AU ha−1 (0.47 AU ac−1) and a maximum animal density of 1.97 AU ha−1 (0.80 AU ac−1) in Wyoming County, a major dairy producing county, shows the state’s ability to capitalize on the value of manure without excessive risk to the environment. This is due to there being a relatively large land base for the distribution of nutrients in manure. If manure application regulations are followed (Bass et al., 2023), regions with moderate or low animal densities have a limited risk of nutrients accumulating and concentrating and being lost to the environment. In contrast, regions with high animal densities lack the land base to distribute nutrients and prevent their accumulation and concentration (Spiegal et al., 2020). Therefore the relatively low animal density allows NY agriculture to adopt the principles of a circular economy: eliminate waste and pollution, circulate products and materials (Ellen MacArthur Foundation, n.d.), while protecting nature.
At the county level, the contribution of manure nutrients to total nutrient supply increased with animal density up to approximately 1 AU ha−1 (0.4 AU ac−1). At animal densities above this, manure contribution levels off at approximately 75% of P inputs and 35% of available N inputs with the remainder applied as fertilizer (Figure 6C). At the state level, 62% of P inputs and 26% of available N inputs were from manure. By utilizing manure, cropland receives essential macro nutrients for crop growth (N, P as well as potassium, sulfur, magnesium, and calcium), and essential micronutrients including zinc, boron, and manganese, reducing the need for purchased synthetic forms of these nutrients. Manure also supplies cropland with organic matter and microbial biomass, which in tandem with conservation practices, can help build soil health, increase climate resilience over time, and improve soil biodiversity (Sadeghpour et al., 2016; Rayne and Aula, 2020).
Manure alone only supplied sufficient P to meet crop removal in 15 of the 50 counties considered in this study, similar to the manure shed assessment by Spiegal et al. (2020) which found manure P surpluses in only four NY counties in 2012. Distribution of manure among counties would allow sufficient P to be available to meet non-legume crop requirements across the state, leaving a surplus of only 3 kg ha−1 (3 lb. P ac−1). If this surplus was applied to legume cropland, there would still be a deficit at the state level (92% of crop P requirements could be met through manure applications alone after estimated storage losses) indicating that some purchased P fertilizer is required to support crop production in NY. Similar findings were seen in the P-based manure shed scenarios run by Saha et al. (2023) for the Susquehanna River Basin.
The average P balance for the state was 10 kg P ha−1 (9 lb. P ac−1) in 2017. As some loss of manure nutrients will undoubtedly occur between excretion of manure by animals and land-application of that manure, a positive balance is expected in anticipation of these losses to prevent a negative P balance and potential soil mining of P. It should further be noted that given only a small percentage of the total cropland in NY tests above the agronomic optimum (Ros et al., 2019, 2020), many fields should be managed to increase soil test P levels to optimal levels for crop production for long-term sustainability. In addition, rotation management demands careful interpretation of field balances. For example, corn and alfalfa rotations, common on NY dairy farms, require buildup of P under corn years to allow for drawdown of P under the alfalfa years if fertilizer purchases of P are to be avoided or limited.
The state N balance results show that manure N can supply 99% of the non-legume N removal for the state but once expected N losses due to volatilization and denitrification during storage are accounted for, application of manure to crop P removal for all cropland results in manure N only supplying 43% of the non-legume crop N removal. If only the inorganic fraction of this manure is available to the crop, the N deficit at the state level was estimated to be 56 kg N ha−1 (50 lb. N ac−1). This is almost equal to the purchased N fertilizer amount (57 kg ha−1; 51 lb. N ac−1) which shows that with the current expected N losses during storage, N fertilizer purchases are necessary and do occur. If additional losses during application could be accounted for, this deficit would be even greater suggesting the need for more purchased N fertilizer. These results are consistent with the assessment by Spiegal et al. (2020) who also found N deficits for all counties in NY. It should be noted that our assessment does not take into account other potential soil N credits from past manure applications, cover crops, or crop rotations.
The modest animal densities and distribution of manure nutrients within NY is reflected in the nutrient balances for both P and N. The P balances at the county level ranged from −3 to 24 kg P ha−1 (−3 to 21 lb. P ac−1) with a state balance of 10 kg P ha−1 (9 lb. P ac−1). This is in line with the 2012 P use efficiency study results for the US Northern Crescent by Swaney and Howarth (2019), who also found modest P balances using similar methodology for 2012 data.
Nitrogen balances ranged from −28 to 103 kg N ha−1 (−25 to 92 lb. N ac−1) with a state balance of 39 kg N ha−1 (35 lb. N ac−1) when manure was only applied to non-legume cropland and from 21 kg N ha−1 (19 lb. N ac−1) to 164 kg N ha−1 (146 lb. N ac−1) when legume cropland was included as well. Reality will lie between the two scenarios, as some legume cropland does receive manure in NY but not all and some N fixation may still occur when manure is applied to legume cropland. It is likely that counties with a higher animal density applied more manure to legume cropland, turning a potential waste into a useful resource, reducing the need for purchased P fertilizer and other nutrients. In both scenarios, the results were similar to the 2012 nitrogen use efficiency results for the US Northern Crescent in the study of Swaney et al. (2018), and partial N balances calculated for all US counties between 2011 and 2013 by Roy et al. (2021). The latter assessment did not identify any counties in NY as a “hot spot” for improved cropland N management.
It is important to note that while positive balances could signal potential losses, they do not necessarily reflect actual losses. The amount of P and N lost to the environment is affected by multiple factors, including landscape patterns, existing soil resources and management, climate and weather patterns, and distribution of nutrients at smaller scales than assessed here (for instance, farm or field level). As already shown, although total N balances (not considering unavoidable losses) were positive, a large portion of this surplus N is lost during storage and land application or is in a plant-unavailable form. The purchased N fertilizer met the estimated N deficit of cropland which indicates responsible nutrient management in terms of maximizing the use of available manure nutrients and using minimal purchased N fertilizer. However, this assessment also highlights the importance of minimizing N losses during storage and potential gains to be had if losses can be minimized, given N losses not only result in lost nutrients that need to be replaced with purchased fertilizer with a financial cost, but also contribute to direct (N2O) and indirect (NH4) GHG emissions and can negatively impact air and water quality. Therefore, improved and cost-effective manure treatment, storage and land application options that reduce N volatilization and denitrification need to be developed and implemented.
To increase the circularity of agricultural production in NY, the benefits and trade-offs of applying manure to legume cropland need to be considered. The results of the 2017 N and P balances indicate that if manure was only applied to non-legume cropland, there would be a small manure P surplus at the state level, and all legume cropland would require purchased P fertilizer, further increasing the state’s P surplus. In contrast, if all cropland received applications of manure, there would be an increased need for purchased N fertilizer on non-legume cropland, but a reduced need for purchased P fertilizer on legume cropland. There is also likely to be less need for purchase of other nutrient inputs on the legume cropland receiving manure. One example is the S provided in manure, which is particularly important in corn-legume rotations in NY where S deficiencies for alfalfa have been reported (Ketterings et al., 2012b), in addition to the manure providing K and contributing to the soil organic matter content of that cropland with its associated soil health benefits. Prioritizing the use of manure nutrients over purchased fertilizer nutrients also contributes to the circular agricultural economy concept, and potentially lower GHG inventories. The decision to apply manure to legume cropland (possibly to later years to avoid dominance of grass in mixed legume/grass stands; Ketterings et al., 2008) or not should therefore be made more locally, taking into account crop rotation, soil test results and other field management history. Laboratory testing of manure samples to quantify the N to P ratio prior to application could also help to distribute manure to the areas where it would be of most benefit, based on its characteristics. For example, prioritizing manure with a higher N to P ratio for non-legume cropland, and manure with a lower N to P ratio to legume cropland which does not require the N but would still benefit from the P and other constituents such as K and S and organic matter. This is becoming increasingly important as manure separation and treatment technologies can change N to P ratios (Aguirre-Villegas and Larson, 2017). It is also important to note that some cropland will have manure application restrictions due to soil characteristics, proximity to neighbors, or landscape features.
Reducing manure N losses during storage and land application would increase the N to P ratio of manure. This would reduce the amount of purchased fertilizer N required where manure applications are limited to P removal per NY’s Concentrated Animal Feeding Operation permit (NYSDEC, 2022) and land grant university guidelines for P management (Czymmek et al., 2021; Ketterings and Workman, 2023). In 2017, the state average N to P ratio of manure was 5.5 before storage losses, and just 2.4 after storage losses. This is higher than the mean N to P ratios reported by Spiegal et al. (2020) that ranged from 1.6 to 2.0. Lim et al. (2023) show estimates for the N to P ratio of manure from various livestock species following different storage and application practices. Their values for the dairy herd (which best represents the majority of manure in NY) ranged from 0.8 to 1.3, depending on storage and application method. The N to P ratio calculate for NY in 2017 was higher, but the ratio does not fully take into account land application losses. Based on N to P ratio reported by Lim et al. (2023) and Spiegal et al. (2020), potential N losses to the environment in this current assessment may have been underestimated. The limitations of using manure to meet crop nutrient requirements due to a low N to P ratio has been discussed in detail by Lim et al. (2023). Crops with a lower or no external N requirement, such as alfalfa are less impacted by a low N to P ratio, but in NY where approximately 60% of the cropland is harvested for crops with substantial N requirements (corn silage, corn grain, grass hay and grass haylage), the N to P ratio becomes more important.
To improve upon balance assessments, updated manure excretion rates need to be established that account for current animal feeding practices and performance, and regional differences in these practices. For example, NY dairy cows tend to consume a diet with a higher forage content than other regions as farmers make use of locally available resources. As the concept of a circular agricultural economy and utilizing waste and by-products from other industries as feed also grows in popularity, potential impacts on manure nutrient excretion rates also need to be considered. Lim et al. (2023) highlight this, using dried distillers’ grains as an example of such a feed, which is high in N and P. This could increase the N and P excretion in manure, with the benefit of increasing the P value of the manure if cropland to apply that manure to is available but could also create additional challenges in higher animal density counties and regions, and a more calculated redistribution of nutrients within the state would be necessary. This could create logistic and financial barriers, particularly if the upward trend of dairy cow numbers and milk production continues in NY.
Updated information is required on the amount of nutrients lost during storage and application of manure, particularly with new manure treatment, storage and application practices being adopted. Development and adoption of new manure treatment, storage and application practices that reduce N losses through volatilization and denitrification would not only help to reduce nutrient balances by increasing the N value of manure, but also improve the N to P ratio of manure, facilitating higher manure N application rates when manure is applied to P removal and reduced reliance on purchased N fertilizer. This would have additional benefits, such as reducing purchased fertilizer costs to the farmer, reducing the GHG emissions related to both N losses from manure and production of N and P fertilizer, and reducing the negative impacts N and P losses can have on air and water quality. In combination with precision agriculture technologies, this should help optimize nutrient management, increasing yields, reducing inputs and the production of those inputs, and help to maximize the overall environmental benefits of NY agriculture.
5 Conclusion
Livestock in NY produce sufficient recoverable manure P to meet 90% of all cropland P requirements. However, if the recoverable manure was applied to equate crop P removal for non-legume and legume cropland, there would be an N deficit in all counties. If manure was only applied to non-legume cropland, the N deficit would be small but a switch away from non-legume cropland will increase the need for purchased P fertilizer and other essential nutrients such as S for legume cropland. Manure has many benefits to cropland beyond N and P, and consideration of these factors at the field level, in combination with field management history and soil test results, could help to prioritize where manure should be applied, and where purchased N and P inputs are required. Development and adoption of advanced manure treatment, storage, and application practices, in addition to consideration of how livestock feeding practices can influence manure characteristics, could all help to further improve the value of manure and improve balances, while increasing the circularity and sustainability of the agricultural sector in NY. As updated manure excretion rates and the amount of nutrients lost during the storage and application of manure become available, combined with an expected continuation in the upward trend of both cow numbers and milk production for NY, it will be important to continue assessments of nutrient balances and animal densities, and explore manure treatment options to allow for transport of manure nutrient throughout NY to avoid creating nutrient “hotspots” within the state.
Data availability statement
Publicly available datasets were analyzed in this study. These data can be found here: https://www.nass.usda.gov/Publications/AgCensus/2017/Full_Report/Volume_1,_Chapter_2_County_Level/New_York/nyv1.pdf (2017 Census of Agriculture New York State and County Data).
Author contributions
OG: Conceptualization, Formal analysis, Investigation, Methodology, Visualization, Writing – original draft. KW: Writing – review & editing. KR: Writing – review & editing. QK: Writing – review & editing, Conceptualization, Funding acquisition, Methodology, Supervision.
Funding
The author(s) declare financial support was received for the research, authorship, and/or publication of this article. This research was funded by a gift from Chobani, funding from the New York State Department of Environmental Conservation and New York State Department of Agriculture and Markets, a contribution by the Northern New York Agricultural Development Program (NNYADP) and the intramural research program of the U.S. Department of Agriculture, National Institute of Food and Agriculture, Hatch/McIntire-Stennis.
Conflict of interest
The authors declare that the research was conducted in the absence of any commercial or financial relationships that could be construed as a potential conflict of interest.
Publisher’s note
All claims expressed in this article are solely those of the authors and do not necessarily represent those of their affiliated organizations, or those of the publisher, the editors and the reviewers. Any product that may be evaluated in this article, or claim that may be made by its manufacturer, is not guaranteed or endorsed by the publisher.
References
Aguirre-Villegas, H. A., and Larson, R. A. (2017). Evaluating greenhouse gas emissions from dairy manure management practices using survey data and lifecycle tools. J. Clean. Prod. 143, 169–179. doi: 10.1016/j.jclepro.2016.12.133
Andersen, D. S., and Pepple, L. M. (2017). A county-level assessment of manure nutrient availability relative to crop nutrient capacity in Iowa: spatial and temporal trends. Trans. ASABE 60, 1669–1680. doi: 10.13031/trans.12417
Bass, C., Workman, K., Albrecht, G., Bush, R., Jordan, B., Gates, D., et al. (2023). Concentrated animal feeding operation regulations and comprehensive nutrient management planning in New York State. Ithaca, NY: Cornell University.
Cela, S., Ketterings, Q. M., Soberon, M., Rasmussen, C., and Czymmek, K. J. (2017). Upper Susquehanna watershed and New York state improvements in nitrogen and phosphorus mass balances of dairy farms. J. Soil Water Conserv. 72, 1–11. doi: 10.2489/jswc.72.1.1
Czymmek, K. J., Ketterings, Q. M., Gates, D., Walter, T., Latessa, S., Klaiber, L., et al. (2021). The New York phosphorus runoff index: Version 2.0.
Ellen MacArthur Foundation (n.d.) What is a circular economy? Available at: https://ellenmacarthurfoundation.org/topics/circular-economy-introduction/overview (Accessed November 4, 2023).
Falcone, J. A. (2021). Estimates of county-level nitrogen and phosphorus from fertilizer and manure from 1950 through 2017 in the conterminous United States (USGS Numbered Series No. 1153), Open-File Report. U.S. Geological Survey, Reston, VA.
Flynn, K. C., Spiegal, S., Kleinman, P. J. A., Meinen, R. J., and Smith, D. R. (2023). Manureshed management to overcome longstanding nutrient imbalances in US agriculture. Resour. Conserv. Recycl. 188:106632. doi: 10.1016/j.resconrec.2022.106632
Franzluebbers, A., Hunt, D., Telford, G., Bittman, S., and Ketterings, Q. (2021). Integrated crop-livestock systems: lessons from New York, British Columbia, and the south-eastern United States. Front. Agr. Sci. Eng. 8:81. doi: 10.15302/J-FASE-2020365
Gronberg, J. A. M., and Arnold, T. L. (2017). County-level estimates of nitrogen and phosphorus from animal manure for the conterminous United States, 2007 and 2012 (report no. 2017–1021), USGS Numbered Series. U.S. Geological Survey, Reston, VA.
Guo, L., Wang, C., Zheng, M., Li, W., Cai, Z., Wang, B., et al. (2023). Fertilization practices affect biological nitrogen fixation by modulating diazotrophic communities in an acidic soil in southern China. Pedosphere 33, 301–311. doi: 10.1016/j.pedsph.2022.05.001
Higgs, R. J., Chase, L. E., Ross, D. A., and Van Amburgh, M. E. (2015). Updating the Cornell net carbohydrate and protein system feed library and analyzing model sensitivity to feed inputs. J. Dairy Sci. 98, 6340–6360. doi: 10.3168/jds.2015-9379
Holly, M. A., Kleinman, P. J., Bryant, R. B., Bjorneberg, D. L., Rotz, C. A., Baker, J. M., et al. (2018). Short communication: identifying challenges and opportunities for improved nutrient management through the USDA’s dairy agroecosystem working group. J. Dairy Sci. 101, 6632–6641. doi: 10.3168/jds.2017-13819
IPCC (2019). 2019 refinement to the 2006 IPCC guidelines for national greenhouse gas inventories, Calvo Buendia, E., Tanabe, K., Kranjc, A., Baasansuren, J., Fukuda, M., Ngarize S., Osako, A., Pyrozhenko, Y., Shermanau, P. and Federici, S. (eds.), IPCC, Switzerland.
Kellogg, R. L., Lander, C. H., Moffitt, D. C., and Gollehon, N. (2000). Manure nutrients relative to the capacity of cropland and pastureland to assimilate nutrients: Spatial and temporal trends for the United States. United States Department of Agriculture Natural Resources Conservation Service.
Kellogg, R. L., Moffitt, D. C., and Gollehon, N. R. (2014). Estimates of recoverable and non-recoverable manure nutrients based on the census of agriculture. United States Department of Agriculture Natural Resources Conservation Service.
Ketterings, Q. M., Cherney, J. H., Czymmek, K. J., Frenay, E., Klausner, S. D., Chase, L. E., et al. (2008). Manure use for alfalfa–grass production. Department of Crop and Soil Sciences Extension Series, Cornell University, Ithaca, NY.
Ketterings, Q. M., Czymmek, K. J., Beegle, D. B., Chase, L. E., and Rasmussen, C. N. (2012a). Systematic nutrient (im) balances in dairy farm systems of the northeast and mid-Atlantic regions of the United States. JAS 4:p1. doi: 10.5539/jas.v4n11p1
Ketterings, Q. M., Godwin, G., Gami, S., Dietzel, K., Lawrence, J., Barney, P., et al. (2012b). Soil and tissue testing for sulfur management of alfalfa in New York State. Soil Sci. Soc. Am. J. 76, 298–306. doi: 10.2136/sssaj2010.0437
Ketterings, Q. M., and Workman, K. (2023). Nitrogen guidelines for field crops in New York. Ithaca, NY: Cornell University.
Khanal, S., Anex, R. P., Gelder, B. K., and Wolter, C. (2014). Nitrogen balance in Iowa and the implications of corn-Stover harvesting. Agric. Ecosyst. Environ. 183, 21–30. doi: 10.1016/j.agee.2013.10.013
Leytem, A. B., Williams, P., Zuidema, S., Martinez, A., Chong, Y. L., Vincent, A., et al. (2021). Cycling phosphorus and nitrogen through cropping systems in an intensive dairy production region. Agronomy 11:1005. doi: 10.3390/agronomy11051005
Lim, T., Massey, R., McCann, L., Canter, T., Omura, S., Willett, C., et al. (2023). Increasing the value of animal manure for farmers (No. AP-109), Administrative Publication. U.S. Department of Agriculture, Economic Research Service.
MacDonald, J. M., Ribaudo, M. O., Livingston, J. B., Beckman, J., and Huang, W. (2009) Manure use for fertilizer and for energy: Report to congress (report to congress). U.S. Department of Agriculture, Economic Research Service.
Meisinger, J. J., and Randall, G. W. (1991). Estimating nitrogen budgets for soil-crop systems, in: R. F. Follett, D. R. Kenney, and R. M. Cruse (Eds.), Proceedings of a Symposium Sponsored by Division A-5 of the American Society of Agronomy; S-1, S-3, S-4, S-6 and S-8 of the Soil Science Society of America; and Divisions C-3 and C-5 of the Crop Science Society of America, Anaheim, CA, 1988. Presented at the Managing nitrogen for groundwater quality and farm profitability, Soil Science of America, Madison, WI, pp. 85–124.
NYSDEC (2022). New York State Department of Environmental Conservation ECL SPDES general permit for concentrated animal feeding operations (CAFOs).
Peterson, H. M., Baker, L. A., Bruening, D., Nieber, J. L., Ulrich, J. S., and Wilson, B. N. (2017). Agricultural phosphorus balance calculator: a tool for watershed planning. J. Soil Water Conserv. 72, 395–404. doi: 10.2489/jswc.72.4.395
Rayne, N., and Aula, L. (2020). Livestock manure and the impacts on soil health: a review. Soil Systems 4:64. doi: 10.3390/soilsystems4040064
Ros, M. B. H., Czymmek, K. J., and Ketterings, Q. M. (2020). Combining field phosphorus runoff risk assessments with whole-farm phosphorus balances to guide manure management decisions. J. Environ. Qual. 49, 496–508. doi: 10.1002/jeq2.20043
Ros, M. B. H., Ketterings, Q. M., Cela, S., and Czymmek, K. J. (2019). Evaluating management implications of the New York phosphorus index with farm field information. J. Environ. Qual. 48, 1082–1090. doi: 10.2134/jeq2019.01.0010
Roy, E. D., Hammond Wagner, C. R., and Niles, M. T. (2021). Hot spots of opportunity for improved cropland nitrogen management across the United States. Environ. Res. Lett. 16:035004. doi: 10.1088/1748-9326/abd662
Sadeghpour, A., Ketterings, Q. M., Vermeylen, F., Godwin, G. S., and Czymmek, K. J. (2016). Soil properties under nitrogen- vs. phosphorus-based manure and compost management of corn. Soil Sci. Soc. Am. J. 80, 1272–1282. doi: 10.2136/sssaj2016.03.0086
Saha, A., Saha, G. K., Cibin, R., Spiegal, S., Kleinman, P. J. A., Veith, T. L., et al. (2023). Evaluating water quality benefits of manureshed management in the Susquehanna River basin. J. Environ. Qual. 52, 328–340. doi: 10.1002/jeq2.20429
Sharara, M., Kolesch, R. K., Cortus, E. L., Larson, A., Classen, J. J., and Janni, K. A. (2022). Addressing nutrient imbalances in animal agriculture systems. J. ASABE 65, 235–249. doi: 10.13031/ja.14661
Sharpley, A., Helmers, M. J., Kleinman, P., King, K., Leytem, A., and Nelson, N. (2019). Managing crop nutrients to achieve water quality goals. J. Soil Water Conserv. 74, 91A–101A. doi: 10.2489/jswc.74.5.91A
Shi, W., Zhao, H.-Y., Chen, Y., Wang, J.-S., Han, B., Li, C.-P., et al. (2021). Organic manure rather than phosphorus fertilization primarily determined asymbiotic nitrogen fixation rate and the stability of diazotrophic community in an upland red soil. Agric. Ecosyst. Environ. 319:107535. doi: 10.1016/j.agee.2021.107535
Spiegal, S., Kleinman, P. J. A., Endale, D. M., Bryant, R. B., Dell, C., Goslee, S., et al. (2020). Manuresheds: advancing nutrient recycling in US agriculture. Agric. Syst. 182:102813. doi: 10.1016/j.agsy.2020.102813
SRM (2017). Does size matter? Animal units and animal unit months. Rangelands 39, 17–19. doi: 10.1016/j.rala.2016.12.002
Swaney, D. P., and Howarth, R. W. (2019). Phosphorus use efficiency and crop production: patterns of regional variation in the United States, 1987–2012. Sci. Total Environ. 685, 174–188. doi: 10.1016/j.scitotenv.2019.05.228
Swaney, D. P., Howarth, R. W., and Hong, B. (2018). Nitrogen use efficiency and crop production: patterns of regional variation in the United States, 1987–2012. Sci. Total Environ. 635, 498–511. doi: 10.1016/j.scitotenv.2018.04.027
Swink, S. N., Ketterings, Q. M., Chase, L. E., Czymmek, K. J., and Mekken, J. C. (2009). Past and future phosphorus balances for agricultural cropland in New York State. J. Soil Water Conserv. 64, 120–133. doi: 10.2489/jswc.64.2.120
Swink, S. N., Ketterings, Q. M., Chase, L. E., Czymmek, K. J., and Van Amburgh, M. E. (2011). Nitrogen balances for New York State: implications for manure and fertilizer management. J. Soil Water Conserv. 66, 1–17. doi: 10.2489/jswc.66.1.1
US Dairy Net Zero Initiative (2023) Available at: https://www.usdairy.com/sustainability/environmental-sustainability/net-zero-initiative (Accessed September 22, 2023).
USDA NASS (2019b). 2017 census of agriculture New York State and county data (no. AC-17-A-32), Geographic Area Series.
USDA NRCS (2023). USDA NRCS Crop Nutrient Tool [WWW Document]. Available at: https://plantsorig.sc.egov.usda.gov/npk/main (Accessed March 27, 2023).
Keywords: nitrogen, phosphorus, nutrient balance, dairy, state balance, circular economy
Citation: Godber OF, Workman K, Reed K and Ketterings QM (2024) New York state, regional and county level nitrogen and phosphorus balances for harvested cropland. Front. Sustain. 5:1352296. doi: 10.3389/frsus.2024.1352296
Edited by:
George Tsalidis, Brunel University London, United KingdomReviewed by:
Dave Bjorneberg, Agricultural Research Service (USDA), United StatesLuis Fernando Perez-Mercado, University of San Simón, Bolivia
Yves Uwiragiye, Nanjing Normal University, China
Copyright © 2024 Godber, Workman, Reed and Ketterings. This is an open-access article distributed under the terms of the Creative Commons Attribution License (CC BY). The use, distribution or reproduction in other forums is permitted, provided the original author(s) and the copyright owner(s) are credited and that the original publication in this journal is cited, in accordance with accepted academic practice. No use, distribution or reproduction is permitted which does not comply with these terms.
*Correspondence: Quirine M. Ketterings, cW1rMkBjb3JuZWxsLmVkdQ==