 Alexandre Labelle1,2,3*
 Jean-Marc Frayret1,2,3
- 1Département de Mathématiques et Génie Industriel, Polytechnique Montréal, Montreal, QC, Canada
- 2Centre Interuniversitaire de Recherche sur le Réseaux d'Entreprise, Logistique et de Transport (CIRRELT), Montreal, QC, Canada
- 3Centre Interdisciplinaire de Recherche en Opérationnalisation du Développement Durable (CIRODD), Montreal, QC, Canada
Agent-based modeling and simulation is a method well suited for studying individual behavior and interactions among members of a population connected by social networks. Although the development of such simulation models can be relatively complex, it is even more challenging to develop models that are empirically valid. In the case of reverse logistics, the sophisticated and difficult-to-predict behavior of consumers must be modeled. In this paper, an agent-based simulation model of consumer behavior and interactions was configured to conduct a case study of the voluntary deposit collection program for wine bottles in the Val-Saint-François region of Quebec. As this collection program was officially launched in 2019, two empirical samples were obtained to test the validity of the model and study how social interactions such as word of mouth contributes to the success of the collection program. The first sample represents the amount of glass collected during the last 26 weeks of 2019, while the second sample covers the first 13 weeks of 2020. Having observed an increase in collection rates between 2019 and 2020, word of mouth was introduced into the model to explain this phenomenon. Statistical tests show that the model is indeed valid with the inclusion of diffusion of awareness, as the simulation results are significantly consistent with the empirical data. The validation of the model demonstrates the viability of using multiple heterogeneous data-sources to configure a simulation model based on the Theory of Planned Behavior without using Structural Equation Modeling.
1 Introduction
Understanding and modeling consumer recycling behavior is a critical aspect of designing reverse logistics networks for the collection of end-of-life products. It is particularly critical for selecting the number, location, and capacity of drop-off points and collection routes. There are many factors to consider when modeling consumer recycling behavior. Individual attitudes, beliefs, socio-economic factors, cultural influences, and the accessibility and convenience of recycling infrastructure all play an important role. Previous studies have assessed the relationship between the location and number of collection points and the amount of recycled material (Labelle and Frayret, 2018, 2023; Tong et al., 2018). In this paper, we propose to assess the impact of certain types of social interactions on the volume of recycled material.
To do so, this paper presents a case study in reverse logistics that aims to study the impact of social interactions on the performance of a collection system, and more specifically on the word-of-mouth effect regarding the spread of awareness of drop-off points. This contribution is an extension of a series of models previously published by the same authors (Labelle and Frayret, 2018, 2023) and briefly outlined in the literature review. The interested reader is referred to the aforementioned published works for more details on the agent-based simulation model used for this research.
The case study, which focuses on the voluntary collection program of glass containers (mainly wine bottles), consists in analyzing two samples of data obtained with the valuable collaboration of the Opération Verre-Vert (OVV) committee, founders of the voluntary glass collection program of the Val-Saint-François Regional County Municipality (VSF).
This paper is organized as follows. The next section presents an analysis of the literature related to the impact of social interaction on circular economy initiatives and consumer recycling behavior. This section also introduces the simulation model of glass container collection used in previous studies, which is extended in this paper. The following section introduces the case study and proposes a descriptive analysis of the two data sets used to conduct this study. Section 4 then proposes some adjustments of the original simulation model to study the impact of agents' drop-off awareness to justify the change of the collection rates observed in the data. Finally, Section 5 presents the results of an analysis to quantitatively assess the impact of simple social interactions on the volume of glass containers collected. Section 6 discusses these results and Section 7 concludes.
2 Literature review
It's been several years since the application of simulation for studying reverse logistics has gained in interest (Kara et al., 2007), but with the advent of agent-based modeling and simulation (ABMS), which is particularly well-suited for reverse logistics problems (Abid et al., 2019) and waste management (Alonso-Betanzos et al., 2017), several researchers have chosen this approach to study these problems (Walzberg et al., 2022; Tong et al., 2023). However, in their systematic review of simulation and optimization methods applied to the context of reverse logistics (Abid and Mhada, 2021), the authors note that ABMS, while offering many advantages, is used much less frequently than other more popular methods such as Monte Carlo simulation, discrete-event simulation and numerical simulation. Agnusdei et al. (2019) reports similar findings in their review of modeling and simulation tools used in the integration of forward and reverse logistics, leaving plenty of room for new contributions in the field of ABMS in reverse logistics. According to Peres et al. (2010), agent-based models are not trivial to develop, as they have to satisfy the balance between specificity and applicability, and typically have a large number of parameters and degrees of freedom. As a result, calibration and validation of these models is a recurring challenge with this method (Walzberg et al., 2023).
2.1 Agent-based models of glass container collection and consumer recycling behavior
This subsection briefly outlines the simulation model of glass container collection and consumer behavior used in this study, published in Labelle and Frayret (2018, 2023). The model is mainly based on the Theory of planned behavior (Ajzen, 1991), commonly used to model pro-environmental behaviors (Yuriev et al., 2020). Because of its intrinsic ability to model the behaviors of autonomous entities, researchers often integrate the TPB into the ABMS in order to have a solid conceptual base on which to build their behavior simulation models. This approach has been applied to study the emergence of industrial symbioses (Ghali et al., 2017), reuse and recycling of solar panels (Walzberg et al., 2021), agricultural practices to manage water quality (Bourceret et al., 2022), the circularity of hard-disks drives (Walzberg et al., 2022) and post-consumer recycling (Tong et al., 2018, 2023). Although Structural Equation Modeling (SEM) is often used with the TPB, it requires in-depth survey analysis for the population studied, which is not always feasible. Thus, the approach in this paper proposes to use simulation instead.
In this paper's model, agents have a choice of three end-of-life options for their wine bottles: the garbage disposal, curbside recycling, or taking the bottle to a voluntary drop-off point. To decide, the agent calculates a score for each end-of-life and performs the behavior that obtains the highest score. The score is mainly determined by attitude and the perceived behavior control (influenced by the distance between the agent and the drop-off point). It is important to mention that these calculation parameters are almost entirely based and calibrated from empirical data; they are also different for each possible end-of-life and unique for each agent (Dugundji and Gulyás, 2008). For this paper, a network of connections has been added, enabling the exchange and diffusion of information between agents, specifically awareness of the existence of voluntary drop-off points.
2.2 Impacts of social interactions on circular economy initiatives
A number of authors have examined the impact of the social aspect in circular economy initiatives using ABMS. Although not always modeled in the same manner, the findings are relatively unanimous: the social impact on behavior is non-negligible in the performance of circular initiatives. While the majority of authors represent the social aspect as a consideration of the share of circular behavior adopters in their networks (Byrka et al., 2016; Tong et al., 2018; Walzberg et al., 2021, 2022; Bourceret et al., 2022), other studies integrate social impact through the perceived opinion of other network members (Tong et al., 2023).
Equally important in the field of innovation diffusion, the social aspect is also often modeled as the diffusion of awareness, the impact (positive or negative) of word-of-mouth and the proportion of adopters in a stakeholder's network (Kiesling et al., 2012). In this paper, the social aspect will be integrated into the model from the point of view of innovation diffusion, where it is the impact on the collection system of the diffusion of awareness by word-of-mouth (Huete-Alcocer, 2017) which will be investigated. Future work could focus on integrating the social norm into the model, see section 6 for more details.
3 Case study
Following the successful initiative of the first voluntary drop-off points for glass containers in the province of Quebec, VSF's voluntary collection program was launched on a larger scale in 2019 with its 6 drop-off points in Racine, Richmond, Saint-Denis-de-Brompton, Stoke, Valcourt and Windsor. Initially, VSF planned to collect around 200 tons of glass per year, which Deloitte estimated to be a return rate of around 40% (Deloitte, 2018). However, 183 tons of glass were collected in just 8 months, significantly exceeding expectations and representing a 60% return rate.
It should be noted that two of these collection points, Racine and Saint-Denis-de-Brompton, had been active for several years before the official launch of the program. In fact, the first voluntary drop-off point in the province was inaugurated in Racine in 2015. Since then, the initiative has grown in popularity in Quebec, and there are now more than 75 glass drop-off points managed directly by municipalities, in parallel with the province's regular residual materials collection system. All collected glass is processed locally; the 7650 tons of glass collected annually are first conditioned at 2M Resources and then 95% recycled at Owen Illinois, a glass container manufacturer.
For this paper, two samples of empirical data on the quantities of glass collected at each of VSF's depots were obtained with the valuable assistance of OVV. Table 1 shows the quantities, in tons of glass, collected for the last 26 weeks of 2019 and the first 13 weeks of 2020.
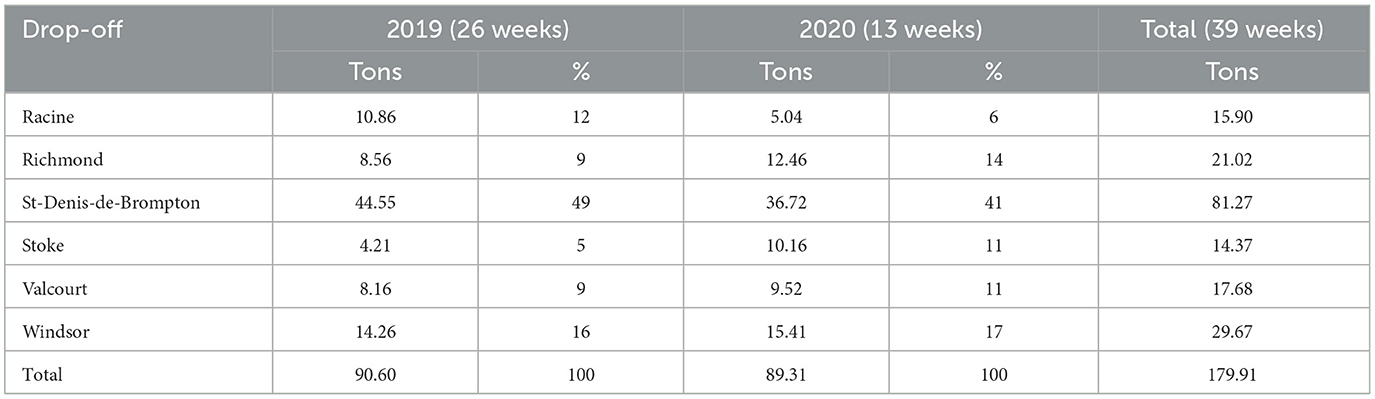
Table 1. Tons of glass collected via OVV's voluntary drop-off program.
3.1 Statistical analysis of the 2019 and 2020 samples
While in Labelle and Frayret (2023) we used only one data set, the 2020 sample, the addition of a second sample allows us to study and analyze the evolution of the reverse logistics collection system over time. Two statistical tests (t-test: paired two-sample for means) were therefore carried out to qualify the relationship between the two empirical samples. In other words, the following two questions were answered:
• Is there a significant difference in the distribution of returned bottles between the depots?
The results of the t-test in Table 2 indicate that we can accept the hypothesis that the percentage of glass collected per depot is similar from 2019 to 2020 with a p > 0.05.
• Is the amount of glass collected constant?
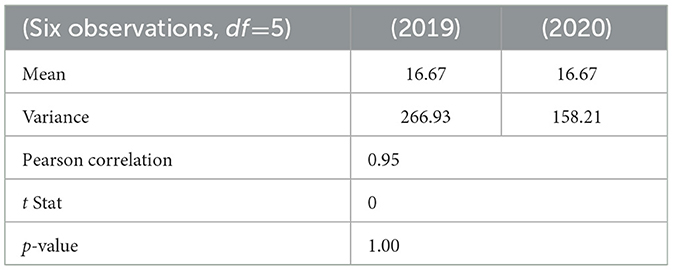
Table 2. Paired t-tests results for the distribution of glass across drop-off points (in percentages).
The results of the t-test in Table 3 show that there is a significant difference in the number of bottles collected per week between 2019 and 2020 with a p < 0.05. In fact, the average number of tons collected per week in 2020 is much higher than in 2019, with approximately double the amount (3.48 tons per week in 2019 compared to 6.87 tons per week in 2020).
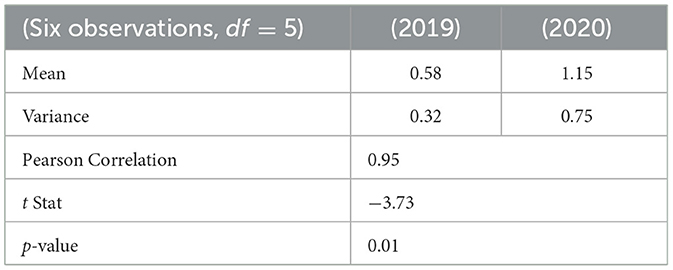
Table 3. Paired t-tests results for the rate of collection (tons/week) glass across drop-off points.
3.2 Increase in rates of collection between 2019 and 2020
What could explain this significant increase in weekly glass collection? According to Recyc-Québec's annual reports on the management of residual materials in Quebec, there was indeed a 40% increase in glass generated by Quebecers between 2015 and 2021, from 158,000 tons to 220,000 tons generated annually (Recyc-Quebec, 2020, 2023). However, the increase in Quebec's volume could not account for all of the variation between the two samples.
A change in citizens' attitudes could also have been an explanatory factor, but the second edition of Portrait des comportements et attitudes des citoyens québécois à l'égard des 3RV (SOM, 2021) does not mention of such a change in behavior. Instead, the study notes a province-wide increase of almost ten percent in the use of authorized collection points (e.g., voluntary drop-off centers and eco-centers), as well as an increase in access to residual materials management services.
Another important point to consider is that the first sample for 2019 represents the official launch of the voluntary collection program. It is therefore reasonable to assume that not all citizens were aware of the existence of the program. The effect of word-of-mouth and, although very limited, advertising (posters, local newspapers, local radio) may have had an impact on the dissemination of information about the locations of the containers (drop-off points) placed in the VSF area. It is therefore reasonable to assume that awareness of the drop-off points could be a factor explaining the increase in weekly glass collection. Therefore, to assess the impact of awareness on the performance of the collection system in its start-up phase, the parameter of awareness was added to the simulation model proposed in Labelle and Frayret (2023).
4 Implementing awareness in the simulation model
The concept of awareness introduced in this article removes a previous limitation of the model, which assumed that all agents are aware of the existence and location of collection points. In practical terms, this would mean that such systems are fully mature in terms of awareness. Adding this parameter is critical to assess the need to ramp up the capacity of the reverse logistics network and manage capital expenditure. The inclusion of awareness in the model is illustrated in Figure 1.
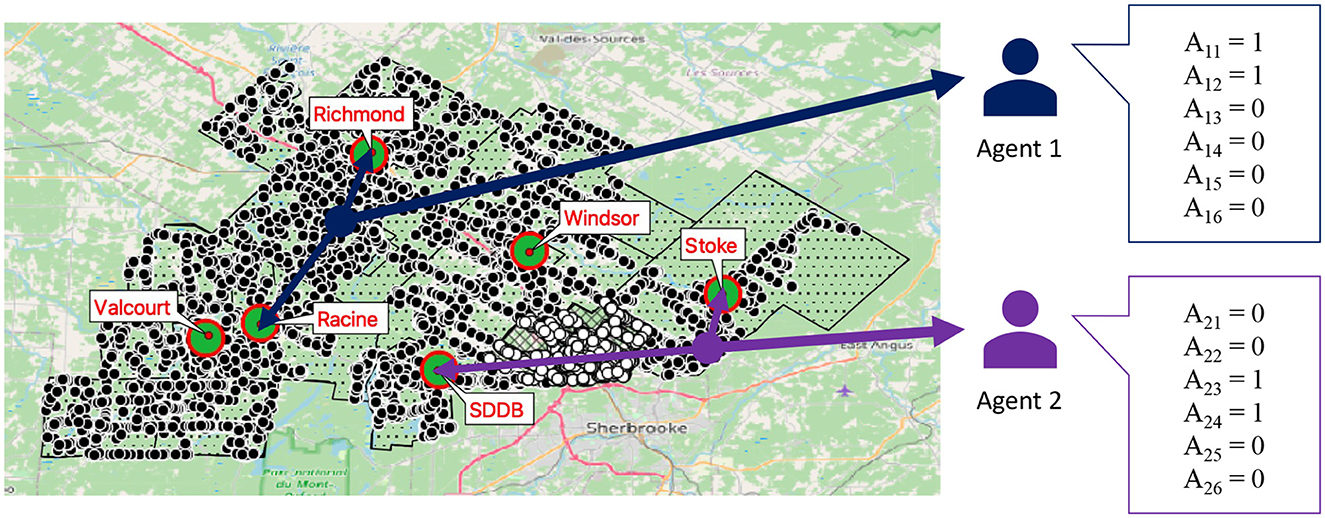
Figure 1. An example of two agents being aware of two drop-off points each.
As shown in Figure 1, each agent has a vector of 6 binary variables (Aid, where i is the agent and d is the drop-off) representing its awareness of each drop-off point. If the value of Aid is 0, the agent i is not aware of the drop-off point d and therefore cannot return bottles to it. Conversely, if the value is 1, the agent i can consider returning his bottles to d.
The drop-off point selection process is performed for each bottle. The agent randomly selects a drop-off point from its list of known drop-offs based on their attractiveness. The higher the drop-off's attractiveness, the more likely it will be selected, and vice versa.
Considering that two drop-off points (Racine and Saint-Denis-de-Brompton) were inaugurated a few years before the official launch of the program, an initial awareness parameter was also introduced into the model to represent the heterogeneity in the degree of awareness for each drop-off point. In this way, it is possible to model drop-off points that are more popular than others from the beginning of the simulation. The value of these parameters (i.e., Awareness and Initial Awareness) lies between 0 and 1, where a value of 1 means that the entire population is aware of the existence of this drop-off point. Thus, at the start of the simulation, all agents are assigned an awareness value of 0 or 1 for each drop-off point, depending on their respective initial awareness values.
Given the complexity of measuring, or even estimating, the level of awareness of the 34,000 inhabitants of VSF, in order to assess the impact of this aspect on the performance of the voluntary collection system, this paper presents an exploratory analysis of awareness through the calibration of this parameter in different social scenarios.
4.1 Impact of awareness on attractiveness
In preparation for the awareness calibration that is presented in section 5, an analysis of the relationship between attractiveness and awareness was performed to justify this case study experimental design assumption that the attractiveness of drop-off points is independent of the level of awareness. In the tourism and branding literature, where the aim is to understand the motivations behind choices of travel destinations or brand purchases, researchers are proposing measurement scales for awareness (Yoo et al., 2000; Sophonsiri and Polyorat, 2009) and attractiveness (Kim et al., 2001). Generally, these two parameters are independent and evaluated on the basis of 3 to 6 items, which are scored on a Likert scale (Ye, 2012).
However, in the model presented in this paper, attractiveness was instead calculated through reverse engineering with calibrations against empirical data. It would therefore be interesting to investigate further, with surveys, what might explain the attractiveness values obtained for each drop-off. As far as awareness is concerned, there is very little to know about a drop-off point, apart from its location, unlike a travel destination. It was therefore considered reasonable for the awareness parameter to be binary for agents.
While the attractiveness calibrated in Labelle and Frayret (2023) was calculated with 100% population awareness for all drop-off points, a sensitivity analysis of the attractiveness calibration was performed for 4 different levels (25%, 50%, 75%, and 100%) of awareness for the entire population. Thus, in the experiments presented in section 4, all agents have the same probability of being aware of a drop-off point. For example, an agent would have a 25% probability of being aware of each drop-off point individually. The results are shown in Table 4.
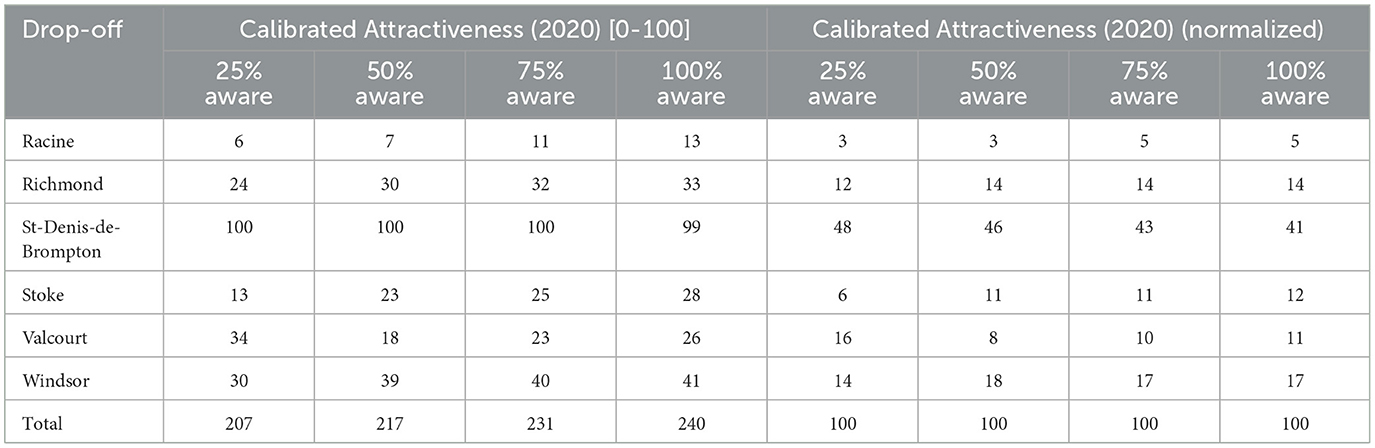
Table 4. Attractiveness calibration results for awareness levels of 25%, 50%, 75%, and 100%.
First, attractiveness calibration results were obtained with OptQuest using the attractiveness values calculated in Labelle and Frayret (2023) as a starting point and the same empirical sample, namely the first 13 weeks of 2020. As shown in Equation (1), the goal of the calibrations was to minimize the sum of the absolute differences between the simulation results and the empirical data for the percentages of total glass collected via the various drop-off points. The simulation results used for these calibrations were the average of 5 to 50 repetitions per iteration to obtain a 99% confidence interval and 0.1% error.
Where, d ε D [Racine, Richmond, SDDB, Stoke, Valcourt, Windsor].
Next, the calibrated attractiveness scores were normalized to ensure that they could be properly compared according to their relative attractiveness. Thus, attractiveness values calibrated at 25%, 50%, and 75% awareness were compared to attractiveness values at 100% awareness using paired t-tests. The attractiveness calibration results are shown in Table 4 and the t-test results are shown in Table 5. This statistical test allows us to accept the hypothesis that the attractiveness calibration is independent of the general awareness level of the population.
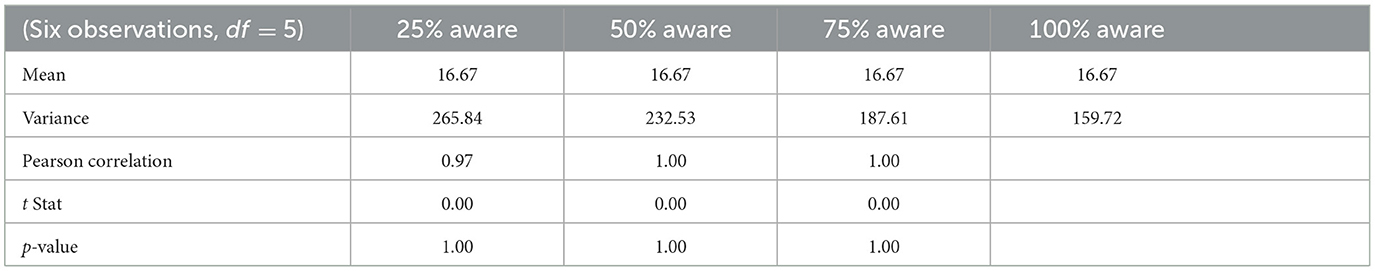
Table 5. Paired t-tests results for attractiveness calibration with normalized values.
Whatever the awareness value of the population tested, i.e., 25%, 50% or 75%, the attractiveness values calibrated for each drop-off points are always statistically similar to the values calibrated with 100% awareness. However, there is an increase in variance and a decrease in the correlation coefficient as awareness decreases, which is justified by the fact that the stochastic component is more prominent in these cases. What's interesting is that Valcourt's attractiveness is higher than that of Stoke and Windsor at an awareness level of 25%, whereas this is not the case at other awareness levels.
5 Potential impact of word-of-mouth effect on collected glass containers
To study the impact of awareness on reverse logistics flows, simple social networks were introduced in the model proposed by Labelle and Frayret (2023). By randomly connecting agents at the beginning of the simulation, agents can interact and exchange information (Gilbert, 1959; Erdos and Rényi, 1960). The choice to connect agents randomly rather than in small-world (Travers and Milgram, 1977; Watts and Strogatz, 1998), scale-free (Barabási and Albert, 1999), or other types of networks provides a baseline scenario and limits the degrees of freedom required to calibrate the model. As highlighted by Bohlmann et al. (2010) in their study, the authors conclude that random networks produce less variable results than other types of networks, which is important when calibrating a model efficiently. Although real-world networks are generally more clustered than random generated networks, the latter often have small diameters, which is a characteristic that real networks generally have as well (Travers and Milgram, 1977). Random networks are also prevalently used in the study of innovation diffusion via agent-based simulation (Kiesling et al., 2012).
Therefore, a word-of-mouth information diffusion mechanism is introduced into the simulation model. Periodically, agents meet and discuss drop-off points with another agent randomly selected from their network of contacts, and these agents interact with each other to inform each other of their knowledge of the existence and location of drop-off points. For example, an agent with knowledge of two of the six drop points could interact with an agent who knew of two others, and so after the interaction each agent would have knowledge of 4 of the 6 drop points.
5.1 Experiments
The experimental design described in this paper to study awareness consists of 2 steps. The first step is to calibrate initial awareness of drop-off points for a series of social interaction scenarios. In this step, only the 2019 sample is used, representing 26 weeks. A total of 11 calibrations were performed, representing 5 interaction frequencies and 2 network sizes. The interaction frequency indicates the duration in weeks between two interactions (2, 4, 6, 8, and 10 weeks), while the network size indicates the number of connections (10 or 20 connections) that each agent has. The eleventh scenario is the case where there is no interaction between agents. Table 6 shows the results of these calibrations. The objective of the calibrations was to minimize the sum of the absolute differences between the simulation results and the empirical data for the percentages of the total glass collected through the different redemption points, but this time; the difference between what is simulated and the empirical data for the total number of tons collected at the drop-off points was also included in the objective function, as shown in Equation 2.
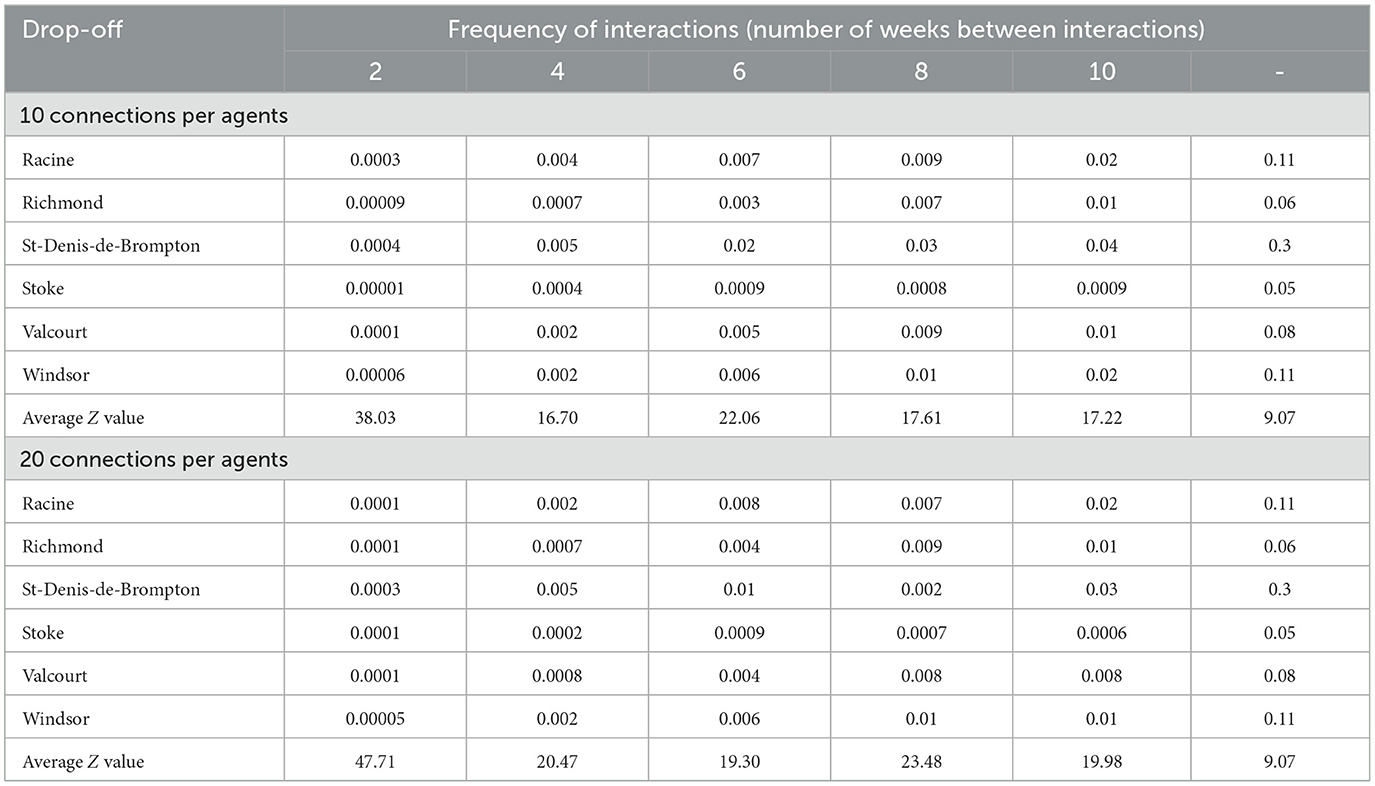
Table 6. Calibrated initial awareness values for varying social interaction scenarios.
Calibrations were performed using the OptQuest module built into AnyLogic. From 5 to 50 repetitions were performed per iteration to obtain a confidence interval of 99% and a percentage error of 0.1%. The average Z values calculated for the objective function are shown in Table 6. It can be seen that the results between 10 and 20 connections per agent are very similar, but that the average Z values for the case of 10 connections per agent are lower, indicating that the simulation results are closer to the empirical values. For this reason, only the 10-connection case is kept for the next step.
In the second step, simulations were run for the different social interaction scenarios, using the initial awareness values found in the previous step. The duration of the simulations in this case was 39 weeks, corresponding to the duration of the two samples, i.e., the last 26 weeks of 2019 and the first 13 weeks of 2020. Therefore, the goal of these experiments is to assess whether the awareness calibration using only the first sample (26 weeks) produces simulation results (i.e., tons of glass collected at collection points) that remain valid when simulated for 39 weeks. Valid results would indicate that the inclusion of awareness and social interactions in the simulation model can approximate the evolutionary dynamics of the system as observed with the first and second samples.
For these experiments, 10 replications were performed, which was sufficient to obtain results where the standard deviations of the percentages for the different behaviors are < 1%. The average results for the 10 replications of the number of tons going to the three possible end-of-life behaviors are presented in Table 7. The disaggregated results for the collection behavior, i.e. the number of tons collected at each collection point for each period (2019 and 2020), are presented in Table 8, and the differences between these simulation results and the empirical data are shown in Figure 2
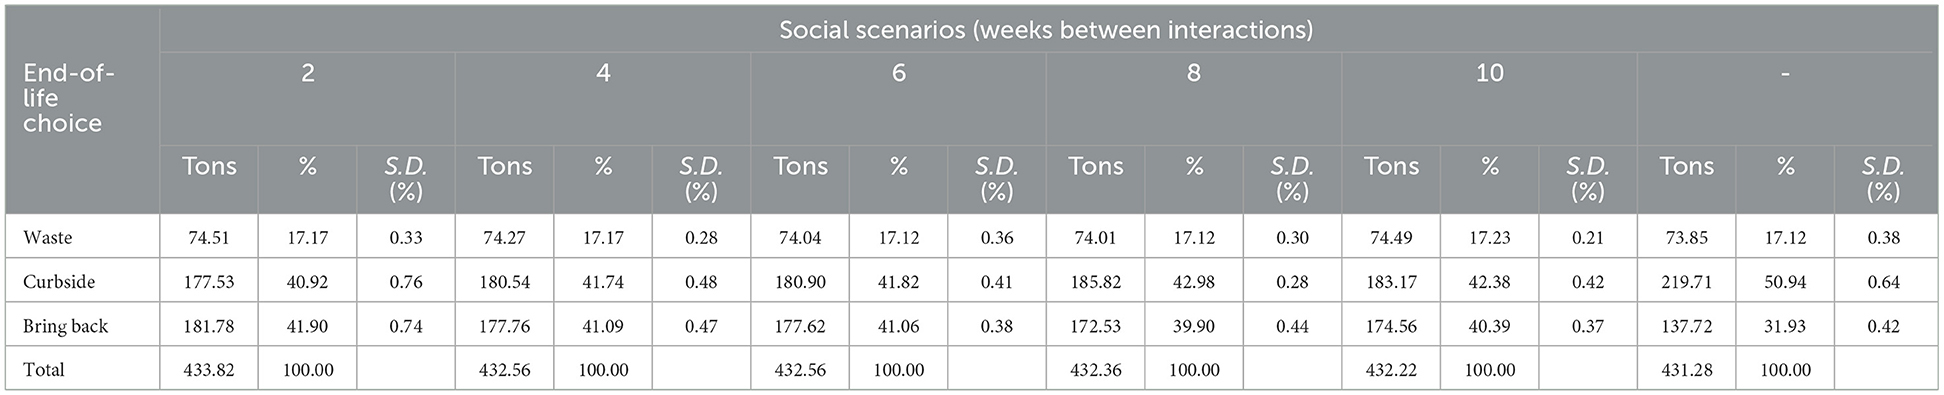
Table 7. Simulation results for 6 social interactions scenarios with 10 connections per agents.
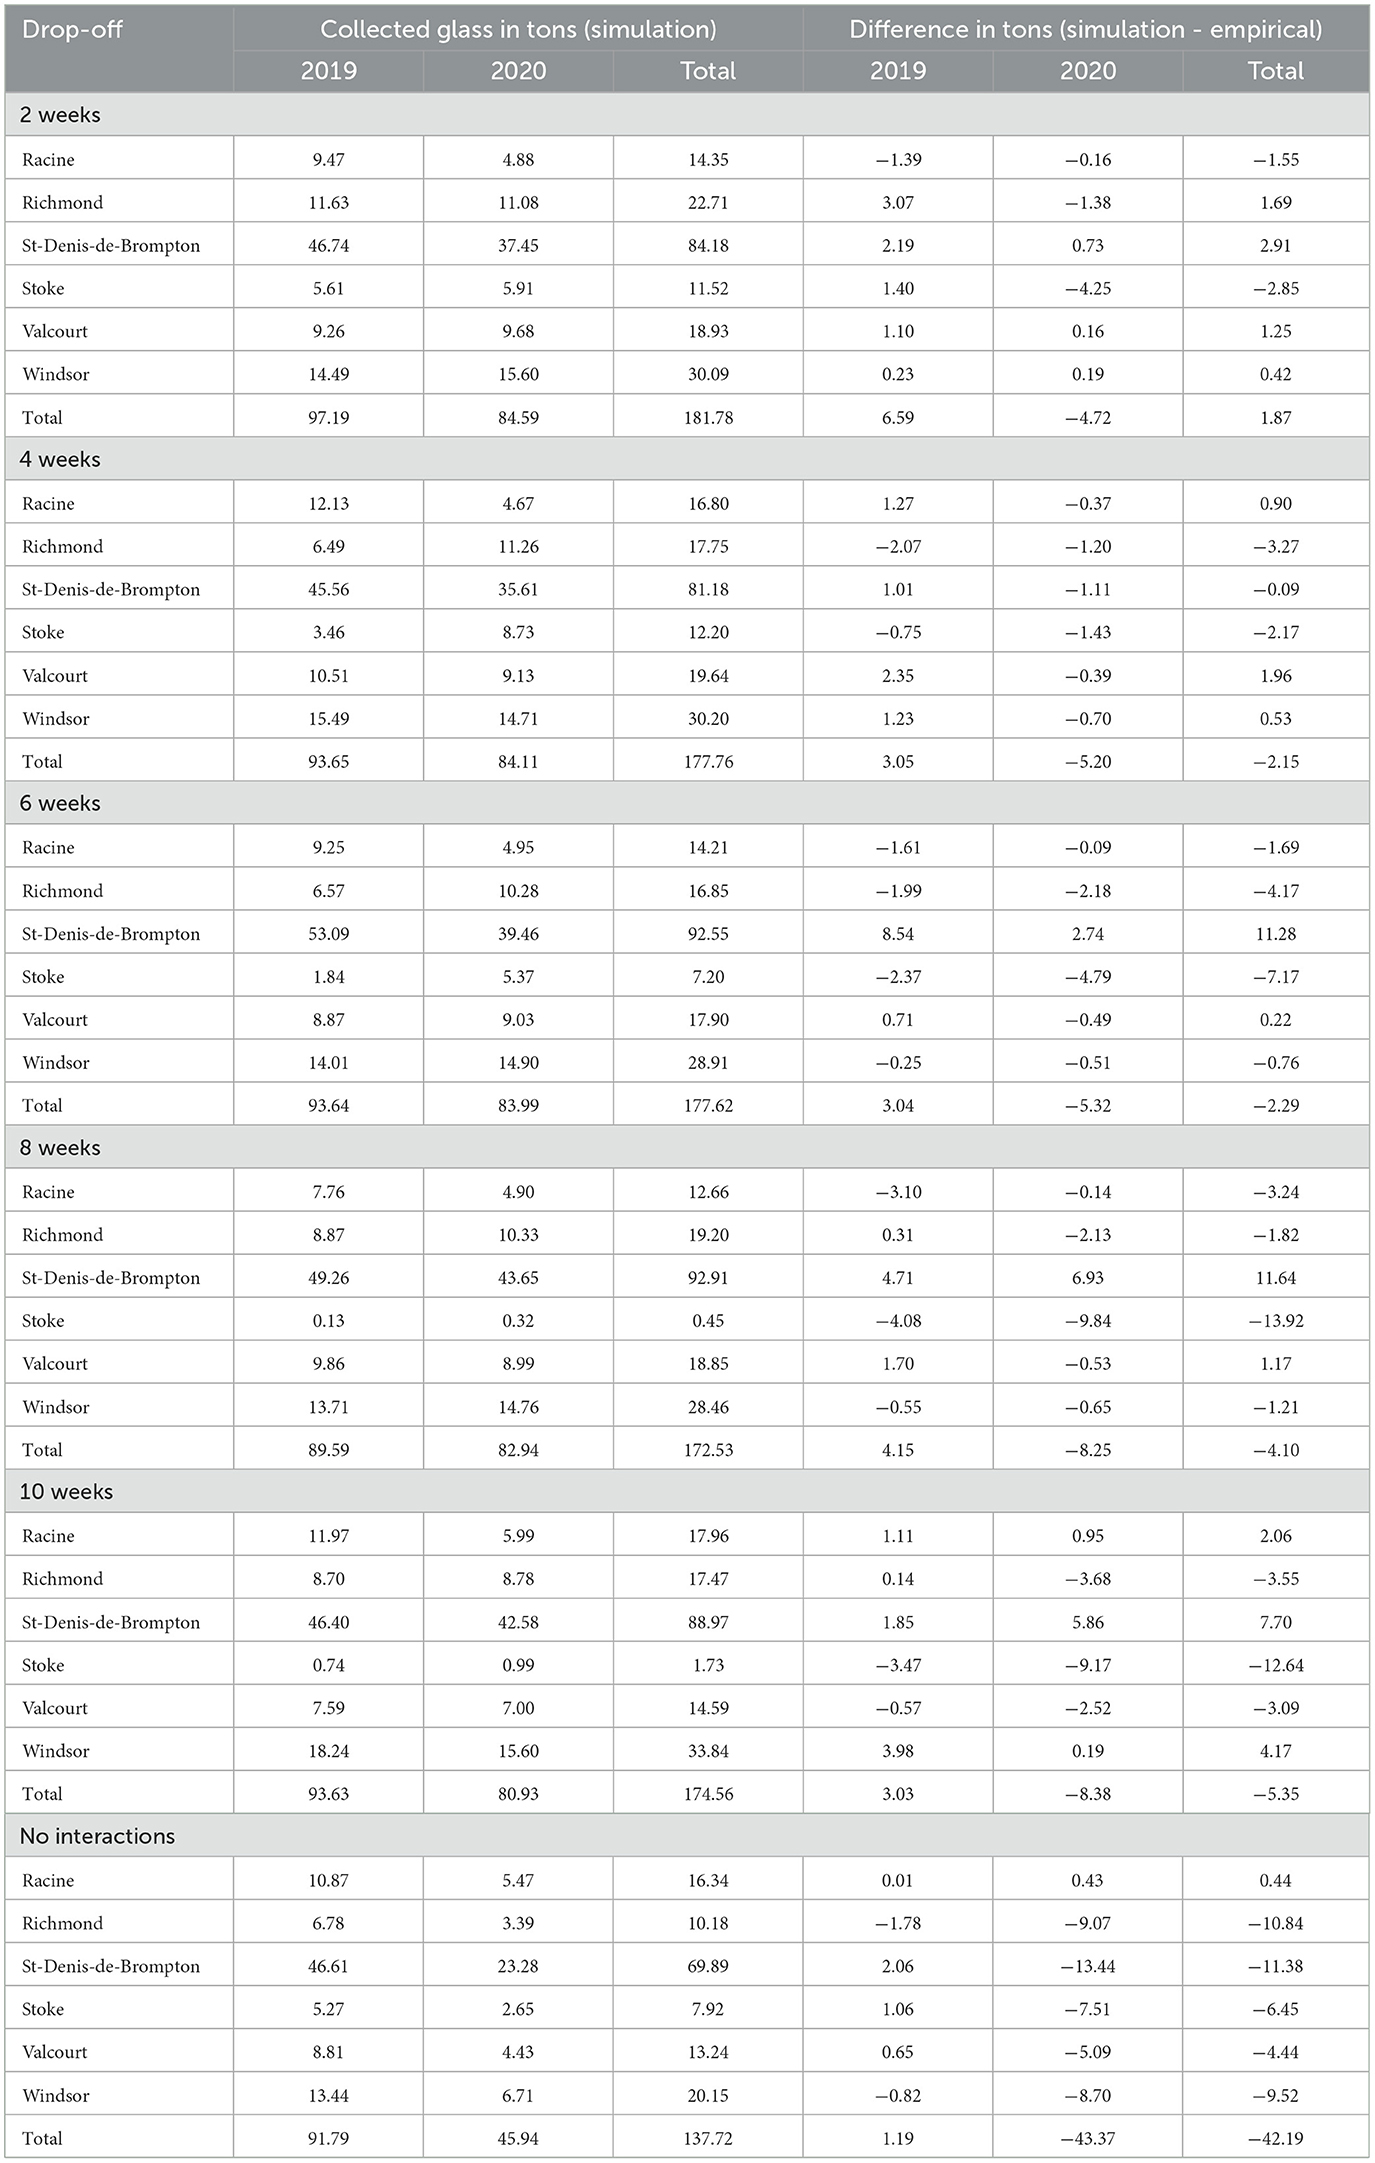
Table 8. Simulation results of glass collected at each depot center for 6 social interactions scenarios with 10 connections per agents.
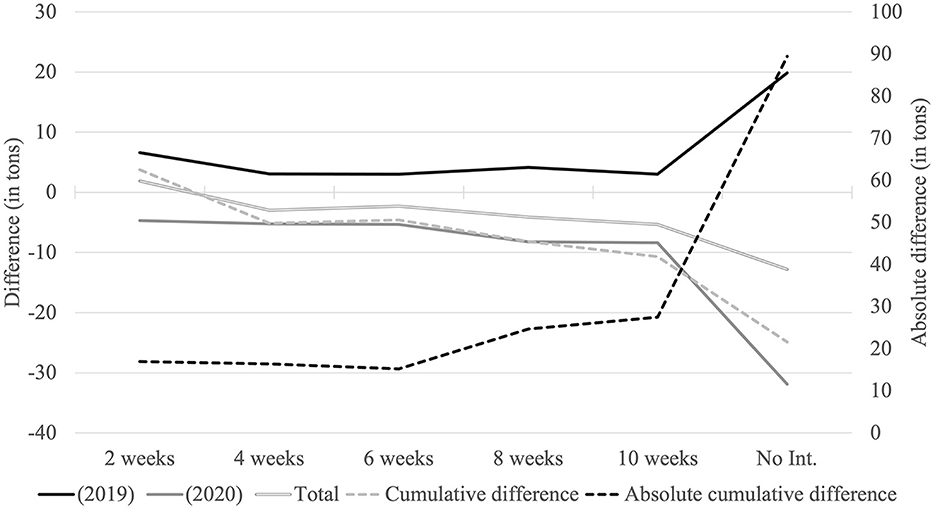
Figure 2. Difference between simulation results and empirical data for the tons of glass collected through drop-offs per social interactions scenarios.
5.2 Results analysis
While the aim of this paper is to study the collection phenomenon quantitatively using an agent-based simulation model to gain a better understanding of consumer behavior and possibly facilitate the design of collection networks, the results are very encouraging. Indeed, the analysis of simulation results enabled the rejection of social scenarios that were not statistically significant when compared with empirical data. On the other hand, it was possible to identify scenarios that are quite comparable to the phenomenon observed.
5.2.1 Unsuccessful model validations
As shown in Table 9, which presents the statistical results of the comparison between the simulation results and the empirical values for the distribution of tons collected at the drop-off points, three statistical tests (paired t-tests) have a p < 0.05. This means that scenarios with at least one of their p < 0.05 are not combinations of parameters that accurately reflect the observed phenomenon and we should reject, for these scenarios, the hypothesis that the simulation results are similar to the empirical data. These scenarios are as following: interactions every 4 weeks and the scenario without interactions.
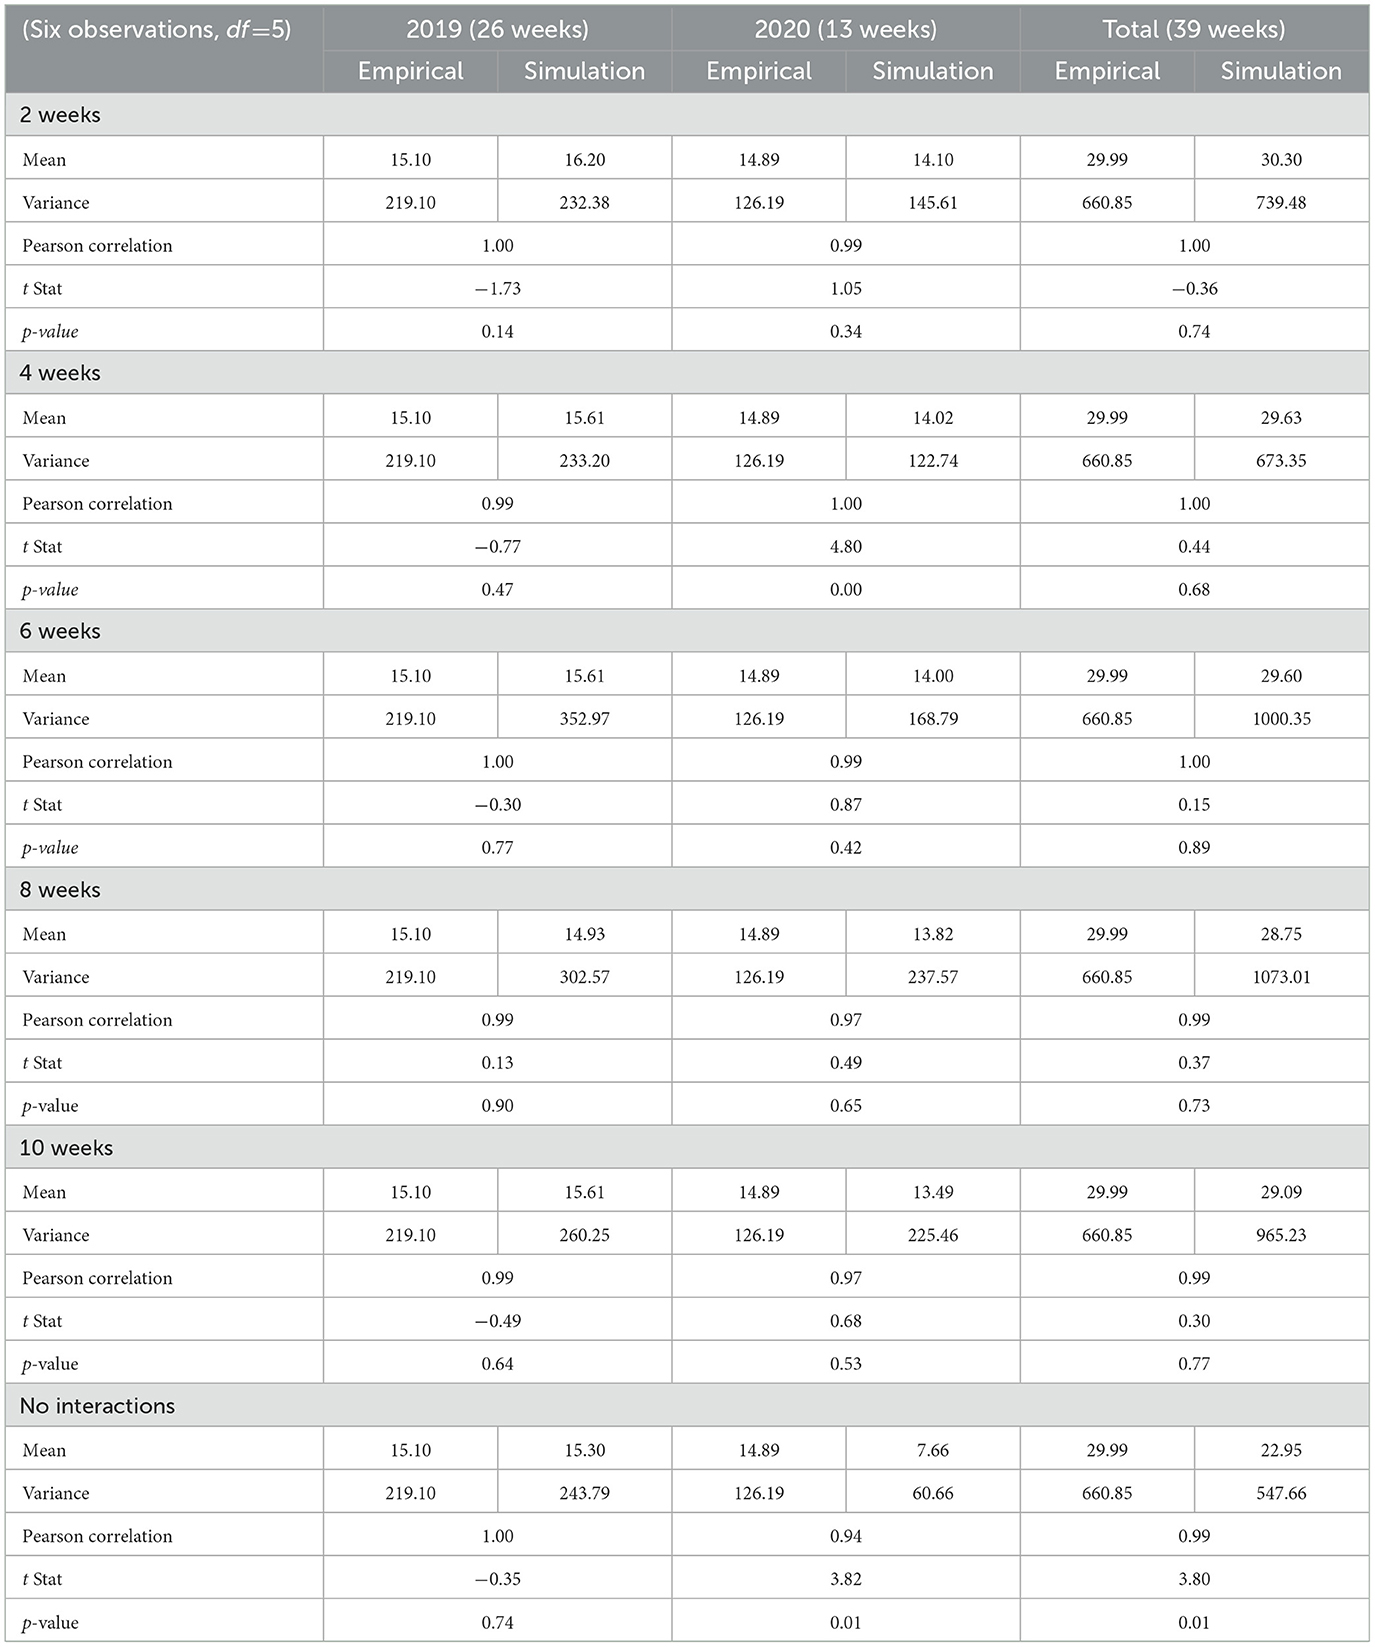
Table 9. Paired t-test comparing simulations results to empirical data for the tons of glass collected at each drop-off location.
For the 2020 results with 4-weekly interactions, it is the only case where the number of tons collected is lower than the empirical data for all depots. Considering that the calibrations minimize the absolute deviations, it is possible that the initial awareness values calibrated with the 2019 sample are a combination of values that on the one hand optimize the objective function, but which do not satisfy the level of representativeness of the reality of the system dynamics when the 2020 period is included in the simulation. The fact that the total amount collected at the drop-off points is also included in the objective function could make it possible to obtain such a result (i.e., where the accuracy of the total would be prioritized over the accuracy of the distribution of the tons collected at the various drop-off points and vice versa).
For the results of the scenario without interactions, we note that over a period of 26 weeks, the initial awareness seems sufficient to support a number of tons collected comparable to what is observed empirically. However, from 2020 onwards, there is an increase in the rate of glass returned to depots that is clearly not captured in the simulations, as shown by the low total amount of glass returned to the collection points.
5.2.2 Successful model validations
Overall, the simulation model can produce results that are comparable to what is observed in reality. However, the simulation results seem to be valid only in cases where social interaction actually takes place, i.e., when the p > 0.05. This finding suggests that the word-of-mouth phenomenon, combined with the basis that knowledge of the existence of drop-off points is heterogeneously distributed, could explain some of the growth in weekly return rates observed when comparing the two empirical data samples (see Section 3.1).
According to the results in Figure 2 and Tables 8, 9, the scenario that best represents the real situation is the one with interactions between agents every 6 weeks. This is the case with the smallest absolute cumulative difference between the simulation results and the empirical data, and it is also the case with the highest p-value for the total collected after 39 weeks.
5.2.3 Model inaccuracies
It's worth noting that for all scenarios, the number of tons collected in 2020 is systematically lower than the actual volume. On the other hand, the opposite is true for 2019, where the collected tons are overestimated. These results may suggest an overestimation of initial awareness and an underestimation of awareness diffusion, which could potentially be counterbalanced by the introduction of an additional diffusion vector: advertising (posters, newspapers, radio, etc.). The structure of the social network could also be responsible. Indeed, as Delre et al. (2007), innovation seems to spread more rapidly in more regular networks than in random ones.
6 Discussion, limitations, and opportunities
Given that the case study collection system is based on a voluntary citizen initiative, the OVV program did not really have a budget for advertising. According to OVV experts, word-of-mouth was indeed the main vector for spreading information, so from a qualitative point of view, the qualitative validation of the simulation model in terms of its ability to reproduce expected observable behavior is achieved.
Of course, like any simulation model, the one presented in this paper has certain limitations. First and foremost, the small number of empirical observations used to validate the model implies that the results obtained are only preliminary, or rather exploratory, and therefore the interpretation that can be made from them is very limited. Also, the principle that the initial perception is general for the whole population and independent of the agents' location is a blatant simplification of the real situation. To obtain a more accurate model, it would have been interesting to ensure that agents living close to a drop-off point are more likely to be aware of its availability. Testing more types of social networks could also have added a degree of finesse to the experiments, but it would have also added degrees of freedom that would have had to be managed. The random network with a fixed number of connections was therefore the option that provided the necessary level of stability to the results, given the exploratory nature of the analysis.
Other models of social interactions that are commonly used in ABMS could have been considered, see section 2.2. Nonetheless, as pointed out by Wood (2000), it is possible to influence and even change the attitude of individuals toward a behavior through social interactions, as opposed to influencing the intention to perform a behavior. Two agent-based simulation models have used this concept to include the influence of the social aspect (Kaufmann et al., 2009; Rai and Robinson, 2015). To do so, they used the Relative Agreement Model of Deffuant et al. (2002), which proposes a model to reproduce the impact of social interactions on the opinions of individuals. Given the continuous opinion spectrum of the agents in this paper's model, it would be interesting to see how the Relative Agreement Model could be used to integrate the TPB's social norm into the model (Chen et al., 2020).
Despite the fact that the model was validated with data from a specific case, namely the Val-Saint-François MRC's voluntary drop-off program, the model's robustness should be tested with a case study on other populations. Along this line, because the model can be used for other products, it would also be interesting to validate its ability to adapt to other products such as aluminum cans or plastic bottles.
7 Conclusion
From the outset, the paper presents to researchers, experts or anyone interested in the field of reverse logistics simulation; an approach for the calibration, experimentation and validation of a complex agent-based simulation of a reverse logistics collection system. The peculiarity of the model is that it requires a significant amount of data to be parameterized, including behavioral studies, empirical studies for calibration and validation, socio-demographic studies (census), non-public databases on residential address geolocation, and more. On the other hand, this makes it a very malleable, consistent and accurate model.
The model can also be used to estimate dynamic logistics requirements for reverse logistics systems. That is, to try to answer questions such as: how often do materials need to be moved from depots to packers and/or recyclers?
The model could be adapted to include another information dissemination channel, such as the media, to better estimate the need for advertising campaigns to match investments with potential gains in tons collected. It is also possible to reverse-engineer the calibration of initial awareness, possibly in combination with attractiveness, to assess which drop-off points would merit some form of investment in either awareness or attractiveness, and then use the simulation to evaluate potential gains and returns on investment.
Although the model cannot determine which word-of-mouth scenario actually occurred in the VSF, it can show that word-of-mouth would be a reasonable explanation for the growth and stabilization of the return rates. However, there are certainly other factors that could explain this phenomenon, such as an increase in the volume of residual materials produced by the Quebec population or changes in citizens' attitudes.
The rigorous approach outlined in the article clearly demonstrates the ability of agent-based models to be configured to complex socio-technological reverse logistics systems. The particularity of these systems is that human decisions play a crucial role in the distribution of material flows in the economy. To produce simulation models that are valid and sufficiently accurate to support decision making, it is therefore important to understand consumer behavior and to be able to model it correctly.
Data availability statement
The original contributions presented in the study are included in the article/supplementary material, further inquiries can be directed to the corresponding author.
Author contributions
AL: Conceptualization, Formal analysis, Investigation, Methodology, Project administration, Software, Validation, Visualization, Writing – original draft, Writing – review & editing. J-MF: Conceptualization, Funding acquisition, Methodology, Project administration, Resources, Supervision, Writing – review & editing.
Funding
The author(s) declare financial support was received for the research, authorship, and/or publication of this article. This research was funded by the Natural Sciences and Engineering Research Council of Canada, number RGPIN-2016-06400, and Polytechnique Montréal.
Acknowledgments
The authors would like to thank all the members of the Opération Verre-Vert Committee, with a special consideration for Jean-Claude Thibault and Karel Ménard.
Conflict of interest
The authors declare that the research was conducted in the absence of any commercial or financial relationships that could be construed as a potential conflict of interest.
Publisher's note
All claims expressed in this article are solely those of the authors and do not necessarily represent those of their affiliated organizations, or those of the publisher, the editors and the reviewers. Any product that may be evaluated in this article, or claim that may be made by its manufacturer, is not guaranteed or endorsed by the publisher.
References
Abid, S., and Mhada, F. Z. (2021). Simulation optimisation methods applied in reverse logistics: a systematic review. Int. J. Sust. Eng. 14, 1463–1483. doi: 10.1080/19397038.2021.2003470
Abid, S., Radji, S., and Mhada, F. Z. (2019). “Simulation techniques applied in reverse logistic: a review,” in 2019 International Colloquium on Logistics and Supply Chain Management (LOGISTIQUA). IEEE, 1–6.
Agnusdei, G. P., Gnoni, M. G., and Tornese, F. (2019). “Modelling and simulation tools for integrating forward and reverse logistics: a literature review,” in European Modeling and Simulation Symposium. CAL-TEK Srl, 317–326.
Ajzen, I. (1991). The theory of planned behavior. Org. Behav. Hum. Dec. Proc. 50, 179–211. doi: 10.1016/0749-5978(91)90020-T
Alonso-Betanzos, A., Sánchez-Maroño, N., Fontenla-Romero, O., Polhill, J. G., Craig, T., Bajo, J., et al. (2017). Agent-Based Modeling of Sustainable Behaviors. Cham: Springer.
Barabási, A. L., and Albert, R. (1999). Emergence of scaling in random networks. Science 286, 509–512. doi: 10.1126/science.286.5439.509
Bohlmann, J. D., Calantone, R. J., and Zhao, M. (2010). The effects of market network heterogeneity on innovation diffusion: an agent-based modeling approach. J. Prod. Innov. Manage. 27, 741–760. doi: 10.1111/j.1540-5885.2010.00748.x
Bourceret, A., Amblard, L., and Mathias, J. D. (2022). Adapting the governance of social–ecological systems to behavioural dynamics: an agent-based model for water quality management using the theory of planned behaviour. Ecol. Econ. 194:107338. doi: 10.1016/j.ecolecon.2021.107338
Byrka, K. Jȩdrzejewski, A., Sznajd-Weron, K., and Weron, R. (2016). Difficulty is critical: The importance of social factors in modeling diffusion of green products and practices. Renew. Sust. Energ. Rev. 62, 723–735. doi: 10.1016/j.rser.2016.04.063
Chen, G., Su, W., Mei, W., and Bullo, F. (2020). Convergence properties of the heterogeneous Deffuant–Weisbuch model. Automatica 114:108825. doi: 10.1016/j.automatica.2020.108825
Deffuant, G., Amblard, F., Weisbuch, G., and Faure, T. (2002). How can extremism prevail? A study based on the relative agreement interaction model. J. Artif. Soc. Soc. Simul. 5.
Deloitte (2018). Étude sur les dépôts volontaires de verre. Available online at: https://www.recyc-quebec.gouv.qc.ca/sites/default/files/documents/etude-depots-volontaires-verre-rapport-complet.pdf
Delre, S. A., Jager, W., and Janssen, M. A. (2007). Diffusion dynamics in small-world networks with heterogeneous consumers. Comput. Mathem. Org. Theor. 13, 185–202. doi: 10.1007/s10588-006-9007-2
Dugundji, E. R., and Gulyás, L. (2008). Sociodynamic discrete choice on networks in space: impacts of agent heterogeneity on emergent outcomes. Environ. Plann. B Plann. Design 35, 1028–1054. doi: 10.1068/b33021t
Erdos, P., and Rényi, A. (1960). On the evolution of random graphs. Publ. math. inst. hung. acad. sci 5, 17–60.
Ghali, M. R., Frayret, J. M., and Ahabchane, C. (2017). Agent-based model of self-organized industrial symbiosis. J. Cleaner Prod. 161, 452–465. doi: 10.1016/j.jclepro.2017.05.128
Gilbert, E. N. (1959). Random graphs. The Annal. Mathemat. Stat. 30, 1141–1144. doi: 10.1214/aoms/1177706098
Huete-Alcocer, N. (2017). A literature review of word of mouth and electronic word of mouth: Implications for consumer behavior. Front. Psychol. 8:271126. doi: 10.3389/fpsyg.2017.01256
Kara, S., Rugrungruang, F., and Kaebernick, H. (2007). Simulation modelling of reverse logistics networks. Int. J. Prod. Econ. 106, 61–69. doi: 10.1016/j.ijpe.2006.04.009
Kaufmann, P., Stagl, S., and Franks, D. W. (2009). Simulating the diffusion of organic farming practices in two New EU Member States. Ecol. Econ. 68, 2580–2593. doi: 10.1016/j.ecolecon.2009.04.001
Kiesling, E., Günther, M., Stummer, C., and Wakolbinger, L. M. (2012). Agent-based simulation of innovation diffusion: a review. Central Eur. J. Oper. Res. 20, 183–230. doi: 10.1007/s10100-011-0210-y
Kim, C. K., Han, D., and Park, S. B. (2001). The effect of brand personality and brand identification on brand loyalty: applying the theory of social identification. Jap. Psychol. Res. 43, 195–206. doi: 10.1111/1468-5884.00177
Labelle, A., and Frayret, J. M. (2018). Agent-based model for end-of-life product flow analysis. Resources 7:42. doi: 10.3390/resources7030042
Labelle, A., and Frayret, J. M. (2023). First-mile reverse logistics: an agent-based modelling and simulation application for glass bottle recovery. J. Cleaner Prod. 422:138574. doi: 10.1016/j.jclepro.2023.138574
Peres, R., Muller, E., and Mahajan, V. (2010). Innovation diffusion and new product growth models: a critical review and research directions. Int. J. Res. Market. 27, 91–106. doi: 10.1016/j.ijresmar.2009.12.012
Rai, V., and Robinson, S. A. (2015). Agent-based modeling of energy technology adoption: Empirical integration of social, behavioral, economic, and environmental factors. Environ. Modelling Softw. 70, 163–177. doi: 10.1016/j.envsoft.2015.04.014
Recyc-Quebec (2020). Bilan 2018 de la gestion des matières résiduelles au Québec. Available online at: https://www.recyc-quebec.gouv.qc.ca/sites/default/files/documents/bilan-gmr-2018-complet.pdf
Recyc-Quebec (2023). Bilan 2021 de la gestion des matières résiduelles au Québec. Available online at: https://www.recyc-quebec.gouv.qc.ca/sites/default/files/documents/bilan-gmr-2021-complet.pdf
SOM (2021). Portrait des comportements et attitudes des citoyens québécois à l'égard des 3RV. Available online at: https://www.recyc-quebec.gouv.qc.ca/sites/default/files/documents/etude-portrait-comportements-citoyens2021.pdf
Sophonsiri, S., and Polyorat, K. (2009). The impact of brand personality dimensions on brand association and brand attractiveness: the case study of kfc in thailand. J. Global Bus. Technol. 5, 1–14.
Tong, X., Nikolic, I., Dijkhuizen, B., van den Hoven, M., Minderhoud, M., Wäckerlin, N., et al. (2018). Behaviour change in post-consumer recycling: applying agent-based modelling in social experiment. J. Clean. Prod. 187, 1006–1013. doi: 10.1016/j.jclepro.2018.03.261
Tong, X., Yu, H., Han, L., Liu, T., Dong, L., Zisopoulos, F., et al. (2023). Exploring business models for carbon emission reduction via post-consumer recycling infrastructures in Beijing: an agent-based modelling approach. Res. Conserv. Recycl. 188:106666. doi: 10.1016/j.resconrec.2022.106666
Travers, J., and Milgram, S. (1977). An experimental study of the small world problem. Soc. Netw. 12, 179–97. doi: 10.1016/B978-0-12-442450-0.50018-3
Walzberg, J., Burton, R., Zhao, F., Frost, K., Muller, S., Carpenter, A., et al. (2022). An investigation of hard-disk drive circularity accounting for socio-technical dynamics and data uncertainty. Res. Conserv. Recycl. 178:106102. doi: 10.1016/j.resconrec.2021.106102
Walzberg, J., Carpenter, A., and Heath, G. A. (2021). Role of the social factors in success of solar photovoltaic reuse and recycle programmes. Nat. Energ. 6, 913–924. doi: 10.1038/s41560-021-00888-5
Walzberg, J., Frayret, J. M., Eberle, A. L., Carpenter, A., and Heath, G. (2023). Agent-based modeling and simulation for the circular economy: lessons learned and path forward. J. Ind. Ecol. 27, 1227–1238. doi: 10.1111/jiec.13423
Watts, D. J., and Strogatz, S. H. (1998). Collective dynamics of ‘small-world'networks. Nature 393, 440–442. doi: 10.1038/30918
Wood, W. (2000). Attitude change: Persuasion and social influence. Ann. Rev. Psychol. 51, 539–570. doi: 10.1146/annurev.psych.51.1.539
Ye, S. (2012). The impact of destination personality dimensions on destination brand awareness and attractiveness: australia as a case study. Tourism Int. Interdis. J. 60, 397–409.
Yoo, B., Donthu, N., and Lee, S. (2000). An examination of selected marketing mix elements and brand equity. J. Acad. Market. Sci. 28, 195–211. doi: 10.1177/0092070300282002
Keywords: agent-based modeling and simulation, circular economy, word-of-mouth, wine bottles, recycling, Theory of Planned Behavior
Citation: Labelle A and Frayret J-M (2024) Word-of-mouth in agent-based simulation model of reverse logistics. Front. Sustain. 5:1264461. doi: 10.3389/frsus.2024.1264461
Received: 20 July 2023; Accepted: 21 June 2024;
Published: 05 July 2024.
Edited by:
Konstantinos P. Tsagarakis, Technical University of Crete, GreeceReviewed by:
Biswajit Sarkar, Yonsei University, Republic of KoreaKhairunnisa Musari, Kiai Haji Achmad Siddiq State Islamic University (UIN KHAS), Indonesia
Copyright © 2024 Labelle and Frayret. This is an open-access article distributed under the terms of the Creative Commons Attribution License (CC BY). The use, distribution or reproduction in other forums is permitted, provided the original author(s) and the copyright owner(s) are credited and that the original publication in this journal is cited, in accordance with accepted academic practice. No use, distribution or reproduction is permitted which does not comply with these terms.
*Correspondence: Alexandre Labelle, YWxleGFuZHJlLmxhYmVsbGVAcG9seW10bC5jYQ==