 Mingxi Zhao
 Zixiang Meng1†
 Rende Li
- 1Sino-German College, University of Shanghai for Science and Technology, Shanghai, China
- 2Library, University of Shanghai for Science and Technology, Shanghai, China
For 2030, the Agenda for Sustainable Development sets out 17 goals for sustaining ecological and social growth, known as the Sustainable Development Goals (SDGs), which have mobilized countries around the world to integrate these goals into their national development strategies. However, the Agenda does not explain how these goals are interlinked, which limits their implementation. This paper therefore selects indicator data for 17 SDGs from the World Bank website for four groups of countries to estimate the network structure of the SDGs and the synergies and trade-offs between them, based on the Spearman coefficient. Based on this, the paper further uses a VAR model to identify priority targets among the SDGs and to predict the impact of achieving these targets 2 years earlier on other SDGs. It is found that the SDGs interact with each other in different historical periods, showing both synergies and trade-offs. And as the highest priority goal, the predictions in this paper suggest that SDG 6 has a strong positive impact on SDG 4 and SDG 8. This paper can help policy makers to allocate resources more effectively, maximize benefits, coordinate actions, adapt to future challenges and achieve global sustainable development goals.
1. Introduction
The Sustainable Development Goals (SDGs) structure serves as a crucial element of the United Nations’ 2030 Agenda, striving to promote a brighter and more affluent future for Earth and its inhabitants. This ambitious action plan includes 17 overarching goals and 169 targets (Aly et al., 2022) that address the major environmental, social and economic challenges associated with modern society.
As the discussion of socio-economic development shifts to a multidimensional perspective, achieving sustainable development requires a comprehensive and systematic approach, which entails combining the interests and needs of various stakeholders as well as policies and actions to achieve a common goal. National Central Statistical Offices (CSOs) and recent studies (Kroll, 2015; Nicolai et al., 2015; Sachs et al., 2016; Schmidt-Traub et al., 2017; Russell et al., 2018; Singh et al., 2018; Pradhan, 2019; Harris et al., 2020), each SDG is usually quantified to assess the performance of individual countries on each SDG. Global institutions and development experts emphasize the necessity of a network structure to examine the intricate connections among the economic, social, and environmental aspects of the SDGs, encompassing both adverse and favorable feedback loops. Despite the high quality of data, these interlinkages have not been fully taken into account. To address this gap, this paper investigates the interlinkages between the SDGs at a granular level to reveal both trade-offs (negative feedback) and synergies (positive feedback) between them. The identification of synergies and trade-offs is particularly crucial for governments when formulating development strategies for social, economic, and sustainability indicators due to the complexity arising from the interdependencies between the SDGs. Such analysis can benefit policy makers, the business sector, and society at large by enabling them to consider the impact of actions on other objectives while achieving specific goals and ensuring that the actions taken are sustainable (Ospina-Forero et al., 2022). Referring to Laumann et al. (2022) grouping instructions, this paper divides the world’s countries into four country groups (Low Income countries, Lower middle Income countries, Upper middle Income countries and High Income countries) based on GNI, with eight countries in each group selected for which high-quality data are available. Each SDG consists of several relevant indicators, which allows us to identify in more detail the channels of potential interlinkages between the individual SDGs.
Secondly, we identified the SDG priorities. While the SDGs are intended to be implemented as an ‘indivisible whole’ (United Nations, 2015), planning within resource constraints (ICSU, 2017) needs to prioritize the most important SDGs and targets that have a greater impact on the environment before including other targets. Some literature suggests that maximizing synergies between goals can accelerate their achievement (Breuer et al., 2019). While all SDGs generally have synergies, they may not be at the same level (Nilsson et al., 2016), and implementing one goal at a different time in history may have a negative impact on another. Identifying the interactions and impacts of these goals with other goals can therefore provide a more comprehensive insight into the effective allocation of resources and maximization of goal achievement. Numerous dangerous epidemics have affected the contemporary world since the end of the 20th century, the most notorious of which was COVID-19. This has required significant financial and resource commitments from governments to manage the spread of the virus. Thus, even though sustainability would benefit all societies, it is likely to be neglected or abandoned as a priority. In situations of high uncertainty, government policies may become more conservative or reactive, and it is crucial to understand in advance that improving some goals can automatically improve others and produce positive outcomes (Asadikia et al., 2021).
Using the Spearman method, this paper examines the correlation between SDGs and constructs a network structure over time. A VAR model is then applied to identify the priority goal and predict the impact after realizing the goal in advance. The results of this research offer insights into the potential and limitations of sustainable development and may provide guidance to policymakers and stakeholders.
The remainder of the paper is organized as follows: Section 2 reports on the data set, selection and processing process and research methodology, Section 3 presents the results of the paper and Section 4 provides our conclusions and recommendations.
2. Research design
In this section, this paper discusses data resources and methods of analysis used for this study.
2.1. Data source and process
2.1.1. Data source
The measurement of time series for Sustainable Development Goals can be obtained from multiple sources. In this study, a time series of metrics outlined by the World Bank (2021) was employed, featuring 400 indicators to assess advancements in the 17 Sustainable Development Goals. The choice was made due to these indicators’ emphasis on outcomes and influence (Laumann et al., 2022), as well as their enhanced intuitiveness and persuasiveness. However, for the thirteenth Sustainable Development Goal – Climate Action, the World Bank only has 1 year of data. Therefore, this article searched for indicator data for this goal on the official United Nations website (Laumann et al., 2022). As a result, the dataset for this article includes approximately 400 indicators for 32 countries from 2002 to 2021, with each indicator related to a Sustainable Development Goal.
2.1.2. Country grouping
The impact of each country’s economic level on the Sustainable Development Goals (SDGs) is crucial (Ernst et al., 2018). Countries with higher economic levels are more likely to invest more resources in achieving the SDGs, making them more likely to make progress in all the goals (Barbier and Burgess, 2017; Chen et al., 2022). On the other hand, countries with lower economic levels face more challenges, including poverty, hunger, poor health conditions, and low education levels. Therefore, they need more support and cooperation in achieving the SDGs.
Referring to the existing literature (Laumann et al., 2022), this paper selects eight countries in each country group for which high-quality data are available, based on the GNI-based grouping of countries (high-income, upper-middle-income, lower-middle-income, low-income).
In the process of achieving the SDGs, countries need to take different measures to adapt to their specific economic and social conditions. For example, countries with higher economic levels usually focus more on energy and environmental issues, while those with lower economic levels tend to prioritize solving infrastructure and education problems. Therefore, understanding the impact of each country’s economic level on achieving the SDGs is crucial to develop appropriate policies and measures.
2.1.3. Data selection
This paper selected approximately 250 indicators from the World Bank, all of which fall under one of the 17 Sustainable Development Goals UN. Initially, regarding data choice, this study opted to quantify all data in US dollars, given that around 60% of global central banks’ foreign exchange reserves are held in assets denominated in this currency. Additionally, most commodity contracts, including those for oil, are priced and settled in US dollars, which also serves as the primary currency for pricing and settling most international financial transactions. Therefore, this paper downloaded US dollar-denominated data from the World Bank. For example, for the two sets of data ‘GDP current LCU’ and ‘GDP current USD,’ this paper used the latter. Secondly, in the selection of data, this paper prioritized the use of data in the form of percentages or ratios, as this directly downloaded data from the World Bank is more convenient and authoritative, given that this paper ultimately averaged and normalized all data. For example, among the three indicators ‘Number of people spending more than 10% of household consumption or income on out-of-pocket health care expenditure,’ ‘Number of people spending more than 25% of household consumption or income on out-of-pocket health care expenditure,’ and ‘Proportion of people spending more than 25% of household consumption or income on out-of-pocket health care expenditure’ this paper selected the third one.
Furthermore, in data processing, this study conducted summation of some of the data without affecting the target content. This enabled multiple indicators to be merged into a comprehensive indicator, providing a simple method for summarizing and comparing multiple data points, making the data more intuitive. Additionally, some data were scaled, such as the ‘Women’s Business and Legal Index score (1–100)’ under Goal 5 (Gender Equality). This eliminates the influence of different measurement units and value sizes on indicator comparison and merging, making the comparison between indicators more meaningful and ensuring that each indicator has the same weight when merged to ensure fairness and accuracy. This study also performed difference calculations on some data to reflect the results more intuitively, such as the indicators under Goal 5 (Gender Equality), ‘Proportion of time spent on unpaid domestic and care work, female (as a percentage of 24 h in a day)’ and ‘Proportion of time spent on unpaid domestic and care work, male (as a percentage of 24 h in a day).’ Furthermore, for some years or countries where data is incomplete, this study only used countries with available data to calculate each indicator.
In the final averaging and normalization process of the data, this study adopted the method of discarding extreme values. This is because in statistical analysis, discarding outliers or extreme values can reduce their impact on the data, thus better reflecting the true trends and characteristics of the data. Discarding extreme values can reduce the influence of random fluctuations and outliers on data distribution, making the data more accurate and reliable, which is helpful for better data analysis and prediction.
2.2. Calculate correlation coefficient and create networks for SDGs
The presented study employs the Spearman correlation coefficient to reflect the degree of correlation among the targets (Karlsson, 2013; Alaimo and Maggino, 2020). The Spearman correlation evaluates a monotonic relationship (whether linear or not). Given that the relationships among the 17 targets may not be linear, this paper considers the use of Spearman correlation more appropriate in assessing the relationships among the 17 sustainable development goals.
For a sample of size n, the n raw scores , are converted to ranks, and is computed as
where represents Pearson correlation coefficients represent covariance of $n$ rank variables and represents standard deviations of the rank variables. The widely used formula can only be applied when all n ranks are unique whole numbers.
Here, represents the discrepancy between the ranks of each observation, and n denotes the total number of observations.
2.3. Prioritize and forecast SDGs by VAR
VAR (Vector Autoregression) model is a multivariate time series analysis method for modeling and forecasting the dynamic relationship between multiple variables of interest. In a VAR model, each variable is represented as a linear combination of its own lag and other variables.
The vector autoregression (VAR) model has become a prominent macroeconomic model for policy makers and forecasters since Sims’ influential work in 1980. This model is used to analyze vectors of time series, as opposed to individual time series, and has been shown to be more effective than traditional univariate models (Sims, 1980). Due to their ability to detect both short-term connections and long-term trends between variables, VAR models are an advantageous tool for policy analysis and forecasting (Lin and Xu, 2018). Therefore, this study utilizes a VAR model to prioritize sustainable development goals and predict the impact of achieving a particular goal 2 years ahead of schedule on other goals. The analysis is based on the historical indicator data processed in the previous section, which was treated as a set of vectors.
A K-dimensional Vector Autoregression (VAR) model with order P, labeled as VAR (P), takes into account K = 2. In this model, c signifies the intercept, $\phi$ symbolizes the coefficients of Y lags up to order P, and $\epsilon$ denotes an error term. Consequently, the resulting equation is:
For the VAR model, multiple interconnected time series variables exist, which are expressed as a system comprising multiple equations, with an individual equation corresponding to each time series variable. Here, k indicates the overall count of time series variables involved.
In matrix form:
The equation for VAR (P) is:
The official only provides annual values for these indicators. In order to make effective use of the real-time data flow, this paper involves estimating the model at low frequency (yearly) and then mapping it into a corresponding model at higher frequency (monthly) (Bańbura et al., 2015; Cimadomo et al., 2022) and utilizes the resample function in the Pandas library.
Additionally, it is essential to ensure that the data fed into the VAR model is stable to prevent inaccurate outcomes potentially arising from estimating an econometric model using non-stationary time series (Yang et al., 2022). This paper first assesses the stability of the original data and finds that the data is continually increasing and does not meet the stability requirement. Therefore, the data are differenced to transform them into stable data.
As for predicting the impact of achieving the priority targets 2 years earlier on the other SDGs. As the variable is a linear prediction, the predicted values may exceed the range of 0–1. Therefore, the data was normalized and the indicator with the higher value was chosen to indicate the likelihood of reaching 1 first.
3. Results
3.1. Interaction between SDGs
Figure 1 displays a heatmap illustrating the strength of the correlation between 17 sustainable development goals from 2002 to 2021. The intensity of the color indicates the degree of correlation, with darker colors indicating stronger associations. The Heatmap emphasizes the 17 metrics exhibiting a correlation coefficient above 0.5 with a minimum of one other indicator. The corresponding correlated indicators are displayed in Table 1, employing the Spearman method for analysis.
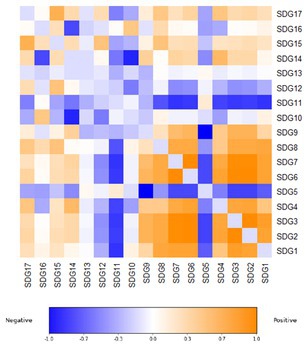
Figure 1. Heatmap.
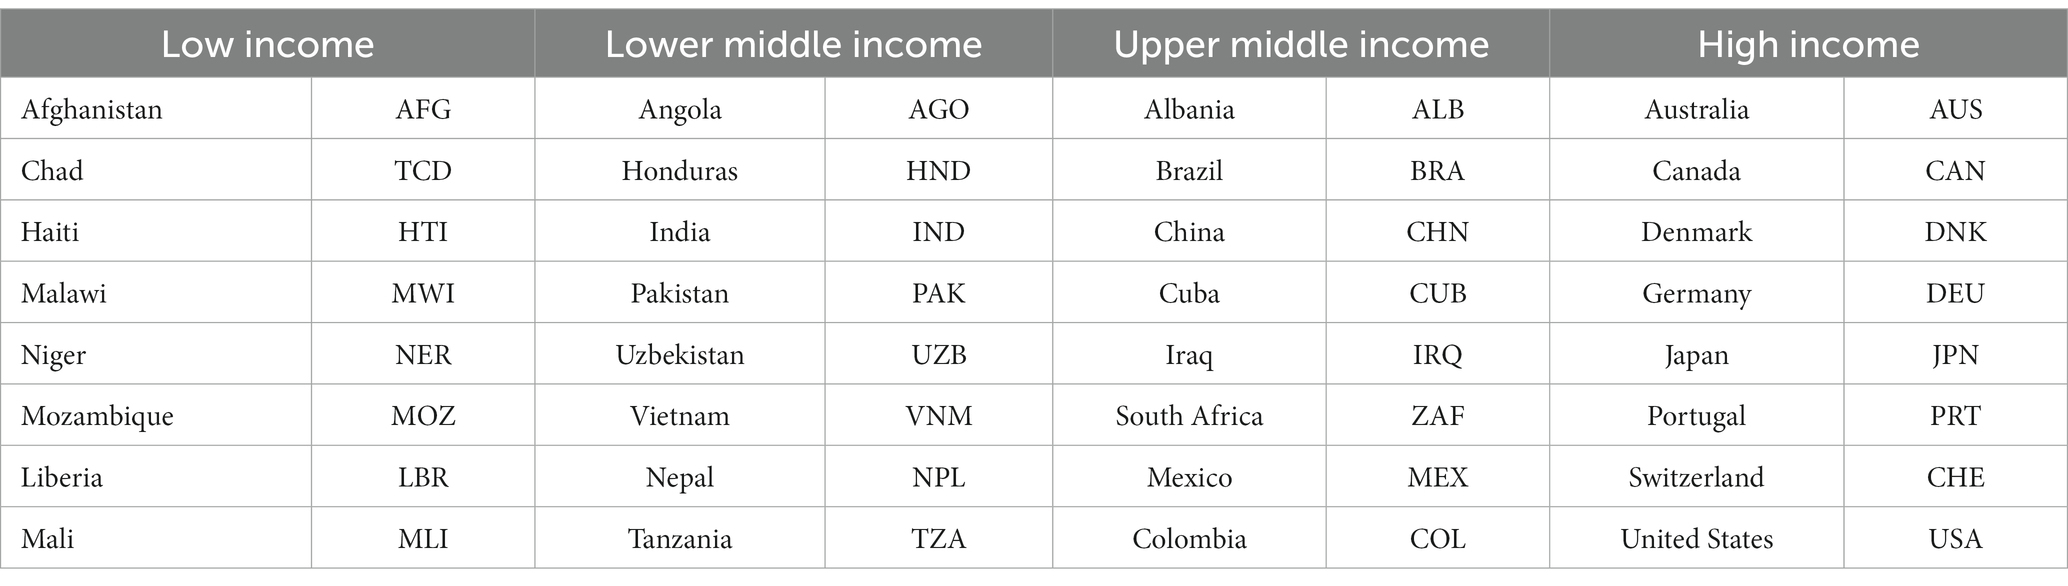
Table 1. Country grouping.
This paper also demonstrates the trade-off and synergies effects between SDGs by creating network in different historic periods. The intercorrelation between SDGs in different historic periods for four country groups was represented using the thickness of the lines between network nodes to indicate their degree of correlation. Lines with a positive impact were depicted in light-blue, while those with a negative impact were represented in cade-blue (Figure 2).
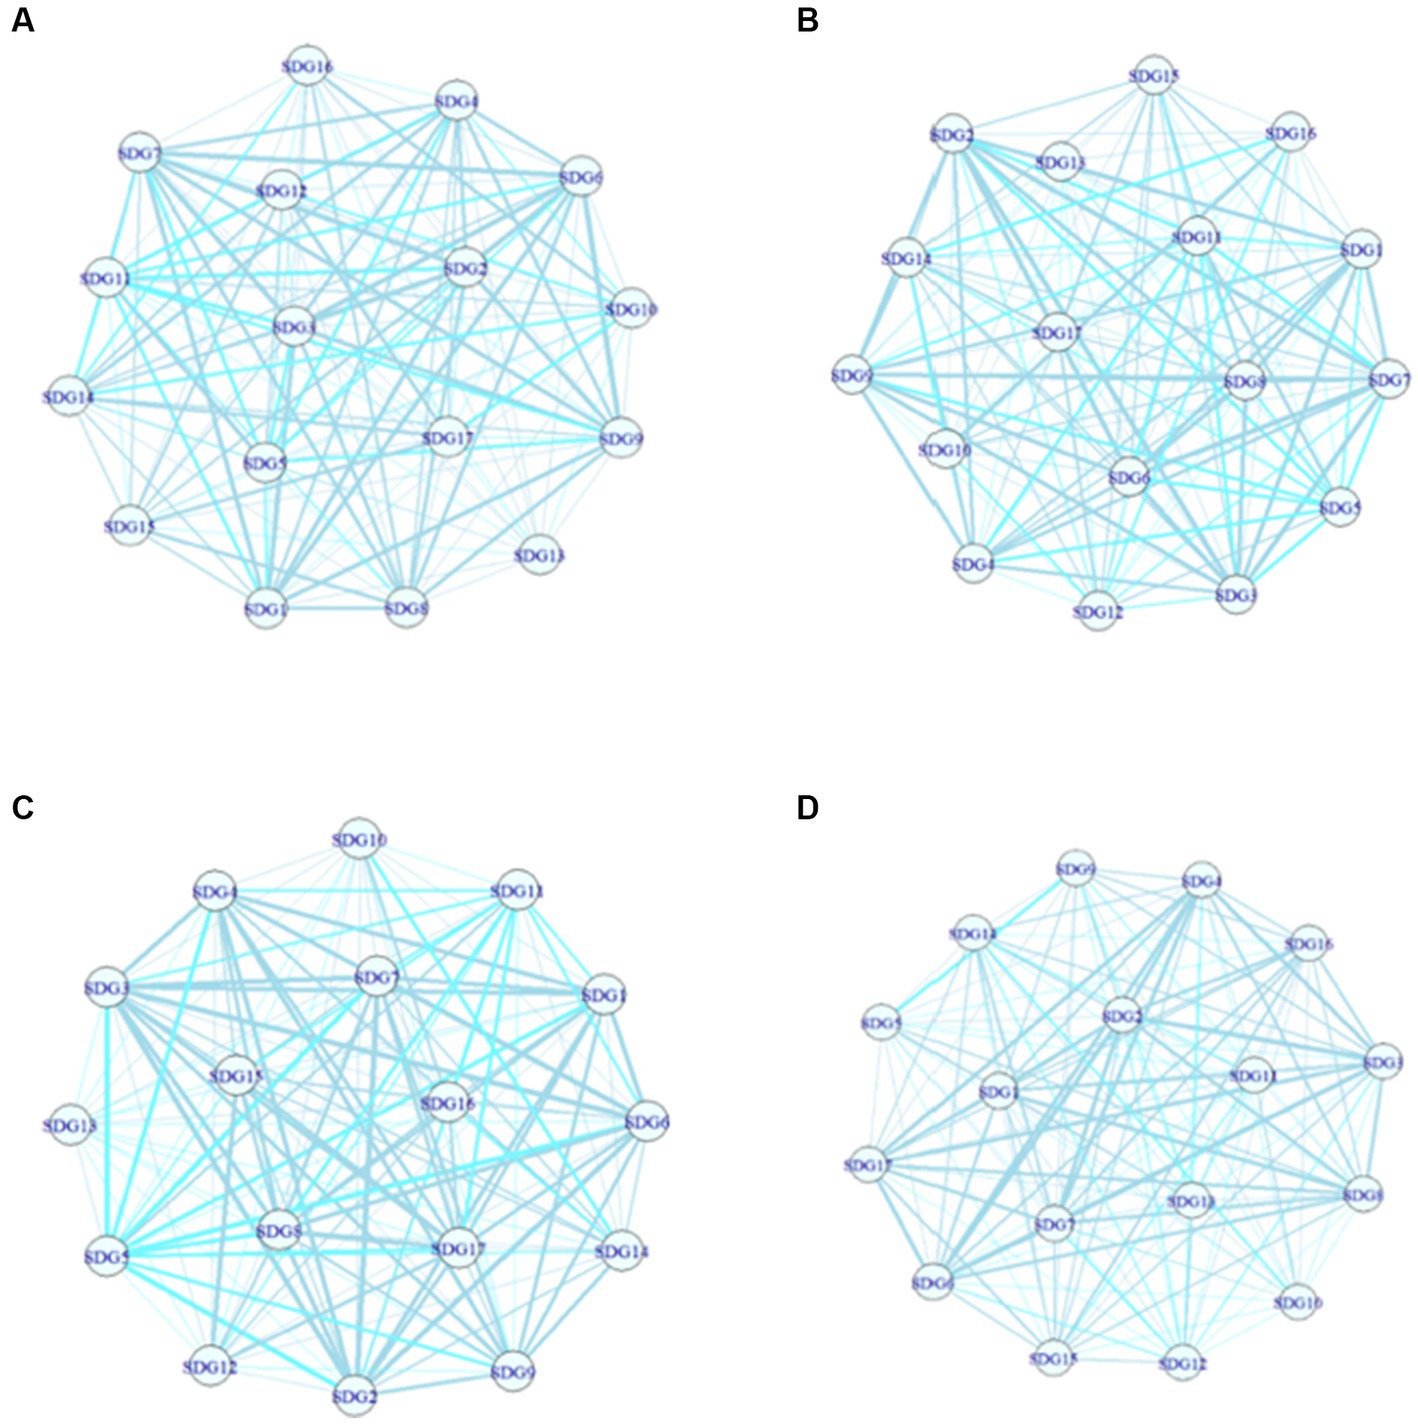
Figure 2. Networks between SDGs from 2002 to 2021. (A) Network between 2002–2007. (B) Network between 2008–2012. (C) Network between 2013–2017. (D) Network between 2018–2021.
From subfigure (a), it can be observed that during the period of 2002–2007, SDG6 and SDG7 had stronger and more positive impacts on other goals, while SDG11 had the most negative impact on other goals. Subfigure (b) and subfigure (c) can be observed that during the period of 2008–2012 and 2013–2017, SDG2 and SDG3 had stronger and more positive impacts on other goals, while SDG5 and SDG11 had the most negative impact on other goals. And from subfigure (d), it can be observed that during the period of 2018–2021, SDG2 had stronger and more positive impacts on other goals, while SDG14 had a relatively strong negative impact on other goals.
Based on the above data, with the passage of time, the positive impact of SDG2 (Zero Hunger) becomes increasingly evident and gradually has the strongest positive impact on other SDGs, while the targets with negative impacts vary for each historical period. During the period of 2002–2012, SDG11 (Sustainable Cities and Communities) had a strong negative impact on other goals, which may be due to the fact that sustainable development in urban communities requires a great deal of human, financial, and material resources at the initial stage, leading to negative impacts on other goals. However, after passing the initial stage (2012–2021), this target (SDG11) gradually began to have a positive impact on other goals. In 2018–2021, SDG9 and SDG14 had a strong negative relationship, as building industries, innovation, and infrastructure would produce a lot of waste and require a large amount of natural resources, thus having a negative impact on underwater.
3.2. Prioritization of SDGs
The present study utilized the results from Table 2 to select a group of SDGs, namely SDG1, SDG2, SDG3, SDG4, SDG6, SDG7, SDG8, and other related indicators, with higher correlations.
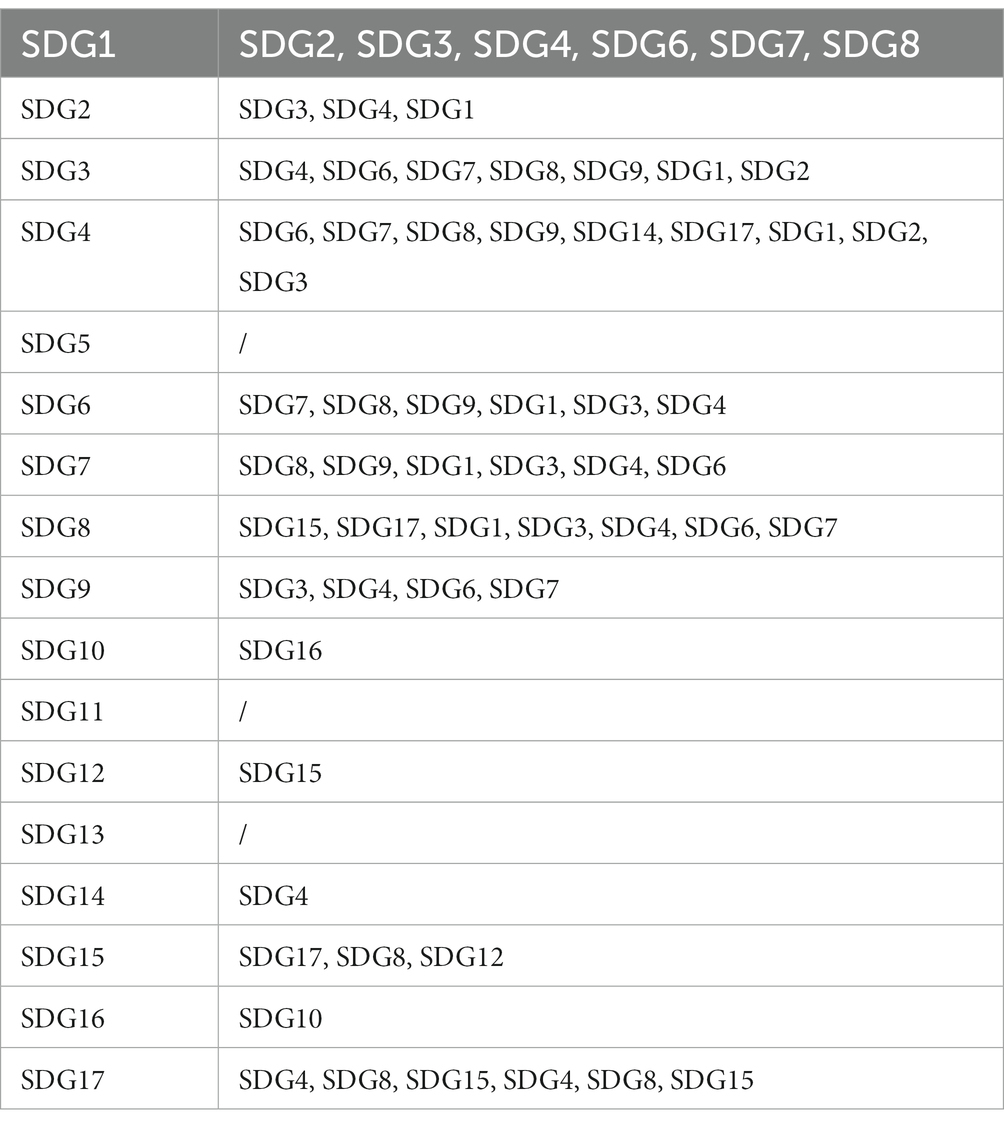
Table 2. Indicators with a correlation coefficient greater than 0.5.
In the present research, the ideal lag length (p) for the VAR model is established using the Akaike information criterion (AIC), Hannon-Quinn information criterion (HQIC), and Schwarz information criterion (SIC) tests as reference points (Yang et al., 2022). These SDGs were chosen to construct a model, using a selected order of 7, as it resulted in the minimum absolute value of the Akaike information criterion (AIC), indicating the highest correlation. Following the construction of the model, predictions were made (Table 3).
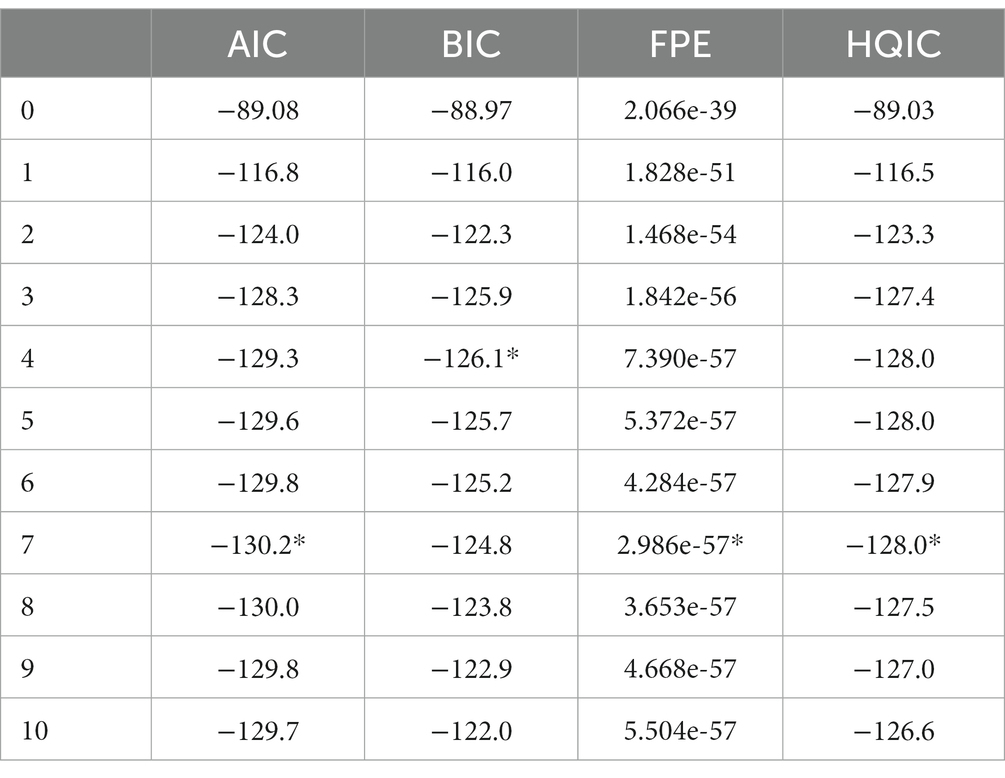
Table 3. Table of coefficients for the var model.
The results of the mean values from the Table 4 indicate that the value of SDG6 was 5.722720, which was significantly higher than the values of the other goals. Thus, it is inferred that SDG6 is likely to be achieved earlier than the other goals.
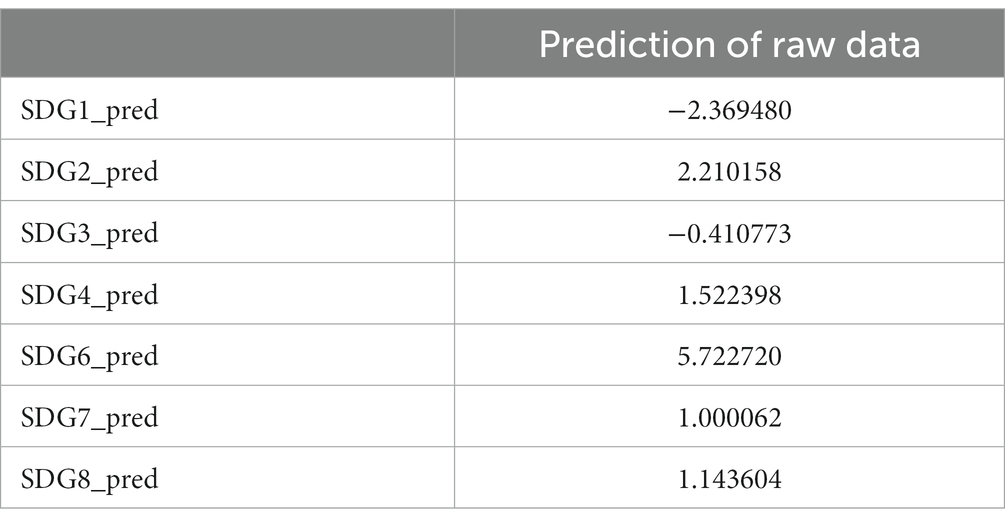
Table 4. Prediction table for raw data.
3.3. Forecasting
Table 5 shows the impact of SDG6 on the remaining SDGs after completion 2 years ahead of schedule and the raw data, respectively.

Table 5. Normalized and predicted data.
A comparison of the two tables shows that the indicator ‘clean water and sanitation’ has a significant contribution to the indicators ‘quality education’ and ‘decent work and economic growth.’
4. Conclusion
The article is based on the identification of relationships among the SDG goals through a network analysis of 32 countries. The SDGs are a global initiative involving all nations and regions, requiring the balancing of competing interests and priorities, while acknowledging their significant interdependence. To effectively execute the SDGs, policymakers must carefully consider both the synergies and trade-offs between goals and adopt an all-encompassing and integrated approach that addresses the underlying social, economic, and environmental issues. Using the Spearman method, this article calculates the correlation coefficients between SDG indicators, presenting a heatmap and table that display indicators with coefficients greater than 0.5. Additionally, the article constructs a network diagram showcasing the connections between SDGs over distinct time periods, highlighting the balance and synergies between indicators.
The SDGs involve a delicate balancing act. For example, SDG 1 might come at the expense of SDG 13, which emphasizes environmental sustainability. Additionally, SDG 2 may have trade-offs with environmental sustainability due to agriculture’s substantial contribution to greenhouse gas emissions, soil degradation, and water scarcity. Similarly, SDG 3 could compete with economic growth as increased spending on healthcare and social services might divert resources from other sectors of the economy. Moreover, SDG 4 might also have trade-offs with economic growth, given that providing education can be expensive and its immediate economic benefits may not be apparent.
Furthermore, SDG 5 could lead to increased costs for employers, potentially competing with economic growth. SDG 6 might also compete with economic growth since it demands significant investments in infrastructure that could divert resources from other areas of the economy. SDG 7 might conflict with environmental sustainability, considering that energy generation and usage substantially contribute to greenhouse gas emissions. Additionally, SDG 8 may have trade-offs with environmental sustainability, as economic growth can drive up demand for resources, energy consumption, and greenhouse gas emissions.
In the same vein, SDG 9 can have trade-offs with environmental sustainability, as industrialization can escalate the need for resources and energy, leading to increased greenhouse gas emissions. Moreover, SDG 10 may present trade-offs with economic growth, as policies that promote equality, such as progressive taxation and social spending, could reduce incentives for investment and entrepreneurship. SDG 11 might come at the expense of economic growth, as the development of sustainable communities and infrastructure necessitates significant investments in public services and infrastructure, diverting resources from other sectors of the economy.
Similarly, SDG 12 may have trade-offs with economic expansion since consumption and production are critical drivers of economic pursuits. SDG 13 can have trade-offs with economic growth, as reducing greenhouse gas emissions requires significant changes in production and consumption patterns, which could negatively impact economic activity. Furthermore, SDG 14 may have trade-offs with economic growth, as the use of marine resources, such as fishing and aquaculture, can lead to overexploitation and ecological degradation. Likewise, SDG 15 can have trade-offs with economic growth, as land and natural resources are necessary for agriculture, mining, and infrastructure development, leading to deforestation, land degradation, and biodiversity loss.
Lastly, SDG 16 may have trade-offs with economic growth, as promoting peace and justice may require significant investments in conflict prevention and resolution, as well as ensuring equal access to justice and upholding the rule of law.
However, achieving this goal can have trade-offs with national sovereignty and autonomy, as partnerships may require countries to coordinate and align their policies with international norms and standards. Synergies among sustainable development indicators can be illustrated by the following example: Accomplishing SDG 7: Affordable and Clean Energy can positively influence the attainment of SDG 13: Climate Action, as harnessing renewable energy sources can decrease greenhouse gas emissions and lessen the consequences of climate change. Realizing SDG 8: Decent Work and Economic Growth can aid in accomplishing SDG 1: No Poverty and SDG 10: Reduced Inequalities, given that economic expansion and employment generation can diminish poverty and social disparities. Attaining SDG 11: Sustainable Cities and Communities can positively impact the realization of SDG 3: Good Health and Well-Being, as eco-friendly urban planning encourages physical activity and facilitates access to healthcare services. Moreover, achieving SDG 12: Responsible Consumption and Production can contribute to the accomplishment of SDG 14: Life Below Water and SDG 15: Life on Land, since minimizing waste and pollution can assist in preserving and sustainably managing marine and terrestrial ecosystems.
Through the utilization of the VAR model, this research pinpointed SDG 6: Clean Water and Sanitation as the foremost priority among the United Nations Sustainable Development Goals. The goal aims to ensure that everyone has access to clean water and basic sanitation facilities. The priority development of this goal is crucial because water is the source of life, and a lack of clean drinking water and adequate sanitation facilities can lead to disease transmission, malnutrition, and death. According to the United Nations report, about 2 billion people worldwide lack access to safe drinking water sources, and 340,000 children die every year from diseases caused by water pollution. In addition, a lack of sanitation facilities can lead to the spread of diseases such as cholera and diarrhea, which cause millions of deaths every year. Moreover, in areas with inadequate sanitation facilities, women, girls, and vulnerable groups face greater health risks. For example, girls may be forced to drop out of school because of a lack of basic sanitation facilities, further undermining their future development opportunities. In today’s digital and internet age, the priority development of the sixth goal is closely related to digital technology and the internet. For example, the use of toilets can be improved through more modern and intelligent technology, such as promoting water-saving toilets, using sustainable energy sources such as solar or wind power, and smart sensing devices. In addition, computer simulation can help design more sophisticated water supply and sanitation systems, which can use the Internet of Things, data analysis, and other digital technologies to improve efficiency, coordinate resources, and innovate problem-solving methods.
Furthermore, this study used the VAR model to predict the impact of completing SDG 6 2 years ahead of schedule on other sustainable development goals. The results showed that completing SDG 6 2 years ahead of schedule would have a significant positive impact on SDG 4 and SDG 8. First, ensuring clean water and sanitation facilities can improve people’s living conditions and health status, reduce disease transmission and medical expenses, and provide better physical health conditions for people. This helps to increase people’s productivity and labor capacity, thereby promoting economic growth and improving work efficiency and productivity. At the same time, good physical health conditions also help to improve people’s ability and efficiency to receive education, which is conducive to cultivating more talents and promoting the achievement of quality education. Secondly, ensuring widespread access to clean water and sanitation amenities aids in bridging the disparity between urban and rural areas, enhancing infrastructure and public services, fostering regional economic and social growth, and bettering the living conditions and employment opportunities for individuals. Especially in rural areas, improving rural water supply and sanitation facilities helps to increase women’s and children’s participation in the labor market, providing the foundation for promoting economic growth and realizing decent work.
5. Limitation
In this article, countries have been grouped based on economic factors, and in the future, the differences in the relationship networks between these groups can be further discussed to provide targeted recommendations for different countries. Finally, due to the abundance of indicator information involved in the article, more explanations and interpretations can be provided based on the goals represented by the indicators, thereby displaying the interactions between the goals more clearly and providing ideas for policy coordination.
Data availability statement
The original contributions presented in the study are included in the article/Supplementary material, further inquiries can be directed to the corresponding author.
Author contributions
RL and SW contributed to conception and design of the study. MZ and DY organized the database. ZM and BX performed the statistical analysis. MZ wrote the first draft of the manuscript. ZM, BX, and DY wrote sections of the manuscript. All authors contributed to manuscript revision, read, and approved the submitted version.
Funding
This research was funded by the National Natural Science Foundation of China (Grant No. 71901144), China Youth and Children Research Association (Grant No. 2023B18), the Fund of University of Shanghai for Science and Technology (Nos. 22SLCX-ZD-005, SH2023253 SH2023254, XJ2023515); the Fund of University of Shanghai for Science and Technology (2023QYKTLX3-18); China Foundation for Youth Entrepreneurship and Employment (2023A03-01); the Fund of University of Shanghai for Science and Technology, Research on the factors influencing the flexible employment choice of female college students in the context of common wealth and counter measures.
Conflict of interest
The authors declare that the research was conducted in the absence of any commercial or financial relationships that could be construed as a potential conflict of interest.
Publisher’s note
All claims expressed in this article are solely those of the authors and do not necessarily represent those of their affiliated organizations, or those of the publisher, the editors and the reviewers. Any product that may be evaluated in this article, or claim that may be made by its manufacturer, is not guaranteed or endorsed by the publisher.
Supplementary material
The Supplementary material for this article can be found online at: https://www.frontiersin.org/articles/10.3389/frsus.2023.1214615/full#supplementary-material
References
Alaimo, L. S., and Maggino, F. (2020). Sustainable development goals indicators at territorial level: conceptual and methodological issues—the Italian perspective. Soc. Indic. Res. 147, 383–419. doi: 10.1007/s11205-019-02162-4
Aly, E., Elsawah, S., and Ryan, M. J. (2022). A review and catalogue to the use of models in enabling the achievement of sustainable development goals (SDG). J. Clean. Prod. 340:130803. doi: 10.1016/j.jclepro.2022.130803
Asadikia, A., Rajabifard, A., and Kalantari, M. (2021). Systematic prioritisation of SDGs: machine learning approach. World Dev. 140:105269. doi: 10.1016/j.worlddev.2020.105269
Bańbura, M., Giannone, D., and Lenza, M. (2015). Conditional forecasts and scenario analysis with vector autoregressions for large cross-sections. Int. J. Forecast. 31, 739–756. doi: 10.1016/j.ijforecast.2014.08.013
Barbier, E. B., and Burgess, J. C. (2017). The sustainable development goals and the systems approach to sustainability. Economics 11:20170028. doi: 10.5018/economics-ejournal.ja.2017-28
Breuer, A., Janetschek, H., and Malerba, D. (2019). Translating sustainable development goal (SDG) interdependencies into policy advice. Sustainability 11:2092. doi: 10.3390/su11072092
Chen, J., Su, F., Jain, V., Salman, A., Tabash, M. I., Haddad, A. M., et al. (2022). Does renewable energy matter to achieve sustainable development goals? The impact of renewable energy strategies on sustainable economic growth. Front. Energy Res. 10:829252. doi: 10.3389/fenrg.2022.829252
Cimadomo, J., Giannone, D., Lenza, M., Monti, F., and Sokol, A. (2022). Nowcasting with large Bayesian vector autoregressions. J. Econ. 231, 500–519. doi: 10.1016/j.jeconom.2021.04.012
Ernst, A., Biß, K. H., Shamon, H., Schumann, D., and Heinrichs, H. U. (2018). Benefits and challenges of participatory methods in qualitative energy scenario development. Technol. Forecast. Soc. Chang. 127, 245–257. doi: 10.1016/j.techfore.2017.09.026
Harris, P., Riley, E., Dawson, A., Friel, S., and Lawson, K. (2020). “Stop talking around projects and talk about solutions”: positioning health within infrastructure policy to achieve the sustainable development goals. Health Policy 124, 591–598. doi: 10.1016/j.healthpol.2018.11.013
ICSU (2017). A guide to SDG intercations: from science to implementation international council for science.
Karlsson, S. (2013). Forecasting with Bayesian vector autoregression J. Handb. Econ. Forecast. 2, 791–897.
Kroll, C . (2015). Spotlight europe (2015): sustainable development goals: are the rich countries ready?.
Laumann, F., von Kügelgen, J., Kanashiro Uehara, T. H., and Barahona, M. (2022). Complex interlinkages, key objectives, and nexuses among the sustainable development goals and climate change: a network analysis. Lancet Planet. Health 6, e422–e430. doi: 10.1016/S2542-5196(22)00070-5
Lin, B., and Xu, B. (2018). Growth of industrial CO2 emissions in Shanghai city: evidence from a dynamic vector autoregression analysis. Energy 151, 167–177. doi: 10.1016/j.energy.2018.03.052
Nicolai, S, Hoy, C, Berliner, T, and Aedy, T. Projecting progress: reaching the SDGs by 2030. London: Overseas Development Institute. (2015).
Nilsson, M., Griggs, D., and Visbeck, M. (2016). Policy: map the interactions between sustainable development goals. Nature 534, 320–322. doi: 10.1038/534320a
Ospina-Forero, L., Castañeda, G., and Guerrero, O. A. (2022). Estimating networks of sustainable development goals. Inf. Manag. 59:103342. doi: 10.1016/j.im.2020.103342
Pradhan, P. (2019). Antagonists to meeting the 2030 agenda. Nat. Sustain. 2, 171–172. doi: 10.1038/s41893-019-0248-8
Russell, E., Lee, J., and Clift, R. (2018). Can the SDGs provide a basis for supply chain decisions in the construction sector? Sustainability 10:629. doi: 10.3390/su10030629
Sachs, J, Schmidt-Traub, G, Kroll, C, Lafortune, G, and Fuller, G. (2016). SDG index & dashboards: a global report. New York: Bertelsmann Stiftung and Sustainable Development Solutions Network (SDSN).
Schmidt-Traub, G., Kroll, C., Teksoz, K., Durand-Delacre, D., and Sachs, J. D. (2017). National baselines for the sustainable development goals assessed in the SDG index and dashboards. Nat. Geosci. 10, 547–555. doi: 10.1038/ngeo2985
Singh, G. G., Cisneros-Montemayor, A. M., Swartz, W., Cheung, W., Guy, J. A., Kenny, T. A., et al. (2018). A rapid assessment of co-benefits and trade-offs among sustainable development goals. Mar. Policy 93, 223–231. doi: 10.1016/j.marpol.2017.05.030
United Nations . (2015). Transforming our world: the 2030 agenda for sustainable development UN general assembly. New York: United Nations.
World Bank (2021). Sustainable development goals. https://datacatalog.worldbank.org/dataset/sustainable-development-goals
Keywords: SDGs, Spearman, VAR, sustainable development, trade-off effect, synergy effect
Citation: Zhao M, Meng Z, Xu B, Yu D, Wu S and Li R (2023) Prior goal setting of SDGs based on the interaction correlation. Front. Sustain. 4:1214615. doi: 10.3389/frsus.2023.1214615
Edited by:
Antonino Marvuglia, Luxembourg Institute of Science and Technology (LIST), LuxembourgReviewed by:
Thomas Schaubroeck, Luxembourg Institute of Science and Technology (LIST), LuxembourgDavide Berardi, Sapienza University of Rome, Italy
Copyright © 2023 Zhao, Meng, Xu, Yu, Wu and Li. This is an open-access article distributed under the terms of the Creative Commons Attribution License (CC BY). The use, distribution or reproduction in other forums is permitted, provided the original author(s) and the copyright owner(s) are credited and that the original publication in this journal is cited, in accordance with accepted academic practice. No use, distribution or reproduction is permitted which does not comply with these terms.
*Correspondence: Shu Wu, aWFtd3VzaHVAdXNzdC5lZHUuY24=
†These authors have contributed equally to this work