
95% of researchers rate our articles as excellent or good
Learn more about the work of our research integrity team to safeguard the quality of each article we publish.
Find out more
REVIEW article
Front. Sustain. , 28 September 2023
Sec. Modeling and Optimization for Decision Support
Volume 4 - 2023 | https://doi.org/10.3389/frsus.2023.1158993
This article is part of the Research Topic Sustainable Technology Management View all 4 articles
 Jaby Mohammed*
 Justin Villegas
The continental United States heavily relies on land logistics with 3.8 million square miles of land and over 4 million miles of road. Additionally, the United States is committed to achieving the global goal of reaching net-zero emissions by 2050. This article examines the advantages and disadvantages of incorporating electric vehicles (EVs), specifically trucks, into the current logistics industry. This paper also provides a better understanding of what type and magnitude of impact electric trucks' uprising technology have on the logistics industry.
In the last 50 years, the only vehicle improvements have been their performance, gas mileage, safety, comfort, and reliability, but generally still run-on petroleum-based fuels. Almost 10 million oil barrels are burned daily in the United States for on-road vehicle use. It also accounts for the majority stake in greenhouse gases than any sector. Now that there is a global urgency, through the Paris Agreement, to pursue net-zero emissions, vehicle electrification is inevitable (Sperling, 2018).
The revolution of electric vehicles started when California Air Resources Board (CARB) kicked off its zero-emissions vehicle mandate in 1990. Still, it only ramped up in 2008 when government-funded research on batteries and power, plus the added pressure of the recession, materialized into the early onset of mass-produced consumer electric vehicles. Shortly after, Tesla, Nissan, Chevrolet, and other startups started offering their fully electric vehicles to the public. In turn, the CARB has revamped its zero-emissions vehicle mandate and is demanding that electric vehicle manufacturers achieve sales of 15% market penetration by 2025 (Valdes-Dapena, 2019). This section includes the motivation behind the study, followed with the background of the EV industry, logistics industry, and the carbon emission positions. The third section ovolves the methodology of the study, economics of the EV adoption including the environmental, which is then followed with conclusion and discussion.
The adoption of electric vehicles (EVs) in the logistics industry has the potential to bring several significant impacts. One of the primary reasons for integrating EVs into the logistics industry is their positive environmental impact. EVs produce zero tailpipe emissions, reducing greenhouse gas emissions and air pollution. This shift helps combat climate change and improves air quality in urban areas. Secondly, the operating cost, the upfront cost of purchasing an EV, may be higher compared to traditional vehicles; EVs generally have lower operating costs. Electric motors are more energy-efficient than internal combustion engines, lowering fuel and maintenance costs. EVs require less frequent maintenance due to fewer moving parts and fewer fluids to be replaced. Thirdly is energy efficiency; EVs are more energy-efficient than conventional vehicles. Electric motors have a higher efficiency rating than internal combustion engines, meaning more of the energy from the battery is converted into forward motion. This efficiency leads to longer-range capabilities and reduces the need for frequent refueling/recharging during logistics operations. Many governments around the world offer incentives to promote the adoption of EVs, such as tax credits, subsidies, and grants. These incentives can significantly reduce the initial cost of purchasing EVs, making them more attractive to logistics companies.
It's worth noting that challenges still need to be addressed, such as the limited range of EVs, the need for charging infrastructure expansion, and the sourcing of renewable energy. However, as technology advances and the industry adapts, the positive impacts of EV adoption in logistics are expected to become even more pronounced.
In this paper, the authors will explore the impact of electric vehicle fleet adoption in the logistics industry, looking at the environmental and economic impact.
E.V.s are a relatively small automotive industry segment but are on the brink of massive long-term growth. Industry leaders feel like it's the turn of the 19th century again when traditional gas-powered cars were initially being designed and produced. Every organization pursuing E.V. market share is rushing to secure an initial commanding position (Gaines, 2018; Hall, 2020). It is reflected as current automaker giants like Ford and Toyota want to produce electric vehicles for consumers to maintain their already established industry position. On the other hand, Tesla—a frontrunner in the E.V. segment, wants to continue to be a trailblazer, get onto top-tier industry sales, and defend its market share from startups like Rivian and Nio.
As of March 21, 2019, the number of electric vehicles on American roads exceeded 1.18 million, with 81% growth in total E.V. sales in 2018 compared to the previous year. Itincludes E.V.s market share growth of 1.6 and 1.8% in March 2018 and 2019, respectively (Schefter and Zaccagnino, 2019). Among all E.V. sales, below is the 2019 new electric car sales in the U.S., with Tesla comprising about 80% of total sales (Black, 2020). Figure 1 shows the distribution of new electric car sales in the U.S.
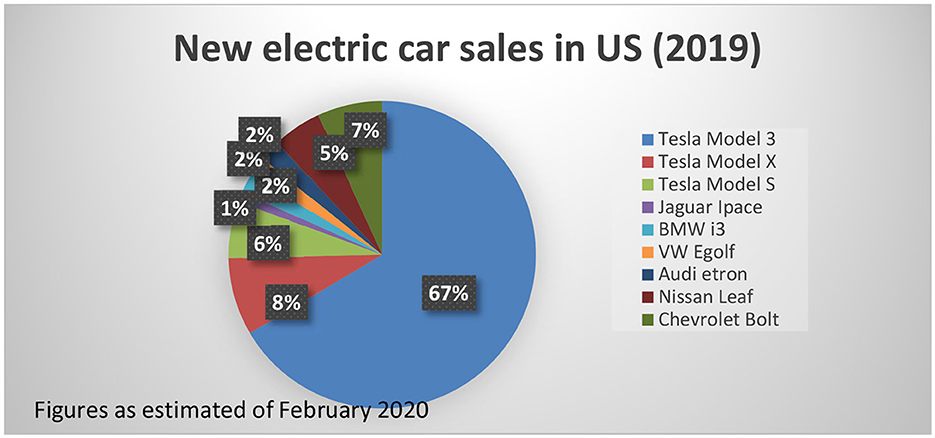
Figure 1. Battery-only electric vehicle sale nationwide.
Despite the pandemic, COVID-19, car manufacturers General Motors, Volvo, Volkswagen, and a few others continue to press on in building their entry into the electric vehicle sector, saying that they are progressing at a rapid pace (Pyper, 2020).
While passenger E.V.s are on the rise, electric trucks are gaining appeal on the industrial side of the industry—semi-trucks (Weiss and Cloos, 2020). Some electric truck manufacturers to watch include Nikola Motors, Daimler Trucks, and Tesla (Downing, 2020).
According to statistics from 2018 (Bureau of Transportation Statistics, 2018) in the United States, trucks were responsible for transporting the largest portion of goods imported from Canada, accounting for 50.1% of the $300.0 billion worth of imported goods. Following trucks were rail at 20.6%, pipeline at 17.2%, vessel at 5.0%, and air at 3.8%. Similarly, trucks were responsible for transporting the majority of goods exported to Canada, making up 65.7% of the $282.5 billion worth of exported goods. Rail followed at 11.5%, then air at 5.6%, pipeline at 3.5%, and vessel at 2.8%. The data suggests that the United States highly depends on land logistics, road freight, trucking logistics, etc. It was the backbone of the logistics industry in the U.S. In 2017; As per the American Trucking Association, the Environmental Protection Agency (EPA) revealed that the domestic trucking industry, which is valued at $700 billion, expends around $105 billion on diesel fuel each year (Burrows, 2020; Palmer, 2020).
As the trucking industry struggles in gas consumption, another issue continues to grow in the industry—truck driver shortages. This is not caused by truck drivers quitting but because the booming economy in the U.S. is driving the need for truck drivers. The American Trucking Association (ATA) has reported that more than 57% of the workforce is over the age of 45. At this time, at least 60,000 truck driver job openings need to be filled and estimates that retirements and attrition shortages of over 170,000 truck driver jobs by 2026 (American Transportation Research Institute, 2019).
The trucking industry does not work by itself; it needs safe and reliable infrastructures such as roads, bridges, and tunnels to remain successful. Unfortunately, the trucking industry has little to no control over it. Trucking organizations have recognized and voiced their concern about deteriorating infrastructure (American Transportation Research Institute, 2019; Breiter et al., 2020). While the industry waits for a proposed infrastructure spending plan, increasing gas prices and fuel consumption on less-than-ideal road conditions continue to pass the cost onto customers.
The Environmental Protection Agency (EPA) stated in 2017 that the transportation sector is the primary source of carbon emissions in the United States. Within that sector, the domestic trucking industry, which is valued at $700 billion, is a significant contributor. The American Trucking Association (ATA) reports that the industry spends ~$105 billion on diesel fuel every year (Burrows, 2020).
Figure 2 shows the GHG emissions by sector, Figure 3 shows the emissions based on transportation sector, and Figure 4 shows the type of gas emissions through U.S. transportation.
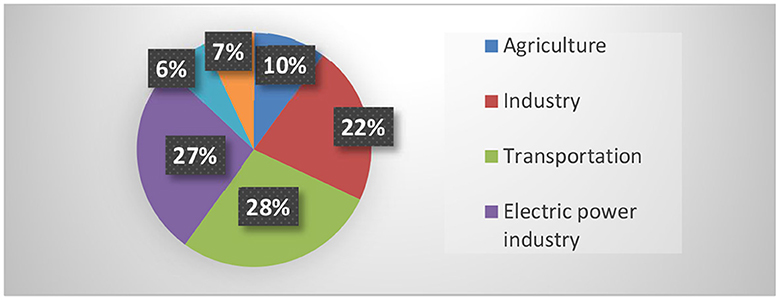
Figure 2. Share of CHG emission by sector (2018).
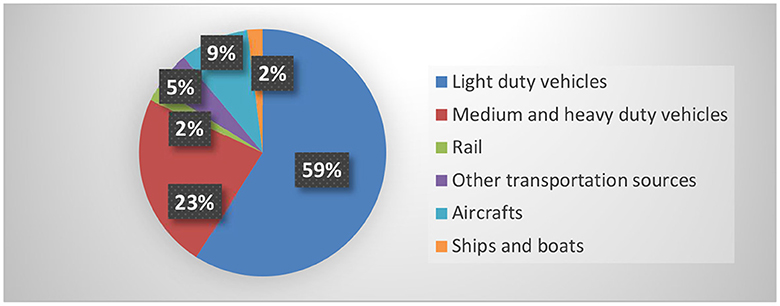
Figure 3. Share of U.S. transportation sector (2018).
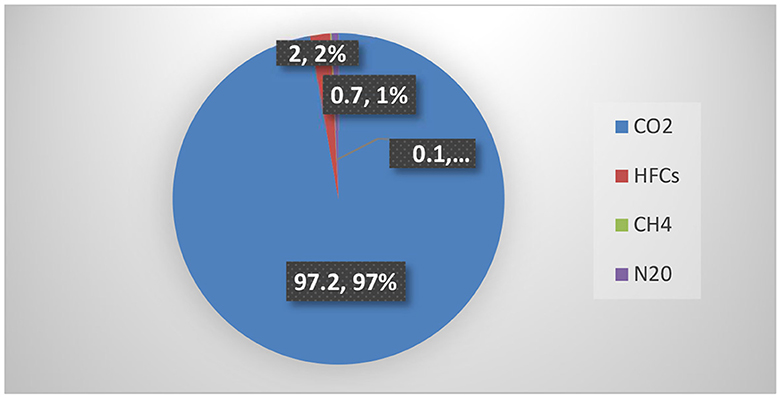
Figure 4. Share of U.S. transportation sector GHG emissions by Gas, 2018.
Table 1 shows the U.S. transportation GFG emissions, it shows the change in the emission pattern from the yekar 1990 to the year 2018.
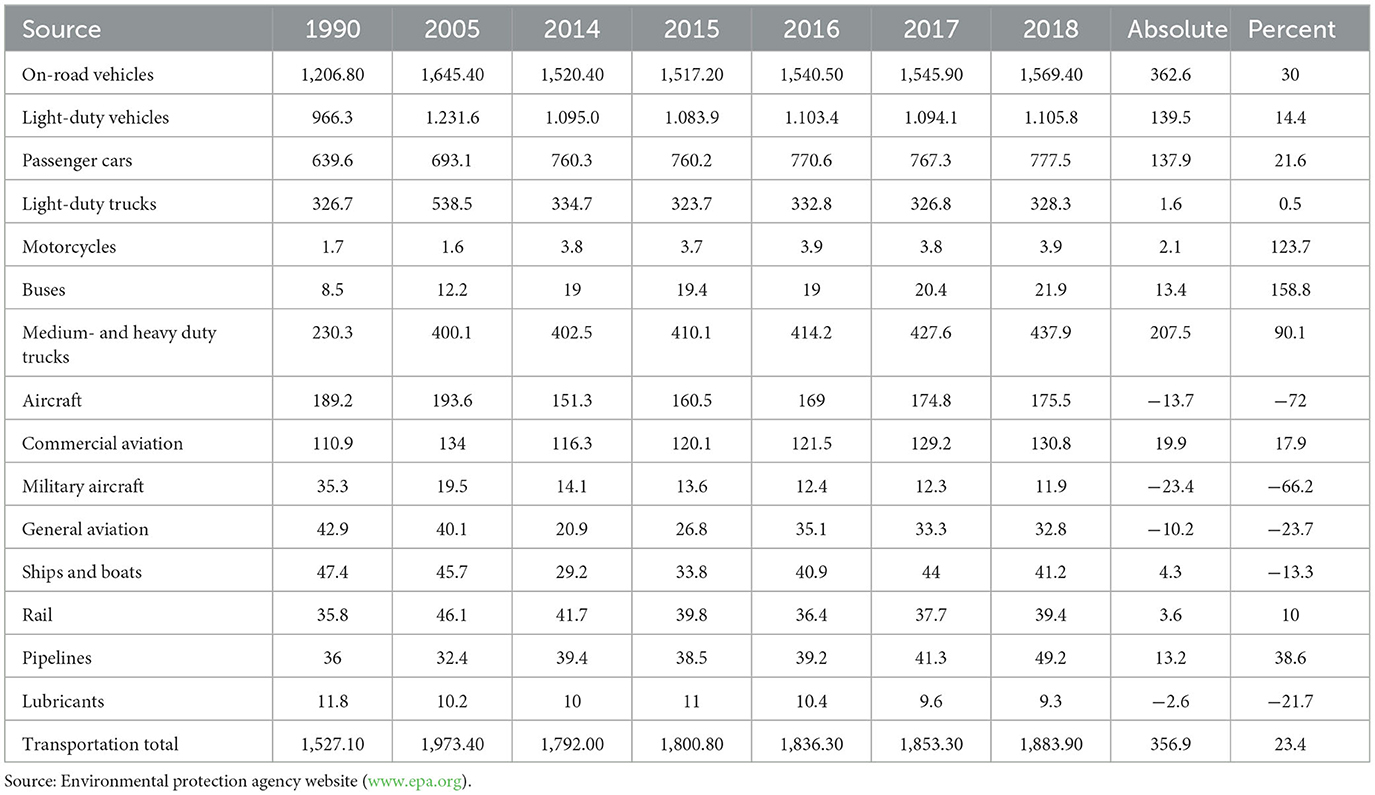
Table 1. U.S. transportation GFG emission (TG CO2 equivalent).
Tables 1–3 provides information related to gas emissions and fuel usage by different transportation sectors; The data and information are sourced from the Intergovernmental Panel on Climate Change (IPCC), a UN intergovernmental organization that seeks to improve scientific comprehension of climate change caused by human activities. Its responsibility is to generate and present policymakers with periodic scientific evaluations regarding climate change, its impacts, potential future hazards, and recommended adaptation and mitigation measures.
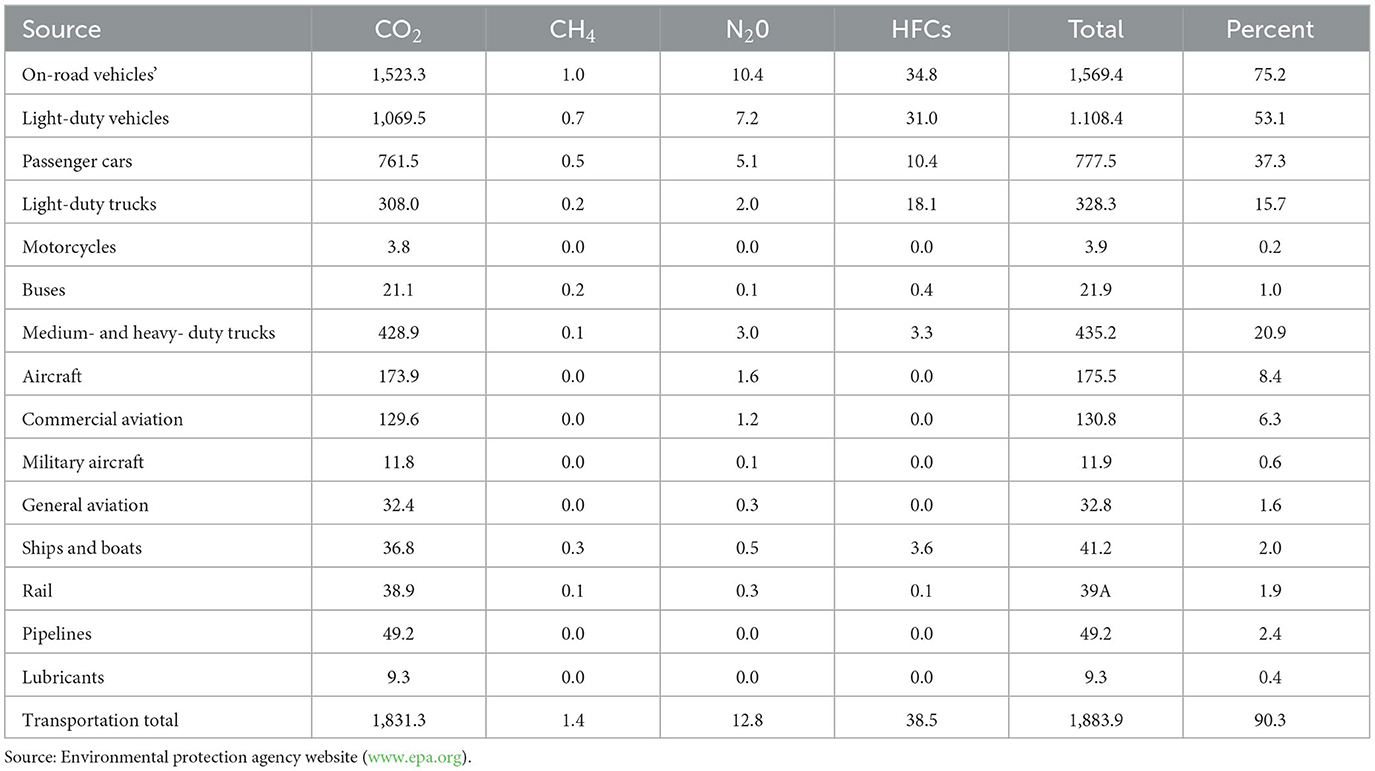
Table 2. U.S. transportation GHG emissions by gas, 2018.
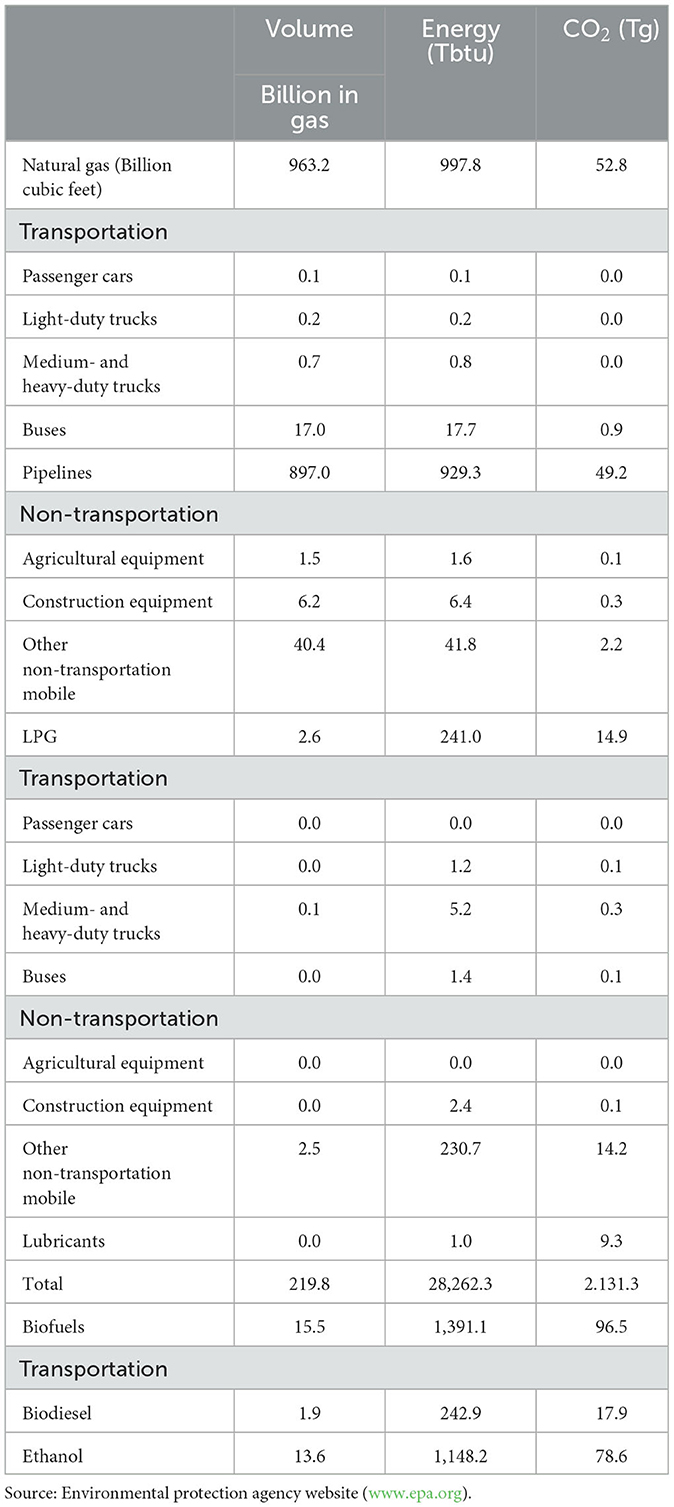
Table 3. Fuel consumption by various categories.
This research aims to understand better what type and magnitude of impact electric truck uprising technology on the logistics industry. The core of this is paper is to gather data from current costs to own, operate and maintain conventional gas-powered medium to heavy-duty trucks, as well as determine the number of greenhouse gases the current situation is emitting. The qualitative data is collected as a secondary source from referenced materials, research, and articles. The familiar saying “what gets evaluated and measured gets done” implies that the finance and accounting department, responsible for assessing performance in most organizations, holds significant sway over strategic decisions and operations (Mohammed and Sadique, 2011).
A linear approach is used in the analysis to display how the current situation in the logistics industry is not environmentally sustainable, that there are considerable commercial benefits and government support alongside the use of electric trucks, and pending considerations on carbon emission laws. Subsequently, the paper estimates the savings generated and the breakeven point in switching to electric trucks in the logistics industry.
At the conclusion of this paper, ascertain the position of the logistics industry concerning the United States' objective of achieving the Net-Zero Emissions Target by 2050. Additionally, determine the practicality of implementing this new technology concerning when and what further measures may be necessary.
According to a survey funded by ExxonMobil in 2016, the non-profit American Transportation Research Institute and the University of Michigan Transportation Research Institute found that truckers transported 10 billion tons, or 70% of all freight in the United States. The study (Hsu, 2016). revealed that volumes are projected to increase by 17% by 2026. The report also found that each fleet, on average, carries 2.1 million tons of goods and covers over 10 million miles annually, with a median fuel efficiency of 6.5 miles per gallon. In contrast, the average passenger vehicle in the United States achieves around 25 miles per gallon.
But how can the logistics industry incorporate electric trucks into the trucking segment? The U.S. need to build infrastructure for electric trucks. Which mainly constitutes more E.V. fast charging stations. To successfully incorporate electric vehicles into the logistics industry, U.S. policymakers must prioritize road network electrification. More charging stations are directly proportional to the increase in flexibility in E.V.s. With more flexibility, more people and businesses like the trucking segment will shift toward electrifying their fleets. Which goes hand in hand with subsidizing charging costs. Keeping charging prices low in-house and in public will make the total cost of operating and E.V. trucks more affordable. Once the operating costs become more affordable, and capital costs become more feasible, the logistics industry will naturally patronize electric trucks (Beveridge, 2008; McLane and Liu, 2021).
Once electric trucks become cost-effective, the next challenge that manufacturers must address is ensuring their reliability. Michael Scheib, head of electric trucks for Daimler Trucks North America, notes that “reliability” is the most pressing concern in the trucking industry. Despite the appeal of advanced technology, the transition to electric trucks could exacerbate existing issues if the technology proves to be unreliable. However, ensuring reliability requires significant time and cannot be expedited (Carpenter, 2020).
Reliability is crucial for all three types of truck driving: Local, Regional, and OTR (over the road). Local truck driving involves driving within a 200-mile radius and navigating through smaller roads in the city or town, typically for an 8–10 h workday. Regional truck driving is usually divided into regions such as Northeast and Midwest, covering a radius of up to 1,000 miles. On the other hand, OTR truck driving typically involves hauling freight over long distances, spending 3–4 weeks on the road. OTR trucking involves driving across the United States, and even into Canada. Figure 5 shows the trucking industry heavily relies on logistics hubs, which are commonly situated in metropolitan statistical areas linked by freight corridors and offer access to significant consumer markets. Various top logistics locations are the New York City, New Jersey, Memphis, Indianapolis, Kansas City, Dallas/Ft. Worth, Chicago, and Los Angles. Other potential locations involve the smaller cities like Detroit, Louisville, Little Rock, Birmingham, Nashville, Oklahoma City, Phoenix, Salt Lake City, Denver, St. Louis, Columbus, northern Virginia, and eastern Pennsylvania (U.S. Department of Transportation, 2019; U.S. Department of Transportation Freight Management and Operations, 2020a,b).

Figure 5. Major Interstate highway corridor.
Over 70% of freight (in weight) in the US is transported via the country's highway system, with two-thirds of product value also relying on this mode of transportation. Trucking is responsible for 5% of the country's GDP, and for more than 80% of communities in the US, it is the only means of delivering goods (Luttrell, 2015). In the current era, innovation and entrepreneurship (I&E) are two closely intertwined concepts. Innovation involves utilizing creativity to tackle various engineering, technological, and service-related issues, leading to novel solutions. On the other hand, entrepreneurship involves taking these innovative ideas and turning them into practical solutions. It is also about carrying out business operations effectively (Mohammed and Islam, 2022). E.V. is a revolution in the transportation industry, and new innovative products and services would evolve to support the same and to reduce the dependency on fossil fuels.
In turn, organizations such as Electrify America have been working on building ultra-fast E.V. charging networks for cross-country routes. Electrify America completed the first of its two cross-country ultra-fast E.V. charging networks last June 2020 and aimed completion the second by September 2020. The southern route is the second option, running from San Diego to Jacksonville, Florida, along interstate highways close to I-10 and I-8. Electrify America's June 2020 report outlines plans to set up around 800 charging locations, equipped with about 3,500 DC fast chargers, on this route. When these plans are combined with the existing Tesla Superchargers, Ionity, ChargePoint, and similar charging stations, the prospect of all-electric highway road trips becomes increasingly achievable (Berman, 2020). In the same manner, these routes can also be adapted for the trucking industry as well.
The financial aspect of using electric trucks for heavy-duty operations remains less attractive than its diesel-fueled counterparts but is improving. The key is to allow battery prices to become low enough to allow savings in maintenance and powering of operating electric trucks could overtake initial costs over a traditional internal combustion engine truck (Hirsch, 2020).
The price range for diesel-powered tractors in 2020 was between $110,000 and 125,000, indicating that the existing fleet of tractor-trailers has an approximate showroom value of $220 to 250 billion (Schoettle et al., 2016). The mean cost for a Class 8 truck, which encompasses tractor-trailers, is about $117,000, resulting in a total showroom value of ~$445 billion for all heavy-duty trucks. This value is crucial in determining the overall replacement cost for these trucks.
Conversely, Tesla is accepting reservations for its electric Freightliner trucks priced at $150,000 (for a range of 300 miles) and $200,000 (for a range of 500 miles). The company claims that the cost of purchasing a conventional diesel-powered vehicle can be recouped in <2 years. Paccar and Volvo have also commenced testing electric trucks and anticipate the start of commercial sales later this year. Replacing all 3.8 million Class 8 trucks at a starting price of $150,000 per unit would amount to an estimated cost of ~$570 billion (Hirs, 2020).
Annually, <10% of the existing fleet of 3.8 million Class 8 trucks are replaced. The New York Times reports that, through 2025, electric trucks only account for 4% of annual truck sales based on recent estimates. To speed up the shift to all-electric trucks by 2035, truck manufacturers need to increase their production beyond current levels and cease the production of diesel trucks (McMahon, 2018).
Maintenance-wise, Battery electric vehicles typically require less maintenance compared to their diesel-powered counterparts due to having fewer moving parts. The regenerative braking system in electric vehicles reduces wear on brakes and tires, potentially extending the preventive maintenance schedules for those components. However, the cost of battery replacement must be taken into account. As electric vehicles become more widely used and accepted, it is expected that the cost of batteries decrease. Fleets operate differently. Therefore, discussion costs about the vehicle need to include duty cycle, including the temperature in which the vehicle operates, average operating miles, maximum daily miles, and total miles the vehicle will travel annually must be considered (Ghadiali, 2020).
Fleets also need to determine how long they intend to keep the vehicle and then project its value at trade-in. This can be difficult to do, as there is not a large enough quantity of electric vehicles on the road to establish residual cost trend information. Items like insurance, permits, and licenses should be included in any cost calculation. However, they are likely to be on par with what a fleet is paying for its diesel-powered vehicles.
As E.V. trucks are electric-powered, the cost can change depending on the time of day and natural peak demand hours. Managing the charging of electric vehicles can have a significant impact on a fleet's charging costs that incurs. Another factor in the total cost of ownership calculation is the cost of installing charging infrastructure. This cost can vary widely depending on various factors, including the number of electric trucks, the time to charge the trucks, the existing infrastructure, and the local grid's capacity.
The cost of carbon emissions involves several factors and active variables. These include the Social Cost of Carbon, Uncertain Damage, Catastrophes from Carbon Emissions, and Cost to Future Generations.
According to experts, setting a carbon emission cost of $100 per ton would be economically feasible for capturing CO2 at gas-fired power plants and repurposing it for feedstocks in industries such as cement production, where companies like Solidia and CarbonCure are gaining traction. This cost of $100 per ton is considered the threshold where CCSU technologies intersect with what consumers and the market are willing to pay (Lierop, 2020).
Taxation to account for social damages has been in use for over a century, with economist Arthur C. Pigou from the University of Cambridge being a significant influence. According to Pigou, if an activity such as pollution results in a cost or damage to someone who is not responsible for it, then the government should impose a tax on the polluting activity that is equivalent to the damage caused. In essence, Pigou's approach gave Adam Smith's “invisible hand” a green tint.
To illustrate, when one ton of coal is burned, it generates approximately two tons of carbon dioxide as the carbon atoms combine with oxygen in the air. If the damages caused by each ton of carbon dioxide were set at $50, then Pigou's recommendation would be to impose a tax of $100 per ton of coal. This would ensure that the cost of coal reflects the societal cost of burning it, which is also known as the social cost of carbon (SCC). Integrated assessment model (IAM) is used to estimate this cost. These models are typically used by economists to calculate climate damages, using large computer models that capture the interaction between the economy and climate. The models utilize equations that describe the global economy, the worldwide distribution of CO2 emissions from economic activity, and the damage caused by increases in atmospheric and upper-ocean temperatures. William D. Nordhaus, a Yale University economist, developed the Dynamic Integrated Model of Climate and the Economy (DICE) program, which has had a significant impact on policy analysis. The Obama administration relied on three integrated assessment models (IAMs), including DICE, to establish the dollar value for cost-benefit evaluations of proposed new regulations, such as the 2011 increase in automotive fuel-economy standards. IAMs are so crucial that Nordhaus was granted the Nobel Prize in Economics in 2018 for his pioneering research in this fieldUncertain damages.
According to the Fifth Assessment Report of the Intergovernmental Panel on Climate Change, the equilibrium climate sensitivity is expected to fall within the range of 1.5 to 4.5°C, with <1°C being extremely unlikely and >6°C being very unlikely. However, the damages vary greatly between the lower and upper bounds of this range. To account for this uncertainty, integrated assessment model (IAM) modelers can run thousands of models with varying key parameters. The resulting reports provide policymakers with central estimates as well as upper and lower bounds to give an idea of the uncertainty surrounding the values of SCC.
Catastrophes are events that have a low probability of occurring but can result in significant damage. They include a range of “known unknowns”, such as the rapid melting of ice sheets in Greenland and West Antarctica, as well as significant changes in ocean currents, which can cause a rise in sea levels. Another category of catastrophic events stemming from carbon emissions involves “unknown unknowns”, such as unforeseen climate feedback mechanisms that may trigger a runaway warming scenario, such as the melting of all permafrost, which could release vast amounts of CO2 and methane, leading to catastrophic heating. JPMorgan Chase, an investment firm, has issued a report to its clients, warning that “catastrophic outcomes cannot be ruled out, which could threaten human life as we know it.”
A probable temperature rise can be represented on a graph with a normal distribution that takes the shape of a hump, with a low tail at the left (unlikely), a high hump in the middle (most likely), and a low tail on the right (unlikely). As we gain more knowledge about the climate system and its reaction to greenhouse gas emissions, we can adjust this distribution. Nonetheless, it seems that this distribution has a “fat tail”, which implies that the likelihood of experiencing significantly high temperature increases (the tail on the right side) declines at a slower rate than in a normal distribution. This creates a crucial problem for IAMs, as low-probability but high-damage events have anticipated damages that are immeasurable, and society would have to pay an inestimable amount to avoid them. Clearly, this is not feasible.
Therefore, should the U.S. decide to impose a carbon tax of $100 per metric ton, the additional cost to the current fleet fueled by petroleum-based diesel would be ~$43.8 billion annually. The chances of this happening is real and soon, which provides a significant incentive for the truck segment to shift away from diesel in a purely financial perspective, not to mention that the industry is a cutthroat business driven by tight margins. When used on highways, electric trucks emit 19–43% fewer greenhouse gas (GHG) emissions compared to diesel trucks. Assuming a carbon tax of $100 per metric ton of CO2 emissions, transitioning to an all-electric fleet would result in carbon tax savings of $8.3–18.8 billion for the nation's truckers. This would provide an annual return of 1.5–3.3% on the total cost of replacing a Class 8 vehicle (Hirs, 2020).
According to the United States Environmental Protection Agency (EPA) data (United States Environmental Protection Agency Office of Transportation Air Quality, 2020), medium-duty and heavy-duty trucks produce ~437.9 million metric tons of CO2 emissions each year. Implementing a carbon tax of $100 per metric ton in the U.S. for the current fleet, which operates on petroleum-based diesel, would result in an additional cost of around $43.8 billion annually. The chances of this happening is real and soon, which provides a significant incentive for the truck segment to shift away from diesel in a purely financial perspective, not to mention that the industry is a cutthroat business driven by tight margins. When used on highways, electric trucks emit 19–43% less greenhouse gas (GHG) emissions than diesel trucks. Assuming a carbon tax of $100 per metric ton of CO2 emissions, an all-electric fleet could save the nation's truckers $8.3–18.8 billion in carbon tax, which would translate to an annual return of 1.5–3.3% on the total cost of replacing a Class 8 vehicle (Hirs, 2020).
Diesel trucks traditionally consume between 2.2 and 3.3 kilowatt-hours per kilometer when fueled with petroleum, while an average electric truck requires only 1.44 kWh per kilometer. Tesla's semi-truck claims to require even less, only 1.15 kWh. Although this reduction in power requirements compared to diesel trucks is significant, the Tesla Semi requires one megawatt-hour of electricity to fully charge, which is approximately one-third of the annual electricity consumption of an average household in the European Union. If the current number of trucks in the E.U. and an average distance of 50,000 kilometers per year are assumed, a purely electric truck fleet in the E.U. would require an estimated energy demand of 324 terawatt-hours. This amount is equivalent to roughly 10% of the energy generated in the E.U. in 2015 (Kaufmann and Moynihan, 2019). The need for this much additional power poses a significant obstacle to the overall infrastructure approach of transitioning the industry toward electric trucks. To charge a fleet of 5–50 trucks rapidly, between 1.5 and 20 megawatts of power would be required using today's technology, necessitating the extension and rebuilding of the power grid. Additional stationary power-storage facilities, smart power grids, and high-voltage infrastructure near fast-charging stations must be approved to support all the extra power requirements.
In a different light, using replaceable batteries in electric trucks is an unconventional concept that could alleviate the pressures of immediate additional power infrastructure. After a battery-depleting route, the truck would simply replace an empty battery with a fully-charged one at its designated station—taking mere minutes than hours of charging (Kaufmann and Moynihan, 2019).
In addition to the need to synchronize electric vehicle objectives with power demands, policymakers must also take into account the costs of road maintenance. At present, road maintenance is financed by fuel taxes (which raise over $80 billion annually). The U.S. government classifies more than one-quarter of all urban interstates as being in fair or poor condition, and one-third of U.S. bridges require repairs (Zagorsky, 2019). In turn, in the U.S., electric cars and trucks could make America's crumbling roads even worse. Some states require a fixed fee from electric vehicle owners, but this comes with disadvantages, such as proceeds only going to state coffers, even though the driver also uses out-of-state roads and national highways. Soon, the electric vehicle industry still hopes to successfully have a network of charging stations that taxes E.V. users on their kilowatt purchases, similar to the existing taxes for Gas.
Pacific Gas and Electric Company has launched an online tool called the EV Fleet Savings Calculator, which assists businesses and organizations in calculating the expenses associated with switching their fleets to electric vehicles (EVs). This tool is specifically designed for business customers and public agencies that have medium-to-heavy-duty fleet vehicles, and it generates investment estimates based on factors such as fleet size, infrastructure, budget, and others. The EV Fleet Savings Calculator can be accessed through Pacific Gas and Electric Company's website (https://fleets.pge.com/).
The online saving platform can plot a fleet's size and vehicles it is comprised with, the average miles per vehicle, working days, charging windows, and electricity source. An example below shows a fleet of 25 heavy-duty trailer trucks that operates from Mondays to Saturdays and travels a daily average of 150 miles. It also has a charging availability from 5 p.m. to 4 a.m. and utilizes an electricity source from the California Grid. The graphs in Figure 6 show the savings generated from utilizing an E.V. fleet over a traditional fossil-fueled trailer truck fleet. Based on the scenario, using electricity instead of fossil fuel saves $300,000 annually. For 1,174,018 annual miles, this is a savings of $0.26 per mile. Switching to electricity also allow the scenario fleet to generate Low Carbon Fuel Standard (LCFS) credits, which could generate $627,000 per year (Advanced Clean Tech News, 2020). The simulation chart of the online saving platform is shown in Figure 7.
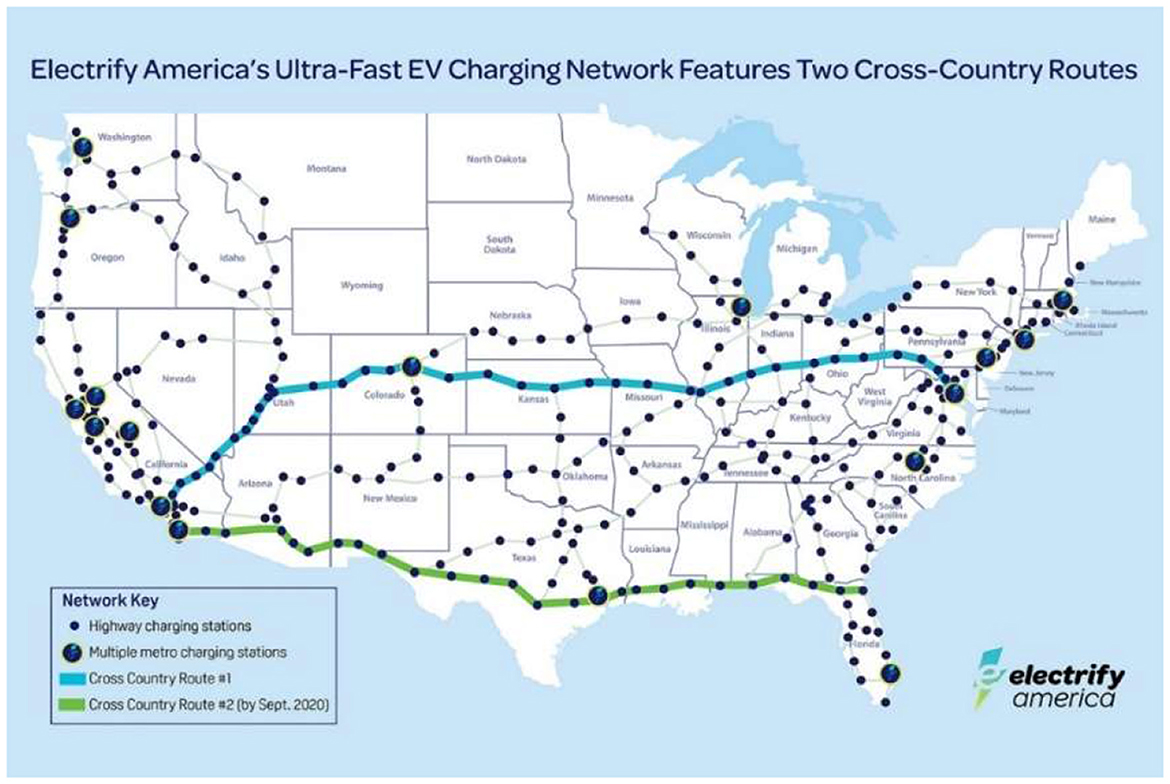
Figure 6. E.V. charging network (source: electrify America).
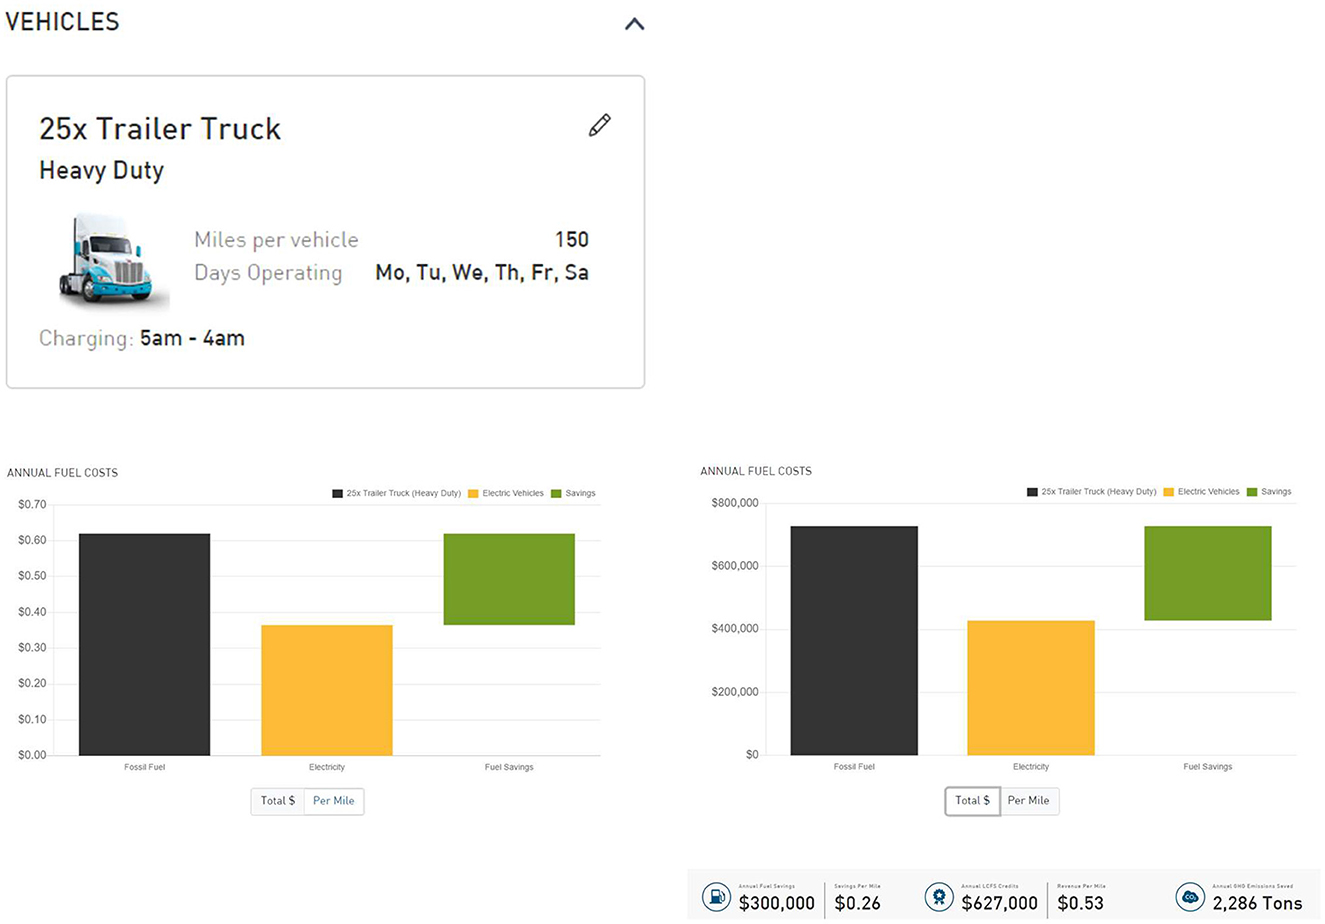
Figure 7. Simulation of cost saving.
Maintenance-wise, electric vehicles have fewer moving parts than diesel-powered vehicles, so it may need less maintenance. Using regenerative braking systems in battery electric vehicles can lead to less wear on brakes and tires, potentially extending preventive maintenance schedules. However, battery replacement has to be considered. As battery electric vehicles become more widely used, it is expected that their costs will decrease. However, when discussing costs related to these vehicles, it is important to consider the specific operating conditions of fleets. This includes factors such as duty cycle, temperature range, average and maximum daily operating distances, and the total annual distance traveled by the vehicle (Ghadiali, 2020).
In addition, fleets must evaluate the duration for which they plan to utilize the vehicle and anticipate its value during trade-in. However, it may be challenging to estimate as there is insufficient data on residual cost trends due to the limited number of electric vehicles on the road. Aspects such as insurance, permits, and licenses must be factored into any cost analysis. Nevertheless, they are expected to be comparable to the expenses incurred for diesel-powered vehicles by fleets.
The cost of electric-powered E.V. trucks can vary based on peak demand hours and time of day. Proper management of charging times can have a substantial effect on a fleet's charging expenses. In addition, the cost of charging infrastructure installation is another factor to consider in the total cost of ownership calculation. The installation cost can fluctuate depending on multiple factors, including the number of electric trucks, available charging time, existing infrastructure, and the local grid's capacity.
Making decisions about adopting new technology can be notoriously tricky. Throughout history, numerous examples of firms and consumers have hesitated to embrace new technology (Smith and Ulu, 2012).
In order to determine the viability of adding new technology or services, a thorough financial assessment alone is insufficient. Three additional areas of feasibility analysis, namely technical, cultural, and political assessments, must also be conducted. These assessments are integral to the feasibility analysis process, as making an informed decision about adopting new technology or services can be challenging. It is important to note that, similar to patients, healthcare providers often prefer the latest and most advanced technology. However, after performing a feasibility analysis that considers the technical, cultural, political, and financial factors, it may be determined that the new technology is not significantly superior to existing options to justify the investment. Therefore, all four assessments must be considered in the overall feasibility process when evaluating the potential of adding new technology and services.
Adopting electric vehicles (EVs) in various sectors, including logistics, has several practical, social, and policy implications.
The practical implications include the infrastructure, range limitation, and battery technology. The widespread adoption of EVs requires the development of robust charging infrastructure. This involves installing charging stations at various locations, including warehouses, distribution centers, and transportation routes. Logistics companies must plan and invest in charging infrastructure to ensure reliable and convenient access to charging facilities. EVs typically have a limited driving range compared to traditional vehicles. Logistics companies need to consider the range of EVs when planning delivery routes and scheduling operations to avoid range anxiety and ensure timely deliveries. And finally, the advancements in battery technology are crucial for improving the range, charging speed, and lifespan of EVs. Logistics companies must stay updated with battery technology developments to make informed vehicle purchase decisions and optimize operations.
The social implications involve improved air quality and noise reductions. Adopting EVs in logistics helps improve air quality, particularly in densely populated urban areas. By reducing tailpipe emissions, EVs contribute to a healthier and cleaner environment, benefiting both workers in the logistics industry and the public. EVs are quieter than vehicles with internal combustion engines. Their use in logistics operations can help reduce noise pollution, particularly during last-mile deliveries in residential areas. This aspect enhances the quality of life for people living in urban environments.
And finally, the policy implications, Incentives—Governments often provide incentives to promote EV adoption, such as tax credits, subsidies, and grants. These incentives encourage logistics companies to invest in EVs by offsetting the higher upfront costs and making them more financially attractive. Regulations—Governments are implementing stricter emissions regulations to combat climate change and air pollution. Logistics companies must comply with these regulations, including emissions standards and penalties for non-compliance. Adopting EVs helps companies meet these requirements and avoid potential penalties. Governments are promoting using renewable energy sources for charging EVs to maximize overall environmental benefits. Logistics companies may need to align their operations with these policies and consider renewable energy sources for their charging need.
Overall, the practical, social, and policy implications of EV adoption in the logistics industry are interconnected. By addressing these implications effectively, logistics companies can contribute to a more sustainable, efficient, and environmentally friendly transportation system.
All authors listed have made a substantial, direct, and intellectual contribution to the work and approved it for publication.
The authors declare that the research was conducted in the absence of any commercial or financial relationships that could be construed as a potential conflict of interest.
All claims expressed in this article are solely those of the authors and do not necessarily represent those of their affiliated organizations, or those of the publisher, the editors and the reviewers. Any product that may be evaluated in this article, or claim that may be made by its manufacturer, is not guaranteed or endorsed by the publisher.
Advanced Clean Tech News (2020). EV Fleet Savings Calculator to Help With E.V. Cost Analysis (2020). Available online at: https://www.act-news.com/news/ev-fleet-savings-calculator-to-help-with-ev-cost-analysis/ (accessed March 15, 2021).
American Transportation Research Institute (2019). Critical Issues in the Trucking Industry –, 2019.
Berman, B. (2020). Electrify America Completes Its First E.V. Fast-Charging Cross-Country Route. Electrek. Available online at: https://electrek.co/2020/06/24/electrify-america-completes-fast-charging-cross-country-route/#:~:text=Electrify%20America%20plans%20to%20complete,west%20coasts%20are%20already%20available (accessed February 6, 2021).
Beveridge, R. N. (2008). Assessing New Technology: The Role of Feasibility Analysis. Available online at: https://www.cathlabdigest.com/articles/Assessing-New-Technology-The-Role-Feasibility-Analysis (accessed March 16, 2021).
Black, E. (2020). How Tesla, GM and Others Aim to Fix Electric Vehicle Range Anxiety. CNBC. Available online at: https://www.cnbc.com/2020/09/26/how-tesla-gm-and-others-aim-to-fix-electric-vehicle-range-anxiety.html (accessed February 1, 2021).
Breiter, A., Hackert, P., Han, W., Hensley, R., and Schwedhelm, D. (2020). Improving Battery-Electric-Vehicle Profitability Through Reduced Structural Costs. McKinsey Center for Future Mobility.
Bureau of Transportation Statistics (2018). 2017 North American Freight Numbers. Available online at: https://www.bts.gov/newsroom/2017-north-american-freight-numbers#:~:text=Trucks%20carried%2057.7%20percent%20of,the%20value%20(Table%202) (accessed February 2, 2021).
Burrows, D. (2020). The Trucking Industry's Fuel Efficiency Is Still Far Too Low, While Carbon Output Is Far Too High. Global Trade. Available online at: https://www.globaltrademag.com/the-trucking-industrys-fuel-efficiency-is-still-far-too-low-while-carbon-output-is-far-too-high/ (accessed February 2, 2021).
Carpenter, S. (2020). Big Rigs Begin to Trade Diesel for Electric Motors. The New York Times. Available online at: https://www.nytimes.com/2020/03/19/business/electric-semi-trucks-big-rigs.html (accessed February 6, 2021).
Downing, S. (2020). 8 Electric Truck and Van Companies to Watch in 2020. GreenBiz. Available online at: https://www.greenbiz.com/article/8-electric-truck-and-van-companies-watch-2020 (accessed January 31, 2021).
Gaines, B. (2018). Smartphone Disruption: The Disruption Series. Reset Strategies. Available online at: https://resetstrategies.com/smart-phones-disruption-the-disruption-series/ (accessed March 22, 2021).
Ghadiali, M. (2020). Understanding the TCO of Electric Trucks. Fleet Owner. Available online at: https://www.fleetowner.com/industry-perspectives/ideaxchange/article/21120220/understanding-the-tco-of-electric-trucks (accessed March 15, 2021).
Hall, K. (2020). Federal Funding for Electric-Car Technology Announced in G.M. Visit. The Detroit News. Available online at: https://www.detroitnews.com/story/business/autos/2020/07/16/federal-funding-electric-car-technology-announced-gm-visit/5446672002/ (accessed February 1, 2021).
Hirs, E. (2020). Spending $500B on Electric Trucks Could Make Economic Sense, but Only With a Carbon Tax. Forbes. Available online at: https://www.forbes.com/sites/edhirs/2020/07/16/the-low-carbon-economy-transition-electric-trucks/?sh=13989b7c60e7 (accessed February 7, 2021).
Hirsch, J. (2020). Economics of Electric Trucks Remain an Adoption Challenge. Trucks.com International. Available online at: https://www.trucks.com/2020/12/14/economics-of-electric-trucks/ (accessed February 14, 2021).
Hsu, T. (2016). Trucking Firms Embrace Fuel Efficiency Strategies, not Alternative Fuels. Trucks.com. Available online at: https://www.trucks.com/2016/10/17/truckers-fuel-efficiency-alternative-fuels/ (accessed February 5, 2021).
Kaufmann, J., and Moynihan, Q. (2019). Electric Trucks Like the Tesla Semi are 'Pointless Both Economically and Ecologically,' According to a Vehicle-Tech Expert. Business Insider. Available online at: https://www.businessinsider.com/this-expert-says-tesla-semi-is-economically-and-ecologically-pointless-2019-2 (accessed February 7, 2021).
Lierop (2020). Our Carbon Problem is A Multibillion-Dollar Opportunity. Available online at: https://www.forbes.com/sites/walvanlierop/2020/02/27/our-carbon-problem-is-a-multibillion-dollar-opportunity/?sh=72afba883649
Luttrell, B. (2015). Freight Corridors and Logistics Hubs Shape the Location Decision. Area Development. Available online at: https://www.areadevelopment.com/logisticsInfrastructure/Intermodal-Sites-Q1-2015/site-selection-process-supplychain-optimization-linked-74421.shtml#:~:text=Locations%20of%20some%20top%20logistics,City%2C%20and%20northern%20New%20Jersey (accessed February 6, 2021).
McLane, R., and Liu, Q. (2021). The United States Needs More Fast Chargers: China Can Show How. RMI. Available online at: https://rmi.org/the-united-states-needs-more-fast-chargers-china-can-show-how/ (accessed February 5, 2021).
McMahon, J. (2018). Electric Vehicles Cost Less Than Half as Much to Drive. Forbes. Available online at: https://www.forbes.com/sites/jeffmcmahon/2018/01/14/electric-vehicles-cost-less-than-half-as-much-to-drive/?sh=3df9f0293f97 (accessed February 1, 2021).
Mohammed, J., and Islam, M. (2022). “Innovation and entrepreneurship for self-reliant and localized economy,” in Transitioning from globalized to localized and self-reliant economies (IGI Global), 1–13
Mohammed, J., and Sadique, A. (2011). Lean Value Stream Manufacturing for Sustainability Advances in Sustainable Manufacturing. New York, NY: Springer-Verlag.
Palmer, B. (2020). Electric vs. Gas: Is It Cheaper to Drive an E.V.? Available online at: https://www.nrdc.org/stories/electric-vs-gas-it-cheaper-drive-ev#:~:text=The%20average%20sticker%20price%20on,the%20life%20of%20the%20vehicle (accessed February 01, 2021).
Pyper, J. (2020). Automaker Electric Vehicle Plans' Progressing at a Rapid Pace' Despite Pandemic, Economic Downturn. Atlantic Council. Available online at: https://www.atlanticcouncil.org/blogs/energysource/automaker-electric-vehicle-plans-progressing-at-a-rapid-pace-despite-pandemic-economic-downturn/ (accessed January 31, 2021).
Schefter, K., and Zaccagnino, M. (2019). Electric Vehicle Sales: Facts and Figures. Washington, DC: Edison Electric Institute.
Schoettle, B., Sivak, M., and Tunnell, M. (2016). A Survey of Fuel Economy and Fuel Usage by Heavy-Duty Truck Fleets. Sustainable Worldwide Transportation - University of Michigan and American Transportation Research Institute.
Smith, J. E., and Ulu, C. (2012). Technology adoption with uncertain future costs and quality. Operat. Res. 60, 262–274. doi: 10.1287/opre.1110.1035
Sperling, D. (2018). Three Revolutions: Steering Automated, Shared, and Electric Vehicles to a Better futurE. Washington, DC: Island Press.
U.S. Department of Transportation Freight Management Operations (2020a). Estimated Average Daily Truck Traffic: 1998. Available online at: https://ops.fhwa.dot.gov/freight/freight_analysis/nat_freight_stats/docs/05factsfigures/fig2_4.htm (accessed January 31, 2021).
U.S. Department of Transportation Freight Management Operations (2020b). Estimated Average Daily Truck Traffic: 2020. Available online at: https://ops.fhwa.dot.gov/freight/freight_analysis/nat_freight_stats/docs/05factsfigures/fig2_4.htm (accessed January 31, 2021).
U.S. Department of Transportation Bureau of Transportation Statistics Federal Highway Administration. (2019). Freight Analysis Framework, version 4.5. Available online at: https://www.bts.gov/projected-average-daily-long-haul-truck-traffic-national-highway-system-2045
United States Environmental Protection Agency Office of Transportation Air Quality (2020). Fast Facts: U.S. Transportation Sector Greenhouse Gas Emissions 1990 - 2018. Available online at: https://nepis.epa.gov/Exe/ZyPDF.cgi?Dockey=P100ZK4P.pdf (accessed February 28, 2021).
Valdes-Dapena, P. (2019). The Electric Car Revolution Is Coming. This Is What Has to Happen First. CNN. Available online at: https://www.cnn.com/2019/07/18/cars/electric-car-market-sales/index.html (accessed January 31, 2021).
Weiss, M., and Cloos, K. (2020). Energy efficiency trade-offs in small to large electric vehicles (1174756395 880441116 E. Helmers, Ed.). Environ. Sci. Eur. 32. doi: 10.1186/s12302-020-00307-8
Zagorsky, J. L. (2019). How Electric Cars Could Make America's Crumbling Roads Even worse. Phys.org. Available online at: https://phys.org/news/2019-02-electric-cars-america-crumbling-roads.html (accessed February 8, 2021).
Keywords: electric vehicle, fleet adoption, logistics, supply chain, supply chain 4.0, E.V. revolution, carbon emissions
Citation: Mohammed J and Villegas J (2023) Total impact of electric vehicle fleet adoption in the logistics industry. Front. Sustain. 4:1158993. doi: 10.3389/frsus.2023.1158993
Received: 04 February 2023; Accepted: 07 August 2023;
Published: 28 September 2023.
Edited by:
Sharfuddin Khan, University of Regina, CanadaReviewed by:
Sherbaz Khan, Institute of Business Management, PakistanCopyright © 2023 Mohammed and Villegas. This is an open-access article distributed under the terms of the Creative Commons Attribution License (CC BY). The use, distribution or reproduction in other forums is permitted, provided the original author(s) and the copyright owner(s) are credited and that the original publication in this journal is cited, in accordance with accepted academic practice. No use, distribution or reproduction is permitted which does not comply with these terms.
*Correspondence: Jaby Mohammed, am1vaGFtbUBpbHN0dS5lZHU=
Disclaimer: All claims expressed in this article are solely those of the authors and do not necessarily represent those of their affiliated organizations, or those of the publisher, the editors and the reviewers. Any product that may be evaluated in this article or claim that may be made by its manufacturer is not guaranteed or endorsed by the publisher.
Research integrity at Frontiers
Learn more about the work of our research integrity team to safeguard the quality of each article we publish.