 Babatunde Abimbola Abiola
 Martine Visser
 Reza Che Daniels
- Environmental Policy Research Unit, School of Economics, University of Cape Town, Cape Town, South Africa
This research analyses the impact of retailer interventions focusing on the promotion of reusable bags to reduce plastic bag consumption. For this purpose, retail outlet data for March 2018–February 2020 was used. The retail outlet data was analyzed using a panel fixed effects model to evaluate the impact of three treatments on plastic and reusable bag consumption in South Africa. Findings revealed that Treatments 1 (a monetary intervention based on giving reusable bags away for free), and 2 (a non-monetary intervention framed around a plastic-free July campaign), significantly increased reusable bag uptake and reduced plastic bag consumption, while Treatment 3 (a monetary intervention involving a subsidy on reusable bags) increased reusable and plastic bag sales. The findings contribute to the literature on the effectiveness of non-monetary nudges (T2). The latter is more efficient than the monetary incentives (T1 and T3). The results also agrees with the literature on the ineffectiveness of subsidies (T3) for the purpose of discouraging the consumption of plastic bags. The results confirmed that plastic bag consumption is habitual in South Africa. Based on these findings, policy recommendations were made that public campaigns and other behavioral nudges should be considered more effective in addressing the consumption of plastic bags than subsidies on reusable bags. In addition, because of the revealed low level of reuse of both plastic and reusable bags, the use of reminders to reuse bags should be considered and researched in order to modify consumer behavior in South Africa.
1. Introduction
Pollution from plastic bags has become a crisis globally, with the growing waste problem in cities and oceans. Given the impact of this phenomenon on the food supply chains, terrestrial and marine animals and humans have been increasingly endangered (Adane and Muleta, 2011; Otsyina et al., 2018). According to a 2015 report, Nigeria and South Africa ranked 9th and 11th respectively among the top 20 countries with the most polluted oceans (Jambeck et al., 2015). These two countries have the largest economies in sub-Saharan Africa (SSA), in addition to having the largest number of people in the coastal areas (Jambeck et al., 2015). Respectively, they mismanaged 83% and 56% of their wastes in 2010 (Jambeck et al., 2015). However, in South Africa, the government had initiated some policy actions to try and contain the growing waste problem. For example, South Africa was one of the leading developing countries to adopt a plastic bag levy in 2004 (Dikgang et al., 2012a). Unfortunately, though, unlike the case of the developed countries—Norway and Ireland for example – the plastic bag levy only achieved a short-term reduction in plastic bag consumption despite general compliance by retail outlets (Dikgang et al., 2012a).
On one hand, several African countries have adopted policies aimed at containing the plastic pollution problem in their cities and oceans. For example, Kenya, Rwanda and Tanzania adopted a command-and-control policy which criminalizes the production and consumption of single-use plastic bags. Similarly, South Africa and Botswana applied economic instruments such as the imposition of plastic bag levy to discourage the consumption of single-use plastic bags.
The current predicament in South Africa is ineffective government policy in addressing the plastic consumption crisis. Dikgang et al. (2012a,b) revealed that price elasticity remained inelastic and sometimes positive. This indicates the ineffectiveness of a policy after 7 years of general compliance. The aftermath of “the failed policy” was a scientific report that positioned South Africa's oceans as the 11th most polluted globally (Jambeck et al., 2015). The report added that South Africa mismanaged 56% of its waste with the greater proportion of the waste leaking into the environment (Jambeck et al., 2015).
Plastic bags are one of the significant constituents of marine plastic pollution and also contributes to microplastics' build-up in the ocean (UNEP, 2016). The fact that it pollutes the environment has become a matter of serious concern for governments, environmental lobbyists, and NGOs worldwide (Hopewell et al., 2009). This has mounted pressure on retail outlets to discourage the consumption of plastic bags by customers. At payment tills, the purchase of plastic bags has become a habitual behavior among customers of retail outlets. This prevalent habitual behavior continues despite the imposed levy and various available alternatives and campaigns to discourage it (Danner et al., 2008; Neal et al., 2011). In addition to economic instruments such as taxes, subsidies and provision of deposit-refund systems, several other approaches are under consideration to reduce single-use plastic bags and marine debris in South Africa. The alternative policy responses include nudges and command-and-control measures to steer people toward pro-environmental behavior (Danner et al., 2008; Neal et al., 2011; Ohtomo and Ohnuma, 2014).
In line with several policy actions to discourage the excessive consumption of plastic bags in South Africa, in 2019 a retailer introduced three different interventions/treatments at various times to increase the uptake of reusable bags and reduce plastic bag consumption. The first treatment (T1) was a reusable bag giveaway in which almost 300,000 customers got free reusable bags valued at R25 ($1.7) each during April. The second treatment (T2) was the July plastic-free month loaded with nudges, including campaign messages for consumers, store-level campaigns and changes in the default question asked by cashiers. The third treatment (T3), which came in October, was a massive roll-out of R4 bags- the cheapest reusable bags available to consumers as an alternative to plastic bags. The primary focus of this research is to investigate the impact of the three interventions rolled out during 2019.
This paper aims to analyse the effectiveness of store-level interventions in reducing plastic bag consumption in South Africa. The retailer intervention included monetary (T1 and T3) and non-monetary (T2) interventions in the sale of reusable bags and plastic bags. This study estimates the immediate impacts of the three treatments, namely the April giveaway (T1), the July plastic-free month (T2) and the R4 reusable bag roll-out and its subsidy (T3) on the uptake of reusable bags as well as on sales of plastic bags.
The rest of this paper is structured as follows: section 2 reviews the literature. Section 3 provides the background for the interventions and stylized facts. Section 4 explains the model specification, data and estimation methods, and Section 5 presents the results and discussion of findings. Finally, Section 6 summarizes, concludes and provides policy recommendations.
2. Literature review
Plastic bags are sturdy, versatile and low-cost packaging solutions, and are thus ubiquitous today. However, there is growing evidence that the current usage of plastics and their disposal contribute to substantial degradation of the terrestrial environment (Adane and Muleta, 2011; Otsyina et al., 2018) and marine environment (Barnett et al., 2016; Mellish et al., 2016). This crisis associated with plastic litter has drawn the attention of policymakers from developed, middle-income and developing countries toward the urgency of intervention (Hopewell et al., 2009; Dikgang et al., 2012a,b; He, 2012; Zen et al., 2013; Rivers et al., 2017; Heidbreder et al., 2019). The peculiar complexity of the problem lies in the involvement of all economic agents, including government, firms (plastic producers and retail outlets) and households. Addressing this type of problem, therefore, must involve the willingness and participation of all stakeholders. The impact of private business intervention in promoting pro-environmental behavior is scarcely documented in the literature (Lucas et al., 2008; Elf et al., 2021). As far as we know, there is no current study in the literature focusing on Africa countries, that demonstrates how private business intervention enhances pro-environmental behavior in the area of single use plastic bags. Studies from developed countries are limited in applicability to Africa and other developing countries due to differences in infrastructural development and quality of waste management system. This study follows studies that identify the strength of non-monetary intervention through drawing inferences from the nudging idea. These studies identified that non-monetary intervention could have more potential impact in promoting pro-environmental behavior than monetary incentives (Ferraro and Miranda, 2013; Lin et al., 2017; O'Hara and Sparrow, 2019; Van Bavel et al., 2019; Castleman and Meyer, 2020).
This literature review is divided into three parts. Section 2.1 presents literature on the provision of alternatives to plastic bags and covers the importance of eco-friendly alternatives when marketed goods pose a danger to the environment. Section 2.2 explains the literature on how nudges enhance pro-environmental behavior. More so, the section discusses the concept of nudges as a public policy instrument and uses non-pecuniary nudges to improve pro-environmental behavior. Lastly, Section Subsidies and pro-environmental behavior focus behavior on the impact and criticism of subsidies as an incentive toward enhancing pro-environmental behavior.
2.1. Provision of alternatives to plastic bags
The non-availability of alternatives to plastic bags remains a challenge to many environmentally conscious persons purchasing single-use plastic bags. Affordability to the consumer is another obstacle to consider. The absence of alternatives characterized the introduction of the plastic bag levy in South Africa. Later, retail outlets introduced reusable bags to their consumers with a price range of R15 to R50. It became apparent that many consumers could not afford the alternatives since 40% of the populace comprise non-Ricardian households (i.e., poor households that depend mainly on government grants) (De Vos et al., 2020). The unaffordability of alternatives is likely to result in the perception that socioeconomic status correlates with pro-environmental behavior. Due to the importance of providing alternatives, a few studies have investigated the effectiveness of alternatives (Clapp and Swanston, 2009; Santos and van der Linden, 2016; Martinho et al., 2017).
Studies show that consumers are more pro-environmentally inclined when provided with alternatives that relate to electricity usage (Clapp and Swanston, 2009), and water usage (Santos and van der Linden, 2016). The consumption of plastic bottles in the United States of America also revealed enhanced pro-environmental behavior when provided with cheaper alternatives (Martinho et al., 2017). However, similar studies, particularly in the African context, have not yet investigated the case of plastic carrier bags. Many studies have focused on monetary nudges such as levies (Martinho et al., 2017; Silva et al., 2017). Santos and van der Linden (2016) investigated the phenomenon in a study of US students. A group of students were given reusable water bottles at their matriculation to determine whether it would impact disposable bottle usage. The result was a significant reduction in their use of disposable bottles, and the group also supported a disposable bottle ban in their university.
In a study of Japanese students and reusable bottles, the young people displayed more responsible attributes like willingness to pay for eco-friendly alternatives, environmental consciousness and knowledge about the reduction of the use of plastic bottles, before implementing a water refill system (Uehara and Ynacay-Nye, 2018; Heidbreder et al., 2019). Studies focusing on the United Kingdom showed that numerous interventions in the provision of reusable coffee cups increased both the short-run and long-run usage, while reducing consumption of disposable cups. Poortinga and Whitaker (2018) emphasized the complementary effect of combining interventions. Their study reveals that the provision of alternatives coupled with message framing could result in a more significant reduction in plastic consumption. On their part, Heidbreder et al. (2019) agreed that providing alternatives was a promising approach to reducing plastic waste.
2.2. Nudges for enhancing pro-environmental behavior
The criticisms against command-and-control regulations brought up the idea of nudges as an alternative intervention. Drawbacks of such regulations include cost-ineffectiveness, end of pipe solution, stifling of innovation and inefficient and complex implementation. Nudges are intervention instruments designed to amend choice architecture through changes in the environment's physical or informative structure at a particular decision-making corridor to naturally automate behavioral changes (Thaler and Sunstein, 2008; Kallbekken and Sælen, 2013; Lehner et al., 2016). Lehner et al. (2016) describe nudges as a collective term for different policy tools under the umbrella of behavioral influencers to change individual choices. The authors classify nudges into four forms of policy tools, namely: (1) simplification and framing of information, (2) changes to the physical environment, (3) changes to the default policy and (4) social norms. The effectiveness of each form is well-documented in the literature [see Lehner et al. (2016)].
In this study, nudge interventions in the retail sector include campaign messages, physical display of alternatives, rephrasing of cashier statements and store enhancement to improve cashier compliance with the designed treatment. This study used all these nudge instruments during the July plastic-free month, classified as a T2 non-monetary intervention. The relevance of such nudges as public policy tools has been well-documented in the literature (Goldberg and Gunasti, 2007; Freedman and Brochado, 2010; Egebark and Ekström, 2016; Lehner et al., 2016). The following relevant literature also successfully used campaign message as nudging instrument to change behavior (Lin et al., 2017; O'Hara and Sparrow, 2019; Van Bavel et al., 2019; Castleman and Meyer, 2020).
Despite studies on the effectiveness of nudges as an intervention, there is nevertheless a gap in the literature for related studies with reference to Africa generally and South Africa specifically, especially regarding plastic bag consumption.
2.3. Subsidies and pro-environmental behavior
Several studies support the provision of subsidies to enhance pro-environmental behavior and improve the uptake of environmentally friendly goods. Scholarly research has demonstrated this in terms of exploring alternative water sources (Martínez-Espiñeira et al., 2014; Santos and van der Linden, 2016; Holland et al., 2019; Vu and Wu, 2022) and clean energy supply (Clapp and Swanston, 2009; Steinhorst and Matthies, 2016; Zhang et al., 2018; Cheung et al., 2019; Dong et al., 2020). However, not many studies have investigated the effectiveness of subsidies in promoting the consumption of eco-friendly bags (Poortinga and Whitaker, 2018; Spranz et al., 2018). Poortinga and Whitaker (2018) argue that subsidies without campaigns or promoting awareness among consumers were less effective. Moreover, there is evidence that having choices available motivate consumers to engage in pro-environmental behavior (Clapp and Swanston, 2009; Santos and van der Linden, 2016; Martinho et al., 2017).
There is a need for additional measures to combat the environmental impact of plastic bags in order to promote environmental consciousness among South African consumers (Dikgang et al., 2012b). Many retail outlets are under pressure to reduce the number of plastic bags they supply to customers. The pressure in turn enhances their effort to implement measures to nudge their consumers to become environmentally aware and consume fewer plastic bags. Some of these measures include the production of alternatives e.g., reusable bags, pro-environmental campaigns, and an internal ban on the consumption of plastic bags in some areas. However, such actions should not risk the loss of customers. Several interventions that were implemented by retailers have been detailed in the literature, as indicated earlier. It is important to scientifically evaluate the impact of the interventions, both monetary and non-monetary, to ascertain their policy implications.
3. Background of the interventions
In 2019, a retailer introduced three significant interventions to reduce the sale of plastic bags and increase the uptake of reusable bags. The retailer's name is not mentioned due to a non-disclosure agreement and to avoid revealing the retailer strategies to competitors in the market. The retailer has nationally represented in all the provinces and metros with 20% of the total plastic bag sales in South Africa.
3.1. Promotion of reusable bags through giveaway intervention, April 2019 (T1)
This promotion was launched between 8 and 22 April 2019 as an integral part of the retailer's Easter campaign by which customers could win reusable bags daily. The winning customers were randomly selected to win one of the five different promotional reusable bags. The selection involved multiple winners per store per day, although the number of winners varied according to store format. In addition, a criterion was that a consumer should spend a minimum of R50. The promotion, however, excluded the retailer's mobile application users, self-service kiosks, retailers' employees and self-service tills. In addition, a winner received a 1% discount on his/her total purchase, which was an internal control to trigger the pop-up message announcing the winner of a reusable bag. The price-redeeming process included signing a Consumer Protection Act (CPA) form/waiver establishing an agreement that a photograph may be displayed on the retailer's social media pages and other platforms to advertise the bags. This was regarded as a giveaway treatment (T1-Monetary) making use of a lottery system and benefitting almost 300,000 shoppers.
In line with the literature on the provision of alternatives to single-use plastic products (Santos and van der Linden, 2016; Poortinga and Whitaker, 2018; Uehara and Ynacay-Nye, 2018; Heidbreder et al., 2019), one of the objectives of this study was to investigate the impact of the retailer giveaway intervention, regarded as Treatment 1 (T1-monetary), on the uptake of reusable bags and consumption of plastic bags.
3.2. July plastic-free month (T2)
As part of global initiatives to eradicate single-use plastic bags, 3 July 2019 was declared International Plastic Bag-free Day with specific focus on the reduction of the use of single-use plastic bags. Retail outlets had both internal and external pressure to partake in that campaign. The challenge ran throughout July 2019 with the retailer implementing non-monetary treatments. The interventions implemented by the retailer are categorized into three nudges as explained in Lehner et al. (2016):
3.2.1. Campaign messages for consumers
The first of the three nudges was a campaign to forbid the retail outlets to sell plastic bags during that month and was announced on their consumer and retail outlet websites before implementation. Also, messages with similar content were sent to consumers.
3.2.2. Store-level campaign
This was a structure put in place during the intervention. It included a display of campaign posters with phrases like “Help us not to sell plastic bags” and the provision of alternatives to plastic bags in fancy frames, displayed close to the cashier at checkout points.
3.2.3. Changes to cashier default question
This nudge tool changed the default cashier question, “Do you want a plastic bag?”, to “Do you have a recyclable bag?”, pointing the attention of customers to the reusable bags, displayed in shelf frames, from which they could choose. These efforts were intensified by an inter-store competition which was referred to as an “inter-store challenge” to mark the International Plastic Bag-Free Day. There was a call on all stores to strongly persuade the customers not to buy plastic bags with the promise of national recognition. It is worth mentioning that retail outlets recorded 19 outstanding stores of which the proportion of plastic bag sales were <3% of the total bags sold. This implies that more than 97% of the consumers either bought reusable bags or brought their own bags for the Plastic Bag-Free Day.
Australia was the first country to launch a plastic-free month challenge before it became a global challenge. This later gave birth to a global community with 120 million participants in 177 countries in 2018. The challenge was to avoid, as much as possible, single-use plastics which included single-use plastic packaging or carriers, cutlery, coffee cups and bottled drinks, among others, to achieve the plastic-free goal.
Several literature reviews exist on the effectiveness of public campaigns, changes in default settings, increasing awareness and promoting the willingness of consumers to become environmentally conscious (Chib et al., 2009; Zen et al., 2013; Veiga et al., 2016; Xanthos and Walker, 2017; Latinopoulos et al., 2018; Heidbreder et al., 2019). These reviews provided a framework for our analysis in studying the impact of interventions carried out by this South African retailer.
3.3. October roll-out of R4 budget bags (T3)
After a successful trial at the beginning of the year, the R5 reusable bag was launched and subsidized to R4 per bag in October 2019. One million pieces of reusable bags were produced as an alternative to plastic bags and other more expensive reusable bags. This new, affordable bag was made from green Polyethylene Terephthalate and its purpose was to become an affordable alternative to retail plastic bags for all income groups. Caboz (2019) reported that the reusable bag (R5) carried a load of between 16 to 18.4 kg. The report also extolled the initiative as an innovative way of enhancing waste reduction, job creation and encouraging pro-environmental behavior, given that the bag was the cheapest reusable bag available. The production required approximately two polymers of 500 ml green Polyethylene Terephthalate (PET) for one bag. This PET was collected from two primary sources: municipal recycling programmes and an informal waste collection workforce of 75,000 collectors who earned a living from selling their PET bottles to recycling depots.
The Jay (2019) report further showed that the bag could be re-entered into the same recycling cycle at the end of its life. This meant that when the bags eventually wear out, customers could take them to the stores and have them replaced at no charge. The reason for the use of green PET bottles was that these bottles tended to be left out of the recycling process due to short demand. Collectors tended to get a higher price for clear bottles (as this fiber was used more widely), so they were more likely to leave a colored bottle behind unless they had space to transport it. The price (R) at the roll-out stage required a ninefold use of the R4 bag to make up for the difference in the cost of purchasing one standard 24-liter plastic bag (60c).
It is thus important to study the uptake of this affordable bag to determine the sustainability of the business, given the waves of its impact, such as waste reduction, job creation and increased pro-environmental behavior by the consumer. The subsidy of R1 each on first 1million quantity produced was to induced customer to reduce their consumption of plastic bag and increase demands for new affoidable reusable bag.
3.4. Stylised facts on retailer interventions
This section analyses and describes trends in the sale of plastic shopping bags and reusable bags. Figure 1 shows that the three interventions (T1, T2 and T3) all led to a significant increase in the uptake of reusable bags during the months of intervention. However, Figure 2 shows that on average, the sale of plastic bags did not decrease proportionately during the months of intervention, despite lower sales during 2019 compared to 2018.
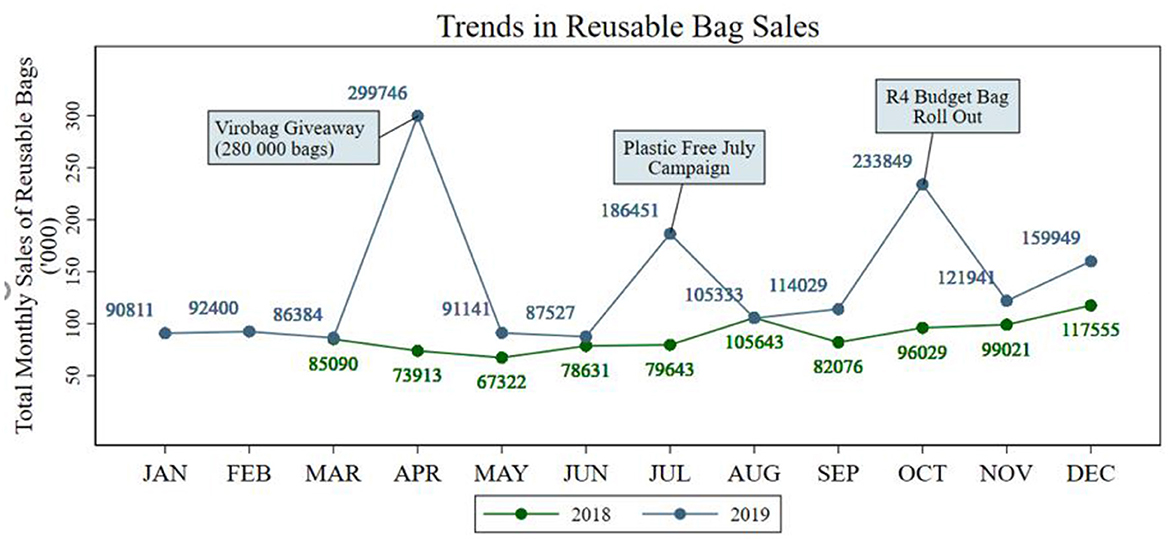
Figure 1. Trends in reusable bag sales during 2018 and 2019.
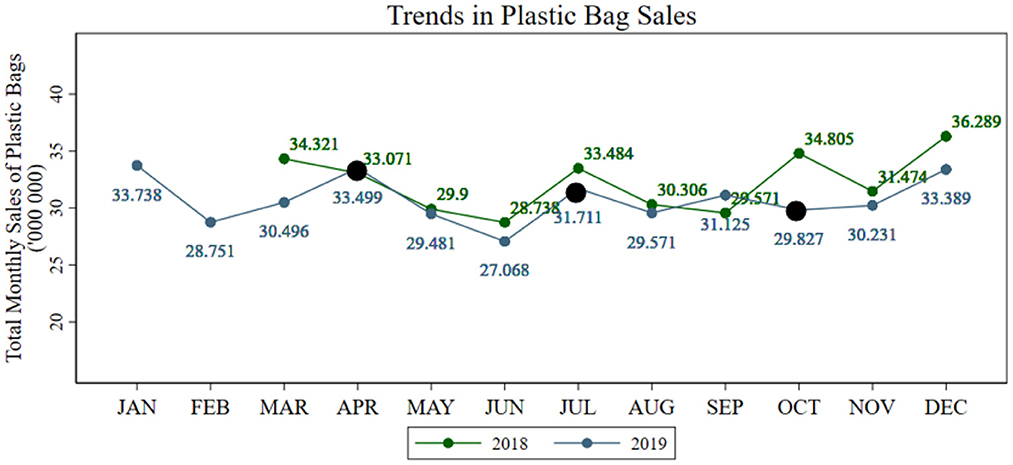
Figure 2. Trends in plastic bag sales during 2018 and 2019.
The graphs in Figures 1, 2 suggest that, although the three interventions all had a significant impact on the once-off uptake of reusable bags, there was no significant impact on the sale of plastic bags. A comparison of the figures for the different months indicates no significant change in the average number of plastic bags sold during the months of intervention. When considering interventions that promoted reusable bags over plastic bags, it makes sense to analyse the stores that consistently sold a non-negligible number of reusable bags.
These figures do not provide a full picture as there is no way of knowing what the plastic bags sales would have been had there been no interventions. Many other factors influenced the sale of plastic bags, and it is impossible to visualize this fact with trend analysis. It thus becomes imperative to employ a regression model to further analyse the impact of the interventions.
4. Model specification, data and methods of estimation
This section has sub-sections. The first introduces the data sources that were used in this study, followed by a model specification in the next section. Thereafter the estimation methodology is described, concluding with a section on the appropriateness thereof.
4.1. Data presentation
The data used in this study is from a recognized nationwide retail outlet. The name will not be mentioned due to a non-disclosure agreement. The retailer accounts for more than 20% of the annual total sale of plastic bags in South Africa for the year under consideration.
The data for the weekly store sales of the plastic carrier bags and reusable bags, including store characteristics such as store size, store brand and demographics, were obtained from the retail outlet. This gives a historical dataset comprising 1,039 stores over a period of 104 weeks, spanning from March 2018 to February 2020. The panel data was generated from a retailer data file, in which the cross-section and time dimensions of the data were represented by the stores and the weeks, respectively. The cleaning up of the raw data resulted in the removal of some stores (249) where plastic bags were not compulsory when the levy was initially introduced. Also, the sale of reusable bags was not consistent across all stores, necessitating the introduction of the stock of bags available in each store as an explanatory variable. The cleaned data covered the period from March 2018 to February 2020 (104 weeks) for 800 stores where the sale of plastic bags was mandatory.
4.2. Model specification
This study adapted the modeling approach by Taylor (2019). Taylor specifies a non-dynamic rather than dynamic model to study the impact of the plastic bag ban on sales of different sizes of plastic trash bags; a term refers to as plastic leakages. This study, however, gives preference for a dynamic specification, given the need to capture the reuse of plastic bags and reusable bags. The model is specified as follows:
where ln yit is the dependent variable which denotes either the logged sale of plastic bag or the logged sale of reusable bags, while ln yit−1 is the one-period lag of dependent variables which were included to capture the reuse of previous bag sales and the sales pattern dynamic. Dummy variables were employed to capture the three treatments/interventions as follows: T1 captures the intervention based on a random “giveaway” of reusable bags in April 2019; T2 captures the non-monetary plastic-free month campaign of July 2019, while T3 represents another monetary intervention in form of a massive roll-out of the subsidized R4 reusable bags in October 2019. Also included in the list of explanatory variables are the logged price of reusable bags (lnPricereusable), the logged price of plastic bags (lnPriceplastic), and the log of stock of bags which measure the availability of plastic or reusable bags in the store. Additionally, the model includes two store-specific characteristics: “Demo” which captures the income quantile of the store environment and customers, and “Region”, which captures the store province. Finally, the αi and μit represent stores' unobserved heterogeneous effects and the error term, respectively.
4.3. Method of data analysis
This research adopted various panel estimation techniques, due to suspected endogeneity problems associated with price and demand relationships, in order to acquire robust findings. Firstly, there is the usual possible simultaneity bias with price being endogenous in the demand model. However, in this context, the price of plastic bags is explained mainly by the arbitrarily imposed levy by the government of South Africa, which leads to the conclusion that the price of plastic bags is exogenous. This study applies panel fixed effect regression to account for differences in time-invariant omitted variables across stores.
Given the likelihood of not capturing all time-invariant variables, such as store size, the study considered the fixed effects technique which is capable of accounting for such variables. The treatment/intervention variable (T) is represented as follows: T1 = giveaway dummy, April 2019 (monetary); T2 = plastic-free month, July 2019 (non-monetary); and T3 = R4 reusable bags roll-out dummy, October 2019 (monetary). Moreover, given the lack of certainty regarding time-invariant omitted variables, the random effect technique was also considered, following which the Hausman test was used to choose the appropriate estimation procedure, consistent with the literature (Taylor, 2019; Da Silva and Hidalgo, 2020; Yu and Xin, 2020).
Finally, it was expected that the interventions would significantly and positively affect the uptake of reusable bags, followed by a negative and significant impact on the sale of plastic bags. One of the plausible reasons for excess consumption of plastic bags is that consumers sometimes forget to bring their bags to the retail shop. Capturing the percentage of consumers that were given bags or purchased bags during period “t-1” and also remembered to bring the bag during period “t” showed a change in plastic bag sales for the period “t”. Therefore, it is important to include a lag of the dependent variable in the model in order to capture the effect of the purchase of the previous week's reusable or plastic bags on the current week's demand, and thus capture the impact of reuse of the bags. Furthermore, a simple estimation of one- and two-period future impact of the intervention on sales of both plastic bags and reusable bags was done. This will measure the spill-over impact of the treatment to some weeks after the month of the intervention.
4.4. Appropriateness of fixed effect methodology in estimating price effect
The theory of demand and supply postulates that the higher the price, the lower the demand, and vice versa. However, studies provide an understanding of the problem of endogeneity inherent in the relationship between price and quantity demanded. Several studies adopted a variety of control function approaches to address the endogeneity problem. Among these were two-stage least squares estimates of water pricing (Musolesi and Nosvelli, 2007; Hillenbrand et al., 2009; Westling et al., 2020) and of electricity pricing (Burke and Abayasekara, 2018; Bordon Lesme et al., 2020). More recently, others adopted the general method of moments for water pricing (Kotagama et al., 2017; De Bonviller et al., 2020) and for electricity pricing (Chanthawong et al., 2016; Waleed and Mirza, 2020).
However, the plastic carrier bag levy is exogenously determined by government legislation. This is an arbitrarily imposed levy in the South African context and remains the same regardless of the quantity of the plastic bags bought. Consequently, no endogeneity exists between price and quantity for retail plastic bags. Accordingly, fixed-effect regression should be appropriate to estimate the pricing effects since there is no endogeneity problem in the case of plastic bags.
Additionally, there is a concerning issue of endogeneity in the case of reusable bags price. The endogeneity issue with environmental commodities pricing usually originates from one source: reverse causality. Reverse causality exists when a dependent variable can also explain an explanatory variable in the model. Under the increasing block tariff system, the assumption that price is exogenous was violated. The increasing block tariff is a pricing system that discourages excess consumption of environmental goods such as water or electricity. The rate per unit increases as the volume of consumption increases. Such tariff increases thus create an awareness among consumers of volume consumed. However, the unit price of the reusable bag remains constant regardless of the quantity demand. This abates the suspicion of reverse causality inherent in the pricing of an environmental goods. Also, an assumption that retailers or producers may be motivated to increase the price to increase profit when demand is high is not valid in this scenario. The uptake is low and reusable bags are still at the introduction stage in the market. Although, we cannot exclude the possibility of some endogeneity issues with certainty. The decision to still estimate the regression is because it provides interesting results for reusable bags (something that has been under-studied in Africa up to now). Therefore, the panel fixed effect estimator was used in estimating the price elasticity of demand for reusable bags (Schoengold et al., 2006; Miller and Alberini, 2016; Chelwa and van Walbeek, 2019).
The panel dynamic least square estimator (PLR), random effect (RANDOM) and fixed effect (FIXED) models were also explored. The Hausman test favored the fixed effect as the more appropriate model; therefore, the fixed effect results were interpreted. The inefficiency of the standard error was corrected with the standard robust variance estimation clustering for Store ID in Stata 15.
5. Results and discussion
The results presented here investigate the once-off impact of the three interventions (T1, T2, and T3) during 2019 by the retailer. Table 1 presents the result of the reusable bag model. Seven columns display the regression results. The first column of Table 1 lists the names of the variables starting with the natural log of bag stock, followed by the three treatments. The variables that follow are the prices of plastic bags and of reusable bags, again followed by the lag of the dependent variable to capture bag reuse. The results of the seven regressions relate to the (1) panel linear regression (PLR), (2) the random-effect (RE) regression, (3) the fixed-effect (FE) regression, (4) the reuse regression (which includes the lag value of the dependent variable to capture the reuse of reusable bags), (5) the one-period future impact regression, (5) the two-period future impact regression (to analyse the post-intervention impact on reusable bag sales), and (7) the fixed effect when the reusable bag price is dropped for comparisons of the result (FE R).
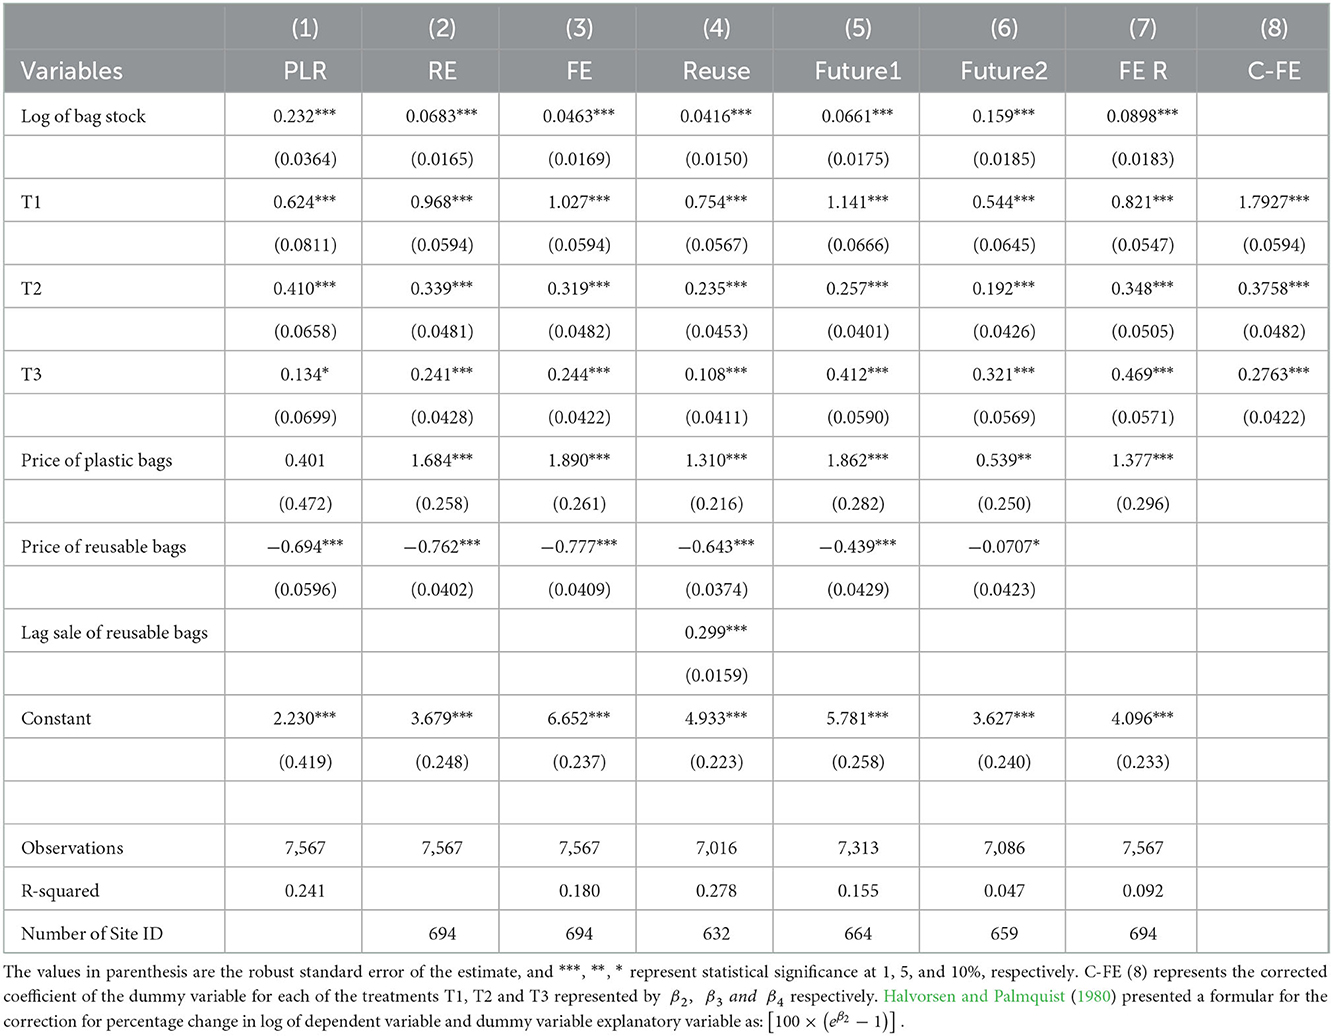
Table 1. Regression results for reusable bags model.
5.1. Impact of store monetary and non-monetary interventions in South Africa
The panel least square estimator (PLR), random effect model (RANDOM) and fixed effect model (FIXED) were used to measure the impact of the three treatments (T1, T2, and T3) in order to compare monetary and non-monetary interventions. The third column of Tables 1, 2 presents the fixed effect result, which measured the impact of interventions (T1, T2, and T3) on the sales of bags (reusable and plastic) across all the stores without restrictions. Columns 4 and 5 of Table 2 restrict the store sample to those that consistently sold more than 10 and 20 reusable bags, respectively. The interpretation follows the following outline: the first part describes the immediate impact of the three treatments on uptake/sales of reusable bags, followed by the immediate pass-through effects of the three treatments on sales of plastic bags. Finally, the estimated impact of the non-monetary intervention (T2) is compared to monetary interventions (T1 and T3).
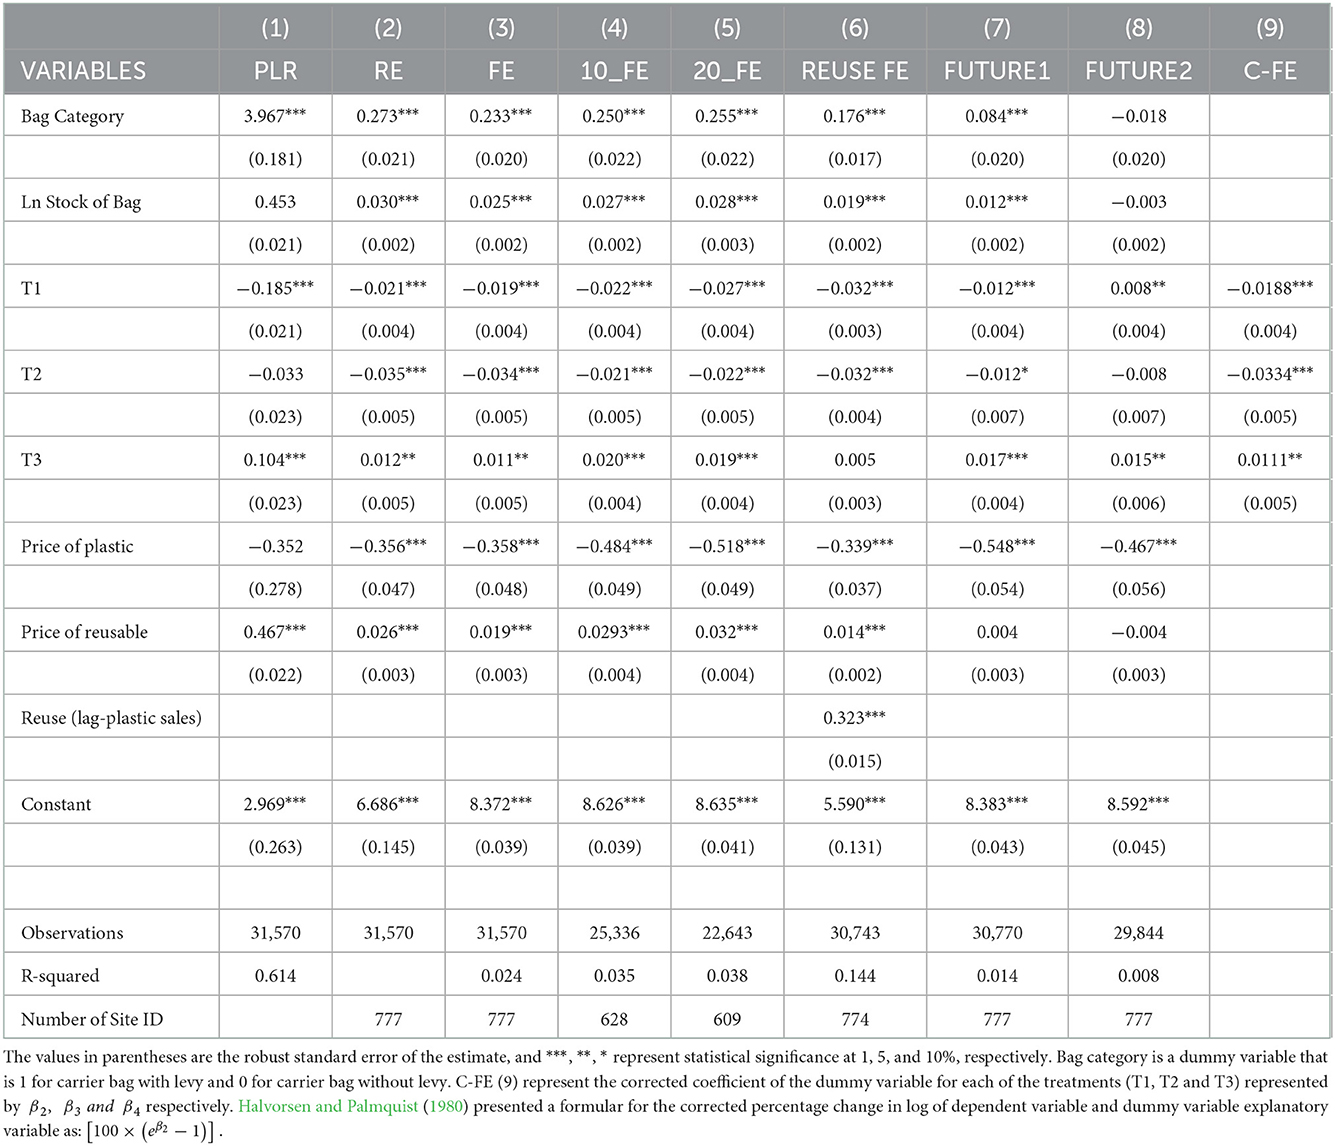
Table 2. Regression results for plastic bags model.
5.1.1. The giveaway (T1 monetary)
In this intervention, close to 300,000 core reusable bags were given away to customers in a lottery draw for every sale of more than R50 (see page 3 for details). As expected, the panel fixed effect results showed a positive and statistically significant effect on the uptake of reusable bags. The giveaway intervention (T1) resulted in a 179% increase in the uptake of reusable bags in April 2019 (see Table 1, column 8 which is correction of marginal effect for log-linear model for dummy variable using Halvorsen and Palmquist (1980) formular: ). The lag value of the dependent variable was introduced in the explanatory variable in order to capture the reuse effect on the dynamics of the sales pattern. The giveaway treatment (T1) impact on reusable bags uptakes reduces from 179 to 113% (see Table 1, column 4). Table 1, column 5 estimates the impact of the intervention on single period future sales, while Table 1, column 6 estimates the impact of the intervention on two-period future sales of reusable bags, showing 213 and 72% increase sales of reusable bags, respectively.
Regarding the impact of the giveaway intervention (Monetary-T1) on plastic bags sales. Table 2, column 3 [column 9 Halvorsen and Palmquist (1980)] reveals that the giveaway intervention (T1) had a significant and negative impact on the sale of plastic bags, as hypothesized. The intervention caused a 1.9% reduction in the sale of plastic bags. When the dependent variable's lag value was introduced in the explanatory variable to capture the reuse effect and dynamics in the sales pattern, the impact increased to 3.15% (see Table 2, column 6). Table 2, column 7 estimates the impact of the intervention on one-period future sales, while Table 2, column 8 estimates the impact of the intervention on two-period future sales, showing a 1.2% reduction and a 0.8% increase in the sale of plastic bags, respectively. Where the estimation was restricted to only stores that consistently sold more than 10 and 20 reusable bags, it projected a consistent decrease of 2.2 and 2.7%, respectively, in the sale of plastic bags.
5.1.2. The plastic-free month (T2 non-monetary)
The plastic-free month incentives were in the form of nudges and did not involve any monetary motivation. The retailer nudged consumers to not buy plastic bags and displayed reusable bags instead (see page 3). The panel fixed effect results, as expected, showed positive and statistically significant effects on the sale of reusable bags. In addition, the plastic-free intervention (T2) led to a 38% increase in the sale of reusable bags in July 2019 (see Table 1, column 3). Also, Table 1, columns 5 and 6 reveal the impact of the intervention on one- and two-period future sales. The result shows a 29% and 21% increase in the sale of reusable bags, respectively.
Table 2, column 3 reveals that the July plastic-free month intervention (T2 non-monetary) had a significant and negative impact on the sale of plastic bags, as hypothesized. The intervention caused a 3.34% reduction in the sale of plastic bags. When the dependent variable's lag value is introduced in the explanatory variable to capture the reuse effect and dynamics in the store sales pattern, the impact reduces to 3.19% (see Table 2, column 6).
Table 2, columns 7 and 8 estimate the impact of the intervention on one- and two-period future sales, resulting in a 1.2% and 0.8% reduction respectively in the sale of plastic bags. The very slight impact of non-monetary nudges (T2) corroborates the literature on the disappearance of the effect of nudges when the motivation is withdrawn. The nudge intervention was implemented only for 1 month and reduced the consumption of plastic bags, but the impact faded with time. The reasons for the fading impact were clear, since the retailer did not sustain the practice, maybe for fear of losing customers. Where the model estimation was restricted to only stores that consistently sold more than 10 and 20 reusable bags, results indicated a consistent decrease of 2.2 and 2.7%, respectively, in the sale of plastic bags.
5.1.3. The R4 roll-out (T3 monetary)
The roll-out intervention involved the massive sale of R5 bags with a subsidy of R1 for the first 1 million pieces sold. The fixed effect result shows a positive and statistically significant effect on the uptake of reusable bags, namely a 28% increase in the uptake of reusable bags in October 2019 (see Table 1). Table 1, columns 5 and 6 reveal the impact of this intervention on one- and two-period future sales, namely a 51% and 38% increase in the sale of reusable bags, respectively.
Table 2, column 4 reveals that the roll-out intervention (T3) significantly and positively impacted the sale of plastic bags, which was against expectation. This treatment had a pass-through effect of a 1.1% increase in the sale of plastic bags. Table 2, columns 7 and 8 estimated the impact of this intervention on one- and two-period future sales, showing a 1.7% increase and a 1.5% increase in the sale of plastic bags. Where the model was restricted to only stores which consistently sold more than 10 and 20 reusable bags, it estimated a consistent increase of 2 and 1.9% respectively, in the sale of plastic bags, contrary to the anticipated decrease. Thus, the result for treatment T3 is counterintuitive, but reasons for this positive effect on the sale of plastic bag are explained as follows:
Firstly, the result of the T1 monetary intervention, revealed that a 179% increase in the uptake of reusable bags could only achieve a 1.9% decrease in plastic bag consumption. Compare this to intervention T3, which achieved a 28% increase in the uptakes of reusable bags but resulted in a 1.1% increase in the sale of plastic bags. Unfortunately, there are no facts to prove that without the intervention there would have been a greater increase in the sale of plastic bags. Moreover, T3 were subsidy of R1 (from R5 to R4) per bag while T1 was a giveaway of a reusable bag worth R25 to the consumer.
The second plausible reason for the positive effect of T3 on plastic bag consumption could be that one unit of R4 could purchase 8 (at R0.50 each) plastic bags. Thus, the design of the bags to suit the middle- and lower-income groups may not have been as effective as anticipated. More importantly, the literature corroborates that subsidies to encourage pro-environmental behavior are less effective, especially in promoting the uptake of environmental goods (Poortinga and Whitaker, 2018). Finally, remembering to reuse bags has been a significant contributing factor to habitual plastic carrier bag consumption. Therefore, consumers may purchase reusable bags and still treat them as single-use products or forget to reuse, which would cause the subsidy treatment and massive roll-out treatment (T3 monetary) to be ineffective. Furthermore, October is usually summer in South Africa. Before the COVID 19 outbreak, people went out more and spent more, thus increasing plastic consumption toward the end of the year.
Among the plausible reasons for the counterintuitive result of massive roll-out and subsidy treatment (T3) is the high correlation between the price of the reusable bag and T3 since T3 represents a temporary reduction in the price of the reusable bag. A fixed-effect regression was estimated in the Appendix 3, to examine the impact of the subsidy treatment (T3) with reusable bag price and without reusable bag price. The result corroborates the ineffectiveness of subsidy treatment as the impact of T3 became very small and statistically insignificant without a reusable bag price variable in the model. This affirms the assumption that the correlation effect between reusable bag price and T3 produces counterintuitive positive results when the price of reusable bags is captured in the model.
5.2. Comparative analysis of monetary and non-monetary interventions
Treatment T1 reveals that giving away expensive reusable bags to consumers may not be a cost-effective way to reduce single-use plastic bag consumption, given the substitution ratio and immediate decrease in demand for plastic bags. The result of the giveaway treatment (T1 monetary) indicates that the supply of a single free reusable bag led to a reduction of two plastic bags. Thus, the overall substitution of 300,000 reusable bags for a reduction of 600,000 plastic bags out of an average monthly sale of 30 million for April 2019, led to only a 2% reduction in the sale of plastic bags. This reduction shows that one giveaway reusable bag (R25) substituted for two plastic bags, costing barely R1.20.
This intervention gave way to a cheaper alternative, namely a massive roll-out of R4 reusable bags, subsidized with R1 (T3 monetary). Unfortunately, the intervention could not achieve its objective. It led to a 28% increase in the uptake of reusable bags and a counterintuitive 1.1% increase in the sale of plastic bags. Conversely, the plastic-free month (T2 non-monetary) intervention had a potentially active impact on the sale of plastic bags, relative to the other two interventions. Without monetary incentives, the sale of reusable bags increased by 38%, while the sale of plastic bags decreased by more than 3%, leading to an estimated reduction in sales of 900,000 units in July 2019. Results of the regression models reveal that non-monetary nudges (T2), such as customers campaigns, messages and changes in default settings, were more effective than a reusable bags giveaway (T1) and the subsidization of reusable bags (T3). However, the retailer reported that although the plastic-free month was designed for all stores, some stores failed to comply 100% with the implementation of the treatment/intervention. A Wald test analysis was conducted to test if there is a statistical difference between T2 non-monetary and T1 monetary intervention. The result revealed that the difference is statistically significant, and the impact on reduction in plastic bag sales is statistically different from zero. This implies that the once-off impact of T2 (Non-monetary intervention) on sales of plastic bags significantly differs from the once-off impact of T1 (Giveaway Monetary intervention).
5.3. Discussion of findings
The impact of the giveaway intervention (T1 monetary) was statistically significant in increasing the uptake of reusable bags. This in turn led to a reduction in plastic bag consumption. This corroborates the findings of Santos and van der Linden (2016) in their study in which students were given reusable water bottles on their matriculation day, which reduced their consumption of single-use bottles. The roll-out treatment (T3 monetary) revealed a marginal increase in the uptake of reusable bags associated with a marginal increase in plastic bag consumption. The result complements Poortinga and Whitaker's (2018) work and affirms the suggestion by Dikgang et al. (2012a) for additional measures to make South African consumers aware of the plastic bag crisis, as subsidy may not be effective. The non-monetary nudge treatment (T2 non-monetary), on the other hand, which includes campaigns, messages, and changes in default settings, revealed an increase in the sale of reusable bags and a decrease in plastic bag consumption.
This study found that non-monetary intervention is more efficient in reducing plastic bag consumption (pollution) than monetary intervention. This study revealed that there is possibility of consumers single-using reusable bags, which can be more environmentally disastrous. This confirms the lack of awareness of the problem of plastic bag pollution among South African consumers (Dikgang et al., 2012a).
6. Summary, conclusion and policy recommendations
The study investigated the impact of monetary (T1 and T3) and non-monetary (T2) interventions by stores on the uptake of reusable bags and the reduction of the consumption of plastic bags. This aspect used longitudinal retail store data, which included 800 stores for 104 weeks across South Africa.
The panel fixed effect method was considered appropriate, given the explanation favoring the exogenous claim of plastic bags and reusable bag price (see section Appropriateness of fixed effect methodology in estimating price effect). Three interventions were investigated, namely the giveaway (T1), the plastic-free month (T2) and lastly, the roll-out and subsidies (T3). The first and last treatments were regarded as monetary interventions, while the second intervention was non-monetary, since the treatment included three nudges to discourage the consumption of plastic bags, namely campaign messages for consumers, store-level campaigns and changes to the default questions by cashiers. The monetary interventions (T1 and T3) included a random giveaway of 300,000 reusable bags to customers in April 2019 and the roll-out of the cheapest R5 reusable bags subsidized with R1 during the month of October 2019.
It was found that each of the three interventions (T1, T2, and T3) had a statistically significant impact on the increase in the sale of reusable bags but only two (T1 and T2) successfully decrease the purchase of single-use plastic bags. The plastic-free month non-monetary nudge treatment had a greater impact on the reduction of plastic bag sales than the other two pecuniary treatments. The ineffectiveness of the roll-out as a subsidy intervention (T3) and the giveaway treatment (T1) affirms the conclusion that consumer awareness of the environmental impact of single-use plastic bags is shallow in South Africa. In order to check for robustness, the analysis was restricted to stores that sold more than 10 and 20 reusable bags consistently. The results revealed greater reduction in plastic bags sales than the model estimate for stores without restrictions. The inclusion of an explanatory variable, bag stock, which captures the availability of any type of bags (reusable or plastic bag) at the store and reveal possibilities of retail stores running out of bags. Whereas the availability of reusable bags will give pro-environmental consumers consistent access to an alternative to plastic carrier bags.
The plastic-free month intervention could potentially have a greater impact if more monitoring and general compliance among the cashiers and across all stores is enforced. Indeed, public campaigns, changes in the default setting, and inter-store challenges have proved to be effective nudges compared to subsidies or giveaway treatments, these nudges were the most cost-efficient way to reduce the consumption of single-use plastic bags and marine debris in South Africa. The model's dynamics suggest that consumption of plastic bags has become habitual in South Africa, and thus requires more rigorous behavioral intervention in order to nudge consumers to be more environmentally conscious.
In particular, it is recommended that the impact of constantly reminding consumers to reuse plastic bags should be investigated in an experimental study. This is necessary because this study reveals a low level of reuse of both plastic bags and giveaway (T1 and T3) reusable bags. The cultivation and sustainment of consumer consciousness regarding bag reuse is important, since remembering to bring reusable bags remains a critical problem as far as the literature is concerned. Finally, consumer behavior and its drivers with regard to recycling should be investigated to ascertain the end-use of plastic bags and other single-use plastic materials in South Africa.
The plausible limitation of the study is possibly over-dependency on store level data. This makes it difficult to measure the impact at the aggregate level, as the demand for plastic bags is numbered in tens of millions, while that of the reusable bag is numbered in tens of thousands. This implies that capturing a pass-through impact of reusable uptake to the reduction of plastic bag consumption without the reuse of reusable bags may be very difficult. It is akin to a drop of water in an ocean. More importantly, this research was not a randomized control trial (RCT) experiment. It captured a real field experiment, in which the retail outlet and its several departments performed self-administered interventions. The effectiveness of the intervention depended solely on the organization's internal discipline, which could be assumed to be comparable to what is expected from any well-organized company. Finally, one of the covariates in the regression model (Ln Stock of Bag) was proxy by Ln of bag supply to the stores. The supply of plastic bags and reusable bags was not frequently, which also created missing data and made the panel data unbalanced. However, the variable is very important in the model, making its inclusion pertinent to capture a robust result. Also, the initial concerned about reusable bag price endogeneity issues can be further addressed in the future research when the consumers level data is available.
Data availability statement
The data analyzed in this study is subject to the following licenses/restrictions: confidential retail outlet sales data. Data is not publicly available.
Author contributions
BA wrote the literature, introduction, and data analysis. MV designed the project and sourced the data while RD reviewed all the sections of the manuscript, supervised the analysis, and worked on methodology.
Funding
This paper is part of EfD's Sustainable Management of Coastal Marine Resources (CMaR) Project, focusing on marine plastic pollution through EPRU.
Conflict of interest
The authors declare that the research was conducted in the absence of any commercial or financial relationships that could be construed as a potential conflict of interest.
Publisher's note
All claims expressed in this article are solely those of the authors and do not necessarily represent those of their affiliated organizations, or those of the publisher, the editors and the reviewers. Any product that may be evaluated in this article, or claim that may be made by its manufacturer, is not guaranteed or endorsed by the publisher.
Supplementary material
The Supplementary Material for this article can be found online at: https://www.frontiersin.org/articles/10.3389/frsus.2022.968886/full#supplementary-material
References
Adane, L., and Muleta, D. (2011). Survey on the usage of plastic bags, their disposal and adverse impacts on environment: a case study in Jimma City, Southwestern Ethiopia. J. Toxicol. Environ. Health Sci. 3, 234–248. Available online at: https://academicjournals.org/journal/JTEHS/article-full-text-pdf/28E66F43389
Barnett, A. J., Wiber, M. G., Rooney, M. P., and Maillet, D. G. C. (2016). The role of public participation GIS (PPGIS) and fishermen's perceptions of risk in marine debris mitigation in the Bay of Fundy, Canada. Ocean Coast. Manag. 133, 85–94. doi: 10.1016/j.ocecoaman.2016.09.002
Bordon Lesme, M., Padilla, E., and Freire-González, J. (2020). The direct rebound effect of electricity energy services in Spanish households: evidence from error correction model and system GMM estimates. (Working paper). Bellaterra, Spain: Universitat Autònoma de Barcelona. Departament d'Economia Aplicada. Available online at: https://ddd.uab.cat/record/232627 (accessed October 23, 2021).
Burke, P. J., and Abayasekara, A. (2018). The price elasticity of electricity demand in the United States: a three-dimensional analysis. Energy J. 39, 123. doi: 10.5547/01956574.39.2.pbur
Caboz, J. (2019). We tested the new R5 bags from Checkers, Pick n Pay and Woolworths - and found that there's really no excuse to use plastic anymore. Business Insider. Available online at: https://www.businessinsider.co.za/we-compared-the-new-durable-r5-bags-from-checkers-pick-n-pay-and-woolworths-and-theres-no-excuse-to-use-plastic-anymore-2019-4 (accessed December 21, 2021).
Castleman, B. L., and Meyer, K. E. (2020). Can text message nudges improve academic outcomes in college? Evidence from a west virginia initiative. Rev. Higher Educ. 43, 1125–1165. doi: 10.1353/rhe.2020.0015
Chanthawong, A., Dhakal, S., and Jongwanich, J. (2016). Supply and demand of biofuels in the fuel market of Thailand: two stage least square and three least square approaches. Energy. 114, 431–443. doi: 10.1016/j.energy.2016.08.006
Chelwa, G., and van Walbeek, C. (2019). Does cigarette demand respond to price increases in Uganda? Price elasticity estimates using the Uganda National Panel Survey and Deaton's method. BMJ Open. 9, e026150. doi: 10.1136/bmjopen-2018-026150
Cheung, G., Davies, P. J., and Trück, S. (2019). Transforming urban energy systems: the role of local governments' regional energy master plan. J. Clean. Prod. 220, 655–667. doi: 10.1016/j.jclepro.2019.01.179
Chib, A., Chiew, H. J., Kumar, C., Choon, L. G., and Ale, K. (2009). [minus] plastic: influencing pro-environmental attitudes among Singaporean youth. Environm. Edu. Res. 15, 679–696. doi: 10.1080/13504620903296001
Clapp, J., and Swanston, L. (2009). Doing away with plastic shopping bags: international patterns of norm emergence and policy implementation. Env. Polit. 18, 315–332. doi: 10.1080/09644010902823717
Da Silva, A. D. B., and Hidalgo, Á. B. (2020). Price elasticity in import demand equations considering product quality: Estimates for the Brazilian economy (1996-2013). Econom. 21, 340–364. doi: 10.1016/j.econ.2020.02.002
Danner, U. N., Aarts, H., and De Vries, N. K. (2008). Habit vs. intention in the prediction of future behavior: the role of frequency, context stability and mental accessibility of past behavior. Br. J. Soc. 47, 245–265. doi: 10.1348/014466607X230876
De Bonviller, S., Wheeler, S. A., and Zuo, A. (2020). The dynamics of groundwater markets: price leadership and groundwater demand elasticity in the Murrumbidgee, Australia. Agric. Water Manag. 239, 106204. doi: 10.1016/j.agwat.2020.106204
De Vos, C., Obokoh, L. O., and Abiola, B. A. (2020). Determinants of savings among non-Ricardian households in South Africa. Int. J. Soc. Econ. 47(11):1329–1343. doi: 10.1108/IJSE-11-2019-0692
Dikgang, J., Leiman, A., and Visser, M. (2012a). Elasticity of demand, price and time: lessons from South Africa's plastic-bag levy. Appl. Econ. 44, 3339–3342. doi: 10.1080/00036846.2011.572859
Dikgang, J., Leiman, A., and Visser, M. (2012b). Analysis of the plastic-bag levy in South Africa. Resour. Conserv. Recycl. 66, 59–65. doi: 10.1016/j.resconrec.2012.06.009
Dong, B., Ma, X., Zhang, Z., Zhang, H., Chen, R., Song, Y., et al. (2020). Carbon emissions, the industrial structure and economic growth: evidence from heterogeneous industries in China. Environm. Pollut. 262, 114322. doi: 10.1016/j.envpol.2020.114322
Egebark, J., and Ekström, M. (2016). Can indifference make the world greener? J. Environ. Econ. Manage. 76, 1–13. doi: 10.1016/j.jeem.2015.11.004
Elf, P., Isham, A., and Gatersleben, B. (2021). Above and beyond? How businesses can drive sustainable development by promoting lasting pro-environmental behavior change: An examination of the IKEA Live Lagom project. Bus. Strategy Environ. 30, 1037–1050. doi: 10.1002/bse.2668
Ferraro, P. J., and Miranda, J. J. (2013). Heterogeneous treatment effects and mechanisms in information-based environmental policies: evidence from a large-scale field experiment. Resour Energy Econ. 35, 356–379. doi: 10.1016/j.reseneeco.2013.04.001
Freedman, M. R., and Brochado, C. (2010). Reducing portion size reduces food intake and plate waste. Obesity. 18, 1864–1866. doi: 10.1038/oby.2009.480
Goldberg, M. E., and Gunasti, K. (2007). Creating an environment in which youths are encouraged to eat a healthier diet. J. Public Policy Mark. 26, 162–181. doi: 10.1509/jppm.26.2.162
Halvorsen, R., and Palmquist, R. (1980). The interpretation of dummy variables in semilogarithmic equations. Am. Econ. Rev. 70, 474–475.
He, H. (2012). Effects of environmental policy on consumption: lessons from the Chinese plastic bag regulation. Environ. Dev. Econ. 17, 407–431. doi: 10.1017/S1355770X1200006X
Heidbreder, L. M., Bablok, I., Drews, S., and Menzel, C. (2019). Tackling the plastic problem: a review on perceptions, behaviors, and interventions. Sci. Total Environ. 668:1077–1093. doi: 10.1016/j.scitotenv.2019.02.437
Hillenbrand, J., Motz, T., Sessler, G. M., Zhang, X., Behrendt, N., Von Salis-Soglio, C., et al. (2009). The effect of additives on charge decay in electron-beam charged polypropylene films. J. Phys. D Appl. Phys. 42, 065410. doi: 10.1088/0022-3727/42/6/065410
Holland, B., Abrahamse, N., van den Brekel, E., van der Voort Maarschalk, J., Keunen, O., and Janssen, P. (2019). Feasibility study of flushing To Lich River with Red River water through West Lake. Available online at: http://resolver.tudelft.nl/uuid:b3b6341a-d9d3-4ebc-af11-b035ae2f66e4.
Hopewell, J., Dvorak, R., and Kosior, E. (2009). Plastics recycling: challenges and opportunities. Philos. Trans. R. Soc. 364, 2115–2126. doi: 10.1098/rstb.2008.0311
Jambeck, J. R., Geyer, R., Wilcox, C., Siegler, T. R., Perryman, M., Andrady, A., et al. (2015). Plastic waste inputs from land into the ocean. Science. 347, 768–771. doi: 10.1126/science.1260352
Kallbekken, S., and Sælen, H. (2013). ‘Nudging' hotel guests to reduce food waste as a win–win environmental measure. Econ. Lett. 119, 325–327. doi: 10.1016/j.econlet.2013.03.019
Kotagama, H., Zekri, S., Al Harthi, R., and Boughanmi, H. (2017). Demand function estimate for residential water in Oman. Int. J. Water Res. Dev. 33, 907–916. doi: 10.1080/07900627.2016.1238342
Latinopoulos, D., Mentis, C., and Bithas, K. (2018). The impact of a public information campaign on preferences for marine environmental protection. The case of plastic waste. Mar. Pollut. Bull. 131, 151–162. doi: 10.1016/j.marpolbul.2018.04.002
Lehner, M., Mont, O., and Heiskanen, E. (2016). Nudging—a promising tool for sustainable consumption behavior? J. Clean. Prod. 134, 166–177. doi: 10.1016/j.jclepro.2015.11.086
Lin, Y., Osman, M., and Ashcroft, R. (2017). Nudge: concept, effectiveness, and ethics. Basic Appl. Soc. Psych. 39, 293–306. doi: 10.1080/01973533.2017.1356304
Lucas, K., Brooks, M., Darnton, A., and Jones, J. E. (2008). Promoting pro-environmental behavior: existing evidence and policy implications. Environ Sci Policy. 11, 456–466. doi: 10.1016/j.envsci.2008.03.001
Martínez-Espiñeira, R., García-Valiñas, M. A., and Nauges, C. (2014). Households' pro-environmental habits and investments in water and energy consumption: determinants and relationships. J. Environ. Manage. 133, 174–183. doi: 10.1016/j.jenvman.2013.12.002
Martinho, G., Balaia, N., and Pires, A. (2017). The Portuguese plastic carrier bag tax: the effects on consumers' behavior. Waste Manag. 61, 3–12. doi: 10.1016/j.wasman.2017.01.023
Mellish, S., Pearson, E. L., Sanders, B., and Litchfield, C. A. (2016). Marine wildlife entanglement and the Seal the Loop initiative: a comparison of two free-choice learning approaches on visitor knowledge, attitudes and conservation behavior. Int. Zoo Yearbook. 50, 129–154. doi: 10.1111/izy.12132
Miller, M., and Alberini, A. (2016). Sensitivity of price elasticity of demand to aggregation, unobserved heterogeneity, price trends, and price endogeneity: evidence from US Data. Energy Policy 97, 235–249. doi: 10.1016/j.enpol.2016.07.031
Musolesi, A., and Nosvelli, M. (2007). Dynamics of residential water consumption in a panel of Italian municipalities. Appl. Econ. Lett. 14, 441–444. doi: 10.1080/13504850500425642
Neal, D. T., Wood, W., Wu, M., and Kurlander, D. (2011). The pull of the past: when do habits persist despite conflict with motives? Pers. Soc. Psychol. Bull. 37, 1428–1437. doi: 10.1177/0146167211419863
O'Hara, R. E., and Sparrow, B. (2019). A summer nudge campaign to motivate community college STEM students to reenroll. AERA Open. 5, 2332858419875715. doi: 10.1177/2332858419875715
Ohtomo, S., and Ohnuma, S. (2014). Psychological interventional approach for reduce resource consumption: reducing plastic bag usage at supermarkets. Resour. Conserv. Recycl. 84, 57–65. doi: 10.1016/j.resconrec.2013.12.014
Otsyina, H. R., Nguhiu-Mwangi, J., Mogoa, E. G. M., Mbuthia, P. G., and Ogara, W. O. (2018). Knowledge, attitude, and practices on usage, disposal, and effect of plastic bags on sheep and goats. Trop. Anim. Health Prod. 50, 997–1003. doi: 10.1007/s11250-018-1523-9
Poortinga, W., and Whitaker, L. (2018). Promoting the use of reusable coffee cups through environmental messaging, the provision of alternatives and financial incentives. Sustainability. 10, 873. doi: 10.3390/su10030873
Rivers, N., Shenstone-Harris, S., and Young, N. (2017). Using nudges to reduce waste? The case of Toronto's plastic bag levy. J. Environ. Manage. 188, 153–162. doi: 10.1016/j.jenvman.2016.12.009
Santos, J. M., and van der Linden, S. (2016). Environmental reviews and case studies: changing norms by changing behavior: the Princeton Drink Local Program. Environm. Practice. 18, 116–122. doi: 10.1017/S1466046616000144
Schoengold, K., Sunding, D. L., and Moreno, G. (2006). Price elasticity reconsidered: Panel stimation of an agricultural water demand function. Water Resour. Res. 42, 9. doi: 10.1029/2005WR004096
Silva, A., Rosano, M., Stocker, L., and Gorissen, L. (2017). From waste to sustainable materials management: three case studies of the transition journey. Waste Manag. 61:547–557. doi: 10.1016/j.wasman.2016.11.038
Spranz, R., Schlüter, A., and Vollan, B. (2018). Morals, money or the master: the adoption of eco-friendly reusable bags. Marine Policy. 96, 270–277. doi: 10.1016/j.marpol.2018.01.029
Steinhorst, J., and Matthies, E. (2016). Monetary or environmental appeals for saving electricity? Potentials for spillover on low carbon policy acceptability. Energy Policy. 93, 335–344. doi: 10.1016/j.enpol.2016.03.020
Taylor, R. L. (2019). Bag leakage: The effect of disposable carryout bag regulations on unregulated bags. J. Environ. Econ. Manage. 93, 254–271. doi: 10.1016/j.jeem.2019.01.001
Thaler, R. H., and Sunstein, C. S. (2008). Nudge: Improving Decisions About Health, Wealth, and Happiness. New Haven, CT: Yale University Press.
Uehara, T., and Ynacay-Nye, A. (2018). How water bottle refill stations contribute to campus sustainability: a case study in Japan. Sustainability. 10, 3074. doi: 10.3390/su10093074
UNEP (2016). Marine Plastic Debris and Microplastics: Global Lessons and Research to Inspire Action and Guide Policy Change. Nairobi: United Nations Environment Programme.
Van Bavel, R., Rodríguez-Priego, N., Vila, J., and Briggs, P. (2019). Using protection motivation theory in the design of nudges to improve online security behavior. Int. J. Hum. Comput. Stud. 123, 29–39. doi: 10.1016/j.ijhcs.2018.11.003
Veiga, J. M., Vlachogianni, T., Pahl, S., Thompson, R. C., Kopke, K., Doyle, T. K., et al. (2016). Enhancing public awareness and promoting co-responsibility for marine litter in Europe: the challenge of MARLISCO. Mar. Pollut. Bull. 102, 309–315. doi: 10.1016/j.marpolbul.2016.01.031
Vu, C. T., and Wu, T. (2022). Recent progress in adsorptive removal of per- and poly-fluoroalkyl substances (PFAS) from water/wastewater. Crit. Rev. Environ. Sci. Technol. 52, 90–129. doi: 10.1080/10643389.2020.1816125
Waleed, K., and Mirza, F. M. (2020). Examining behavioral patterns in household fuel consumption using two-stage-budgeting framework for energy and environmental policies: evidence based on micro data from Pakistan. Energy Policy. 147, 111835. doi: 10.1016/j.enpol.2020.111835
Westling, N., Stromberg, P. M., and Swain, R. B. (2020). Can upstream ecosystems ensure safe drinking water—insights from Sweden. Ecol. Econ. 169, 106552. doi: 10.1016/j.ecolecon.2019.106552
Xanthos, D., and Walker, T. R. (2017). International policies to reduce plastic marine pollution from single-use plastics (plastic bags and microbeads): a review. Mar. Pollut. Bull. 118, 17–26. doi: 10.1016/j.marpolbul.2017.02.048
Yu, H., and Xin, X. (2020). Demand elasticity, ramsey index and cross-subsidy scale estimation for electricity price in China. Sustain. Product. Consump. 24, 39–47. doi: 10.1016/j.spc.2020.06.008
Zen, I. S., Ahamad, R., and Omar, W. (2013). No plastic bag campaign day in Malaysia and the policy implication. Environ. Dev. Sustain. 15, 1259–1269. doi: 10.1007/s10668-013-9437-1
Keywords: plastic bag, monetary intervention, consumption crises, retail outlet data, South Africa, nudges
Citation: Abiola BA, Visser M and Daniels RC (2023) Addressing plastic bags consumption crises through store monetary and non-monetary interventions in South Africa. Front. Sustain. 3:968886. doi: 10.3389/frsus.2022.968886
Received: 14 June 2022; Accepted: 13 December 2022;
Published: 17 February 2023.
Edited by:
Mateo Cordier, Université de Versailles Saint-Quentin-en-Yvelines, FranceReviewed by:
Umair Tanveer, University of Bristol, United KingdomEkundayo Mesagan, Pan Atlantic University, Nigeria
Copyright © 2023 Abiola, Visser and Daniels. This is an open-access article distributed under the terms of the Creative Commons Attribution License (CC BY). The use, distribution or reproduction in other forums is permitted, provided the original author(s) and the copyright owner(s) are credited and that the original publication in this journal is cited, in accordance with accepted academic practice. No use, distribution or reproduction is permitted which does not comply with these terms.
*Correspondence: Reza Che Daniels,  cmV6YS5kYW5pZWxzQHVjdC5hYy56YQ==