- 1Faculty of Arts and Science, Kyushu University, Fukuoka, Japan
- 2Urban Institute & Department of Civil Engineering, Kyushu University, Fukuoka, Japan
This paper proposes a framework for weighting priority for the multidimensional domains of slum development from the viewpoint of residents. The weights estimated by our framework can be interpreted as marginal utility, and multiplying satisfaction scores in each domain of development by these weights yields residents' utility from slum development. The proposed approach is carried out by accessing residents' needs for slum development in Mumbai, India, where more than 5.2 million residents live in slum areas. Using the dataset obtained from a questionnaire survey that we conducted with slum residents in March 2019, we estimate marginal utilities for 23 domains of slum development. The results show that (1) slum residents most wish to improve development projects about human capital (health and education), electricity, and drinking water, even if they have already been highly satisfied, (2) they feel the least satisfaction with public toilets and place high priority on projects involving public toilets, (3) the sewage system has low priority with low satisfaction, but this priority increases as slum residents become better off, (4) the projects on social development and protection are highly satisfied and generally ranked low in terms of marginal utilities, and (5) air pollution and working conditions are also concerns of slum residents, especially as these residents become better off. It is expected that the framework used in this paper can be used to extract the problems of urban development and to track the progress of development plans from the viewpoint of residents.
Introduction
The improvement of slum conditions toward urban sustainable development is a global challenge. The number of slum dwellers is increasing in most developing countries, and in 2018, more than one billion people were living in slum areas (UN-Habitat, 2020), characterized by a lack of the minimum quality of life. Sustainable Development Goal (SDG) 11 seeks to ensure access for all to adequate, safe and affordable housing and basic services and to upgrade slum areas by 2030 (United Nations, 2015). To achieve this goal, appropriate indicators are required to trace the development progress. Objective measures, such as per capita net domestic product, literacy rate, and infant mortality rate, are commonly used as indicators. However, the importance of subjective evaluations that are directly associated with people's wellbeing has also received attention (e.g., Stiglitz et al., 2018). Incorporating subjective measures into the development indicator and reflecting these findings in the policy goals are thus urgently needed.
This paper aims to propose resident-oriented satisfaction measures of slum development. The important aspect of such an indicator is the multidimensionality of the domains of which it is comprised. For example, access to improved water sources, access to improved sanitation facilities, and security tenure all must be evaluated, and each evaluated indicator should be used to grasp the progress of each domain of slum development. However, to understand how much the improvement of one domain of slum development improves slum residents' overall satisfaction and to prioritize each domain, it is also necessary to understand the relative importance of each domain. We provide a theoretical framework through which to estimate weights to aggregate residents' satisfaction with the individual domain of slum development and apply it to the 2019 survey carried out with slum residents in Mumbai, India, where the total number of slum dwellers is 5,206,473, which is approximately 41.84% of the total population of Mumbai (Census, 2011).
One previous study on weights in multidimensional indices is that of Decancq and Lugo (2013), which used an extensive survey to broadly classify weighting approaches into three categories: data-based weighting, normative weighting, and a hybrid of the two. The first category is a data-based weighting approach such as principal component analysis (Noorbakhsh, 1998; Klasen, 2000), factor analysis and structural equation modeling (Krishnakumar and Nadar, 2008). The second category, normative weighting, is premised on a specific kind of value judgment and is based on expert opinions (Chowdhury and Squire, 2006; Mascherini and Hoskins, 2008) or on arbitrary external weight values (Diener and Suh, 1997; Lugo, 2007; Nilsson, 2010). This type of weighting also includes simple averages, such as the Human Development Index, which are most often used in practice. Data-based weighting has the problem of there being a possible mismatch between actual achievement and residents' value judgments, while normative weighting has the problem that it depends on who makes the value judgments. The third method presented to solve these problems is a hybrid of the two, which uses data including value judgment for weighting (hereafter referred to as “hybrid type”). This method can be broadly divided into two types. One is the hedonic type (Welsch, 2006; Schokkaert, 2007; Ferreira and Moro, 2010; Levinson, 2012), which regresses self-reported indicators of wellbeing such as happiness and life satisfaction on variables that capture its various domains and weights them through coefficients. The other is a stated preference method that directly asks residents about their priorities and importance for different domains (De Kruijk and Rutten, 2007; Bossert et al., 2013). We do not adopt the hedonic method because, as pointed out by Decancq and Lugo (2013), it would yield unstable weights due to the multicollinearity problem, as the number of domains that constitute wellbeing increases. In this study, we propose a hybrid-type weighting method with the stated preference method.
One problem faced by the previous research that has used the stated preference method (e.g., De Kruijk and Rutten, 2007; Bossert et al., 2013) is that the derivation of weights has been ad hoc and that the theoretical significance of the numbers themselves has not been established for a long time. Benjamin et al. (2014) conducted a pioneering study that provided a theoretical foundation for the weighting of these stated preferences. Based on the utility theory of microeconomics, the above authors regarded utility as a set of fundamental aspects of wellbeing and constructed a theoretical framework that connects the indicators whose value can be assessed through research with the welfare level. The present study is the first attempt at applying the theoretical framework presented by Benjamin et al. (2014) to weight the multidimensional domains of slum development.
The rest of the paper is organized as follows. Section Weighting approach for the multidimensional indicator discusses the weighting approach, Section Data collection describes the data, and Section Results provides the results. Finally, Section Conclusions concludes the paper.
Weighting approach for the multidimensional indicator
Theoretical background
This subsection provides the theoretical background concerning weighting on the multidimensional domains of slum development from the viewpoint of residents. Analogous to Benjamin et al. (2014), in which fundamental aspects of wellbeing were considered components of utility, this paper considers an agent's utility function obtained from multidimensional domains of slum development, U(w), where w = (w1, w2, ⋯ , wJ) represents the agent's satisfaction with J individual domains of slum development. Considering an arbitrary vector, (assumed to be satisfaction at the status quo), and the deviation from it, a Taylor expansion around results in the following first-order approximation:
Note that since utility level U(w) in Equation (1) is a first-order approximation of the Taylor expansion, the resulting approximation value becomes less accurate if evaluation vector w deviates largely from . Since and are constants, , that is, the weighted average of the agent's satisfaction with J individual domains of slum development (w) using weights as the marginal utility at the status quo, can be seen as the agent's index that tracks small changes in utility from slum development. Thus, once marginal utilities at a base period are derived from the survey, we can track residents' changes in utility from slum development if the survey that collects the data on individual satisfaction (w) is regularly conducted. Thus, this paper focuses mainly on the derivation of marginal utilities. The following subsection discusses the procedures through which to estimate marginal utility from the survey.
Estimate of marginal utility
To estimate marginal utility, the following random utility is assumed for each domain of slum development j (j = 1, ⋯ , J):
Here, subscript “i” represents an individual, subscript “j” represents a domain of slum development, and Uij represents the utility that individual i obtains from domain j. xj is a dummy variable that takes the value of 1 when the standards of slum development in domain j improve and 0 otherwise, νi represents the utility from slum development in domain j at the status quo, and ϵij represents the error terms. The coefficient βj can be interpreted as marginal utility, which represents a change in utility when the level of utility obtained from slum development in domain j improves. To estimate the coefficient βj, we take any two domains, s and t, out from the J domains of slum development and define as
where xj (j = 1, ⋯ , J) takes the value of 1 if j is equal to s, −1 if j is equal to t, and 0 otherwise. Then, individual i prefers to improve domain s if and prefers to improve domain t if . As explained in detail in the following section, in our questionnaire survey, we present two randomly chosen projects from the list of all domains and ask respondents to respond with which project they prefer in terms of improving their welfare from the status quo. The response choices are on a 4-point Likert-type scale: (1) definitely prefer project s, (2) slightly prefer project s, (3) slightly prefer project t, and (4) definitely prefer project t. Using Equation (4), this selection problem can be formulated as
where is the latent variable, yi corresponds to the 4-point Likert-type response choice, and ϵi is ϵis−ϵit. Thus, the coefficient βj can be estimated by ordered probit estimation with the common assumption that ϵij follows the Gumbel distribution.
Data collection
This study relies on a face-to-face questionnaire survey conducted in Mumbai, India, in March 2019 through a third-party company (INTAGE INDIA). The stratified sampling method was adopted to collect the data. First, we obtained the list of all slums from the Slum Rehabilitation Authority, Mumbai, which included information on the location and size of each slum. Regarding the definition of a slum, the list follows that used in the Census of India (Census of India, 2001):
“For the purpose of Census of India (2001); the slum areas broadly constitute: (i) All specified areas in a town or city notified as ‘slum’ by State/Local Government and Union Territories (UT) Administration under any Act including a ‘Slum Act’; (ii) All areas recognized as ‘Slum’ by State/Local Government and UT Administration, Housing and Slum Boards, which may have not been formally notified as slum under any act; and (iii) A compact area of at least 300 population or about 60e70 households of poorly built congested tenements, in unhygienic environment usually with inadequate infrastructure and lacking in proper sanitary and drinking water facilities.”
Slum size was classified into three categories: a slum was classified as large if its area was larger than 10,000 m2, as medium-sized if its area was between 2,500 m2 and 9,999 m2, and as small if its area was smaller than 2500 m2. Then, the slum was stratified by tehsil (a local unit of administrative division in Mumbai, which consists of 18 tehsils), slum size was proportional to the number of slums in the list, and a total of 102 slums were selected. From each slum, 10 samples for small slums, 30 samples for medium-sized slums, and 50 samples for large slums were randomly selected. To control quality of interviewers, brief session on survey procedures are hold before the survey, and qualification test interviews are conducted to check their understanding. A tablet-based digital questionnaire is used in this study, and unrealistic answers and inconsistent responses are detected by the program and marked accordingly with a short alert message. The wording used in the questionnaire was carefully tested in the pre-survey so that all the slum residents could easily understand. A total of 3,111 respondents participated in this survey. The survey language was either Hindi, Marathi, or English. Among those 3,111 respondents, 2,323 respondents (74.67%) used Hindi, 786 (25.27%) used Marathi, and 2 (0.06%) used English. In addition to respondents' demographic information, the data about respondent preferences for development projects were collected as described below.
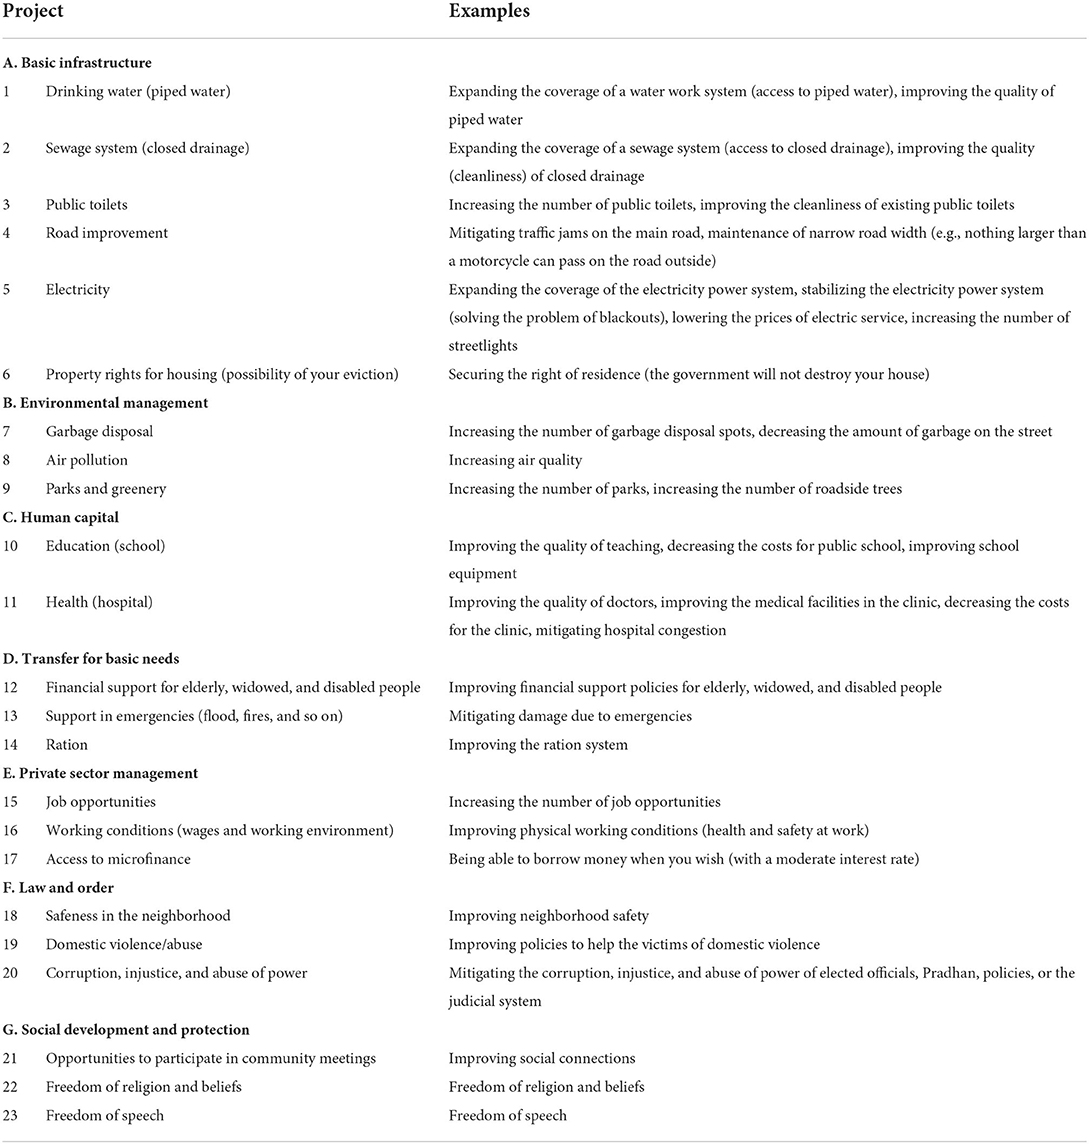
To estimate marginal utilities , we first identified 23 development projects that are relevant to slum residents in Mumbai to compile the list of the domains of slum development. 1One problem faced by the ordered probit estimation for Equations (4)–(8) was that only the differences from one base marginal utility could be identified due to the rank condition. To identify marginal utilities for all 23 domains of the slum project, a hypothetical project that plays no role was added to the list as a base domain (that is, J = 24), and its marginal utility was assumed to be zero for normalization. In the main survey, respondents were asked to compare two different development projects. First, two projects were randomly chosen from the list of 24 projects and presented to respondents with a brief example of the projects. Table 1 shows the list of development projects with brief examples described by the enumerators in the survey. Then, respondents were asked to respond as to which projects they preferred in terms of improving their welfare from the status quo. Response choices were on a 4-point Likert-type scale: (1) definitely prefer the first project, (2) slightly prefer the first project, (3) slightly prefer the second project, and (4) definitely prefer the second project. Questions were repeated 20 times for each respondent.
As a variable for individual satisfaction (w), for all 23 development projects, respondents were asked to rate how satisfied they were with them. Response choices were on a 5-point Likert-type scale: (1) completely dissatisfied, (2) somewhat dissatisfied, (3) neither satisfied nor dissatisfied, (4) somewhat satisfied, and (5) completely satisfied.
Results
Satisfaction with development projects
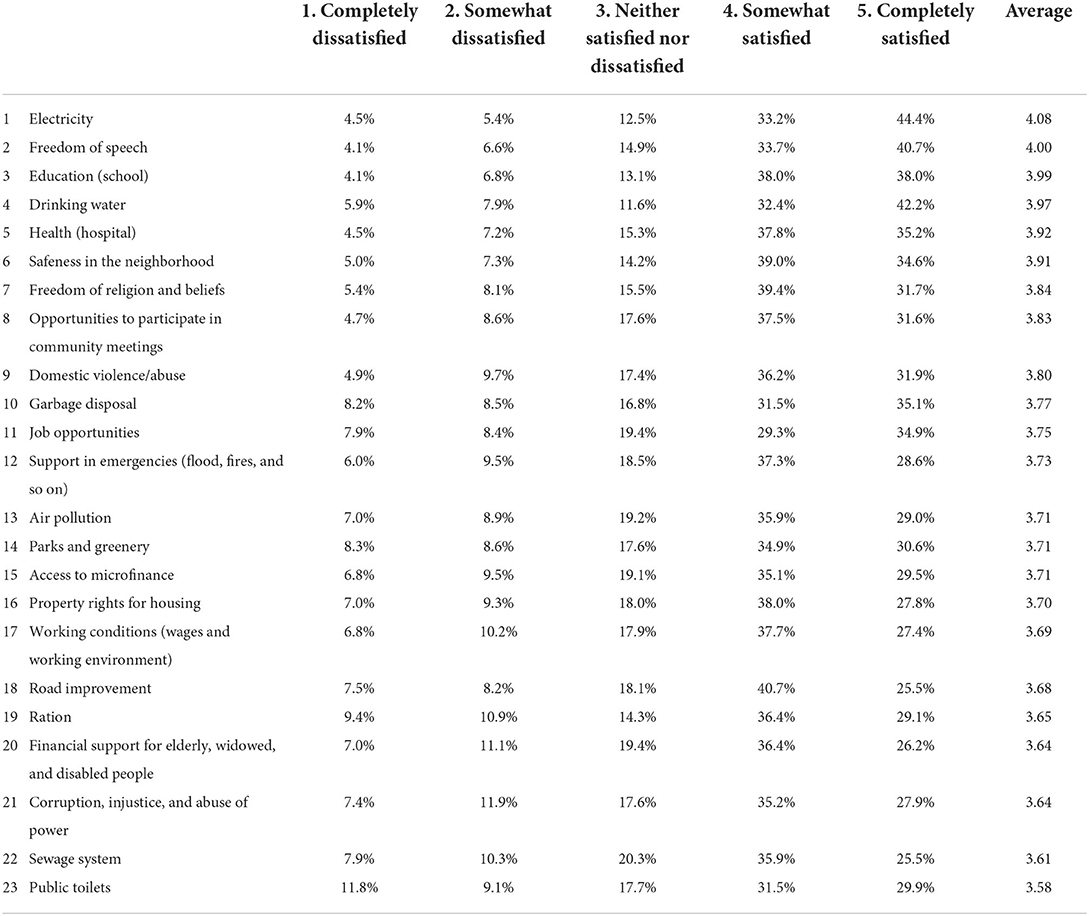
Table 2 shows the distribution of responses regarding satisfaction and its average score on each development. The projects were sorted by their average scores in descending order. The highest average score for satisfaction was for electricity (4.08), followed by freedom of speech (4.00) and education (3.99). Overall, the basic infrastructure of electricity and drinking water, infrastructure of human capital (school and hospital), and social development and protection (freedom of speech, freedom of religion and beliefs, and participation in community meetings) were rated as being highly satisfying, while the basic infrastructure of the sewage system and public toilets were the least satisfying for respondents.
Asset ownership
To see the differences in the living conditions among slum residents, we measured asset index and created asset quantiles. An asset index was calculated using principal component analysis to assign indicator weights. For this analysis, household possessions [radio, black and white TV, color TV, refrigerator, washing machine, bicycle, motorcycle, car, landline phone, mobile phone, ceiling fan, liquefied petroleum gas (LPG) stove, laptop, air conditioner, mattress, pressure cooker, chair, cot or bed, sewing machine, or clock], house ownership, house structure, room material, wall material, access to electricity, access to drinking water, latrine facility, and drainage system were all considered. The average value of the constructed asset index was zero with a standard deviation of one. The poorest quantile of the asset index ranged from −2.428 to −0.819, the second- poorest quantile ranged from −0.818 to −0.368, the third-poorest quantile ranged from −0.368 to 0.216, the fourth-poorest quantile ranged from 0.218 to 0.848, and the fifth-poorest, that is, richest, quantile ranged from 0.851 to 2.450.
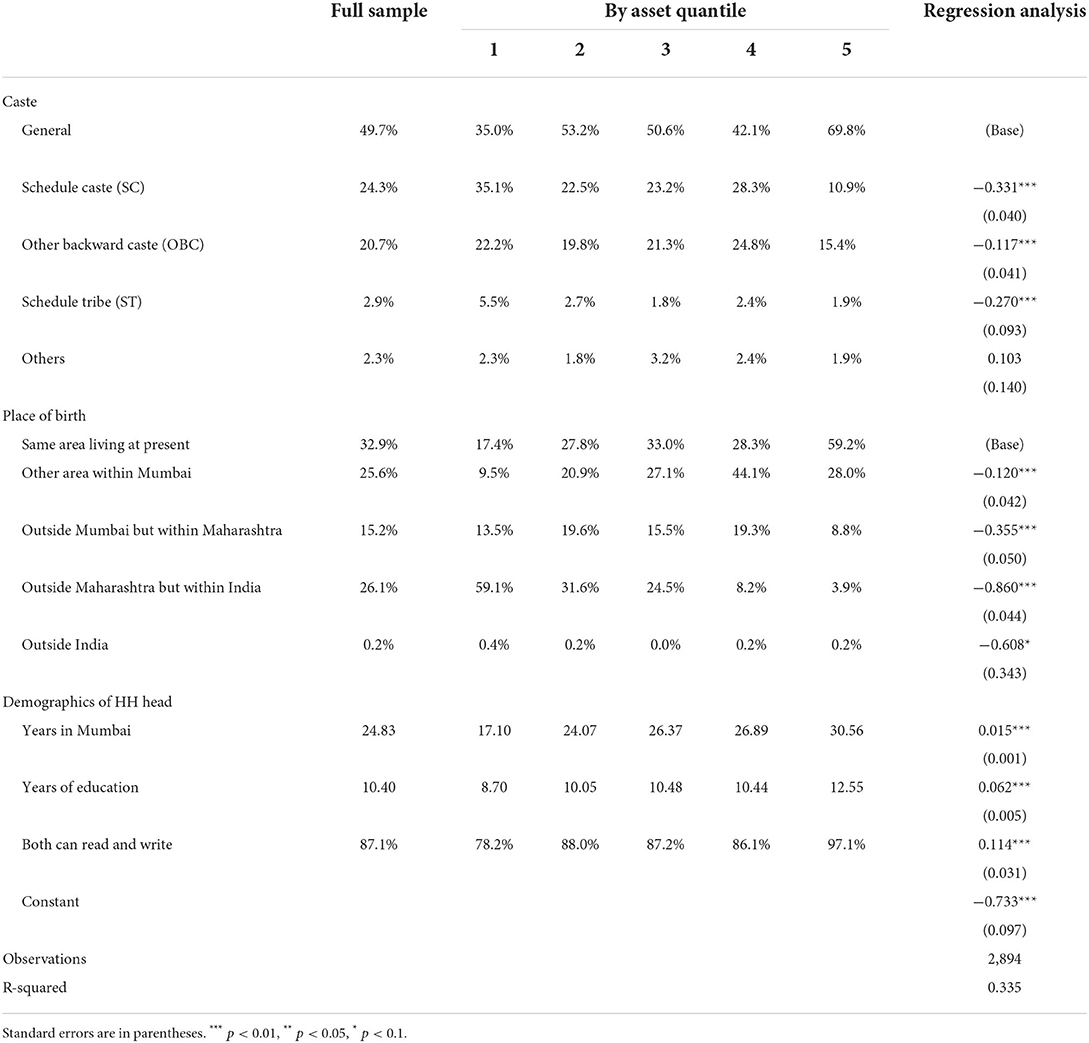
Table 3 represents the relation between slum residents' demographics and asset index. The first column reports the descriptive statistics of the full sample, and the second to sixth columns report those by asset quantile. While all the demographics are present throughout the within-slum asset distribution, those individuals whose history of residence in Mumbai was shorter, especially those from outside Mumbai, those whose education level was lower, and those who belonged to schedule caste (SC), other backward caste (OBC), or schedule tribe (ST) were disproportionately represented among the poorer asset quantiles. In particular, this tendency was strong for the poorest quantile of slum residents. To see how the asset index relates to these slum dwellers' demographics, we conducted ordinary least squares (OLS) regression analysis in which the dependent variable was the asset index, and the regressors were demographic variables. The results showed that all these variables significantly affect the asset index.
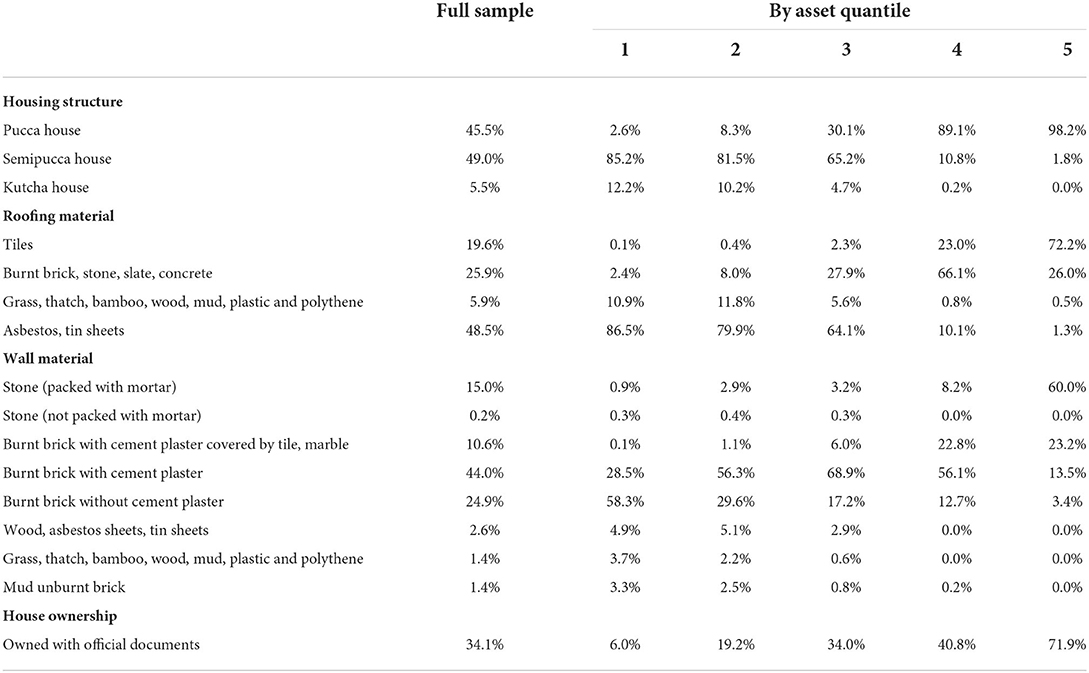
In India, there are three general housing classes: pucca houses, kutcha houses, and semipucca houses. A pucca house refers to a house that is designated to be solid and permanent, a kutcha house refers to a house that is designated to be temporary and less solid, and a semipucca house is a combination of the two. Usually, these classifications are based on house materials. Table 4 reports the information of the condition of respondents' houses. Most of the richest quantile of respondents lives in pucca houses with tile roofing and with walls made of stone backed with mortar or by burnt bricks with cement plaster covered by tile or marble. The second-richest quantile of respondents also lives in pucca houses, but with the roof made of burnt brick, stone, slate or concrete and with walls made of burnt brick. Moreover, most of the first- to third-poorest-quantile respondents live in houses with roofing covered by asbestos or tin sheets and with walls made of burnt brick without marble. The walls of the houses of more than half of the respondents in the poorest quantile are made of burnt brick that is not covered by cement plaster. Regarding housing ownership status, less than 10% of respondents in the poorest quantile own their own house, that is, have official documents verifying their ownership status, while more than 70% of respondents in the richest quantile own their own house.
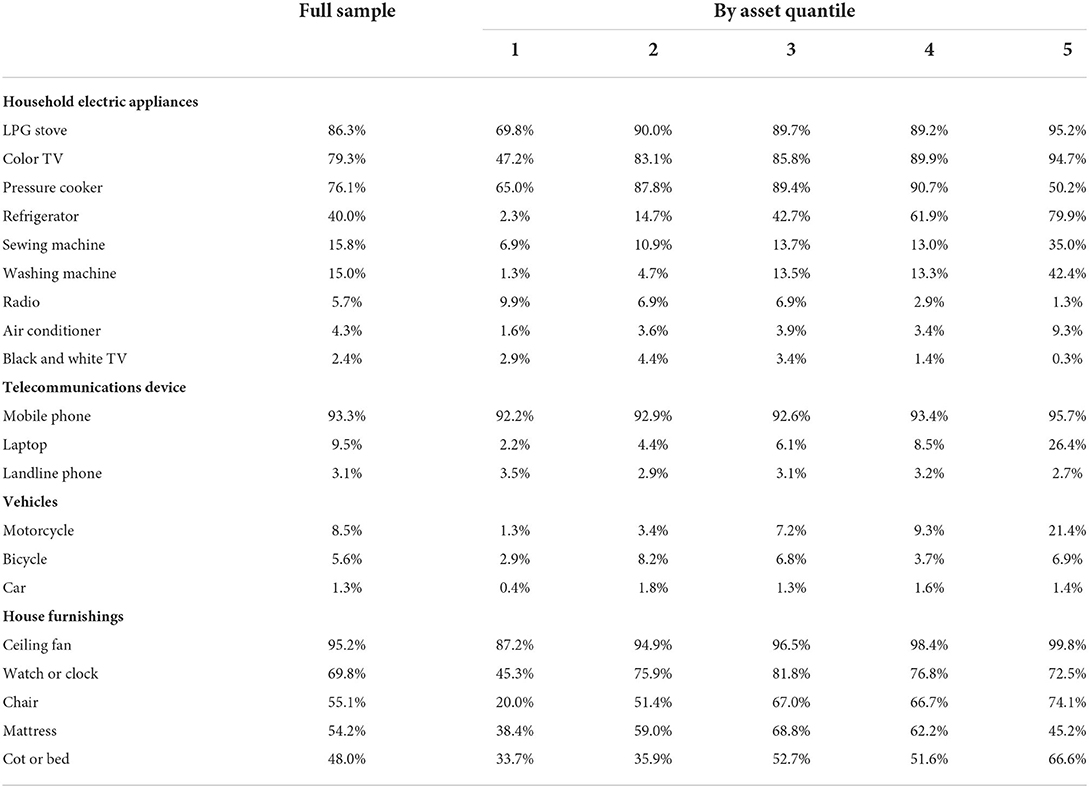
Table 5 reports the percentage of respondents that possess each household asset. For household electric appliances, although, on average, more than 75% of all the respondents own LPG stoves, color TVs, and pressure cookers, less than 70% of respondents in the poorest quantile own them. Such disparities in asset possession rates are even worse for refrigerators, sewing machines, and washing machines. For all quantiles, only a few households possess radios and air conditioners, as well as black and white TVs. Regarding telecommunications devices, most respondents own mobile phones. Less than 10% of respondents in the first- to -fourth-poorest quantile own laptops or motorcycles, while 26.4 and 21.4% of those in the richest quantile possess them, respectively. Regarding house furnishings, approximately 50% of respondents on average do not own a mattress, cot or bed, which implies that they sleep directly on the floor. The situation is worse for the poorest quantile of respondents.
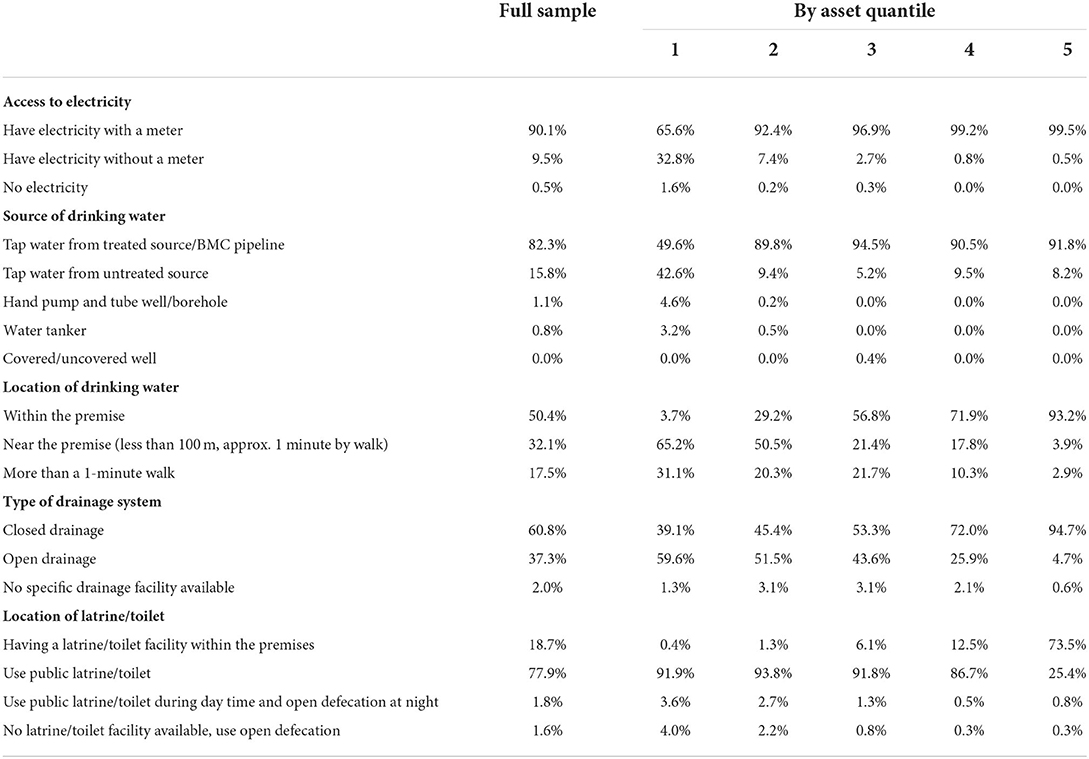
Table 6 reports slum residents' access to basic infrastructure. On average, more than 90% of respondents have access to electricity with a meter. However, if we look at the poorest quantile of respondents, only 65.5% have access to electricity with a meter. This unequal situation is also true for sources of drinking water. On average, 82.3% of respondents have access to tap water from treated sources, while only 49.6% of those in the poorest quantile have such access. In this poorest quantile, 42.6% of them drink tap water from untreated source, and 4.6% from hand pump and tube well. Looking at the location of drinking water, only 3.7% of respondents in this quantile have access to drinking water within their premise. In terms of access to a drainage system, we observe uneven access across asset quantiles. The percentage of those who have access to closed drainage, which consists of covered channels and prevents human exposure to harmful waste flows, is only 39.1% among those in the poorest quantile, but this rate increases, up to 94.7%, as the quantile of the asset index increases for those in the richest quantile. Regarding access to toilets, except for those in the richest quantile, most respondents rely on public toilets.
Estimates of marginal utility
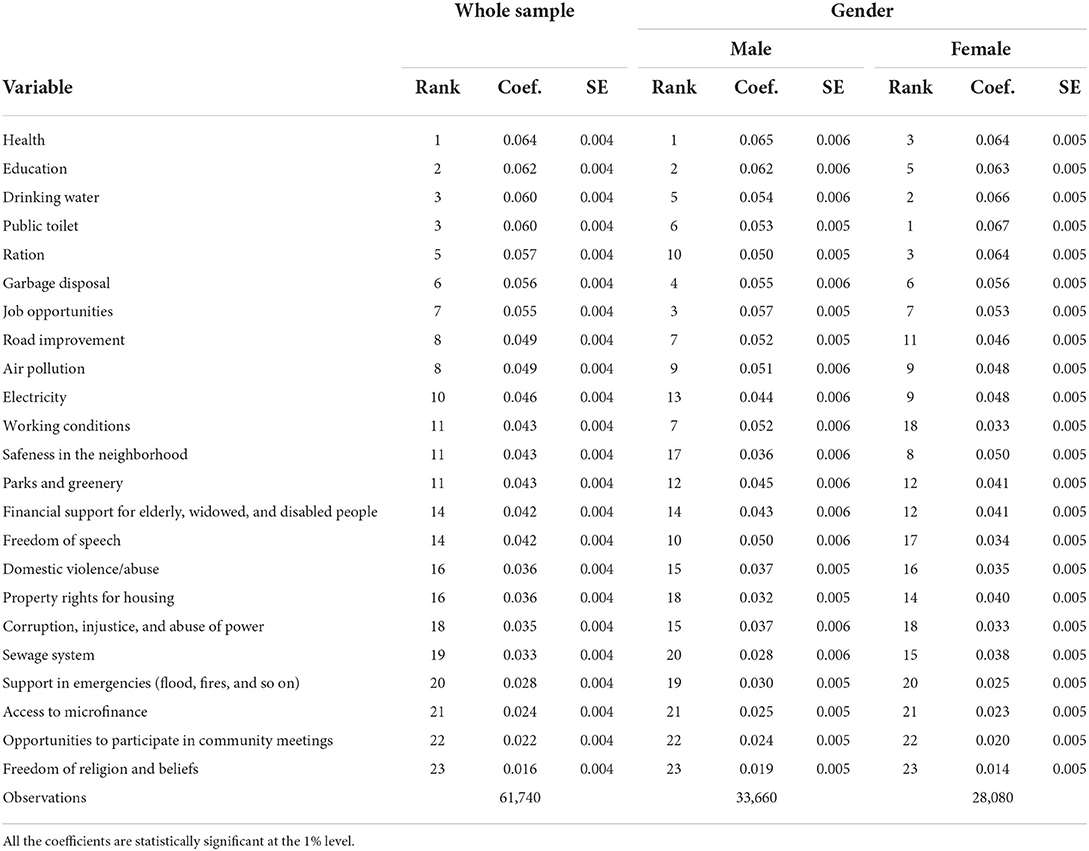
Based on the current situation of slum residents discussed above, we address the needs for slum development by estimating marginal utility, the estimated results of which are reported in Table 7. The first column of Table 7 illustrates the marginal utilities of all the samples, and the projects in the table are ranked by these marginal utilities. The coefficients can be negative if respondents give a lukewarm answer, because they are the differences between marginal utility of each development project and that of hypothetical project that plays no role. However, the results show that all the coefficients are positive.
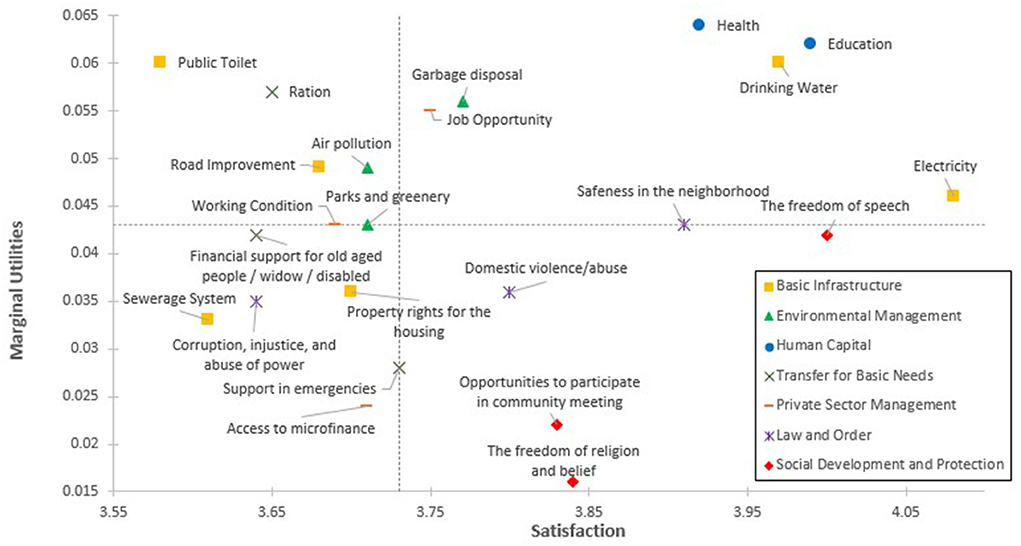
The estimated marginal utilities of each projects and its corresponding average satisfaction score reported in the last column of Table 2 are summarized in Figure 1. X-axis represents the average score of satisfaction, y-axis represents the marginal utilities, the horizontal dotted line represents the median value of marginal utilities, and the vertical dotted line represents the median value of average satisfaction score. First, the projects on drinking water as well as health and education are shown on the upper right part of Figure 1. Among the projects on basic infrastructure, clean drinking water is essential for people's life and health condition. These results imply that the projects that directly relate to human capital are most wished to be improved even if they have already been highly satisfied. Note that, according to Yesudhas (2021), the percentage of respondents of the survey of slum area in Mumbai that can use water less than 4 h per days reached up to 72 and 45% among those who use public taps and private taps, respectively. As a result, only 25% of their respondents have access to 20 or more liters of water per person per day, which is a minimum amount of requirement for water. Regarding the access to water, not only the expanding the coverage of a water work system, available time for water use should also be an important issue. Second, the projects on basic infrastructure are generally highly ranked in terms of marginal utilities. Among them, the project on public toilet is one of the projects that should be paid attention, because it is ranked as the third-highest marginal utilities, but with the worst satisfaction scores among all types of projects, shown in the upper left part of Figure 1. Overcrowded public toilets due to their limited number and the poor toilet conditions mainly caused by lack of public participation in their management are reported in the slum area of Mumbai (e.g., Biswas et al., 2020; Yesudhas, 2021). Since 77.9% of respondents rely on public toilets (Table 6), improving the public toilet should be an acute problem of slums in Mumbai. Another project that should be noted is that involving the sewage system. Among all the basic infrastructure projects, it ranks lowest in terms of marginal utilities. According to Subbaraman et al. (2013), although all bacterial contamination of drinking water occurred due to post-source contamination during storage in the household, point-of-source water contamination occurs in the monsoon season. In the slum area of Mumbai, only a few toilets are connected to a main sewer line and this situation could cause a contamination of groundwater (Biswas et al., 2020). Thus, the improvement of sanitation, as well as public education on household water treatment, would reduce water born disease caused by the contamination. In this sense, the importance of sewerage system might be under-evaluated by slum residents. Third, the projects on environmental management are also highly ranked in terms of marginal utilities with garbage disposal ranking 6th and air pollution ranking 8th, which are as high as the project on Job opportunities (7th rank) on road improvement (8th rank). Slum residents are found to care about environmental issues as greatly as some of the important projects which directly relate to their economic condition. Lastly, the projects on social development and protection are generally ranked low in terms of marginal utilities with opportunities to participate in community meetings ranking 22th, and freedom of religion and beliefs ranking the worst. These two projects are shown in the lower right part of Figure 1, indicating that slum residents are already satisfied with these projects.
To see whether these rankings are heterogeneous among respondents, we estimated marginal utilities separately for male respondents and for female respondents, with the second and third columns of Table 7 reporting these results, respectively. Although the rankings are generally similar for most domain, there are some variations among them. First, although the projects on health, education, drinking water, and public toilet, are highly ranked for both male and female respondents, female respondents put relatively higher weights on drinking water and public toilet. Moreover, a project on sewage system ranks higher among female respondents than male. These projects are closely related with a hygiene situation, implying that the projects about hygiene could be more appealing to female than male. Second, as for the project that directly influence their household budget, male respondents care more about job opportunities and working condition, and female respondents care more about ration, reflecting that men are the main wage earners. Lastly, other than these points, male respondents place more importance on freedom of speech and that female respondents place more importance on safeness in the neighborhood.
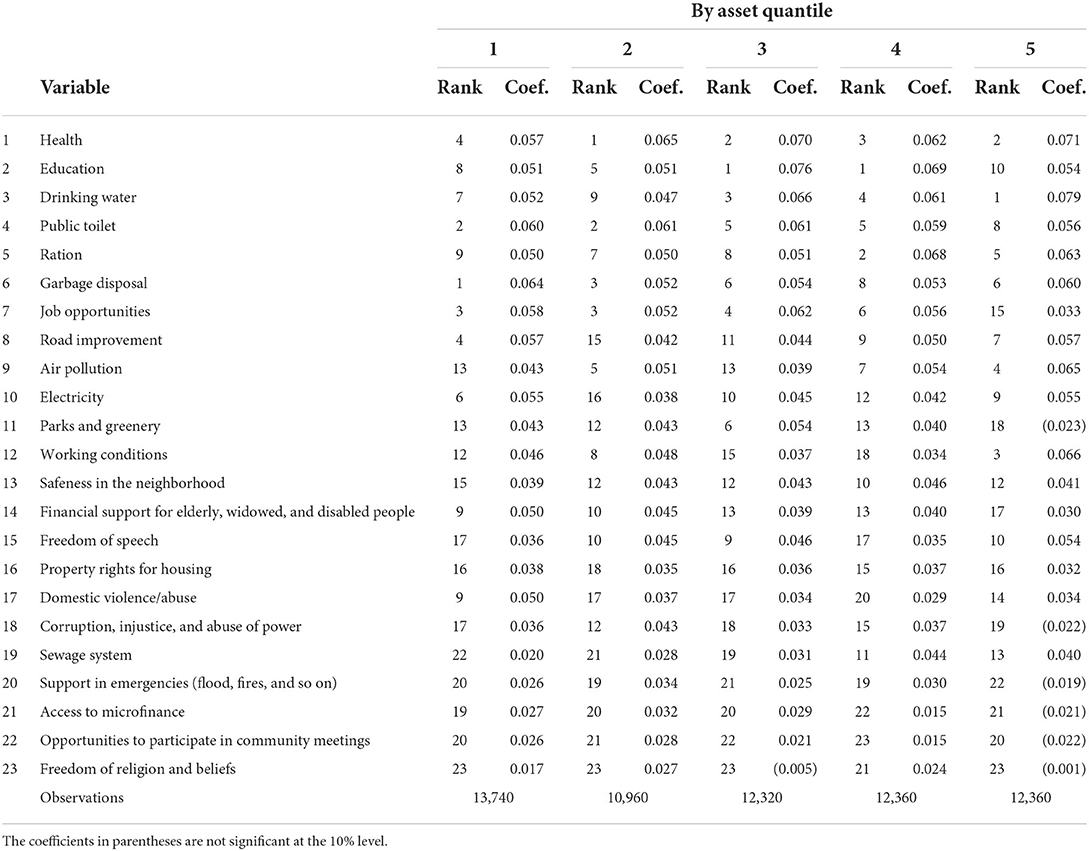
To see whether these rankings differ depending on slum residents' living conditions, we estimated marginal utilities by asset quantile, the results of which are reported in Table 8. Overall, the ranking results show a similar tendency across asset quantiles, but there are differences in some domains of development. For those projects on human capital, both health and education are the top-ranking problems for all asset quantiles, but the ranking of education is slightly lower among those in the poorest quantile (8th) and in the richest quantile (10th), despite the lowest average years of school and literacy rate of those in the poorest quantile and despite the highest average years of school and literacy rate of those in the richest quantile (Table 3). One possible explanation for this is that the importance of education may not be well recognized for the poorest residents and that the richest residents can send their children to private school instead of public school. Regarding basic infrastructure, as the asset quantile increases, the ranking of drinking water increases, while that of public toilets decreases. Another remarkable result is that although the ranking of the sewage system is low (19th) for the whole sample, the ranking climbs up from 22nd to 13th as the asset quantile increases. For environmental management projects, garbage disposal ranks 1st among those respondents in the poorest quantile. Conversely, the improvement of air pollution is ranked high among those respondents in the richer asset quantile. For private sector management, the improvement of job opportunities is anticipated to be ranked high among those in poorer quantiles, but the ranking is low (15th) among those in the richest quantile, as they wish to improve their working conditions (3rd). Overall, expectations for the role of quality of life increase as the asset quantile increases, although the needs for development projects are similar across asset quantile.
Conclusions
This paper proposes a framework for weighting priority on multidimensional domains of slum development from the viewpoint of residents by extending the approach presented by Benjamin et al. (2014). We then demonstrate this approach by accessing residents' needs for slum development in Mumbai, India. We identify 23 domains of slum development that are relevant to the slum dwellers in Mumbai and estimate residents' marginal utilities obtained from the improvement of each domain of slum development. We show that (1) slum residents most wish to improve development projects about human capital (health and education), electricity, and drinking water, even if they have already been highly satisfied, (2) they feel the least satisfaction with public toilets and place high priority on projects involving public toilets, (3) the sewage system has low priority with low satisfaction, but this priority increases as slum residents become better off, (4) the projects on social development and protection are highly satisfied and generally ranked low in terms of marginal utilities, and (5) air pollution and working conditions are also concerns of slum residents, especially as these residents become better off. Based on these results on priorities across different area of development projects, administration and NGO's need to put forward individual projects in each area. Especially, projects to reduce the disease burden caused by poor sanitation and unsafe drinking water are found to be urgent issues. Longer and stable water supply, distribution of chlorine tablets to residents to disinfect drinking water, providing information on the importance of washing hands after using toilets, and people's participation in the management of public toilets, for example, are all to move into action immediately.
Using marginal utilities derived from this approach as weights, the weighted average of satisfaction scores in each domain of development can be interpreted as residents' utility from slum development. Once the marginal utilities are estimated, this composite index of weighted averages can be used to trace the progress of overall development plans. Our results suggest two implications in the measurement of development progress. First, in many cases, simple averages are used as a composite index of development (e.g., Decancq and Lugo, 2013). However, we find some discrepancy of the evaluation between marginal utilities and satisfaction scores. This implies that only the satisfaction scores are insufficient for the understanding of overall subjective wellbeing of residents' welfare. The information on marginal utilities of each domain, as well as satisfaction scores, should be collected. Second, this paper suggests to conduct regular surveys that ask about satisfaction with each domain of slum developments in order to trace the progress of overall development plans. In addition to this regular survey, this paper recommends to conduct a periodic reassessment of marginal utilities, because our results suggest that, although the needs for development projects are similar across asset quantile to some extent, expectations for the role of quality of life increase as the asset quantile increases.
Of course, like other approaches, this approach has several weaknesses that should be noted. First, as discussed in Section Weighting approach for the multidimensional indicator, the composite index represents a first-order approximation of utility derived from the Taylor expansion and thus becomes less accurate if residents' perceived satisfaction from slum development deviates largely from the status quo. Therefore, the use of this index should be limited to when evaluating small changes in slum development. Second, although the proposed approach has a strong advantage in evaluating the relative importance across different domains of slum development, it does not provide any information on each individual domain. Thus, once the domain to be prioritized is identified, a deeper assessment of each individual domain should be conducted.
Nevertheless, we believe that these weaknesses are outweighed by the merit of the resident-oriented nature of this approach. As Naess (2001) argues, planning for a sustainable development should make use of both expert and layman knowledge. Experimental knowledge of local residents about local environmental quality could compensate for expert knowledge, and on the other hand, residents' value priorities on development projects might be required to change for sustainable development. However, in many cases, slum residents are not legally notified by the government, and even if they are notified, their needs hardly ever reach the government. Different from other data-driven approaches or from normative approaches that judge priorities by the analyst or other third parties, such as community leaders or politicians, this approach directly asks slum residents about their preferences in the domains of slum development. In this sense, this approach gives them a voice with which to disclose their actual needs for slum development, and is expected to promote dialogue between urban planners and slum residents.
Data availability statement
The raw data supporting the conclusions of this article will be made available by the authors, without undue reservation.
Ethics statement
Ethical review and approval was not required for the study on human participants in accordance with the local legislation and institutional requirements. Written informed consent for participation was not required for this study in accordance with the national legislation and the institutional requirements.
Author contributions
AK designed and executed the survey and wrote the manuscript. SM contributed to the concept and helped to write the manuscript. Both authors read and approved the final manuscript.
Funding
This research was funded by the Grant-in-Aid for Scientific Research 26000001, 19K15919, and 20H00648 from the Ministry of Education, Culture, Sports, Science and Technology (MEXT), Japan.
Conflict of interest
The authors declare that the research was conducted in the absence of any commercial or financial relationships that could be construed as a potential conflict of interest.
Publisher's note
All claims expressed in this article are solely those of the authors and do not necessarily represent those of their affiliated organizations, or those of the publisher, the editors and the reviewers. Any product that may be evaluated in this article, or claim that may be made by its manufacturer, is not guaranteed or endorsed by the publisher.
Author disclaimer
The results and conclusions of this article do not necessarily represent the views of the funding agencies.
Footnotes
1. ^To identify these 23 development projects, we first prepared the comprehensive list of 129 development projects based on the taxonomy that the World Bank has identified in July 2016 (https://projects.worldbank.org/en/projects-operations/project-theme?lang=en&page=). Among this list of the projects, we select development projects that are relevant to the slum dwellers in Mumbai through the discussion with several local field experts who were born in slums in Mumbai.
References
Benjamin, D., Heffets, O., Kimball, M., and Szembrot, N. (2014). Beyond happiness and satisfaction: Toward well-being indices based on stated preference. Am. Econ. Rev. 104, 2698–2735. doi: 10.1257/aer.104.9.2698
Biswas, R., Arya, K., and Deshpande, S. (2020). More toilet infrastructures do not open defecation: a perspective from squatter settlements in megacity Mumba. Appl. Water Sci. 10, 96. doi: 10.1007/s13201-020-1169-4
Bossert, W., Chakravarty, S., and D' Ambrosio, C. (2013). Multidimensional poverty and material deprivation. Rev. Income Wealth. 59, 29–43. doi: 10.1111/j.1475-4991.2012.00519.x
Census of India. (2001). Metadata and brief highlights on slum population. Available online at: https://censusindia.gov.in/Data_Products/Data_Highlights/Data_Highlights_link/metadata_highlights.pdf (accessed 11 March, 2022)
Census. (2011). Mumbai (Greater Mubai) City Population 2011–2022. Available online at: https://www.census2011.co.in/census/city/365-mumbai.html#:~:text=Mumbai%20Slums%202011,total%20population%20of%20Mumbai%20city (accessed 12 March, 2022)
Chowdhury, S., and Squire, L. (2006). Setting weights for aggregate indices: an application to the commitment to development index and human development index. J. Develop. Stud. 42, 761–771. doi: 10.1080/00220380600741904
De Kruijk, H., and Rutten, M. (2007). “Weighting dimensions of poverty based on people's priorities: constructing a composite poverty index for the Maldives,” in Q-Squared Working Paper, Vol. 35 (Centre for International Studies, University of Toronto).
Decancq, K., and Lugo, M. A. (2013). Weights in multidimensional indices of wellbeing: an overview. Econ. Rev. 32, 7–34. doi: 10.1080/07474938.2012.690641
Diener, E., and Suh, E. (1997). Measuring quality of life: economic, social and subjective indicators. Social Indicat. Res. 40, 189–216. doi: 10.1023/A:1006859511756
Ferreira, S., and Moro, M. (2010). On the use of subjective well-being data for environmental valuation. Environ. Resource Econ. 46, 249–273. doi: 10.1007/s10640-009-9339-8
Klasen, S. (2000). Masuring povety and deprivation in South Africa. Rev. Income Wealth 46, 33–58. doi: 10.1111/j.1475-4991.2000.tb00390.x
Krishnakumar, J., and Nadar, A. (2008). On exact statistical properties of multidimensional indices based on principal components, factor analysis, MIMIC and structural equation models. Social Indicators Res. 86, 481–496. doi: 10.1007/s11205-007-9181-8
Levinson, A. (2012). Valuing public goods using happiness data: the case of air quality. J. Public Econ. 96, 869–880. doi: 10.1016/j.jpubeco.2012.06.007
Lugo, M. A. (2007). Comparing multidimensional indices of inequality: methods and application. Res. Econ. Inequality 14, 213–236. doi: 10.1016/S1049-2585(06)14010-7
Mascherini, M., and Hoskins, B. (2008). “Retrieving Expert Opinion on Weights for the Active Citizenship Composite Indicator,” in, European Comission, Joint Research Center, Institute for the Protection and Security of the Citizen.
Naess, P. (2001). Urban planning and sustainable development. Eur. Plan. Stud. 9, 503–524. doi: 10.1080/09654310120049871
Nilsson, T. (2010). Health, wealth and wisdom: exploring multidimensional inequality in a developing country. Social Indicators Res. 95, 299–323. doi: 10.1007/s11205-009-9461-6
Noorbakhsh, F. (1998). The human development index: some technical issues and alternative indices. J. Int. Develop. 10, 589–605. doi: 10.1002/(SICI)1099-1328(199807/08)10:5<589::AID-JID484>3.0.CO;2-S
Schokkaert, E. (2007). Capabilities and satisfaction with life. J. Hum. Develop. 8, 415–430. doi: 10.1080/14649880701462239
Stiglitz, J. E., Fitoussi, J. P., and Durandm, M. (2018). Beyond GDP Measuring What Counts for Economic and Social Performance. Paris: OECD Publishing. doi: 10.1787/9789264307292-en
Subbaraman, R., Shitole, S., Shitole, T., Sawant, K., O'Brien, J., Bloom, D. E., et al. (2013). The social ecology of water in a Mumbai slum: failures in water quality, quantity, and reliability. BMC Public Health 13, 173. doi: 10.1186/1471-2458-13-173
UN-Habitat. (2020). World Cities Report 2020. The Value of Sustainable Urbanization. United Nations Human Settlement Programme (UN-Habitat), Nairobi.
United Nations. (2015). Transforming Our World: the 2030 Agenda for Sustainable Development. Available online at: https://sdgs.un.org/2030agenda (accessed 11 March, 2022)
Welsch, H. (2006). Environment and happiness: valuation of air pollution using life satisfaction data. Ecol. Econ. 58, 801–813. doi: 10.1016/j.ecolecon.2005.09.006
Yesudhas, R. (2021). Access to Water, Sanitation and Hygiene in Slumes of Mumbai. Available online at: https://www.researchgate.net/profile/Ronald-Yesudhas/publication/349493721_Access_to_Water_Sanitation_and_Hygiene_in_Slums_of_Mumbai/links/60336dc54585158939beb3ed/Access-to-Water-Sanitation-and-Hygiene-in-Slums-of-Mumbai.pdf (accessed 7 July, 2022).
Keywords: multidimensional index of development, resident-oriented approach, subjective wellbeing, slum, India
Citation: Kitsuki A and Managi S (2022) Toward a multidimensional indicator of resident-oriented sustainable development: The case of slum areas in Mumbai. Front. Sustain. 3:907821. doi: 10.3389/frsus.2022.907821
Received: 30 March 2022; Accepted: 14 July 2022;
Published: 12 August 2022.
Edited by:
Sudhakar Rao, Indian Institute of Science (IISc), IndiaReviewed by:
Conghui Meng, Zhejiang University, ChinaSouknilanh Keola, Japan External Trade Organization (JETRO), Japan
Copyright © 2022 Kitsuki and Managi. This is an open-access article distributed under the terms of the Creative Commons Attribution License (CC BY). The use, distribution or reproduction in other forums is permitted, provided the original author(s) and the copyright owner(s) are credited and that the original publication in this journal is cited, in accordance with accepted academic practice. No use, distribution or reproduction is permitted which does not comply with these terms.
*Correspondence: Akinori Kitsuki, a2l0c3VraUBhcnRzY2kua3l1c2h1LXUuYWMuanA=
 Akinori Kitsuki
 Shunsuke Managi