 Pervez Alam
 Mohd. Aamir Mazhar2*
 Zishan Aslam
- 1Department of Civil Engineering, Baba Ghulam Shah Badshah University, Rajouri, India
- 2Department of Civil Engineering, Jamia Millia Islamia, New Delhi, India
- 3Department of Civil Engineering, Aligarh Muslim University, Aligarh, India
Noise pollution has risen to a worrying degree in all zones of the city (residential, commercial, industrial, and silent) because of the rapid rise in urbanization, industrialization, and other connectivity of transport systems in all zones of the city. It has always been challenging to identify noise hotspots where immediate remedial measures are required. In addition to providing the propagation of noise in the X and Z direction, 2D noise mapping is an essential method for identifying regions where noise levels may reach a hazardous level. Thus, the comparative examination of all residential areas inside a city provides a clear picture of noise exposure. The main focus of this study is to carry out comparative analysis of noise exposure level of selected locations such as residential commercial, industrial and silent area of Delhi city using 2D noise maps. For noise monitoring, Sound Level Meter (SLM) Larson & Davis 831 in compliance with the standard procedure of CPCB is used for monitoring peak traffic hours of working day and night. After that, using sound PLAN (acoustic) and MapInfo Pro, 2-D (Desktop GIS) noise maps were developed, visualized, and analyzed. According to the findings, residential areas have been recorded as having the highest levels of noise, followed by commercial and silent zones, and industrial areas have been seen to have the lowest levels of noise. The high noise level in residential area may be due to heavy traffic volume and road surrounded by high rise buildings. Whereas minimum noise has been observed in industrial area because the industries along the major roads have been surrounded with parapets and trees. As a result, only a small amount of industrial noise entered major highways/roads. Additionally, 2D noise map revealed that the surrounding structures of road (high rise buildings, brick walls, grilled boundaries, trees etc.) significantly influence propagation of noise in all directions. These maps may also be utilized by decision makers in the process of formulating noise control strategies or implementing corrective measures.
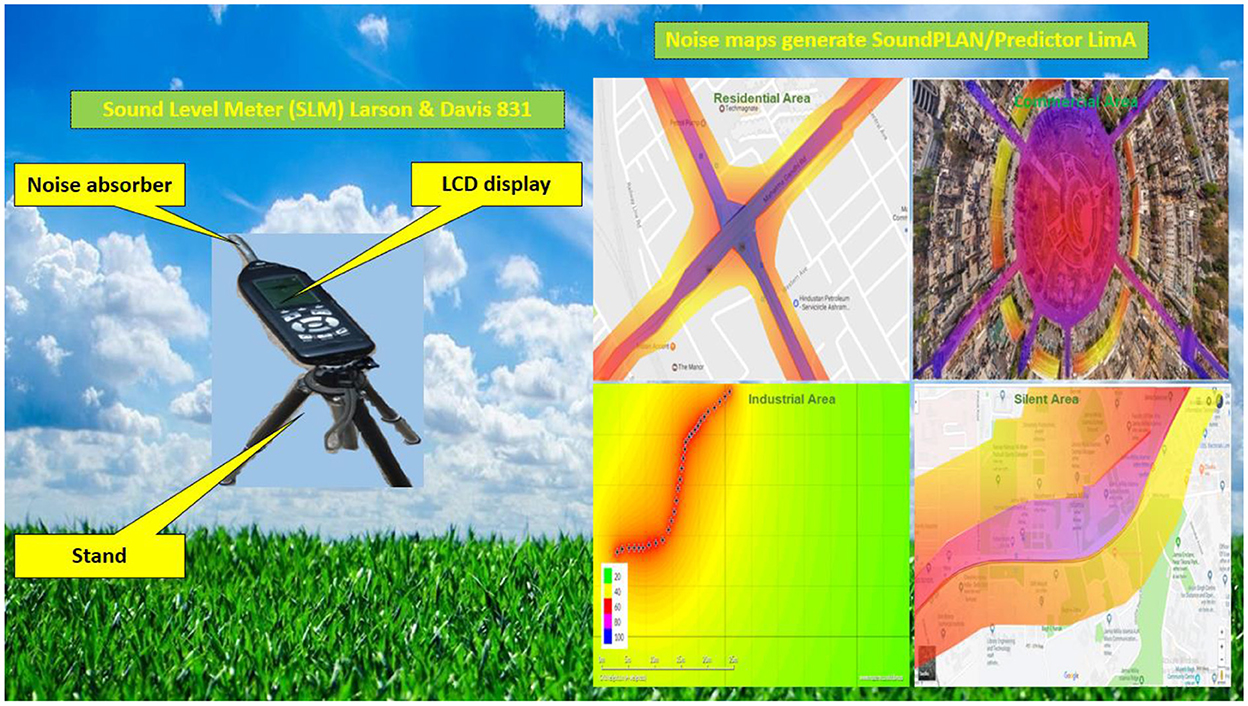
Graphical Abstract
Introduction
One of the major factors that lowers the quality of life in urban areas around the world is noise pollution, which is a problem in almost every major city. Because of rapid urbanization and industrialization, as well as the proliferation of other modes of transportation and communication, the level of noise pollution has reached a truly alarming level. It is of the utmost importance to identify the source(s) of the noise, the levels of the noise, and critical areas that require immediate action. Monitoring of the noise and creating a map of the noise in two dimensions (also known as “2D noise mapping”) may play an important part in locating the critical position of noise exposure. Studies dealing with noise monitoring are particularly required for noise stains in order for sound levels to be monitored and for appropriate reduction measures to be made in order to control noise pollution (Alam et al., 2020). Because automobile traffic is such a significant source of sound pollution, it should come as no surprise that the majority of research done in the past has concentrated on road traffic noise (Alam, 2019; Murphy et al., 2020; Yang et al., 2020; Asensio et al., 2021). The levels of noise that were recorded as being the loudest were found in commercial areas of Delhi, followed by industrial areas, and then residential areas had the lowest levels of noise (Singh and Jain, 1995). In India, only a limited amount of research has been done comparing noise monitoring in residential and commercial areas (Singh and Jain, 1995; Tripathi et al., 2006; Tyagi et al., 2006). In a different piece of research, the authors described the National Ambient Noise level (NANL) in India's most important cities (Garg et al., 2017). The information gathered from the monitoring of noise is then incorporated into the creation of noise maps. The graphical representation of noise levels that is referred to as “noise maps” shows different color combinations depending on the level of noise. It is one of the most effective methods for determining the levels of ambient noise, as well as the origin, sources, and distribution of that noise. It encompasses the entirety of the mapping process, beginning with the collection of data and continuing through its access and processing for the purposes of modeling and computation. Additionally, it presents data on outdoor sound levels, sound exposure, noise effects, and the number of people who are impacted by the noise. Noise maps are also helpful for defining current reference data, which can be used to evaluate the effectiveness of potential noise-control measures (EU of Noise Policy Working Group, 1990). This can be done by looking at the levels of noise in different areas of the map. Through a pilot project of the National Ambient Noise Monitoring Network (NANMN), the Central Pollution Control Board (CPCB) in India is monitoring the noise mapping in residential, commercial, and industrial areas. This project covers 35 locations in metropolitan cities across India, including Bangalore, Delhi, Hyderabad, Kolkata, Mumbai, Lucknow, and Chennai (ENVIS, 2019). Numerous researchers have utilized 2D noise mapping with great success in order to monitor the propagation of road traffic noise in X and Y direction at any location (Ouis, 2001; Lee et al., 2008; Tsai et al., 2009; Deswal and Chandna, 2010; Senthil and Murugappan, 2013). In Korea, in order to monitor the spread of noise caused by construction activities, 2D noise maps have been put into use (Jeong et al., 2010). The evaluation of the noise caused by road traffic in Hong Kong is made significantly easier with the help of 2D and 3D noise mapping (Law et al., 2011). In a different piece of research that was carried out by Wang and Kang (2011), the authors compared the impact of urban morphology on the dispersion of noise in two cities located in the United Kingdom and China. They had finally used a computational model for noise prediction and the subsequent development of noise maps when (Zannin and de Sant'Ana, 2011) were doing noise maps at various stages of the development project. A review of the relevant literature indicates that urban areas in developing countries lack research of this kind, particularly comparative noise level assessment through 2D noise mapping, which has a significant influence on noise level distribution patterns.
In this study, 2D noise mapping was used to analyze monitoring data collected at various noise monitoring stations in the residential, commercial, industrial, and silent zones of the metropolitan city (New Delhi). These zones included areas such as Ashram Chowk, Connaught Place, Okhla Industrial Area, and Jamia Millia Islamia, respectively. The study also covered areas surrounding Jamia Millia Islamia. In order to investigate the state of the city's noise pollution at the present time, noise maps of the metropolitan area of New Delhi were produced. An investigation into the noise mapping of four land use zones, namely residential, commercial, industrial, and silent zones, was carried out, and the results were compared to relevant regulations concerning noise levels.
Methodology
In the next sections, the study region, noise monitoring equipment, and process for 2D noise mapping are discussed.
Study area
The research is performed in the city of Delhi, also called as the National Capital Territory of Delhi (NCT). It is an Indian union territory and capital of India. The land use plan for Delhi was structured in 1990 to control haphazard growth, and the city was then divided into residential, commercial, industrial, and silent areas. In view of above fact, study area has been selected in all four-land use zone.
Residential area
The geographic location of New Delhi and the neighborhood of Ashram Chowk is shown in Figure 1. In the middle of Ashram Chowk is a flyover, and on one side of the intersection are high-rise buildings, while the other side is open.
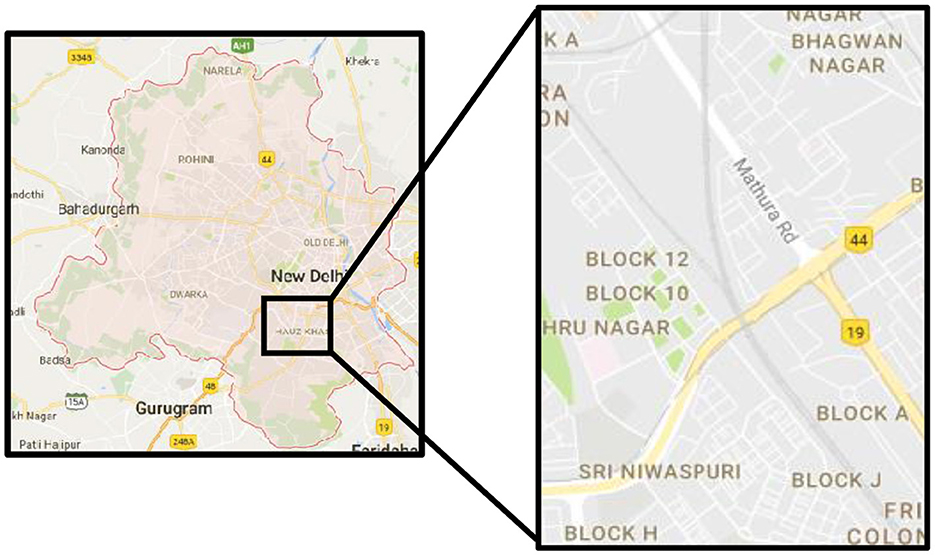
Figure 1. Geographical locations of New Delhi and residential area (Source: G https://www.google.com/maps/place/Ashram$+$chowk/@28.5753643,77.2511544,17z/data$=$!3m1!4b1!4m5!3m4!1s0x390ce37ac7564bdd:0x9fe5bff9a0eb95df!8m2!3d28.5753601!4d77.2556314).
Commercial area
In the middle of Delhi, at an elevation of 28°37′58′ North and 77°13′11″ East, you'll find Connaught Place (CP). It is one of the most important commercial and financial centers in the entire country of India. The Central Plaza was developed by the British in 1933, when they moved their capital from Kolkata to New Delhi in 1911. Since then, it has become India's most important commercial center (MoC, 2021). Every day, CP is frequented by thousands of people who are either working, shopping, visiting, or just hanging out with friends. Additionally, CP is frequented by the employees of the retail spaces that are located within the circle. The CP was built in the form of concentric rings, each of which was then further subdivided into an outer, an inner, and a middle circle. The majority of the commercial shops are located in the inner and outer circles, while the middle circle is home to the majority of the offices. For the purposes of this study, we have decided to focus on CP (Figure 2) because of its significant historical significance, high volume of daily traffic, and variable road conditions.
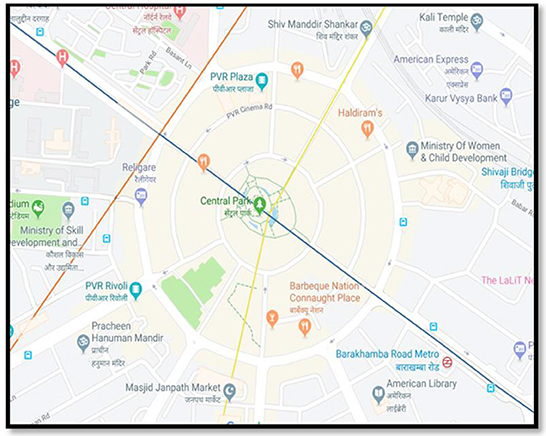
Figure 2. Geographical location of Connaught Place, New Delhi commercial area (Source: https://www.google.com/maps/place/Connaught$+$Place,$+$New$+$Delhi,$+$Delhi$+$110001/@28.6289017,77.2065322,15z/data$=$!3m1!4b1!4m5!3m4!1s0x390cfd37b741d057:0xcdee88e47393c3f1!8m2!3d28.6304203!4d77.2177216).
Industrial area
The Okhla Industrial Area in New Delhi can be found in the general vicinity shown in Figure 3. A suburban community known as Okhla can be found in the South Delhi district of the National Capital Territory (NCT) of Delhi. It is located close to the Okhla barrage. The Okhla Industrial Area is a significant commercial and manufacturing center in south Delhi (OIA).
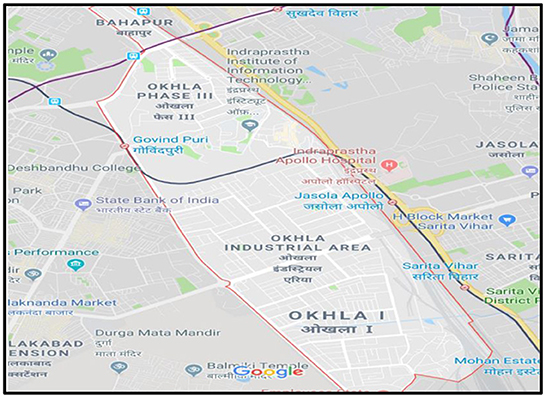
Figure 3. Geographical location of Okhla Industrial Area, New Delhi (Source: https://www.google.com/maps/place/Okhla$+$Industrial$+$Estate,$+$New$+$Delhi,$+$Delhi/@28.5378786,77.2585229,14z/data$=$!3m1!4b1!4m5!3m4!1s0x390ce3e8cacc5ef9:0xa4b8a9f9198e4d6d!8m2!3d28.5317239!4d77.2766287).
Silent area
The research for the silent region was conducted on densely populated area of Jamia Millia Islamia University's road in New Delhi (India), as shown in Figure 4. Six temporary noise monitoring stations with different road conditions have been established. The Jamia Millia Islamia established in 1920 become central university by act of Indian parliament in 1988. The campus of university is spread in total of 21 acres of land and has seven faculties and 38 Departments (JMI, 2021).
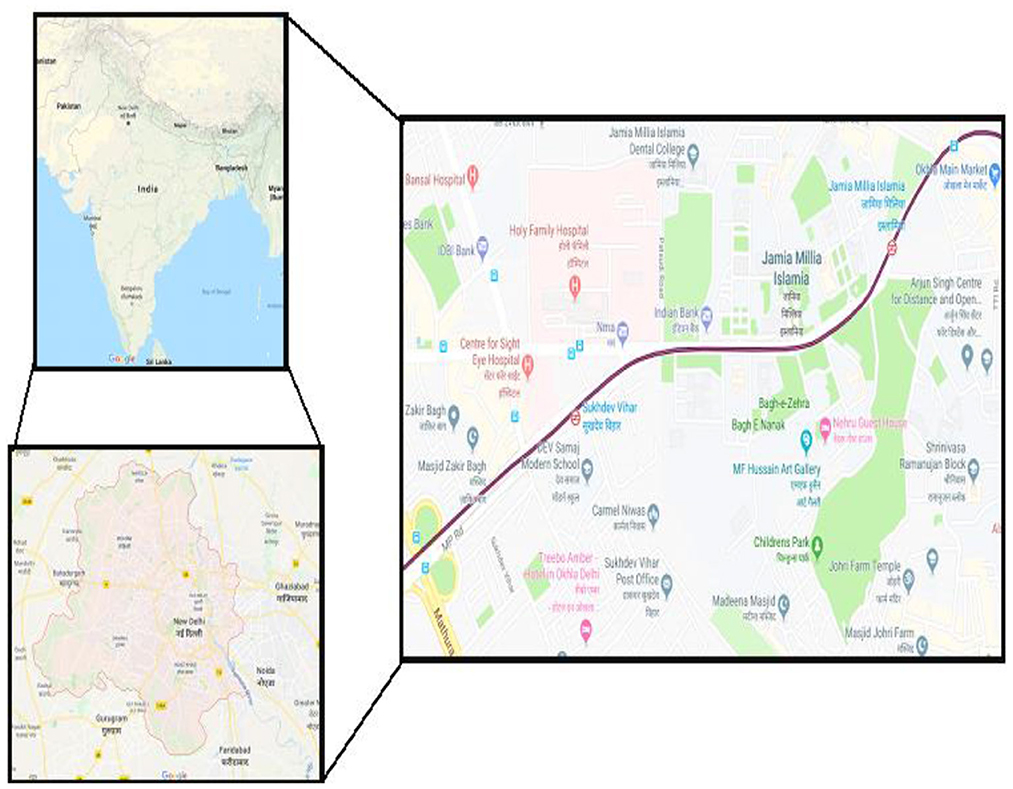
Figure 4. Geographical location of silent area, New Delhi (Source: https://www.google.com/maps/place/Jamia$+$Millia$+$Islamia/@28.5623169,77.2781945,17z/data$=$!3m1!4b1!4m5!3m4!1s0x390ce38acd1105e9:0xc7a86610a5a612d9!8m2!3d28.5623169!4d77.2803832).
Noise monitoring procedure
According to the Central Pollution Control Board (CPCB), 2005, it was determined that the monitoring of ambient noise in terms of Leq(A) was appropriate (Kumar and Srinivas, 2015). Later on, in 2016, the same was recognized as an international standard after being validated by ISO 1996-1. This was done in accordance with EU Policy. As a result, the A-weighted noise level, or Leq(A), has become the standard for the monitoring and evaluation of noise levels in the environment. The monitoring of the noise was carried out according to the standard method suggested by the International Organization for Standardization in 1996 parts 1 and 2, as well as by the Central Pollution Control Board in 2005 (Noise Monitoring Protocol, Central Pollution Control Board, 2015).
The standardized process has been adopted as the method of choice for the purposes of noise monitoring. For example, the height of the tripod stand was kept at 1.5 m above the level of the ground at all times. A low relative humidity and a low wind speed are some of the conditions that exist in the environment (< 5 m per s). After each reading, the instrument was adjusted to ensure accuracy. Only during business hours did anyone bother to check on how loud things were getting. In addition to that, particular focus was placed on reducing the negative effects of the wind as much as possible.
Noise mapping condition and procedure of residential, commercial, industrial, and silent area
The approach that is broken down into steps for constructing 2D noise maps of the area that has been selected, in accordance with the authors' earlier work (Alam et al., 2021). The creation of an electronic depiction of the position map. Make a note of the location of the noise monitoring station on the digitized map. At designated noise monitoring stations, round-the-clock monitoring of the level of ambient noise is carried out continuously, and data from a variety of stations is compiled in the form of excel sheets. Using the data obtained in the step before this one and the digitalized graphic that is currently accessible the prediction has been made. The noise maps that were produced were done so with the use of Predictor LimA, which made use of noise map. In the form of a flow chart, Figure 5 depicts the noise mapping technique that is used for the generation of horizontal noise maps.
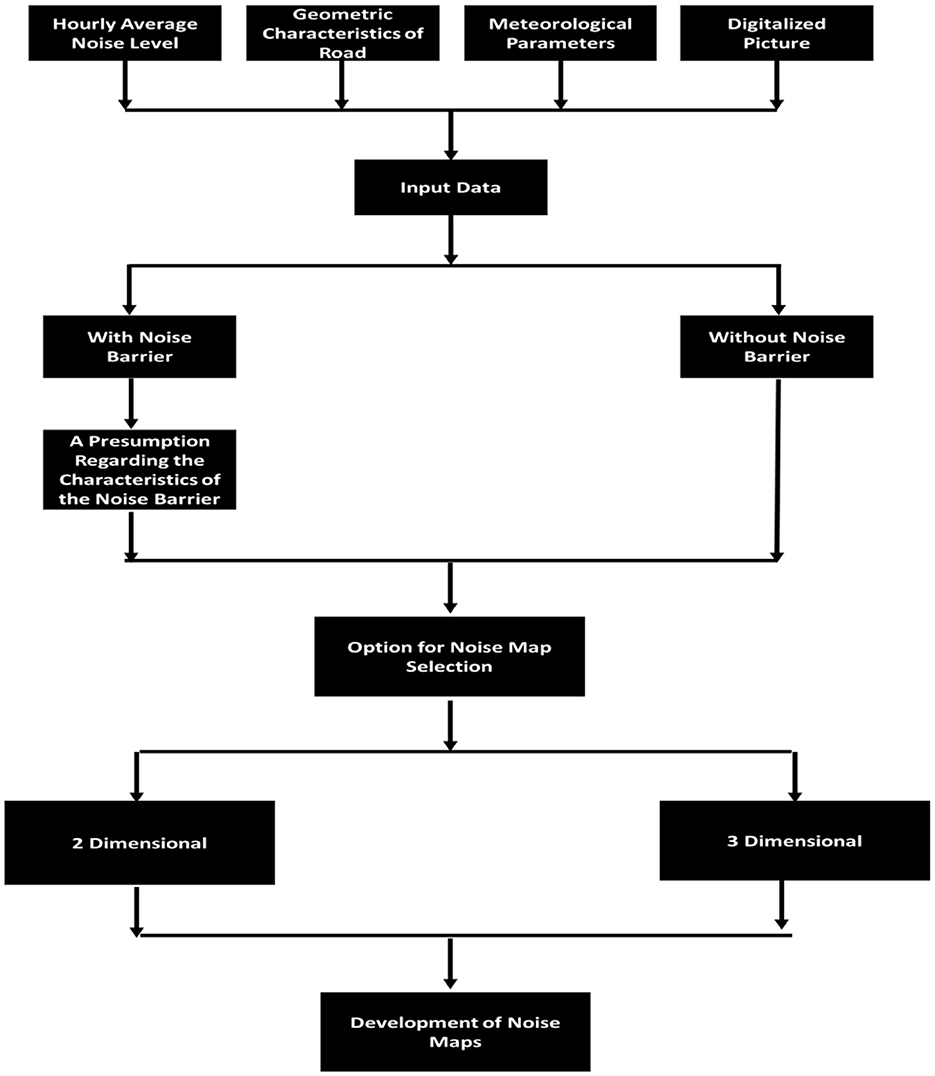
Figure 5. Flow chart of 2D noise mapping.
Noise monitoring instrumentation
Two sound level meters (Larson and Davis Model 831) is used for noise monitoring. As represented in Figure 6, it is a fifth-generation, class-I environmental and building acoustic analyzer consisting of an Electra condenser microphone for high accuracy and long-term stability with resolution capacity of 48kHz. Additionally, A precise microphone calibrator, the Larson Davis CAL200 Sound Level Calibrator is used for the calibration of sound level meters. At a frequency of 1 kHz, it is capable of delivering an output level of either 94.0 or 114.0 dB, which can be selected by a switch.
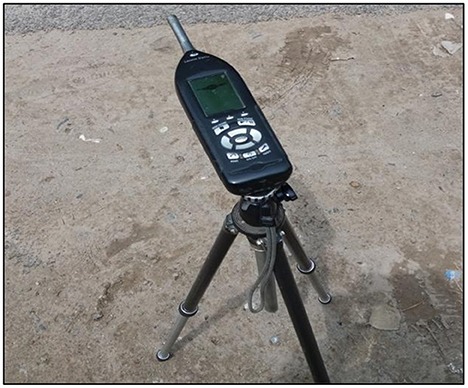
Figure 6. Sound level meter Larson and Davis-831.
Results and discussion
Noise monitoring and 2D noise mapping results pertaining to different (residential, commercial, industrial, and silent) areas is presented and discussed in the succeeding sections.
Noise monitoring
Noise monitoring results of residential, commercial, industrial, and silent area, i.e., Ashram Chowk, Connaught Place, Okhla Industrial Area, and Jamia Millia Islamia for working days is presented and enumerated in the following sections.
Residential area
The results of the noise monitoring in terms of Leq at Ashram Chowk are displayed in Figure 7. Based on the results of the monitoring, the maximum noise level (Leq) at Ashram Chowk is found to be 86.8 ± 3.42 dB (A) at 5 PM, while the minimum noise level is 75.5 ± 3.42 dB (A) at 4 AM. This could be due to the fact that during off-peak hours there is very little traffic at the intersection of the Chowk, whereas during peak hours there is a lot of it. An additional factor that contributes to the overall volume of sound at Ashram Chowk is the presence of reflective noise. This is because a flyover passes directly above the intersection. Because of the high volume of traffic, the authors found that the hourly average noise levels in Santiago City were significantly higher during the daytime than they were during the evening hours (Suárez and Barros, 2014).
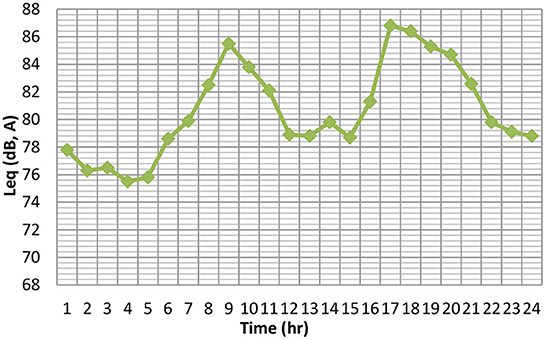
Figure 7. Variation of hourly average noise level at Ashram Chowk.
Commercial area
Figure 8 illustrates the difference in noise level between the residential area and the commercial area. At nine in the morning and two in the morning, the Leq noise level was measured to be a maximum of 77.8 ± 9.29 dB (A) and a minimum of (48.9 ± 9.29 dB A), respectively. At night, the decibel level never exceeds the permissible limit set by the authorities. However, the noise level that was recorded during the daytime continues to be higher than the standard that was prescribed by the CPCB. This could be the consequence of a number of different commercial activities, such as the movement of vehicles during office hours. During the daytime, the author observed a maximum Leq noise level of < 80 dB (A) in a commercial area of Delhi (Akhtar et al., 2016).
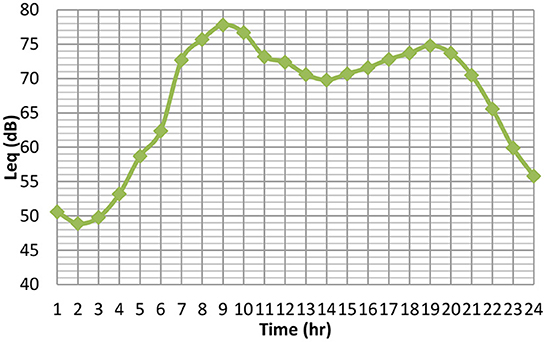
Figure 8. Variation of hourly average noise level at Connaught Place.
Industrial area
Figure 9 depicts the variation in Leq levels of noise levels measured at various monitoring stations located within an industrial area. At one in the morning, the Leq noise level is at its highest (57.8 ± 3.98 dB A) and it is at its lowest (44.1 ± 3.98 dB A) at three in the afternoon. At the monitoring station, the level of noise is not above the permissible limit, which is 70 dB at night and 75 dB (A) during the day. This limit was established by the regulatory standard of the CPCB. Authors have reported findings that are comparable to this one (Banihani and Jadaan, 2012). According to what they discovered, the noise level in the Okhla Industrial Area ranges from 40 to 45 dB (A) during the day and from 55 to 60 dB (A) during the night. This is because walls and trees have been put up to enclose the small industries along the major thoroughfares. The amount of noise from factories was kept to a minimum, even along main thoroughfares. Only cars driven by individuals and trucks used in the industrial sector to load and unload goods are to blame for the annoying noise that permeates the air.
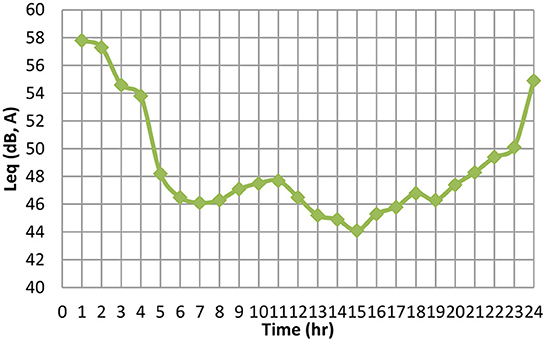
Figure 9. Variation of hourly average noise level at industrial area.
Silent area
The variation of the Leq noise level that occurs hourly on average at Jamia Millia Islamia (JMI) throughout the day and night is depicted in Figure 10. All of the selected noise monitoring stations at JMI have found that the Leq noise level is significantly higher during the daytime hours compared to the overnight hours. The daytime noise level that was measured to be the loudest was 65.9 ± 8.51 dB(A), and the night time noise level that was measured to be the quietest was 42.2 ± 8.23 dB(A). During the daytime hours (6 a.m. to 10 p.m.), the noise level at all of JMI's monitoring stations is consistently higher than the CPCB standard that has been established as 50 dB. This could be because of the high volume of traffic that occurs early in the morning, around the time that classes at various educational institutions begin. Nevertheless, when night falls, the situation is completely different: the noise level that was recorded is well within the CPCB's acceptable range. The authors conducted a comparative study of the levels of noise in a few different areas of Delhi and found that the commercial areas had the highest levels of noise, followed by the industrial areas, and then the silent areas had the lowest levels of noise. However, noise level remains more than permissible limits (Singh and Jain, 1995).
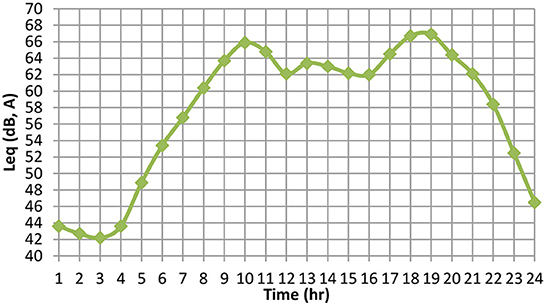
Figure 10. Average hourly variation of noise level at silent area.
2D noise mapping
2D noise maps of the commercial, residential, industrial, and silent zones have presented in the subsequent sections. The noise hotpots and the analyses of noise levels (Leq) at various critical locations for all zones have also been thoroughly discussed.
Residential area
The Figure 11 depicts a 2D noise map of Ashram Chowk, the highest noise level recorded at Ashram Chowk during peak hours, is 75–80 dB (A) (Color Code-Blue). This may be due to the environmental impact of numerous obstructions such as a flyover, an intersection, and surrounding multi-story buildings. However, noise levels cease to decrease with distance and eventually attained a value of 70–74 dB (A) (Color Code-Red) and 65–70 dB (A) (Color Code-Yellow) at a distance of 46.5 and 63.5 m from the intersection and the median. however, Noise levels around the intersection up to range of 83.5 m were found to be 70–74 dB (A) (Color Code-Red). This may be attributed to the high volume of traffic and additional reflective noise. Similar study has been conducted for the city Surat of Gujarat, India. They concluded that the traffic pattern in cities like Surat is heterogeneous that added 0.5–8 dB noise in comparison to homogeneous traffic condition (Sonaviya and Tandel, 2019).
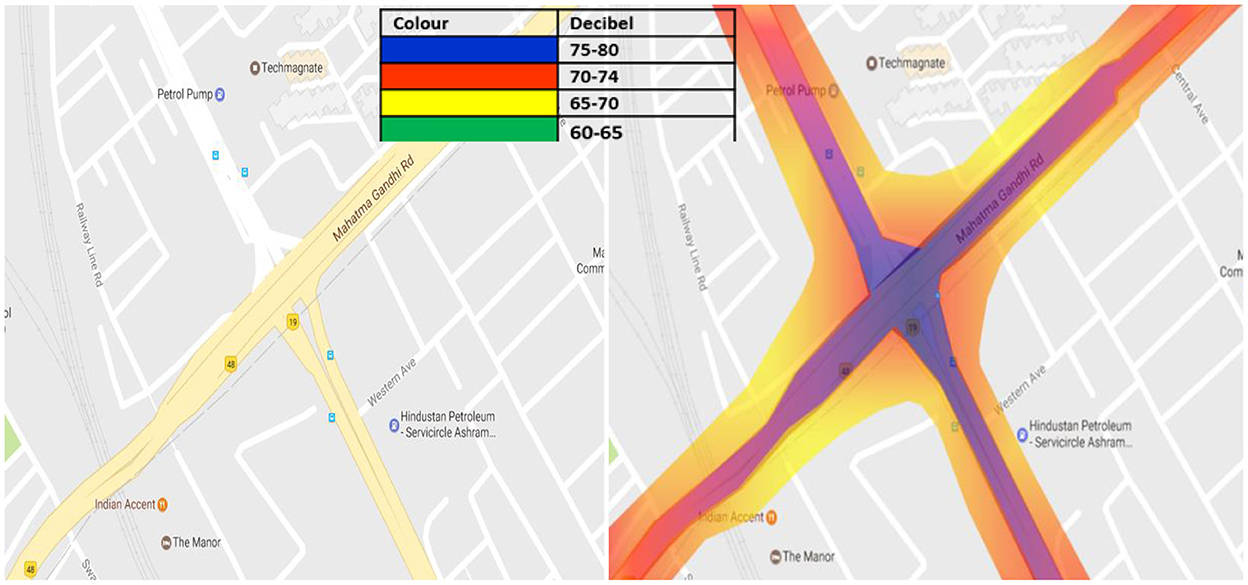
Figure 11. 2D noise mapping of residential area.
Commercial area
2D noise mapping of CP has been shown in Figure 12 which variation of the noise level in X and Y direction from the median of the road can be seen. The results revealed that a distance of 19 and 45 m from median of road the noise level is drastically reduced from the range of 75–80 dB−65 dB(A) (color code: Magenta). Here the noise level continues to be maximum for most of the time due to high traffic volume from all the eight roads, i.e., Minto Road, Barakhamba Road, Sansad Marg, Baba Khadak Singh Marg, Shaheed Bhagat Singh Marg, Panchkuian Marg, and Kasturba Gandhi Marg which are converging toward CPOC. Also, the presence of high-rise buildings on both sides of the road adds up to the reflective noise, thus increasing the overall noise level. Recently, Farcas and Sivertunb uses GIS tool for noise mapping and observed that nearby structures influence the distribution of noise (Farcas and Sivertunb, 2020).
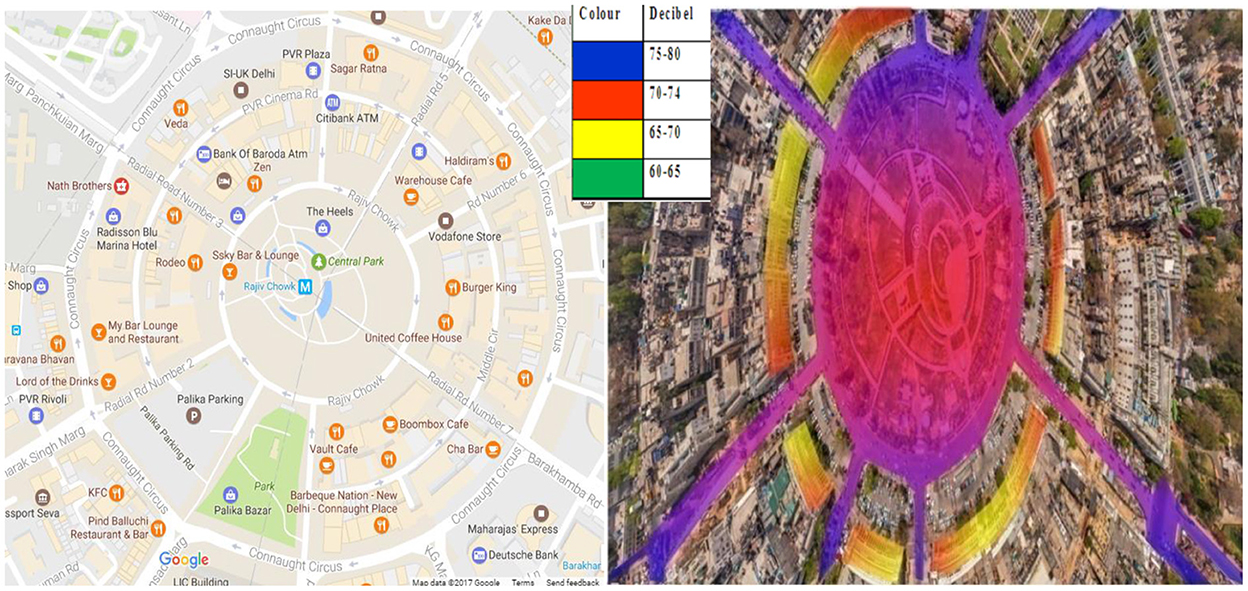
Figure 12. 2D noise mapping of commercial area.
Industrial area
According to results obtained from 2D noise mapping, the noise level at Okhla Industrial Area Phase–III is found to be higher than that of Okhla Industrial Area Phase-I but lower than that of Okhla Industrial Area Phase-II. The noise level at the main road's median remains in the range of 60–65 dB (A) (Color Code-Red), as shown in Figure 13. It decreases with increase in distance from the main road's median and achieves a maximum value of 40 decibels (A) (Color Code-Yellow) and at a distance of 68 m and eventually drops to 20–25 dB (color Code-Light Green) at a distance of 106 m from the main road's median. The small plant along the main roads is surrounded with walls and trees, resulting in an exceptionally low noise level. As a result, only a small amount of industrial noise entered major highways. In the Industrial Area, only personal vehicles and vehicles used for loading and unloading of materials contributes noise pollution.
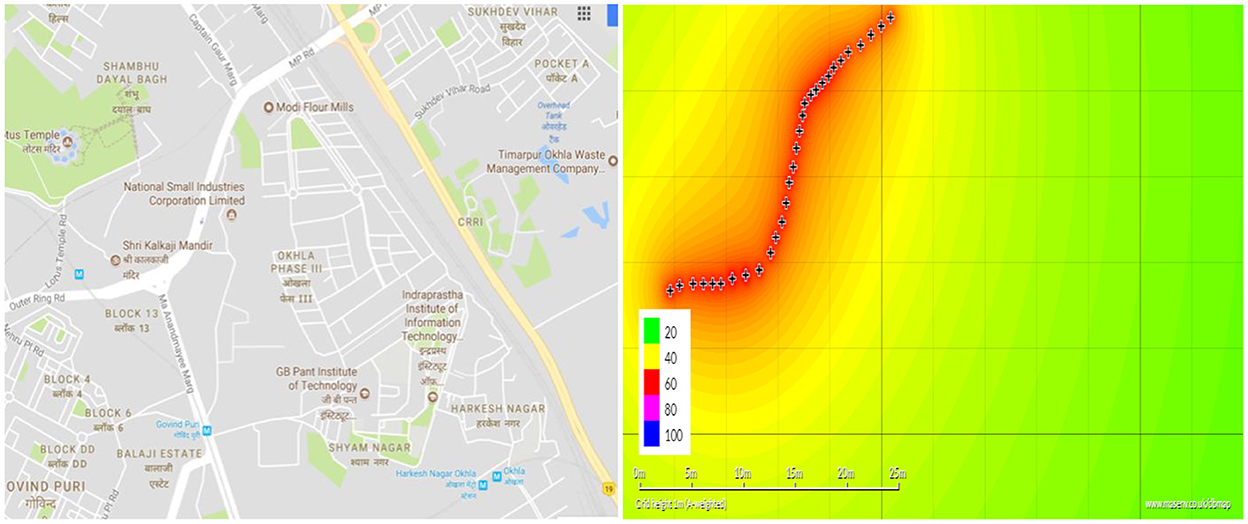
Figure 13. 2D noise mapping of industrial area.
Silent area
2D noise mapping has been developed for Jamia Millia Islamia (JMI), Escorts Heart Institute and Don Bosco Institutional Area, as shown in Figure 14. Results of 2D noise mapping revealed that the noise level at the median of the major road crossing through JMI is in the range of 70–75 dB(A) (Color Code-Blue). Further, it reduces on either side of the road and at a distance of 54 m from the median it achieves the range of 70–74 dB (A) (Color Code-Red). However, noise level is observed to be slightly less 60–65 dB (A) (Color Code-Yellow), than Don Bosco Institutional Area and Escorts Heart Institute in comparison to the JMI because traffic converges from Maulana Mohammad Ali Jauhar Marg and MP Marg toward JMI. Zannin and Ferraz (2016) investigated outdoor noise pollution for Federal University Hospital, Brazil. Their findings of noise maps created by Federal University clearly shows high noise level, which is mainly caused by light and heavy vehicle traffic. Buses and trucks made up the majority of the heavy vehicles counted during the sound pressure measurements (Zannin and Ferraz, 2016).
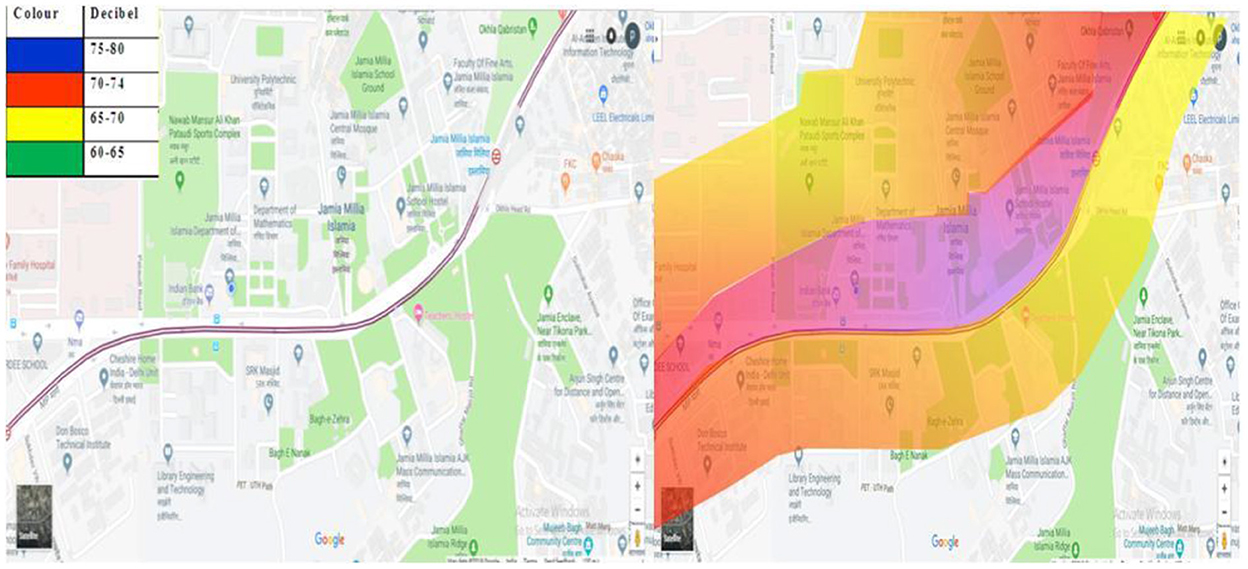
Figure 14. 2D noise mapping of silent area.
Comparative analysis
A comparative study of all the above zone, i.e., commercial, residential, industrial, and silent is done and data for the same is represented through (Figure 15). It is clear that noise level recorded for residential zone (Ashram chowk) is much higher than all other zones shown in graph for all 24 h (day and night time). This may be attributed to high traffic volume at the intersection of Ashram Chowk as compared to other zones and reflective sounds due to presence of flyover also augmented the noise level. The absolute maximum and minimum noise level recorded during day time 6 a.m. to 10 p.m. is 86.8 ± 3.42 dB in the residential zone and 44 dB in the industrial zone while during night time 11 p.m. to 5 a.m. same is registered as 79 dB in residential zone and 44 dB in the silent zone. These values are in compliance with CPCB standard limits prescribed for day and night time Leq in different area of zones accept for residential area (Ashram chowk) where permissible Leq is 55 dB in day time and 45 dB in night time. A similar comparative study has been conducted by Oyedepo and Saadu (2009) for the selected area of Nigeria. They observed that the industrial area has been exposed with maximum noise level [110 dB(A)] followed by busy roads and passenger loading parking (Oyedepo and Saadu, 2009).
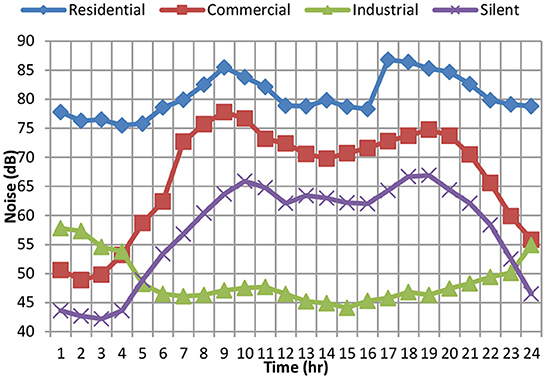
Figure 15. Comparative analysis of noise level.
2D noise mapping of different zones of area, i.e., residential, commercial, industrial, and silent is analyzed in Figure 16. The maximum noise level is recorded at residential area followed by commercial and silent zone and the minimum noise level has observed at industrial area. The high noise level in residential area may be due to heavy traffic volume and road surrounded by high rise buildings. But, since the small factories along the main roads have been enclosed with walls and trees, there has been truly little noise in the industrial region. So only a small amount of industrial noise made its way up to major roads. Additionally, 2D noise map also revealed that the surrounding structures of road (high rise buildings, brick walls, grilled boundaries, trees etc.) significantly influence propagation of noise in all directions.
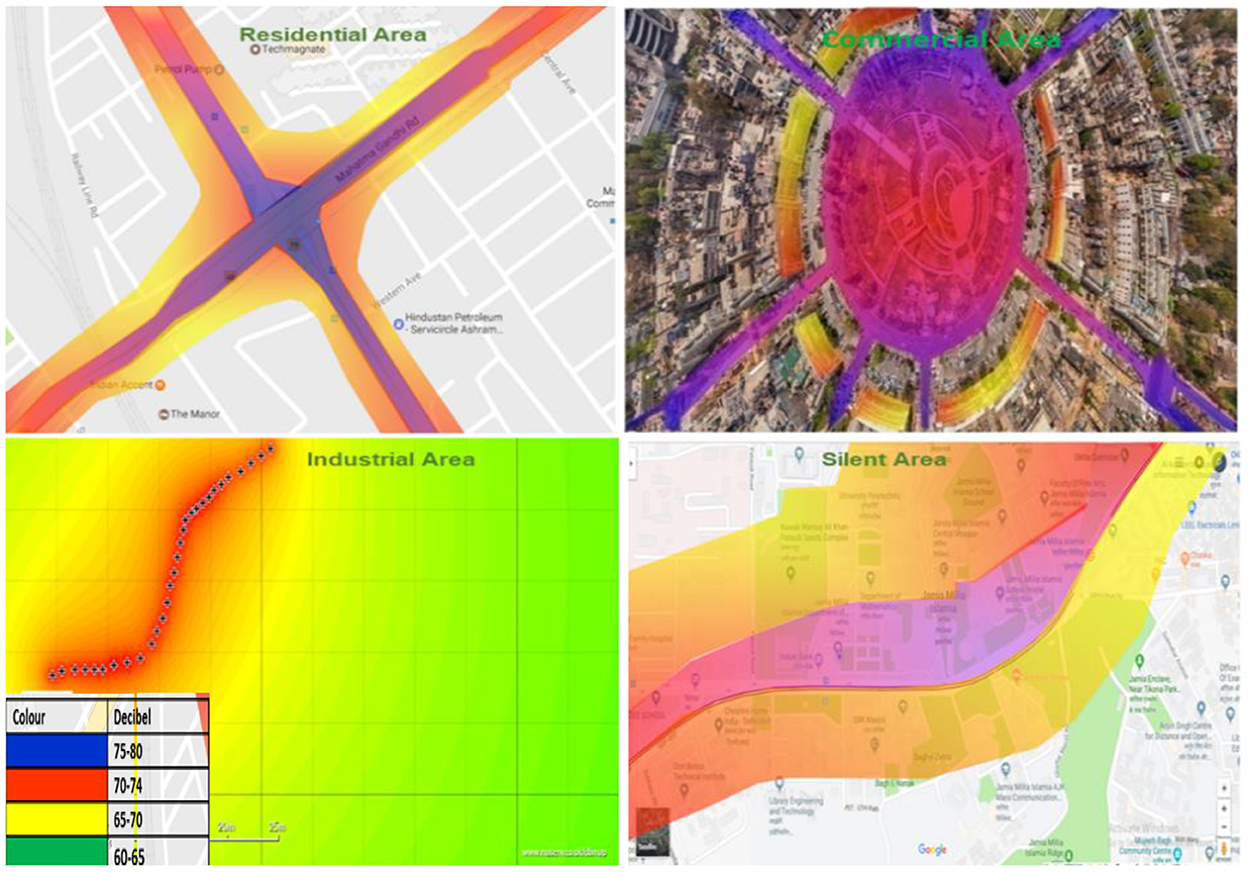
Figure 16. Comparative analysis of noise level through 2D noise mapping.
Conclusion
Noise monitoring was conducted in four pre-selected places, including commercial, residential, industrial, and silent areas, for this analysis. Peak hour has been defined based on monitoring data. For peak hours, 2D noise maps were created to conduct a comparative study of various city zones. The monitored results showed that noise levels were highest in residential areas, followed by commercial and silent areas, and lowest in industrial areas. Noise levels at selected Industrial Area locations were consistently below the CPCB's recommended limit. The difference in noise levels on both sides of the lane can be seen on 2D noise maps. It was discovered that noise levels are highest along the road's center line and gradually decrease on either side as distance increases. It was also discovered that the road's surroundings (high-rise buildings, brick walls, grilled borders, trees, etc.) have a major impact on noise transmission in all directions. As a result, 2D noise mapping is an effective method for evaluating the noise level distribution in any area over time and distance.
Data availability statement
The raw data supporting the conclusions of this article will be made available by the authors, without undue reservation.
Author contributions
SA contributed to the updated manuscript. AH contributed to the introduction and results section. PA contributed to the methodology. MM and PA contributed to the data collection, analysis, and writing original draft. KA contributed to conceptualization and supervision. ZA and KA contributed to the writing review and editing. All authors read and approved the final manuscript.
Acknowledgments
The authors are very thankful and acknowledge to administration BGSBU and Jamia Millia Islamia.
Conflict of interest
The authors declare that the research was conducted in the absence of any commercial or financial relationships that could be construed as a potential conflict of interest.
Publisher's note
All claims expressed in this article are solely those of the authors and do not necessarily represent those of their affiliated organizations, or those of the publisher, the editors and the reviewers. Any product that may be evaluated in this article, or claim that may be made by its manufacturer, is not guaranteed or endorsed by the publisher.
Abbreviations
CPCB, Central Pollution Control Board; CP, Connaught Place; 2D, 2-Dimensional; NANL, National Ambient Noise level; SLM, Sound Level Meter.
References
Akhtar, N., Ahmad, K., and Alam, P. (2016). Noise monitoring and mapping for some pre-selected locations of New Delhi, India. Fluct. Noise Lett. 15, 1650019. doi: 10.1142/S021947751650019X
Alam, P. (2019). Effects of urban morphology on the traffic induced noise distribution through 2D noise mapping: a case study of okhla industrial area, New Delhi, India. Int. J. Tech. Innov. Modern Eng. Sci. 5, 1.
Alam, P., Ahmad, K., Afsar, S. S., and Akhtar, N. (2020). 3D noise mapping for preselected locations of urban area with and without noise barriers: a case study of Delhi, India. Noise Map. 7, 74–83. doi: 10.1515/noise-2020-0006
Alam, P., Ahmad, K., Khan, A. H., Khan, N. A., and Dehghani, M. H. (2021). 2D and 3D mapping of traffic induced noise near major roads passing through densely populated residential area of South Delhi, India. PLoS ONE 16, e0248939. doi: 10.1371/journal.pone.0248939
Asensio, C., Pavón, I., Ramos, C., López, J. M., Pamiés, Y., Moreno, D., et al. (2021). Estimation of the noise emissions generated by a single vehicle while driving. Transp. Res. D Transp. Environ. 95, 102865. doi: 10.1016/j.trd.2021.102865
Banihani, Q., and Jadaan, K. (2012). Assessment of road traffic noise pollution at selected sites in Amman, Jordan: Magnitude, control and impact on the community. Jordan J. Civil Eng. 6, 267–278.
Central Pollution Control Board (2015). Protocol of Ambient Noise Level. Delhi: Central Pollution Control Board.
Deswal, S., and Chandna, P. (2010). Effects of meteorological conditions on concentration of air pollutants in Delhi. Int. J. Environ. Pollut. 42, e034226. doi: 10.1504/IJEP.2010.034226
ENVIS (2019). Noise Monitoring Database. ENVIS Resource Partner on Control of Pollution Water, Air and Noise Hosted by Central Pollution Control Board. Sponsored by Ministry of Environment and Forests, Govt of India, Delhi.
Farcas, F., and Sivertunb, Å. (2020). Road traffic noise: gis tools for noise mapping and a case study for skåne region. Int. Arch. Photogram. Rem. Sens. Spatial Inform. Sci. 34.
Garg, N., Sinha, A. K., Dahiya, M., Gandhi, V., Bhardwaj, R. M., and Akolkar, A. B. (2017). Evaluation and Analysis of Environmental Noise Pollution in Seven Major Cities of India, PAN - IPPT, 42.
Jeong, J. H., Din, N. B., Otsuru, Y., and Kim, H. C. (2010). An application of a noise maps for construction and road traffic noise in Korea. Int. J. Phys. Sci. 5, 1063–1073. Available online at: https://academicjournals.org/article/article1380793975_Jeong%20et%20al.pdf
Kumar, K. V. D., and Srinivas, N. (2015). Study of noise levels at commercial and industrial areas in an urban environment. Int. J. Eng. Res. Appl. 5, 89–92.
Law, C. W., Lee, C. K., Lui, A. S. W., Yeung, M. K. L., and Lam, K. C. (2011). Advancement of three-dimensional noise mapping in Hong Kong. Appl. Acoust. 72, 534–543. doi: 10.1016/j.apacoust.2011.02.003
Lee, S.-W., Chang, S. I. L., and Park, Y.-M. (2008). Utilizing noise mapping for environmental impact assessment in a downtown redevelopment area of Seoul, Korea. Appl. Acoust. 69, 704–714. doi: 10.1016/j.apacoust.2007.02.009
MoC (2021). Delhi: Imperial capital of British India. Ministry of Culture, Government of India, Delhi.
Murphy, E., Faulkner, J. P., and Douglas, O. (2020). Current state-of-the-art and new directions in strategic environmental noise mapping. Curr. Pollut. Rep. 6, 54–64. doi: 10.1007/s40726-020-00141-9
Ouis, D. (2001). Annoyance from road traffic noise: a review. J. Environ. Psychol. 21, 101–120. doi: 10.1006/jevp.2000.0187
Oyedepo, O. S., and Saadu, A. A. (2009). A comparative study of noise pollution levels in some selected areas in Ilorin Metropolis Nigeria. Environ. Monit. Assess. 158, 155. doi: 10.1007/s10661-008-0570-5
Senthil, G., and Murugappan, A. (2013). Computer science and engineering and technology analysis of urban transport noise level – a case study of Chidambaram Town Tamilnadu. J. Environ. Sci. 2, 1185–1195.
Singh, B. B., and Jain, V. K. (1995). A comparative study of noise levels in some residential, industrial and commercial areas of Delhi. Environ. Monit. Assess. 35, 1–11. doi: 10.1007/BF02396406
Sonaviya, D. R., and Tandel, B. N. (2019). 2-D noise maps for tier-2 city urban Indian roads. Noise Map. 6, 1–7. doi: 10.1515/noise-2019-0001
Suárez, E., and Barros, J. L. (2014). Traffic noise mapping of the city of Santiago de Chile. Sci. Total Environ. 466–467, 539–546. doi: 10.1016/j.scitotenv.2013.07.013
Tripathi, B., Pathak, V., and Upadhyay, A. R. (2006). A case study of noise pollution in the city of Varanasi. Indian J. Environ. Prot. 26, 737–741.
Tsai, K.-T., Lin, M.-D., and Chen, Y.-H. (2009). Noise mapping in urban environments: a Taiwan study. Appl. Acoustics 70, 964–972. doi: 10.1016/j.apacoust.2008.11.001
Tyagi, V., Kumar, K., and Jain, V. K. (2006). A study of the spectral characteristics of traffic noise attenuation by vegetation belts in Delhi. Appl. Acoustics 67, 926–935. doi: 10.1016/j.apacoust.2005.09.002
Wang, B., and Kang, J. (2011). Effects of urban morphology on the traffic noise distribution through noise mapping: a comparative study between UK and China. Appl. Acoustics 72, 556–568. doi: 10.1016/j.apacoust.2011.01.011
Yang, W., He, J., He, C., and Cai, M. (2020). Evaluation of urban traffic noise pollution based on noise maps. Transp. Res. D Transp. Environ. 87, 102516. doi: 10.1016/j.trd.2020.102516
Zannin, P., and Ferraz, F. (2016). Assessment of indoor and outdoor noise pollution at a university hospital based on acoustic measurements and noise mapping. Open J. Acoust. 6, 71–85. doi: 10.4236/oja.2016.64006
Keywords: noise monitoring, sound level meter (SLM), urban area, road traffic noise, 2D noise mapping
Citation: Alam P, Mazhar MA, Ahmad K, Aslam Z, Afsar SS and Husain A (2022) Comparative assessment of road traffic noise through 2D noise mapping: A case study of an urban area. Front. Sustain. 3:1069445. doi: 10.3389/frsus.2022.1069445
Received: 13 October 2022; Accepted: 10 November 2022;
Published: 02 December 2022.
Edited by:
Afzal Husain Khan, Jazan University, Saudi ArabiaReviewed by:
Shah Saud Alam, University of Kansas, United StatesDušan Katunský, Technical University of Košice, Slovakia
Copyright © 2022 Alam, Mazhar, Ahmad, Aslam, Afsar and Husain. This is an open-access article distributed under the terms of the Creative Commons Attribution License (CC BY). The use, distribution or reproduction in other forums is permitted, provided the original author(s) and the copyright owner(s) are credited and that the original publication in this journal is cited, in accordance with accepted academic practice. No use, distribution or reproduction is permitted which does not comply with these terms.
*Correspondence: Pervez Alam, cGVydmV6am1pQGdtYWlsLmNvbQ==; Mohd. Aamir Mazhar, ZXIuYWFtaXJtYXpoYXJAZ21haWwuY29t