 Shreya Rangarajan
 Rebecca R. Hernandez
 Sarah M. Jordaan
- 1School of Advanced International Studies, Johns Hopkins University, Washington, DC, United States
- 2Department of Land, Air and Water Resources, University of California, Davis, Davis, CA, United States
- 3Wild Energy Center, University of California, Davis, Davis, CA, United States
- 4Environmental Health and Engineering, Johns Hopkins University, Baltimore, MD, United States
- 5Department of Civil Engineering, McGill University, Montreal, QC, Canada
Endpoint impacts related to the transformation of land—including that related to energy infrastructure—have yet to be fully quantified and understood in life cycle assessment (LCA). Concentrated solar power (CSP) which generates electricity by using mirrors to concentrate incoming shortwave radiation onto a receiver, may serve as an alternate source of reliable baseload power in the coming years. As of 2019 (baseline year of the study), the United States (U.S.) had 1.7 GW of installed capacity across a total of eight CSP sites. In this study, we (1) develop an empirical, spatially explicit methodology to categorize physical elements embodied in energy infrastructure using a LCA approach and manual image annotation, (2) use this categorization scheme to quantify land- and ecosystem service-related endpoint impacts, notably potential losses in soil carbon, owing to energy infrastructure development and as a function of electricity generated (i.e., megawatt-hour, MWh); and (3) validate and apply this method to CSP power plants within the U.S. In the Western U.S., CSP projects are sited in Arizona, California, and Nevada. Project infrastructure can be disaggregated into the following physical elements: mirrors (“heliostats”), generators, internal roads, external roads, substations, and water bodies. Of these elements, results reveal that mirrors are the most land intensive element of CSP infrastructure (>90%). Median land transformation and capacity-based land-use efficiency are 0.4 (range of 0.3–6.8) m2/MWh and 40 (range of 11–48) W/m2, respectively. Soil grading and other site preparation disturbances may result in the release of both organic and inorganic carbon—the latter representing the majority stocks in deeper caliche layers—thus leading to potentially significant losses of stored carbon. We estimate three scenarios of soil carbon loss into the atmosphere across 30 years, based on land transformation in m2 per megawatt-hour (m2/MWh) and carbon stock in kilograms of carbon per megawatt-hour (kg C/MWh). Results reveal that potential belowground CO2 released may range from 7 to 137% of total life cycle CO2 emissions. While this study takes a simplistic approach to estimating loss of carbon, the broad methodology provides a valuable baseline for improving comparative analyses of land-related endpoint impacts across energy technologies and other product systems.
Introduction
The electric power sector in the United States (U.S.) is undergoing a rapid transformation, with increasing integration of intermittent renewable resources like solar and wind energy into the grid. This growth in renewables has been possible because of technological advancements, supportive policies, and large declines in cost (Jordaan et al., 2022). Renewable resources offer clear climate and health benefits but have raised concerns regarding their scalability because of their variability (Bird et al., 2013; Ela et al., 2013). These benefits are often cited as a reason for continued generation of electricity from fossil fuels, which are seen to be more dispatchable and reliable. Solar thermal or concentrated solar power (CSP) generation, which generates electricity by using mirrors to concentrate incoming shortwave radiation onto a receiver, may prove to be an alternate source of reliable baseload power, especially when combined with thermal energy storage (TES) (Sioshansi and Denholm, 2010). A study by NREL that modeled grid conditions in California under varying levels of solar integration showed that deploying CSP with TES can push solar generation into periods of high net demand, thus reducing the amount of solar capacity that needs to be curtailed and providing faster ramping capability (Jorgenson et al., 2014). One additional CSP plant on the grid with 6 h of TES and capacity to provide just about 1% of additional solar generation, will reduce marginal annual curtailment of solar resources to 10% (Denholm et al., 2016). If more PV resources are added instead of CSP, the curtailment would be significantly higher in the absence of mitigation.
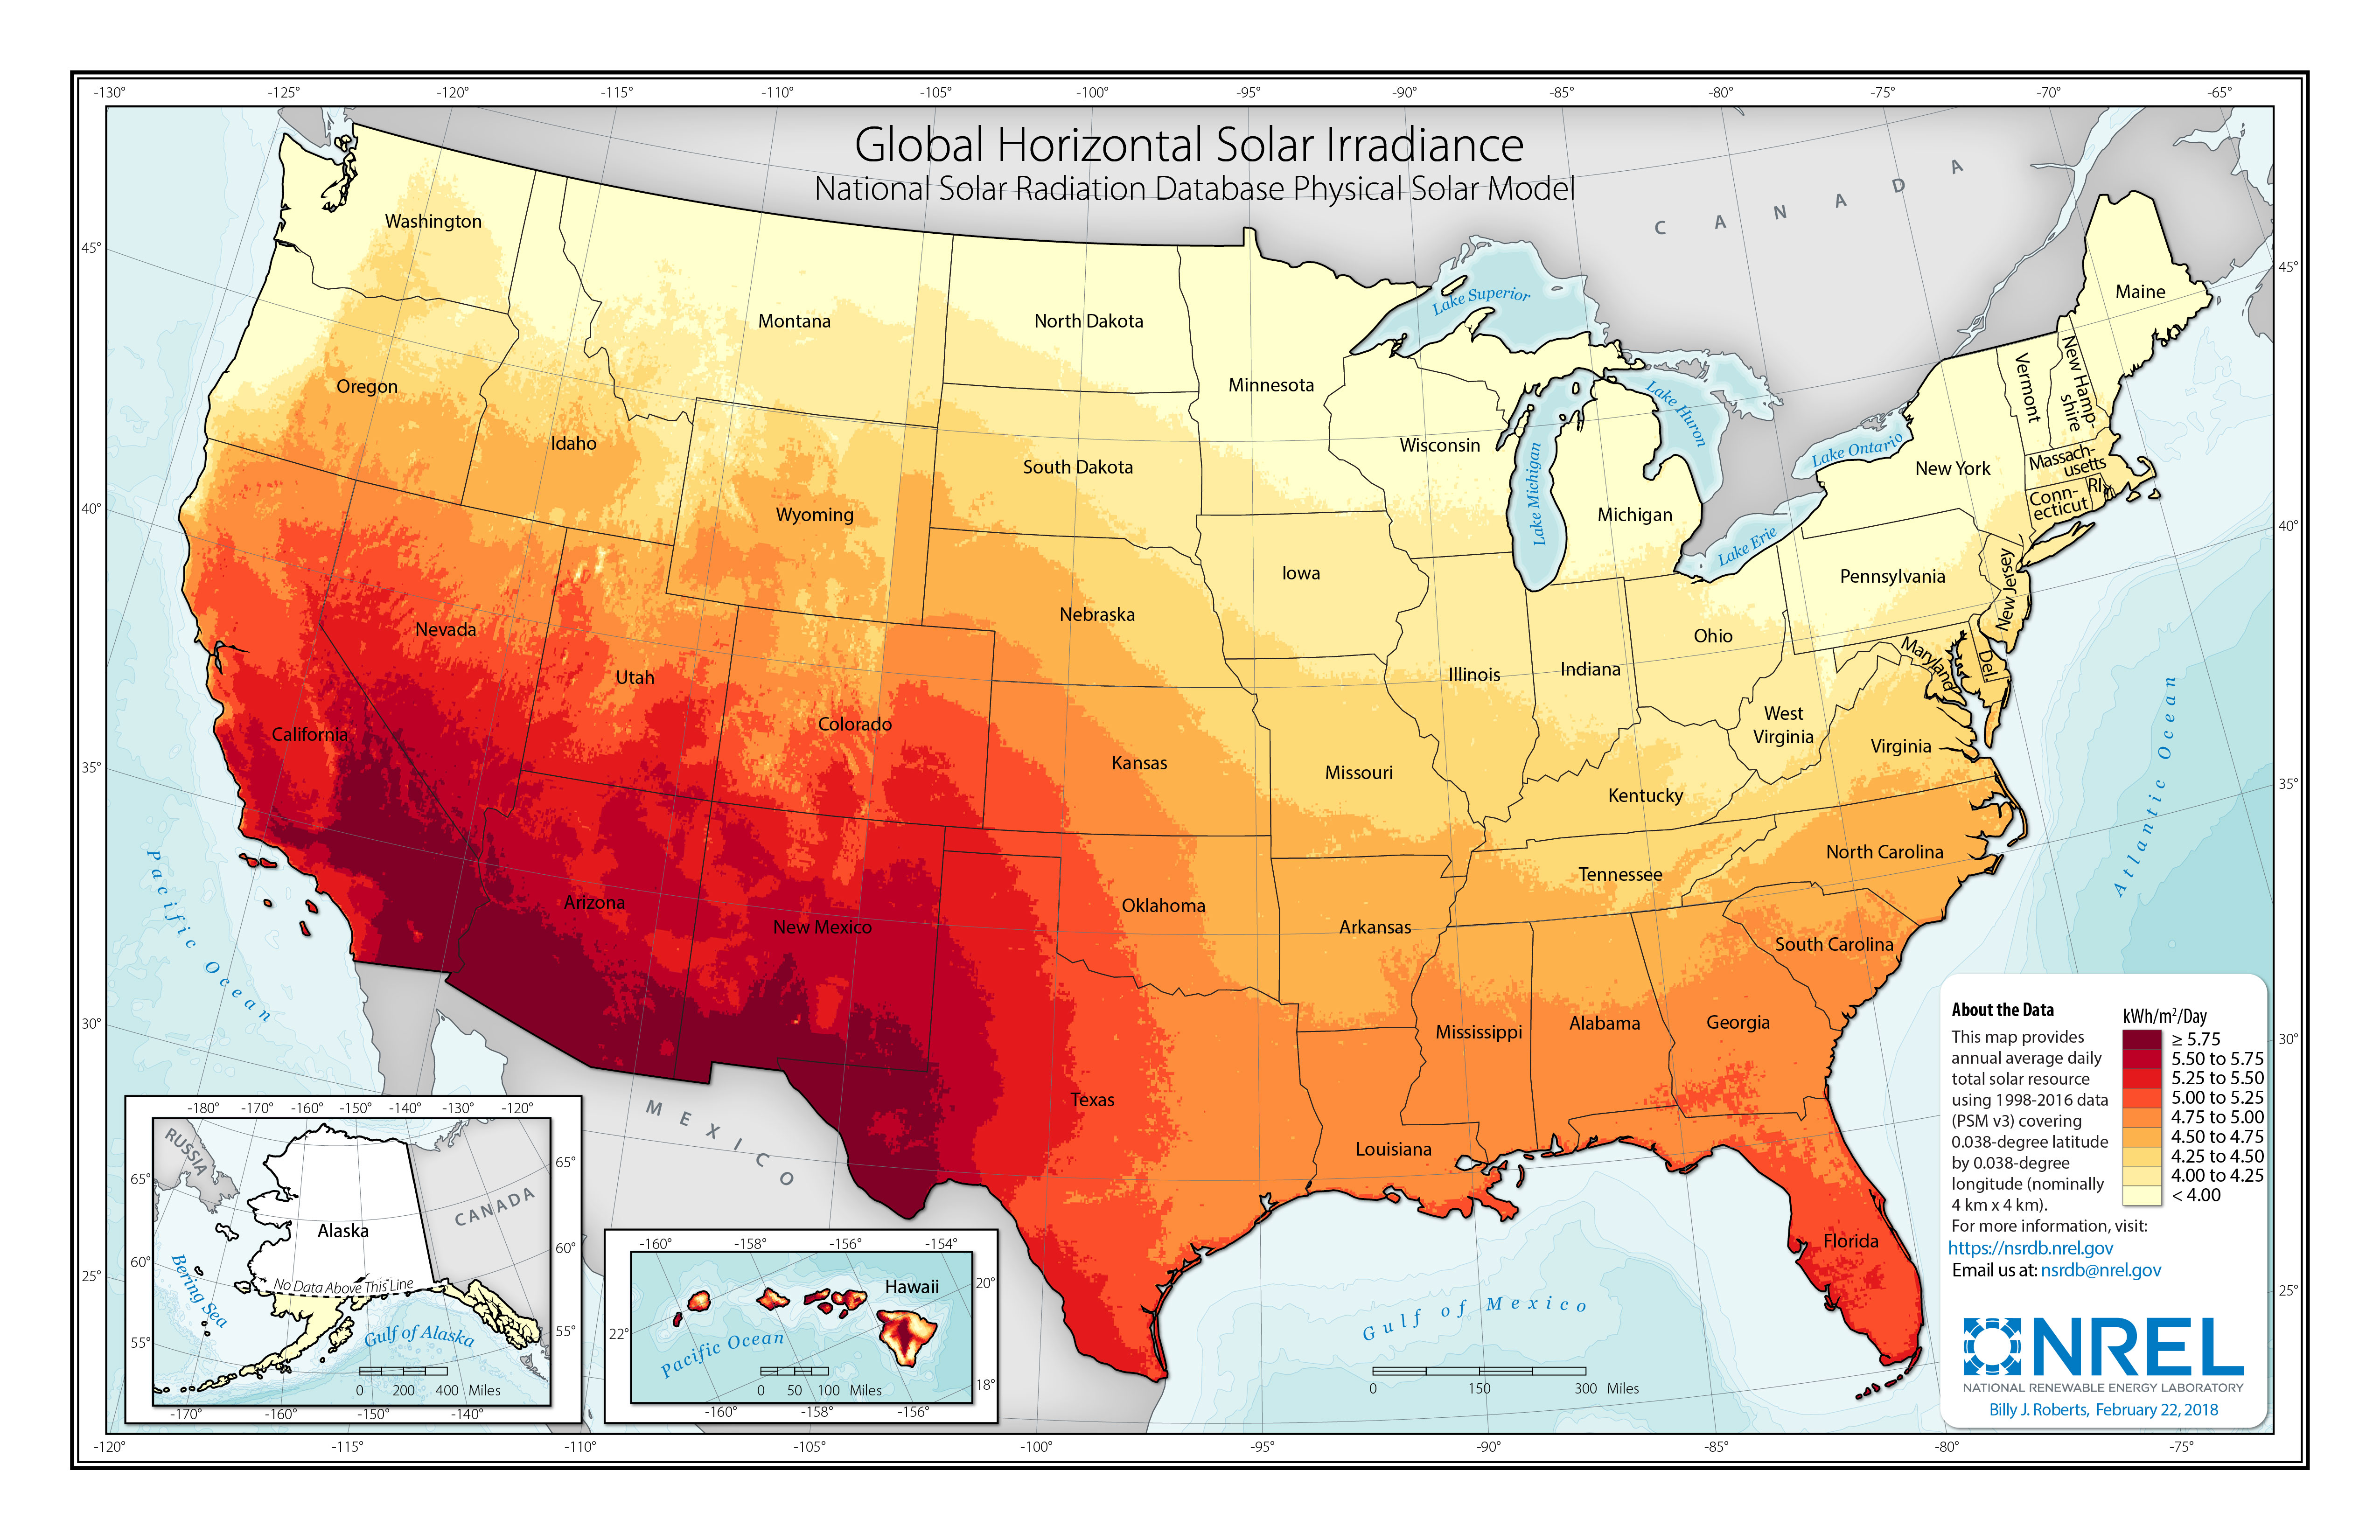
Globally, there are about 6.5 GW of operating CSP plants, with 2.4 GW concentrated in Spain (International Energy Agency, 2021). However, the majority of new CSP capacity since 2015 has been built in Morocco, Chile, and China. The Middle East and North Africa (MENA) region is also expected to be at the forefront of future CSP deployment (World Bank, 2021). As of 2019, the U.S. had around 1.7 GW of installed CSP capacity (United States Energy Information Administration, 2020a; second highest in the world after Spain), out of which around only 400 MW across two installations also had thermal storage capacities (United States Energy Information Administration, 2020b). All CSP capacity is concentrated in the Western U.S. — across California, Nevada, and Arizona—due to the region's higher solar potential (Roberts, 2018) and economic viability (i.e., places where direct normal irradiance is >5 kWh/m2/day; Lopez et al., 2012).
The CSP technology types deployed in the U.S. are parabolic trough and power tower. The U.S. includes six operating CSP plants, four parabolic trough, and two power tower systems (Table 1). CSP plants with parabolic troughs include several hundred curved mirrors (“troughs”), placed in parallel rows to concentrate the sun's heat onto a receiver tube. The tube contains a high temperature heat transfer fluid, which absorbs the sun's energy, reaches temperatures around 750°F, passes through a heat exchanger to heat water and produce steam, which in turn, drives a conventional turbine to generate electricity. A power tower configuration, on the other hand, utilizes a central receiver system, located at the top of a high tower and automated, moving mirrors (“heliostats”) track the sun and focus its energy up to the tower. This focused energy is then used to heat a transfer fluid, which reaches temperatures around 1,000°F to turn a conventional turbine. The higher operational temperatures reached in the power tower configuration allow for greater efficiencies than other CSP technologies.
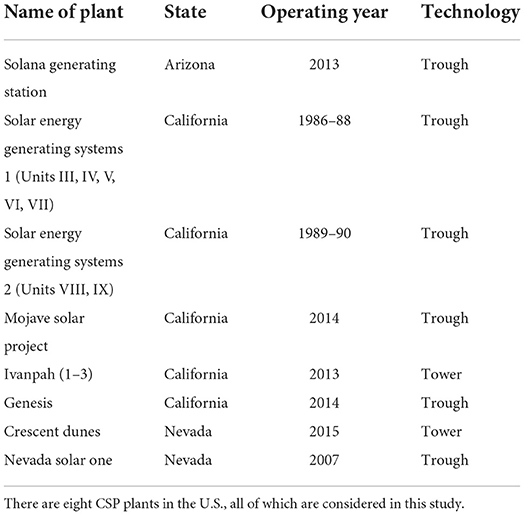
Table 1. Concentrated Solar Power (CSP) plants in the United States (U.S.).
While CSP does provide a low-carbon alternative to fossil-fueled electricity generation, the development of these power plants can cause negative impacts via site preparation (e.g., bulldozing, soil grading), which consequentially, can affect or even remove the supply of ecosystem services (ES) and biodiversity within a site (Grodsky and Hernandez, 2020; Grodsky et al., 2021). Such outcomes conflict with the UN Sustainable Development Goals (SDGs), particularly SDG 15, which seeks to promote the sustainable use of terrestrial ecosystems and prevent biodiversity loss (United Nations, 2015; Hernandez et al., 2020). For example, recent studies have revealed that global bee diversity is greatest in arid lands in the eastern and western hemispheres, and especially in North American hot deserts (Mojave, Sonoran, and Chihuahuan) (Michener, 2007; Minckley and Radke, 2021).
Ecosystem services are the benefits that natural systems provide that support human health and well-being (Costanza et al., 2014), such as carbon sequestration and nutrient recycling. When demand for these services exceeds supply by virtue of disturbances, land-use and land-cover change, or other modifications to natural capital, the demand can pose risks for human well-being and hence, it is necessary to assess these impacts. Life cycle assessment (LCA) is recognized as a standard approach for quantifying environmental impacts of various products and processes from materials extraction to waste disposal, or from cradle to grave (ISO, 2006). Conventional LCA has four main steps, starting with the goal and scope definition, followed by the inventory analysis, impact assessment, and interpretation. In LCA, impacts are understood either at the “midpoint” or the “endpoint” stages, and the latter are relatively less understood and studied (Figure 1). While midpoint impacts focus on singular environmental issues, endpoint impacts are represented as aggregated indices that combine individual metrics, such as in the case of human health (e.g., respiratory diseases and other health impacts), natural environment (e.g., impacts to ecosystems), and the depletion of natural resources (e.g., reduced stocks of fossil fuels and other resources). In this analysis, we focus on land transformation and the associated carbon implications, which represents the conversion of land from one type to another for the purposes of generating electricity using CSP. Our results are presented on the basis of the functional unit of a megawatt hour (MWh), considering the operational lifetime of CSP power plants. Our approach and findings provide an important benchmark for calculating mid-point indicators related to land and relating them to endpoint impacts, in this case, an important ecosystem service (i.e., soil carbon loss).
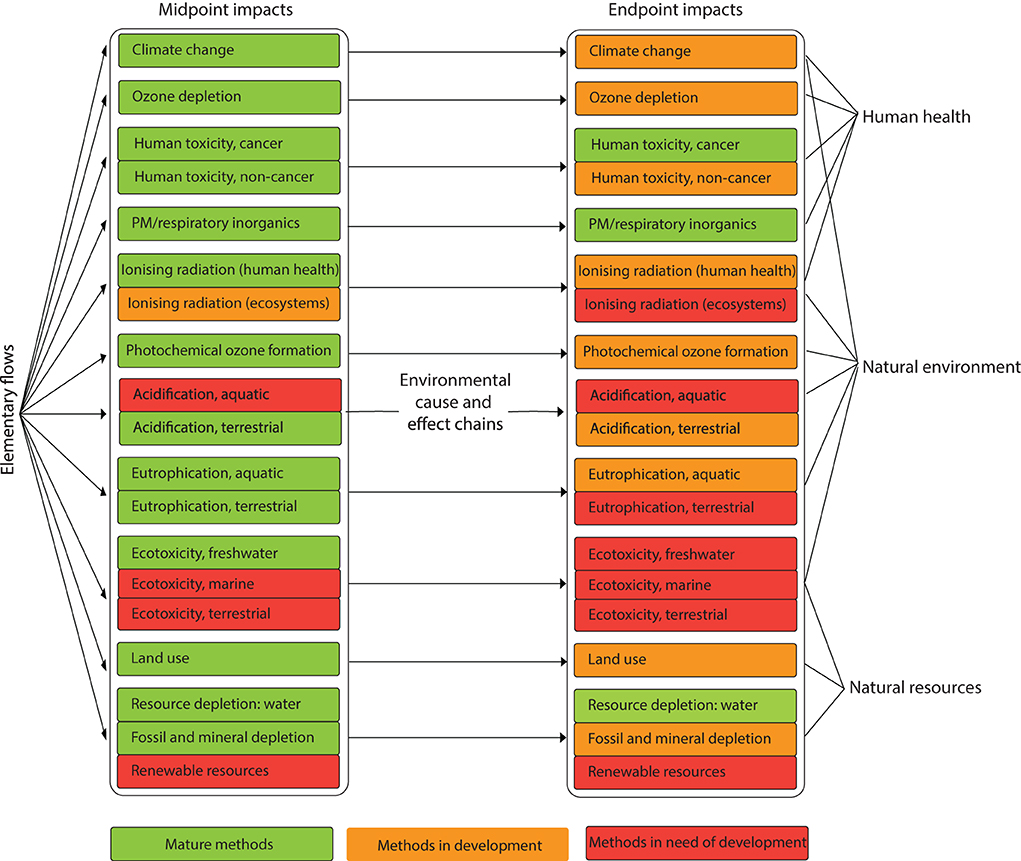
Figure 1. Impact categories in LCA (Jordaan, 2021). Within prior LCA literature, methods to quantify midpoint impacts are more developed than those that quantify the aggregated indices captured by endpoint indices.
Past LCA studies centered on CSP technologies have primarily focused on estimating greenhouse gas (GHG) emissions released across life cycle stages, from materials extraction through waste disposal (Norton et al., 1998; Weinrebe et al., 1998; Lechón et al., 2008; Viebahn et al., 2008; Burkhardt et al., 2011, 2012). In a systematic review, Burkhardt et al. (2012) found that life cycle GHG emissions from CSP generation ranges from 10 to 80 g CO2e/kWh without storage, and 20–34 g CO2e/kWh with storage. While life cycle emissions are generally well-characterized, we have yet to find a study that robustly quantifies emissions associated with land-use change for CSP from a life cycle perspective.
Relevant research has quantified the land-use efficiency (capacity deployed per square meter, W/m2) and lifetime land transformation (quantified in m2/MWh), the latter being a metric more commonly employed in LCA that considers all operating years of the plant. On a nameplate capacity basis, Hernandez et al. (2014) estimate land-use efficiency of CSP plants in California to be 33.9 W/m2 ±7.9 (95% CI; Hernandez et al., 2014). On a generation basis, Fthenakis and Kim (2009) estimate that life cycle land transformation for parabolic trough CSP plants with no storage is 0.366 m2/MWh and 0.552 m2/MWh for solar tower CSP plants over a 30-year plant lifetime, while Klein and Rubin (2013) estimate land transformation associated with CSP plants with energy storage to range from 0.230 to 0.270 m2/MWh. Lovering et al. (2022) conducted a study of 10 CSP power plants across two countries and found median annual land transformation for CSP is 1,300 ha/TWh/y. To our knowledge, no prior study has adopted a comprehensive life cycle approach, including quantifying land-energy relationships and impacts on belowground carbon losses, associated with CSP power plants.
CSP plants are typically sited in desert ecosystems and/or biomes. Deserts are places receiving < 250 mm of precipitation and are major carbon sinks representing 35.5% of the global carbon stock (Eswaran et al., 2000). Carbon uptake by desert soils is estimated to be 0.37–0.68 Pg C/yr (Evans et al., 2014). Notably, carbon in desert ecosystems is present as two types: organic carbon and inorganic carbon, the later made up of two sub pools (Titus et al., 2002; Schlesinger et al., 2009). The first sub pool is derived from parent rock material (i.e., lithogenic) while the second sub pool is biogenic, derived from the formation via precipitation of carbon from biogenic sources and coupled with biological activity in the rhizosphere (Cerling, 1984; Schlesinger, 1985; Martin et al., 2021). Warm deserts, the ecosystem type of deserts in the Western US where CSP power plants are also sited, are estimated to contain ~200 billion metric tons of organic carbon and 800–1,700 billion metric tons of inorganic carbon (Thomey et al., 2014). Organic carbon predominantly exists in the relatively shallow soil layers (~0.3 to 1 meter deep), while inorganic carbon is typically found in deeper layers below one meter in depth (Fierer et al., 2003; Rumpel et al., 2012). This inorganic carbon is found as caliche (a form of calcium carbonate) and recent studies suggest it is more dynamic than previously thought, increasing rapidly with hydrological inputs and high partial pressure of soil CO2 (pCO2) values generated by the respiration of desert plant roots (Magaritz and Amiel, 1981; Gao et al., 2017). Overall, losses of vegetation and subsequently organic and inorganic carbon from deserts can potentially decrease some of the value in avoided GHG emissions that CSP confers (when substituted for fossil fuels), by releasing stored soil carbon into the atmosphere and potentially reducing the ability of deserts to sequester carbon in the future (Allen et al., 2013).
The goal of our research is to develop a systematic, replicable life cycle approach to quantifying land-use changes and soil carbon losses, the latter representing an important ecosystem service. Importantly, we quantify land transformation (on a generation basis) due to its relevance to LCA but we also quantify the land-use efficiency (power density, on a capacity basis) to ensure broad relevance to those interested in land-energy interactions. Our objectives were to: (1) develop an empirical, spatially explicit methodology to categorize physical elements embodied in energy infrastructure using a LCA approach; (2) use this categorization scheme to quantify land- and ecosystem service-related (i.e., losses in soil carbon) endpoint impacts, owing to energy infrastructure development and as a function of electricity generated (i.e., megawatt-hour, MWh); and (3) validate and apply this method to CSP power plants within the U.S. Together, our objectives confer the unique opportunity to determine how land-use and land-cover change (LULCC) attributed CO2 emissions may augment total non-LULCC life cycle emissions. The U.S. is a model system for testing and applying this methodology because CSP power plants in the US are all sited in desert ecosystems (predominantly in the Mojave and Sonoran deserts). These deserts harbor remarkable geobiological diversity (Pietrasiak et al., 2014) and are integral soil carbon sinks but are also increasingly under the threat of climate change (Bai et al., 2014; Persico et al., 2022). Anticipating adverse impacts to desert soil carbon owing to ground-mounted solar energy development may help guide siting decisions emphasizing emission reductions associated with land-use and land-cover change (DeMarco et al., 2014; Hoffacker and Hernandez, 2020).
Our approach to quantifying land- and ecosystem service-related impacts (i.e., scenarios of soil CO2) of energy infrastructure is broadly applicable to all electricity generation technologies and across different types of biomes that may contain unique levels of organic and inorganic soil carbon. Additionally, while this study seeks to improve upon estimation of land transformation and its potential impacts on soil carbon losses, we recognize that there might be upstream / indirect land transformation life cycle metrics that future studies can seek to incorporate.
Methodology
By quantifying the impacts of land transformation on an important ecosystem service (soil carbon losses), we seek to improve the methodology for land-related endpoint impacts of concentrated solar power generation. This entails development of key land-related metrics that include estimates of potential impacts of LULCC on loss of soil carbon.
As we focus primarily on improving the impact assessment stage of LCA, our scope comprises site-level construction, operation, through decommissioning for each of the plants in our analysis (Figure 2). The functional unit of this study is one MWh of electricity generated. We contribute a novel approach that encompasses manual spatial annotation of the facilities and site areas for the eight CSP sites in the U.S. using a geographic information system (GIS). We then calculate the land area for each site and use these results to estimate the land and carbon loss effects using a life cycle approach. Upstream processes, such as extraction and manufacturing, as well as the end-of-use process of disposal are not included within the systems boundary to emphasize our contribution to life cycle impact assessment of estimating land transformation and soil carbon losses from CSP infrastructure. We also report in this study the land-use efficiency of CSP due to its relevance for those more broadly interested in land-energy interactions. For example, Cagle et al. (2021) identified two key metrics for describing land-solar energy relationships: land transformation and land-use efficiency (or capacity-based power density).
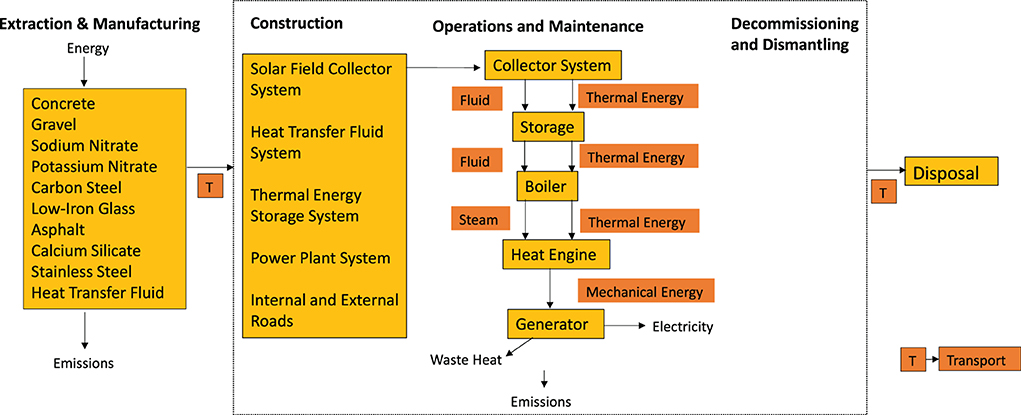
Figure 2. Process flow with system boundary. Our analysis contributes an improved understanding of land-related impacts owing to the construction-to-decommissioning life cycle of CSP power plants, including soil carbon loss. Upstream processes are not included to emphasize the estimation of direct land transformation but can be factored into future studies.
Each of the eight CSP sites in the U.S. were considered in this study. Out of these eight sites, six are parabolic-trough and two are power tower. All sites are sited within three Western US states: Arizona, California, and Nevada (Figure 3).
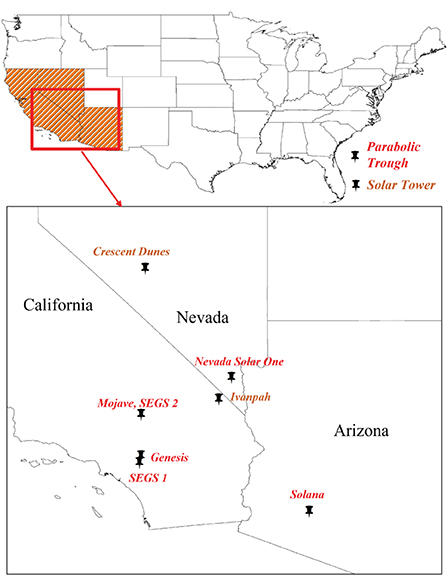
Figure 3. Location of CSP sites. There are eight concentrating solar power sites in the United States, in the states of California, Nevada, and Arizona. Two are power tower (brown) and six are parabolic trough (red).
Prior to manual spatial annotation, we identified seven distinct elements of CSP infrastructure (Table 2): mirrors/heliostats, generators, internal roads, external roads, substations, water bodies and overall project site area using a method of manual image annotation of aerial imagery (Table 2 and Appendix A). Specifically, the land area occupied by each of these elements, for each CSP site, was estimated in square meters (m2) using high resolution aerial imagery from the National Agriculture Imagery Program (NAIP, < or equal to 1-meter ground sample distance resolution) (Earth Resources Observation Science Center, 2018). Estimation was based on user-based annotation of the NAIP images using ArcMap 10.7.1. Image annotations were created by delineating each of the different infrastructural elements (Figure 4).
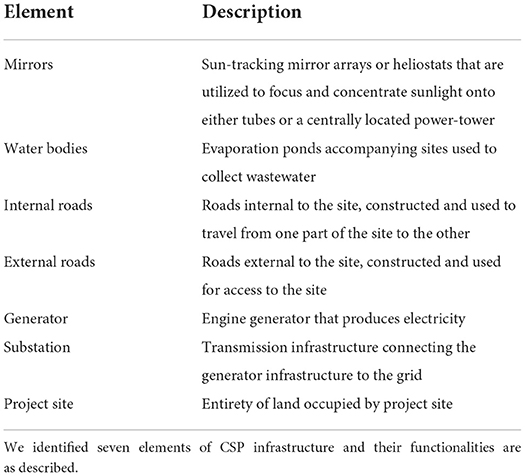
Table 2. Elements of Concentrating Solar Power (CSP) infrastructure.
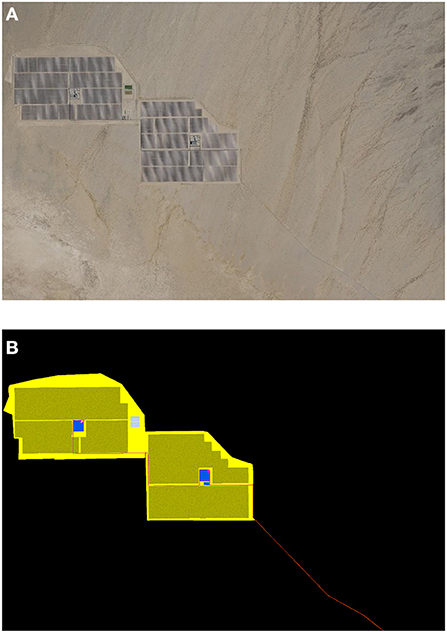
Figure 4. Image annotation—before and after of Genesis Solar. (A) Aerial imagery of Genesis Solar from the National Agriculture Imagery Program. (B) Manual annotation of image performed in to identify and estimate land area occupied by different elements of concentrating solar power (CSP) infrastructure (ArcMap, ArcGIS Desktop 10.8.1). Image annotation legend—Olivenite Green—Mirrors; Light Blue—Water bodies; Ginger Pink—Internal Roads; Red—External Roads; Lapis Lazuli—Generator; and Solar Yellow—Genesis Solar CSP Project Site as a whole.
We used data from these measurements to quantify the land-use efficiency, land transformation, and three scenarios of soil carbon loss.
Land transformation (generation-based metric)
We calculated annual generation as a 3-year average of real-world net generation of CSP power plants in 2017, 2018, and 2019; data were obtained from EIA Form-923. We assumed a 30-year power plant lifetime and therefore multiplied the 3-year average of real-world, observed generation by 30 to obtain the lifetime generation for each plant.
Land-use efficiency/power density (capacity-based metric)
Installed capacity (W) data were also obtained from EIA-Form 860 and used to calculate the land-use efficiency (W/m2), which provides comprehensive annual generator-level information for all power plants in the U.S. In the interest of developing credible land-related metrics for CSP technologies, we report another capacity-based land requirement metric [i.e., the inverse of land-use efficiency or area (m2)/installed capacity (W)] to ensure results are presented for different uses and interpretations.
Loss of soil carbon
We estimate carbon loss by multiplying the carbon stock in the soil (kg C/m2) with the results from lifetime land transformation that we previously calculated (m2/MWh).
Soil carbon scenarios
Carbon in desert ecosystems is neither spatially homogenous nor temporally static. Hence, estimates of soil carbon loss must account for spatiotemporal variation in the presence of organic and inorganic carbon. This study used estimates provided by Evans et al. (2014) for organic C: 0.9–1.1 kg C/m2. A large part of the inorganic carbon in the desert ecosystems in these states, found as caliche, was formed more than 20,000 years ago during the ice ages; however, recent work reveals that these deposits may not be stable, particularly under anthropogenic disturbances (Allen et al., 2013; Gao et al., 2017). Schlesinger (1985) estimates the amount to be 4–8.4 kg C/m2. Across all scenarios, we use an average of the ranges of organic carbon and inorganic carbon stocks to multiply with land transformation numbers to get the (belowground) soil carbon loss.
Organic carbon is predominantly released as CO2 from the soil when vegetated land is first transformed (i.e., biomass is decomposed and then carbon becomes mineralized); however, rates of inorganic carbon loss are less certain but equally important to climate stability (Gao et al., 2017; Martin, 2017). Analysis of the Environmental Impact Reports [EIR] of the CSP sites reported in this study reveal that during site development, land is typically first transformed via soil grading. Specifically, once access to the site has been established (e.g., through road construction), areas within the site facility are staked and signed, and grading occurs over an extensive portion of the site—typically 70% of the entire area of the facility since CSP installations need to be sited on flat areas with slopes of 3% or less (Hernandez et al., 2015). Grading typically commences with rough grading activities, including grubbing, clearing (including removal of vegetation), moisture conditioning, bulk grading, and initial compaction. These first ground-disturbing activities prepare the site for storm water drainage, construction, and equipment foundation pads. The preliminary grading is designed to ensure that run-off from solar fields is directed into an appropriate drainage channel(s). Limiting the amount of the site that must be graded may help in limiting the amount of stored carbon that is released.
An important metric to consider when trying to estimate carbon loss then is the depth of soil disturbed during site development. Our review of the sites' EIRs reveal that the depth of disturbance is different across the seven elements of infrastructure. For example, the depth of soil dug to install and/or construct the generator(s), substation(s), and water bodies is relatively great—up to 2.5 m compared to other elements like mirrors. Given that organic carbon and inorganic carbon typically occupy unique depths of desert soil composition and occur in widely varying quantities, we undertook a scenario-based analysis to estimate soil carbon that could be released when land is transformed to serve as recipient environments for CSP infrastructure (Table 3).
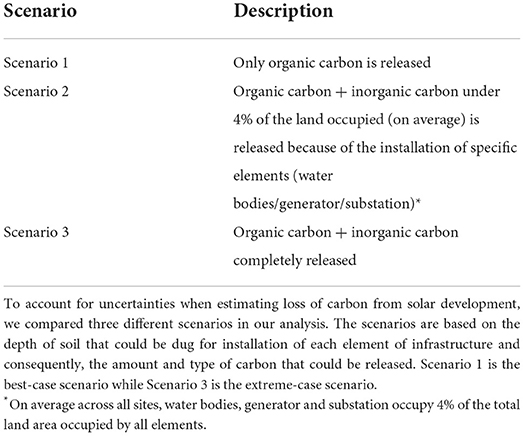
Table 3. Scenario analysis—Desert soil carbon is complex and heterogenous.
We validated our findings by comparing our results to land-related impacts reported in environmental impact reports (Environmental Assessment, 2010; Final Environmental Impact Statement, 2010a,b; Staff Assessment Environmental Impact Assessment, 2010; Final Environmental Assessment, 2011), which have been previously used to estimate land-related impacts in peer-reviewed journal articles (Hernandez et al., 2014).
Results
Estimates of area (km2) of CSP reveal two key findings. First, in absolute area (km2), solar tower-based CSP sites directly impact more total land than parabolic trough-based sites: solar tower sites (Ivanpah and Crescent Dunes) directly impact 11.5 km2 of total land area on average and range from 10.3 to 12.7 km2. By contrast, parabolic trough sites directly impact 4.3 km2 on average, and range from 1.3 to 7.4 km2 (Figure 5A). Second, mirror fields were determined to be the most land intensive element of CSP infrastructure and directly impact a total of 5.8 km2 on average (Figure 5A). Excluding mirrors, water bodies, and generator(s) directly impact the most land-−0.1 km2 each on average, respectively (Figure 5B). Across all sites, Ivanpah infrastructure requires the most land and represents 12.7 km2 of LULCC from desert scrub (in line with prior results from Grodsky and Hernandez, 2020). Nevada Solar One, is the smallest in area, with infrastructure directly impacting ~1.3 km2.
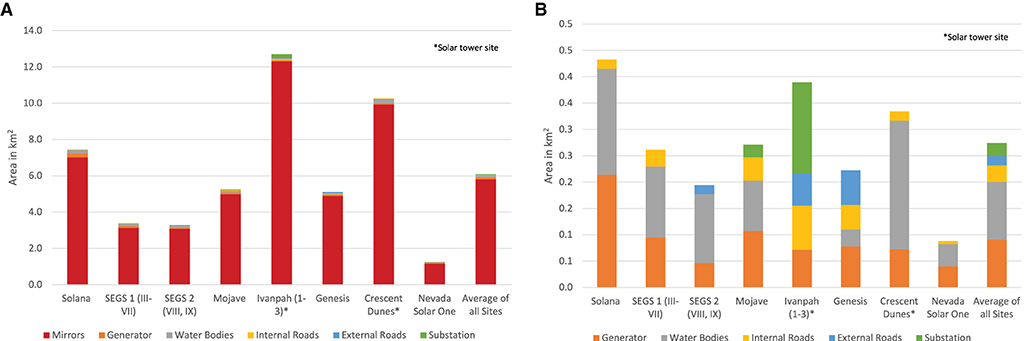
Figure 5. Direct land impacted by Concentrating Solar Power (CSP) infrastructure (in km2). (A) Area occupied by each element of infrastructure for all sites-mirrors directly impact the most land relative to other elements. Average across all sites was 6.1 km2. (B) Area occupied each element of infrastructure, excluding mirrors.
The median and mean land transformation is 0.4 and 1.3 m2/MWh, respectively, with results ranging from 0.3 to 6.8 m2/MWh (Figure 6). Crescent Dunes is an outlier (Figure 6 and Supporting Information) because net generation from the site has been underperforming across 2017–19 due to technical issues (Deign, 2020). Similar to land area occupied, water bodies and generator had the highest land transformation, next to mirrors (Appendix B).
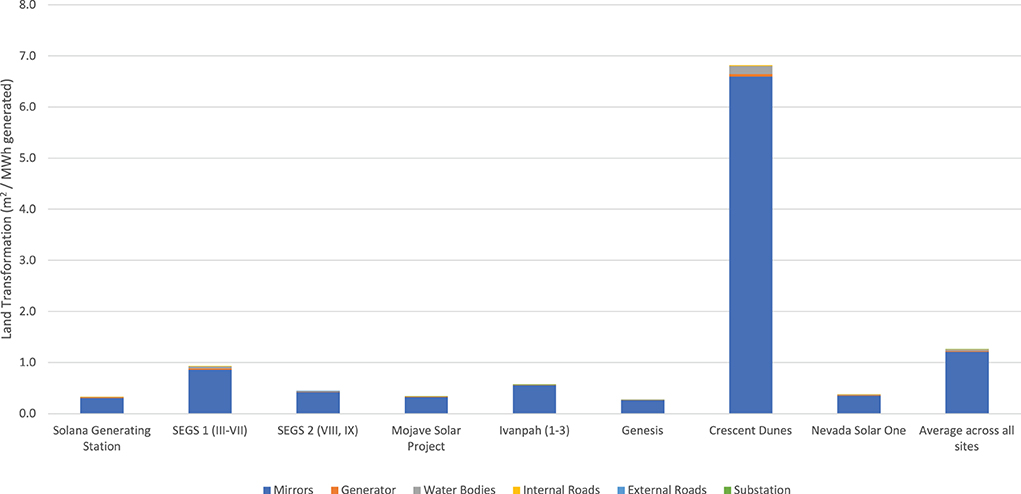
Figure 6. Land transformation of Concentrating Solar Power (CSP) infrastructure (m2/MWh generated). We calculated land transformation as area occupied over life cycle net generation for each CSP site and infrastructure element. Life cycle generation was calculated as average net generation from 2017 to 19 for 30 years. Average across all CSP sites is 1.3 m2/MWh.
Results for land-use efficiency (or “power density” based on capacity) ranged from 11.4 to 47.9 W/m2, with the Nevada Solar One site being the most efficient and Crescent Dunes being the least efficient (Figure 7). Median and mean land-use efficiency was found to be 37.0 and 35.5 W/m2, respectively.
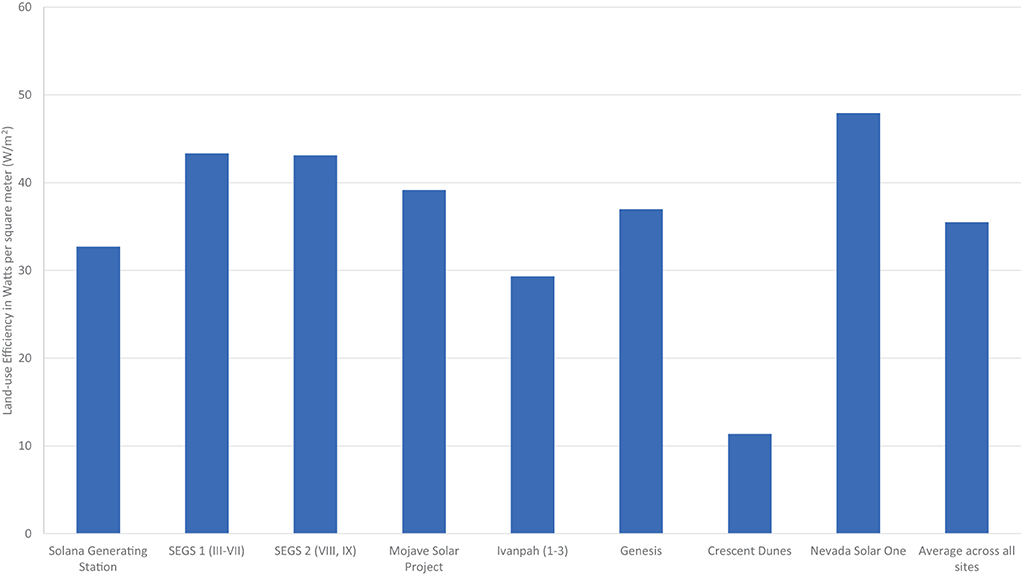
Figure 7. Land-use efficiency of Concentrating Solar Power (CSP) infrastructure (in Watts per square meter, W/m2). We calculated land-use efficiency as nameplate capacity over area occupied by infrastructure element across each CSP site. Average across all sites is 35.5 W/m2.
Results for the land area required to produce 1 W of energy from CSP plants ranged from 17 to 82 m2/W (Figure 8A). Crescent Dunes was an outlier. While its absolute land requirements are relatively larger to begin with by virtue of being a solar tower site, this metric is 2–3 times larger than other sites because of its relatively lower nameplate capacity of 125 MW. However, when land area for mirrors is removed from the equation (Figure 8B), the differences in land requirements for Crescent Dunes in relation to other sites become lower.
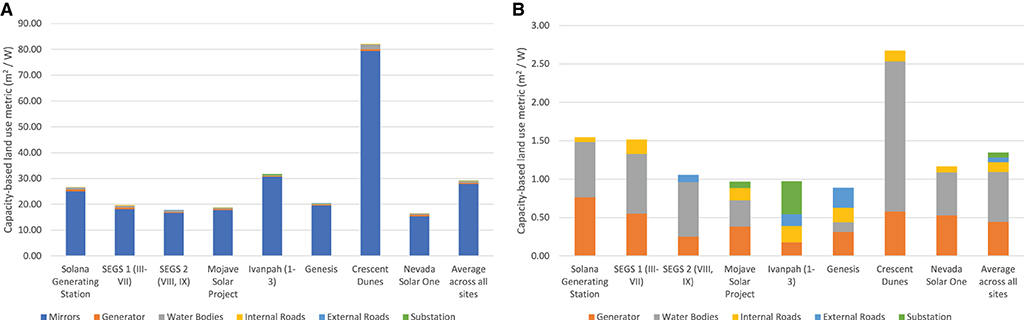
Figure 8. Land Area required to produce 1 W of energy (in m2/W). (A) Land requirements for each element of infrastructure across all sites. Unsurprisingly, mirrors require a lot of land. Average across all sites was 29 m2/W. (B) Excluding mirrors, water bodies (evaporation ponds to collect wastewater) and generator require the most land.
To validate our findings, we compare the reported total acreage from each site's EIR with our estimates (Table 4). In EIRs, total acreage represents the total land footprint that the developers estimate will be required for construction and operation of the plant and associated infrastructure, which includes all the elements of CSP infrastructure identified in this study and hence is in line with the systems boundary. The results we obtained for land area are under < 1% error, assuming the expected value for the five projects is the acreage publicly available in EIRs.
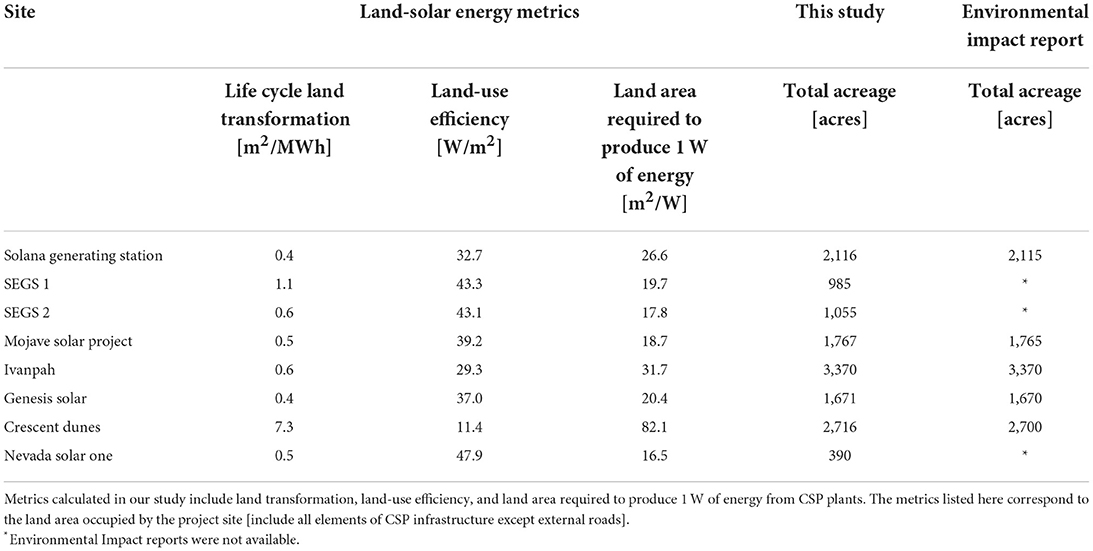
Table 4. Land-solar energy metrics calculated in our study, including total acreage that we compare with total acreage reported in Environmental Impact Reports (EIRs) to validate our results.
Our scenario analysis of the impacts of carbon loss on total life cycle CO2 emissions exemplifies the importance of potential soil carbon releases in desert ecosystems (summarized in Figure 9). In Scenario 1, the assumption is that only the first meter of soil is disturbed during site development such that only organic carbon gets released. The average carbon loss in this scenario from all infrastructure components combined is 0.81 kg C/MWh, with results ranging from 0.27 to 3.56 kg C/MWh.
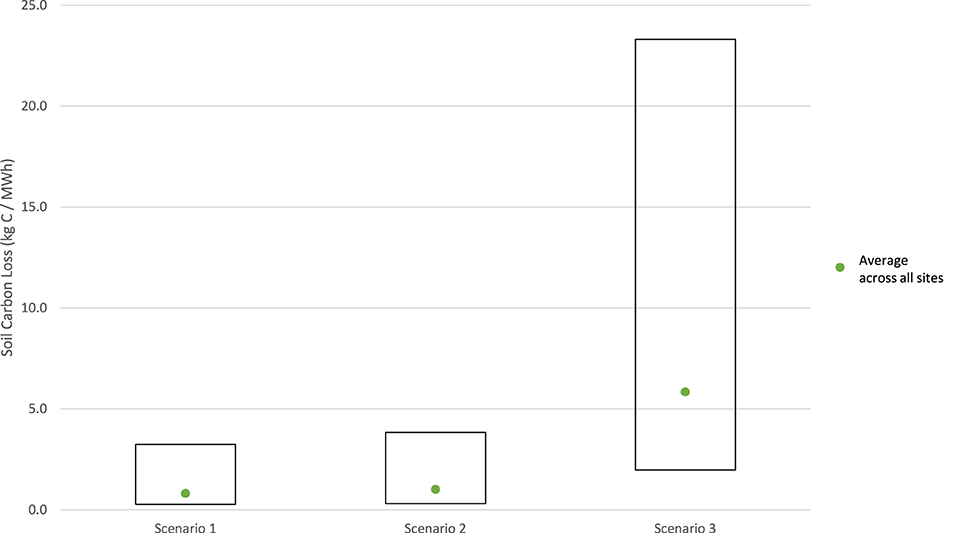
Figure 9. Scenario analysis results for soil carbon loss owing to CSP sites. Soil carbon is complex and heterogenous in deserts. Thus, we undertook a scenario analysis to estimate soil carbon loss based on estimates of organic (Evans et al., 2014) and inorganic carbon stock (Schlesinger, 1985) and land transformation numbers for each infrastructure across all sites. The scenario analysis was developed based on assumptions about the depth of soil disturbed during site development, which can vary within an individual site based on the infrastructure element installed. Scenario 1 accounts for loss of only organic carbon and assumes that only surficial soil layers are disturbed. Scenario 2 accounts for loss of organic carbon and inorganic carbon from 4% of occupied land area, assuming that greater depths of soil are disturbed for installation of evaporation ponds/generator/substation. Scenario 3 is the extreme case scenario that assumes loss of all soil carbon, i.e., all organic carbon and all inorganic carbon.
In Scenario 2, the assumption is that apart from all the organic carbon getting released, some inorganic carbon also gets released. This assumption is based on input from project Environmental Impact Assessments that reveal that for development of some infrastructure like the on-site water bodies (evaporation ponds to collect wastewater), generators and substations, depths below 1 m of the soil (and up to 2.5 m) are disturbed. On average across all sites, these specific elements of infrastructure occupy 4% of total land area. Building on Scenario 2 and using Schlesinger's estimate of soil inorganic carbon and land transformation numbers for all infrastructure, we calculate the potential soil carbon loss. Average carbon loss in this scenario is 1.01 kg C/MWh, with results ranging from 0.24 to 4.2 kg C/MWh.
Carbon stocks and cycles are dynamic, and it is possible for much of the inorganic carbon to also get released despite primary land transformation and soil disturbance being limited to the initial depths. Scenario 3 accounts for this extreme case, where all the carbon stock in the desert soil gets released, with results ranging from 1.97 to 25.65 kg C/MWh. Since inorganic carbon makes up a bigger portion of the desert soil carbon, the average carbon loss in this scenario is significantly higher when compared to other scenarios (5.85 kg C/MWh).
To estimate the land-based life cycle CO2 emissions and make these data comparable to life cycle emissions from CSP power generation reported in the published literature (non-land-use based studies), we multiply the results from soil carbon loss across the three scenarios by a factor of 3.67—the ratio of the atomic mass of carbon (12 atomic mass units [AMU]) to carbon dioxide (44 AMU).
Overall, results across the three scenarios reveal that the amount of CO2 released could be 7–137% of non-land-based life cycle CO2 emissions, on average (Figure 10). This range represents the percentage increase from average non-land-based CO2 emissions to the average (across all scenarios) land-based emissions of the lowest (Nevada Solar One) and highest emitting (Crescent Dunes) CSP plants, respectively. Crescent Dunes remains an outlier for previously described reasons. Excluding this site, the land-based life cycle CO2 emissions from the other sites are relatively moderate. When considering emissions from Scenarios 1 and 2 especially, land-based CO2 emissions associated with CSP development are only a small fraction of those from non-land-based CO2 sources. However, in the larger context of global climate change, it is important that even relatively minor land-based CO2 emissions are reduced. Their effects can be offset by smart siting of these power plants in ecoregions with lower endowments of carbon stock, in previously disturbed lands (e.g., salt-contaminated agricultural lands) where the soil carbon would have already been released and/or with active restoration of native desert plants. To optimize carbon-based outcomes, developers of these sites may seek consultation with desert soil scientists across the lifetime of the power plants, to aid ecosystem recovery and reversibility that reduces the potential for adverse ecological outcomes. For example, for operating CSP power plants, practitioners can assist in the selection of locally native and appropriate plant species that can be established in between the concentric rows of mirrors and with traits that do not pose trade-offs for generation through shading and that enhance the soil's ability to sequester12 carbon (Walston et al., 2018). This is in addition to offering other significant benefits (e.g., habitat for species, maintenance of biodiversity) through techno-ecological synergies (Hernandez et al., 2019) that can improve the overall efficiency of power generation in these sites.
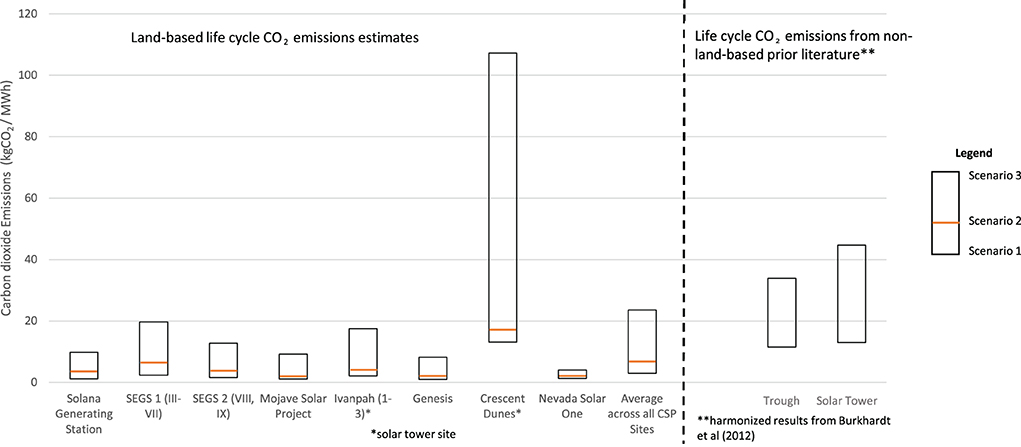
Figure 10. Comparison of estimated land-based life cycle CO2 emissions to non-land-use based life cycle CO2 emissions in published literature. We sought to determine if land-based life cycle CO2 emissions from CSP technologies caused by release of carbon stored in the soil would outweigh the non-land-based CO2 emissions from CSP generation. The latter has been the main focus of published LCA literature while estimations of land-based carbon loss are a novel contribution of this study. Carbon in desert soil is complex and is comprised of both organic and inorganic carbon stocks. These carbon stocks not only occupy different depths in the soil profile but also differ in the quantities of their presence in the soil composition. As a result, there are uncertainties surrounding the amount of carbon that could get released during site disurbance for installation of ground-mounted CSP infrastructure elements. To account for these uncertainties, this study considered three scenarios of carbon release [Scenario 1 assumes release of all organic carbon found in the soil near the surface, Scenario 2 assumes release of all organic carbon along with inorganic carbon released from 4% of land area occupied only because of the installation of some infrastutcuure elements, Scenario 3 assumes release of all organic and inorganic carbon].
Conclusion
The goal of this study is to estimate the impact of LULCC on an important ecosystem service in the construction-to-decommissioning life cycle of CSP generation in the portion of the Western Interconnection located in the U.S. In doing so, the analysis has three key contributions. First, we advance LCA methodology with a systematic approach to quantifying the land transformation and potential carbon loss impacts of the eight operational CSP plants in the U.S. Secondly, results were also leveraged to estimate the land-use efficiency of the plants (i.e., capacity-based power density), providing an important baseline for those more broadly interested in land-energy relationships. Third, using this granular approach to delineation and real-world generation data, we have demonstrated how geographic technologies and LCA, respectively, can be combined to produce the most accurate estimates of land-energy metrics for CSP plants to date, and notably for estimating their land-based CO2 emissions associated with LULCC.
Our results demonstrate that prior studies have underestimated the life cycle land transformation of CSP. Land transformation estimates in this study are on average 32% are higher than those quoted in Fthenakis and Kim (2009). The differences can be attributed to the application of image annotation as a methodology to more accurately the capture area occupied by each of the eight sites in operation in the U.S. and the use of more updated generation numbers in this study. A more recent study by Wu et al. (2021) utilized economic input-output based LCA to estimate the supply chain land transformation. Combined with the site, life cycle land transformation was estimated to be 6.9 m2/MWh from a power tower CSP plant in China, driven upwards by the supply chain impacts. Studies have not yet confirmed the supply chain effects for the case of the U.S. and warrant a thorough examination of much more disaggregate sectors than those examined for the sectoral case in China. Future research should seek to establish whether such supply chain impacts can be confirmed for the case of US CSP plants and more broadly.
Finally, we developed a state-of-the-art methodology to estimate potential carbon loss impacts owing to LULCC. In doing so, we found that land-based CO2 emissions represent a moderate contribution to life cycle emissions, ranging from 7 to 137% of previously reported non-land-based life cycle CO2 emissions. Specifically, CSP emissions attributed to LULCC range from 5 to 25 kg CO2/MWh across the three scenarios. These results underscore the need to comprehensively quantify and measure soil carbon losses associated with different soil treatments, particularly during the construction phase of solar projects. While we note that the land-based CO2 emissions associated with CSP have been overlooked to date, the life cycle emissions, on average, represent only 12 and 5% of natural gas and coal, respectively (United States Energy Information Administration, 2021), pointing to the immense benefits of such projects relative to fossil fuel-based options. Land use-change emissions for coal and natural gas are dwarfed by the combustion of the fossil fuels; for example, land-related emissions have been estimated as < 1% of life cycle emissions associated with combined cycle gas-fired electricity generation (Skone et al., 2014). Regardless, soil carbon losses are impactful to desert ecosystems and their geobiodiversity, highlighting the limitations to present methods of valuing fragile ecosystems.
This study has taken a novel and simple approach to estimating loss of soil carbon. However, it is important to note that carbon cycles in deserts are dynamic across spatiotemporal scales and highly coupled to soil water content, rhizosphere conditions (especially soil pCO2), and other biogeochemical properties. The initial carbon released at the time of land transformation may not be a true representation of emissions bound to occur over the lifetime of the power plant during land occupation. Future research may aim to capture a more accurate description of organic and inorganic soil carbon uptake, sequestration, and losses via in-situ, field-based measurements of soil properties across gradients of site disturbance compared with control sites and across the infrastructural elements described in this study. Nevertheless, this study seeks to broaden the horizon of LCA by estimating impacts of LULCC on one regulating ecosystem service (i.e., soil carbon). This approach can be adopted to study the impacts of LULCC on other ecosystem services as well. Importantly, the methodology illustrated in this study can also be applied to understand the land use impacts of different energy technologies across varied ecosystems with different levels of carbon stock.
The findings of this study can be used by solar developers, regulatory authorities and other stakeholders when making siting decisions. Results could potentially have implications on the future of CSP, as well as on how land is understood and integrated within LCA. Further, between 2015 and 2021, no new CSP plants were installed (United States Department of Energy, 2021). However, as the U.S. looks to transition to a low-carbon economy, CSP may prove itself as an indispensable, baseload resource, and consequently, there will be an increasing need for smart siting decisions that have the least impact on ecosystems and their services, which humans depend on.
Solutions such as increasing the land-use efficiency of each installation—e.g., decreasing spaces between rows of CSP mirrors-and prudent siting decisions that incorporate environmental trade-offs and techno-ecological synergies present critical opportunities to reduce impacts of solar developments (Hernandez et al., 2015).
Data availability statement
The original contributions presented in the study are included in the article/Supplementary materials, further inquiries can be directed to the corresponding author/s.
Author contributions
SR conducted the data analysis and wrote the first version of the manuscript. SJ conceptualized, designed, and directed the study. RH contributed to research design related to soil carbon and solar-land interactions. SR, SJ, and RH contributed to manuscript revision, read, and approved the submitted version. All authors contributed to the article and approved the submitted version.
Funding
This research was supported by the Alfred P. Sloan Foundation (Award No. G-2019-12470).
Conflict of interest
The authors declare that the research was conducted in the absence of any commercial or financial relationships that could be construed as a potential conflict of interest.
Publisher's note
All claims expressed in this article are solely those of the authors and do not necessarily represent those of their affiliated organizations, or those of the publisher, the editors and the reviewers. Any product that may be evaluated in this article, or claim that may be made by its manufacturer, is not guaranteed or endorsed by the publisher.
Supplementary material
The Supplementary Material for this article can be found online at: https://www.frontiersin.org/articles/10.3389/frsus.2022.1021971/full#supplementary-material
References
Allen, M. F., Jenerette, G. D., and Santiago, L. (2013). Carbon Balance in California Deserts: Impacts of Widespread Solar Power Generation. University of California, Riverside, CA.
Bai, Y., Scott, T. A., and Min, Q. (2014). Climate change implications of soil temperature in the Mojave Desert, USA. Front. Earth Sci. 8, 302–308. doi: 10.1007/s11707-013-0398-3
Bird, L., Milligan, M., and Lew, D. (2013). Integrating Variable Renewable Energy: Challenges and Solutions. National Renewable Energy Laboratory. Retrieved from: https://www.nrel.gov/docs/fy13osti/60451.pdf
Burkhardt, J. J. III., Heath, G., and Cohen, E. (2012). Life cycle emissions of greenhouse gas emissions of trough and tower concentrating solar power electricity generation. J. Indust. Ecol. 16, S93–S109. doi: 10.1111/j.1530-9290.2012.00474.x
Burkhardt, J. J. III., Heath, G. A., and Turchi, C. S. (2011). Life cycle assessment of a parabolic trough concentrating solar power plant and the impacts of key design alternatives. Environ. Sci. Technol. 45, 2457–2464. doi: 10.1021/es1033266
Cagle, A., Shepherd, M., Grodsky, S., Armstrong, A., Jordaan, S. M., and Hernandez, R. (2021). Standardized metrics to quantify solar energy-land relationships: a global systematic review. SSRN Elect J. doi: 10.2139/ssrn.4069060
Cerling, T. E. (1984). The stable isotopic composition of modern soil carbonate and its relationship to climate. Earth Planet. Sci. Lett. 71, 229–240. doi: 10.1016/0012-821X(84)90089-X
Costanza, R., De Groot, R., Sutton, P., Van der Ploeg, S., Anderson, S. J., Kubiszewski, I., et al. (2014). Changes in the global value of ecosystem services. Glob. Environ. Change 26, 152–158. doi: 10.1016/j.gloenvcha.2014.04.002
Deign, J. (2020). America's Concentrated Solar Power Companies Have All Disappeared. Greentech Media. Retrieved from: https://www.greentechmedia.com/articles/read/americas-concentrated-solar-power-companies-have-all-but-disappeared
DeMarco, J., Mack, M. C., Bret-Harte, M. S., Burton, M., and Shaver, G. R. (2014). Long-term experimental warming and nutrient additions increase productivity in tall deciduous shrub tundra. Ecosphere 5, 72. doi: 10.1890/ES13-00281.1
Denholm, P., Clark, K., and O'Connell, M. (2016). On the Path to SunShot: Emerging Issues and Challenges in Integrating High Levels of Solar into the Electrical Generation and Transmission System. Golden, CO: National Renewable Energy Laboratory. Retrieved from: https://www.nrel.gov/docs/fy16osti/65800.pdf
Earth Resources Observation Science Center (2018). Aerial Photography – National Agriculture Imagery Program. United States Geological Survey. Retrieved from: https://www.usgs.gov/centers/eros/science/usgs-eros-archive-aerial-photography-national-agriculture-imagery-program-naip
Ela, E., Diakov, V., Ibanez, E., and Heaney, M. (2013). Impacts of Variability and Uncertainty in Solar Photovoltaic Generation at Multiple Timescales. National Renewable Energy Laboratory. Retrieved from: https://www.nrel.gov/docs/fy13osti/58274.pdf
Environmental Assessment (2010). Solana Thermal Electric Power Project. United States Department of Energy.
Eswaran, H., Reich, P. F., Kimble, J. M., Beinroth, F. H., Padmanabhan, E., and Moncharoen, P. (2000). Global Carbon Stocks. Boca Raton, FL: Lewis Publishers Inc.
Evans, R. D., Koyama, A., Sonderegger, D. L., Charlet, T. N., Newingham, B. A., Fenstermaker, L. F., et al. (2014). Greater ecosystem carbon in the Mojave Desert after ten years exposure to elevated CO2. Nat. Clim. Chang. 4, 394–397. doi: 10.1038/nclimate2184
Fierer, N., Allen, A. S., Schimel, J. P., and Holden, P. (2003). Controls on microbial CO2 production: a comparison of surface and subsurface soil horizons. Glob. Chang. Biol. 9, 1322–1332. doi: 10.1046/j.1365-2486.2003.00663.x
Final Environmental Impact Statement (2010a). Crescent Dunes Solar Energy Project. Bureau of Land Management.
Final Environmental Impact Statement (2010b). Ivanpah Solar Electric Generating System. Bureau of Land Management.
Fthenakis, V. M., and Kim, H. C. (2009). Land use and electricity generation: a life-cycle analysis. Renew. Sustain. Energy Rev. 13, 1465–1474. doi: 10.1016/j.rser.2008.09.017
Gao, Y., Tian, J., Pang, Y., and Liu, J. (2017). Soil inorganic carbon sequestration following afforestation is probably induced by pedogenic carbonate formation in Northwest China. Front. Plant Sci. 8, 1282. doi: 10.3389/fpls.2017.01282
Grodsky, S. M., Campbell, J. W., and Hernandez, R. R. (2021). Solar energy development impacts flower-visiting beetles and flies in the Mojave Desert. Biol. Conserv. 263, 109336. doi: 10.1016/j.biocon.2021.109336
Grodsky, S. M., and Hernandez, R. R. (2020). Reduced ecosystem services of desert plants from ground-mounted solar energy development. Nat. Sustain. 3, 1036–1043. doi: 10.1038/s41893-020-0574-x
Hernandez, R. R., Armstrong, A., Burney, J., Ryan, G., Moore-O'Leary, K., Diédhiou, I., et al. (2019). Techno–ecological synergies of solar energy for global sustainability. Nat. Sustain. 2, 560–568. doi: 10.1038/s41893-019-0309-z
Hernandez, R. R., Hoffacker, M. K., and Field, C. B. (2014). Land-use efficiency of big solar. Environ. Sci. Technol. 48, 1315–1323. doi: 10.1021/es4043726
Hernandez, R. R., Hoffacker, M. K., Murphy-Mariscal, M. L., and Allen, M. F. (2015). Solar energy development impacts on land cover change and protected areas. Proc. Nat. Acad. Sci. 112, 13579–13584. doi: 10.1073/pnas.151765611
Hernandez, R. R., Jordaan, S. M., Kaldunski, B., and Kumar, N. (2020). Aligning climate change and Sustainable Development Goals with an innovation systems roadmap for renewable power. Front. Sustain. 1, 583090. doi: 10.3389/frsus.2020.583090
Hoffacker, M. K., and Hernandez, R. R. (2020). Local energy: spatial proximity of energy providers to their power resources. Front. Sustain. 1, 585110. doi: 10.3389/frsus.2020.585110
International Energy Agency (2021). Solar Power and Chemical Energy Systems- SolarPACES. Retrieved from: https://www.solarpaces.org/csp-technologies/csp-projects-around-the-world/
ISO (2006). ISO 14040: 2006 Environmental Management – Life Cycle Assessment – Principles and Framework.
Jordaan, S. M., Park, J., and Rangarajan, S. (2022). Innovation in intermittent electricity and stationary energy storage in the United States and Canada: a review. Renew. Sustain. Energy Rev. 158, 112149. doi: 10.1016/j.rser.2022.112149
Jorgenson, J., Denholm, P., and Mehos, M. (2014). Estimating the Value of Utility-Scale Solar Technologies in California Under a 40% Renewable Portfolio Standard. Golden, CO: National Renewable Energy Laboratory. Retrieved from: https://www.nrel.gov/docs/fy14osti/61685.pdf
Klein, S. J. W., and Rubin, E. S. (2013). Life cycle assessment of greenhouse gas emissions, water, and land use for concentrated solar power plants with different energy backup systems. Energy Policy 63, 935–990. doi: 10.1016/j.enpol.2013.08.057
Lechón, Y., Rúa, C., and Sáez, R. (2008). Life cycle environmental impacts of electricity production by solar thermal power plants in Spain. J. Solar Energy Eng. 130, 021012. doi: 10.1115/1.2888754
Lopez, A., Roberts, B. J., Heimiller, D., Blair, N., and Porro, G. (2012). US Renewable Energy Technical Potentials: A GOS-Based Analysis. National Renewable Energy Laboratory. Retrieved from: https://www.nrel.gov/docs/fy12osti/51946.pdf
Lovering, J., Swain, M., Blomqvist, L., and Hernandez, R. R. (2022). Land-use intensity of electricity production and tomorrow's energy landscape. PLoS ONE 17, e0270155. doi: 10.1371/journal.pone.0270155
Magaritz, M., and Amiel, A. J. (1981). Influence of intensive cultivation and irrigation on soil properties in the Jordan Calley, Israel: recrystallization of carbonate minerals. Soil Sci. Soc. Am. J. 45, 1201–1205. doi: 10.2136/sssaj1981.03615995004500060038x
Martin, J. B. (2017). Carbonate minerals in the global carbon cycle. Chem. Geol. 449, 58–72. doi: 10.1016/j.chemgeo.2016.11.029
Martin, J. B., De Grammont, P. C., Covington, M. D., and Toran, L. (2021). A New Focus on the Neglected Carbonate Critical Zone. EOS. Retrieved from: https://eos.org/science-updates/a-new-focus-on-the-neglected-carbonate-critical-zone
Michener, C. D. (2007). The Bees of the World, 2nd Edn. Baltimore, MD: John Hopkins University Press, 953.
Minckley, R. L., and Radke, W. R. (2021). Extreme species density of bees (Apiformes, Hymenoptera) in the warm deserts of North America. J. Hymenopt. Res. 82, 317–345. doi: 10.3897/jhr.82.60895
Norton, B., Eames, P. C., and Lo, S. N. (1998). Full-energy-chain analysis of greenhouse gas emissions for solar thermal electric power generation systems. Renew. Energy 12, 131–136. doi: 10.1016/S0960-1481(98)00158-X
Persico, L. P., McFadden, L. D., McAuliffe, J. R., Rittenour, T. M., Stahlecker, T. E., Dunn, S. B., et al. (2022). Late Quaternary geochronologic record of soil formation and erosion: effects of climate change on Mojave Desert hillslopes. Geology 50, 54–59. doi: 10.1130/G49270.1
Pietrasiak, N., Drenovsky, R. E., Santiago, L. S., and Graham, R. C. (2014). Biogeomorphology of a Mojave Desert landscape—configurations and feedbacks of abiotic and biotic land surfaces during landform evolution. Geomorphology 206, 23–36. doi: 10.1016/j.geomorph.2013.09.015
Roberts, B. J. (2018). Global Horizontal Solar Irradiance: National Solar Radiation Database Physical Solar Model. National Renewable Energy Laboratory. Retrieved from: https://www.nrel.gov/gis/assets/images/solar-annual-ghi-2018-usa-scale-01.jpg
Rumpel, C., Chabbi, A., and Marschner, B. (2012). “Carbon storage and sequestration in subsoil horizons: knowledge, gaps and potentials,” in Recarbonization of the Biosphere, Eds R. Lal, K. Lorenz, R. Hüttl, B. Schneider, and J. von Braun (Dordrecht: Springer), 445–464.
Schlesinger, W. H. (1985). The formation of caliche in soils of the Mojave-Desert, California. Geochim. Cosmochim. Acta 49, 57–66. doi: 10.1016/0016-7037(85)90191-7
Schlesinger, W. H., Belnap, J., and Marion, G. (2009). On carbon sequestration in desert ecosystems. Glob. Chang. Biol. 15, 1488–1490. doi: 10.1111/j.1365-2486.2008.01763.x
Sioshansi, R., and Denholm, P. (2010). The Value of Concentrating Solar Power and Thermal Energy Storage. National Renewable Energy Laboratory. Retrieved from: https://www.nrel.gov/docs/fy10osti/45833.pdf
Skone, T. J., Littlefield, J., Marriott, J., Cooney, G., Jamieson, M., Hakian, J., et al. (2014). Life Cycle Analysis of Natural Gas Extraction and Power Generation (DOE/NETL-2014/1646). US Department of Energy and National Energy Technology Laboratory. Retrieved from: https://www.energy.gov/sites/prod/files/2019/09/f66/Life%20Cycle%20Analysis%20of%20Natural%20Gas%20Extraction%20and%20Power%20Generation%2005_29_14%20NETL.pdf
Staff Assessment and Environmental Impact Assessment (2010). Genesis Solar Energy Project. Bureau of Land Management and California Energy Commission.
Thomey, M. L., Ford, P. L., Reeves, M. C., Finch, D. M., Litvak, M. E., and Collins, S. L. (2014). Climate change impacts on future carbon stores and management of warm deserts of the United States. Rangelands 36, 16–24. doi: 10.2737/RMRS-GTR-316
Titus, J. H., Nowak, R. S., and Smith, S. D. (2002). Soil resource heterogeneity in the Mojave Desert. J. Arid Environ. 52, 269–292. doi: 10.1006/jare.2002.1010
United Nations (2015). Sustainable Development Goals 15. Department of Economic and Social Affairs. Available online at: https://sdgs.un.org/goals/goal15
United States Department of Energy (2021). Solar Futures Study. Retrieved from: https://www.energy.gov/sites/default/files/2021-09/Solar%20Futures%20Study.pdf
United States Energy Information Administration (2020a). Form-923. EIA. Retrieved from: https://www.eia.gov/electricity/data/eia923/
United States Energy Information Administration (2020b). Form-860. Retrieved from: https://www.eia.gov/electricity/data/eia860/
United States Energy Information Administration (2021). How Much Carbon Dioxide Is Produced Per Kilowatthour of US Electricity Generation? Frequently Asked Questions: EIA. Retrieved from: https://www.eia.gov/tools/faqs/faq.php?id=74andt=11
Viebahn, P., Kronshage, S., Trieb, F., and Lechon, Y. (2008). New Energy Externalities Developments (NEEDS) for Sustainability Integrated Project: Final Report on Technical Data, Costs, and Life Cycle Inventories of Solar Thermal Power Plants. NEEDS Project, 49–95.
Walston, L. J., Mishra, S. K., Hartmann, H. M., Hlohowskyj, I., McCall, J., and Macknick, J. (2018). Examining the potential for agricultural benefits from pollinator habitat at solar facilities in the United States. Environ. Sci. Technol. 52, 7566–7576. doi: 10.1021/acs.est.8b00020
Weinrebe, G., Böhnke, M., and Trieb, F. (1998). Life Cycle Assessment of an 80 MW SEGs Plant and a 30 MW Phoebus Power Tower. Solar Engineering ASME. Retrieved from: https://elib.dlr.de/2331/
World Bank (2021). Concentrating Solar Power: Clean Power on Demand 24/7. Washington, DC: World Bank. Retrieved from: https://pubdocs.worldbank.org/en/849341611761898393/WorldBank-CSP-Report-Concentrating-Solar-Power-Clean-Power-on-Demand-24-7-FINAL.pdf
Keywords: concentrated solar power (CSP), life cycle assessment, land-use and land-cover change (LULCC), soil carbon, ecosystem services
Citation: Rangarajan S, Hernandez RR and Jordaan SM (2022) Life cycle impacts of concentrated solar power generation on land resources and soil carbon losses in the United States. Front. Sustain. 3:1021971. doi: 10.3389/frsus.2022.1021971
Received: 18 August 2022; Accepted: 26 September 2022;
Published: 25 October 2022.
Edited by:
Mikołaj Owsianiak, Technical University of Denmark, DenmarkReviewed by:
Julien Walzberg, National Renewable Energy Laboratory (DOE), United StatesYang Yu, Beijing Forestry University, China
Copyright © 2022 Rangarajan, Hernandez and Jordaan. This is an open-access article distributed under the terms of the Creative Commons Attribution License (CC BY). The use, distribution or reproduction in other forums is permitted, provided the original author(s) and the copyright owner(s) are credited and that the original publication in this journal is cited, in accordance with accepted academic practice. No use, distribution or reproduction is permitted which does not comply with these terms.
*Correspondence: Sarah M. Jordaan, c2FyYWguam9yZGFhbkBtY2dpbGwuY2E=