 Grant Faber
 Christophe Mangin
 Volker Sick
- Global CO2 Initiative, Department of Mechanical Engineering, University of Michigan, Ann Arbor, MI, United States
Technologies that valorize carbon dioxide are becoming an increasingly relevant component of the portfolio of solutions necessary to mitigate and reverse climate change. Assessing the environmental and economic characteristics of these technologies early in their developmental trajectories can help technologists either efficiently accelerate emissions reductions and commercialization or realize potential infeasibility and direct resources toward better opportunities. To aid in such assessments, this article constructs a typology of carbon removal and utilization technologies and identifies specific pathways in need of early-stage life cycle assessment (LCA) and techno-economic assessment (TEA) templates. Based on published literature and project experience, example LCA and TEA templates are developed for high-priority pathways with relatively low technology readiness levels including direct air capture, chemical synthesis, algae products, carbonated concrete, and carbonated aggregates. The templates attempt to capture the most important elements of early-stage LCA and TEA in an easily understandable and usable manner that still allows for reliable, order-of-magnitude estimations and hotspot analysis. Opportunities for other practitioners to use and build upon the templates are also discussed.
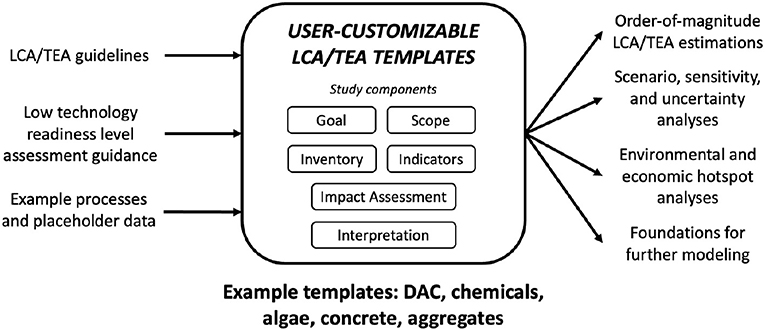
Graphical Abstract.
Introduction
Climate Change and Carbon Management
To meet the Paris Agreement goal of limiting global warming to 1.5°C, global society must reach net zero anthropogenic carbon dioxide emissions by 2050 (IPCC, 2018). There exist many technologies classified by the International Energy Agency (IEA) as mature and in the early adoption stage that will aid in the transition to net zero (International Energy Agency (IEA), 2020). These range from renewable power to energy efficiency to electric vehicles and so on (IPCC, 2014). In the past several years, however, a growing chorus of scientists has demonstrated the necessity of a newer class of technologies that will be necessary to complete the defossilization portfolio (Minx et al., 2017). This class could be referred to as “carbon management”—as reflected with the recently renamed Office of Fossil Energy and Carbon Management in the U.S. Department of Energy (U.S. Department of Energy, 2021)—and include carbon capture, utilization, and storage (CCUS) technologies.
Carbon capture refers to the ability to remove carbon dioxide from either the air directly or point source emissions originating from industrial and power generation facilities. Carbon dioxide removal (CDR), also sometimes referred to as negative emissions technologies (NETs), specifically involves the removal of carbon dioxide from the ambient air. Carbon dioxide utilization, often also termed carbon capture and utilization (CCU), is the use of carbon dioxide captured either from the atmosphere or point source emissions in valuable products, such as plastics and chemicals. Carbon storage, also known as carbon capture and sequestration (CCS), involves the permanent storage of captured carbon dioxide in geological formations or as stable carbonates in CCU products.1 Some use the term “storage” to indicate temporary storage of carbon dioxide for later use and “sequestration” to mean permanent storage.
The International Energy Agency projects that almost two-thirds of defossilization of the global energy sector by 2070 will be addressed by technologies in the “Mature” and “Early adoption” technology readiness categories, which include technologies such as nuclear power and battery storage respectively (2020). This leaves a significant portion of the energy defossilization effort that must be addressed with “Demonstration” and “Prototype” technologies: categories that contain a profusion of CCUS technologies ranging from synthetic liquid hydrocarbons to chemicals made with captured carbon to biomass applications with carbon capture and sequestration (International Energy Agency (IEA), 2020).
While the IEA faces criticism for underestimating the potential pace of defossilization (Green, 2019; FixTheWEO, 2021) and, more recently, for overestimating the need to cut fossil fuel investments (Hook et al., 2021), many other sources corroborate the need for rapid innovation and scaling of emerging CCUS technologies to satisfy global emissions targets (IPCC, 2018; Minx et al., 2018; National Academies of Sciences, 2019a,b; Rueda et al., 2021).
There are various reasons why CCUS is likely required to meet these targets. Hard-to-abate sectors—such as cement and steel production—often generate emissions arising from chemical reactions that are inherent to production, meaning that CCUS might be necessary to either help decarbonize the sector directly or compensate for its emissions through carbon removal and permanent sequestration. Furthermore, chemical products ranging from plastics to hydrocarbon fuels currently depend primarily on fossil feedstocks as their carbon source; utilization of atmospheric carbon in such products could potentially allow for a sustainable circular economy, if the associated production processes are powered by renewable energy (Sick, 2021). NETs, as a subcategory of CCUS technologies, also allow for the possibility of addressing emissions overshoot. If global society exceeds currently agreed-upon emissions limits, it could then deploy technologies to support the net removal of carbon dioxide to return the atmospheric concentration of greenhouse gases to a more manageable level (IPCC, 2014). In the long-term, NETs could even theoretically allow for a return to pre-industrial atmospheric conditions. These attributes are not offered by renewable energy, energy efficiency, and electrified transportation technologies, as these are primarily focused on emissions mitigation rather than utilization and removal and often still involve some small level of emissions.
The Role of Assessment
Many different stakeholders along the technological value chain will participate in the research, development, demonstration, and deployment of carbon capture, utilization, and storage. Scientists will engage in basic research to develop fundamentally new approaches and pathways, engineers will further adapt these developments into functional technologies, entrepreneurs will bring these technologies to market, and policymakers will fund and incentivize this whole process. While these stakeholder groups have varying goals and positions, they are all united by a need to understand the economic and environmental characteristics of the technological pathways. This data can help compare technologies in terms of their environmental trade-offs and costs per metric ton of CO2 abated or removed. It can also help researchers and developers control prohibitively high economic or environmental costs in early developmental stages when costs are lower and ability to influence the developmental trajectory is higher (Zimmermann et al., 2021). Various studies indicate that 70–80% of both the eventual production costs and environmental effects of new products are locked in during the design stage (Dowlatshahi, 1992; Thomassen et al., 2019; Moni et al., 2020), reinforcing the importance of early assessment. Early-stage technology assessment “increases the efficiency and effectiveness of the R&D process by accelerating discovery science, enabling early-stage technology prioritization, and encouraging specific R&D targets” (Mission Innovation, 2017). Assessment also allows for go/no go and investment prioritization decisions, where certain technologies may be so environmentally and economically infeasible that development ceases altogether so decision-makers can focus resources on other potential innovations.
Life cycle assessment (LCA) and techno-economic assessment (TEA) are standard methodologies that allow for the characterization of environmental and economic aspects of technologies respectively. Both methodologies involve the specification of a desired goal and scope for studies, collection of inventory data (often relating to the mass and energy balances for the systems under consideration), translation of the inventory data into useful environmental or economic metrics, and subsequent interpretation and reporting of the study's methods and conclusions. Multiple research teams have created guidelines for conducting LCA and TEA for CCUS technologies in particular (Rubin et al., 2013; Skone et al., 2019; van der Spek et al., 2019; Zimmermann et al., 2020; Roussanaly et al., 2021). While such guidelines provide much needed guidance and can lead to standardization of expectations for studies, they still require careful study and model implementation on the part of users. There is thus an opportunity to develop curated CCUS LCA and TEA templates to accelerate assessment model development, help new practitioners conduct assessments, and enable more “apples-to-apples” comparisons between CCUS technologies (Zimmermann and Schomäcker, 2017).
The Value of Templates
Pre-made, customizable templates are used in many fields to expedite and standardize analysis as well as to instruct (Øvad and Larsen, 2016; Xie et al., 2019). Finance, computer science, and law are all fields that make significant use of templates to perform routine work.2 Templates mitigate the need for repetitive and unnecessary tasks, prevent users from neglecting vital considerations, and ideally allow enough flexibility to be modified as needed for any individual project. While scholarship often requires unique approaches and methods when conducting novel research, the existence of guidelines and the need for standardization in LCA and TEA of CCUS makes it a ripe area for such templates.
The trouble with general template development for this purpose is the diversity of pathways within CCUS. For example, concrete cured with captured carbon dioxide and algal biofuels—both CCUS technologies—have rather different manufacturing processes. It would be difficult to develop a template that is both broad enough to capture both technology classes but specific enough to be useful for assessing either one. To address this issue, this article develops templates for several classes of CCUS technologies that are at low technology readiness levels (TRLs). Low TRL classes were chosen as far more LCAs and TEAs have already been developed for high TRL ones, and high TRL studies can involve more complexity than simplified templates can model due to enhanced data availability from pilot and demonstration plants. The classes used in the study are identified using a typology of the primary carbon removal and carbon utilization technologies based on a review of existing classification schemes. These templates will help accelerate the process of constructing high-level, order-of-magnitude estimations and hotspot analysis for various classes of emerging carbon management technologies. They are available for download in the Supplementary Material.
The templates attempt to strike a balance between simplicity and accuracy. They are simple enough to be understood and used by those with at least some level of LCA/TEA and spreadsheet experience but complex enough to allow for the generation of accurate and actionable results for emerging CCUS technologies. While full life cycle assessments and financial evaluations are much more intensive than what is demonstrated with these templates, the limited amount of detail should be sufficient to identify environmental and cost hotspots, guide research, and inform go/no go decisions. Results can also serve as the basis for further assessment. Figure 1 demonstrates the approach this article used for the development of these templates, and each step is expanded upon in the following section.
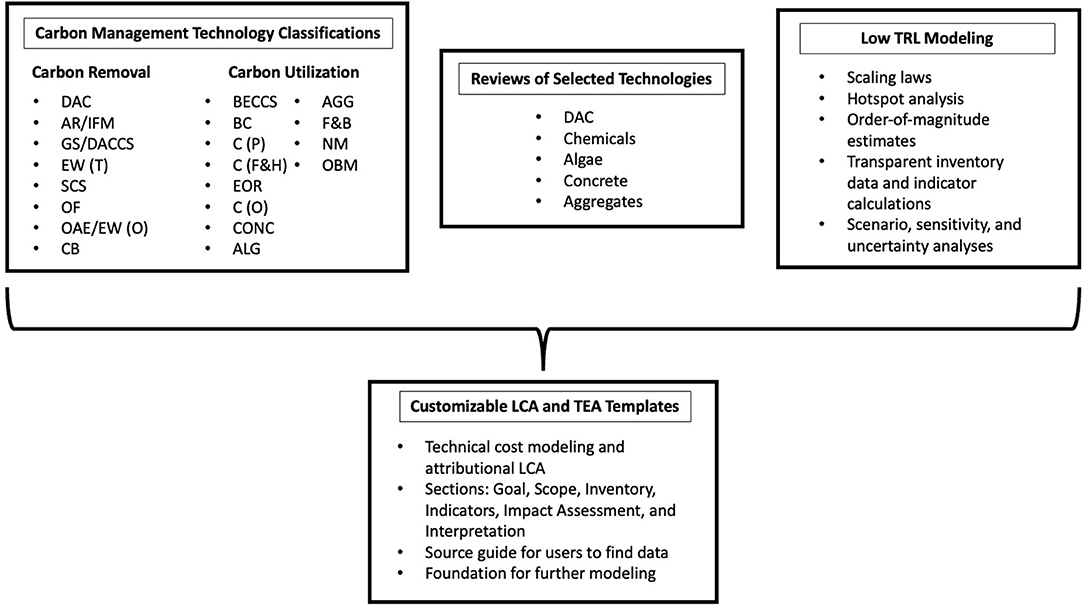
Figure 1. Visual summary of the approach to template development.
Materials and Methods
Technology Classification
There are many different categories or classes of carbon management technologies. Constructing a typology of these technologies is necessary for informed template development, and many other publications have already proposed classification schemes for reasons ranging from public communication to cost and potential identification. Table 1 summarizes the results of a literature review used to identify existing classifications. This review used the various reports and articles listed on the CCUS page3 of the AssessCCUS website as a starting point. Following this, general searches on both Google and Google Scholar with phrases such as “list of carbon utilization/carbon removal/negative emissions technologies” and “carbon utilization/carbon removal/negative emissions portfolio” were used to find relevant classifications. The review concluded when no more unique lists could be found. Publications are separated into “Removal-Focused” and “Utilization-Focused” categories. The technology pathways are similarly separated in the table for organizational clarity, and the number of times they appear in the sources is also noted.
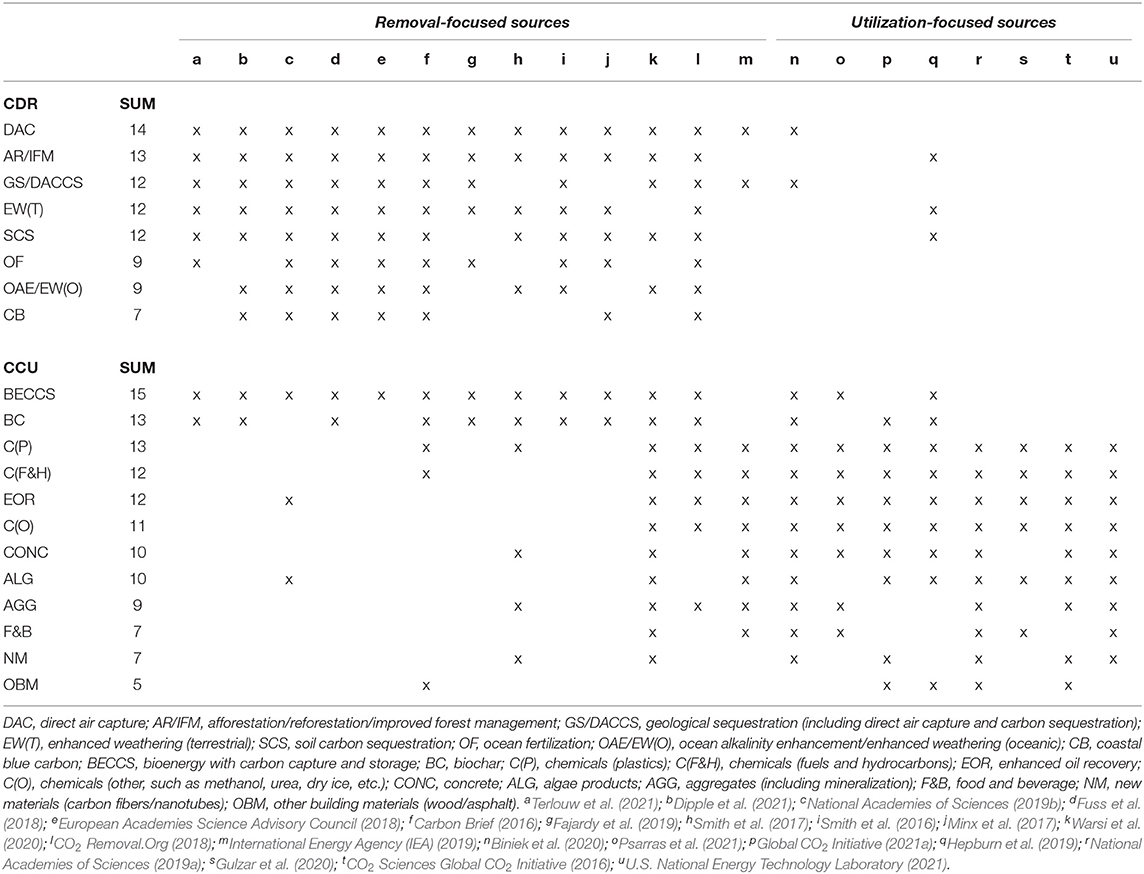
Table 1. Typology of carbon removal and carbon utilization technologies.
Technologies are assigned to the “CDR” or “CCU” categories based on corresponding definitions from the AssessCCUS glossary.4 Carbon dioxide removal is defined as a “Suite of methods that extract CO2 from the ambient air by biological, chemical, or physical means” while carbon capture and utilization is defined as a “Process including the separation and removal of CO2 from the atmosphere (Direct Air Capture), fuel combustion, or industrial processes; its transport via ship, train, truck or pipeline; and its use as a resource to create valuable Products (e.g., plastic, beverages).”4 This explains why BECCS, which produces energy, and biochar, which can produce soil amendments, are included under the CCU section in Table 1 even though they are often considered to be CDR technologies. While voluntary or compliance offsets or credits created by CDR and permanent sequestration could be considered “valuable products,” this classification only counts physical products to allow for a separation between CDR and CCU. Geological and oceanic storage of carbon dioxide is included as part of the carbon removal category as they enable carbon removal and generally do not directly produce any valuable products.
Using this classification scheme, technological pathways for early-stage LCA and TEA template development were identified. The pathways chosen for template development are direct air capture, chemicals, algae products, concrete, and aggregates. The chemicals pathways are aggregated, as one adaptable model template should be flexible enough for various chemical manufacturing processes. All carbon removal pathways except for direct air capture (DAC) are excluded from template development. DAC can directly supply a stream of carbon dioxide to be utilized in downstream products whereas other CDR methods, such as mass afforestation and ocean fertilization, generally involve extensive ecosystem modification and require more sophisticated ecological modeling than what industrial-focused LCA can generally offer. Geological sequestration is excluded for the same reason.
Technologies with high TRLs are also excluded from the scope of this study, as many life cycle and techno-economic assessments have already been performed for such technologies and the focus of this study is on emerging CCUS pathways. Thus, BECCS, biochar, enhanced oil recovery (EOR), and other building materials such as wood and asphalt are all excluded. There are various BECCS projects around the world, with some possessing CO2 capacities in the millions of metric tons (Kemper, 2017). Biochar has been used by humans for thousands of years in various contexts and is applied broadly today (Chen et al., 2019). EOR with CO2 is also fully commercially established, although the source of the CO2 is often underground reservoirs rather than flue gas or the ambient atmosphere (Núñez-López and Moskal, 2019). Other building materials that utilize carbon, such as wood, have been deployed at commercial scales for millennia, and further proliferation may require new innovations in non-engineering fields, such as architecture. Food and beverage applications are also excluded as low TRL conversion of CO2 into proteins could be covered with other templates and carbonated beverages are often already made with CO2 captured from industrial plants or originating from underground reservoirs. Some beverage companies are already seeking to use atmospheric carbon in the drinks (Peters, 2018). Finally, new carbon-utilizing materials, such as certain carbon fiber applications, are also excluded due to the potential breadth of this category. LCA and TEA for this group could also likely be performed using the templates for one of the chosen CCU categories, such as chemicals.
Separate, short reviews were completed for each chosen technology (DAC, chemicals, algae products, concrete, and aggregates) to ensure that key technological, economic, and environmental parameters and considerations are included for each template. These reviews along with corresponding sources are located in the Supplementary Material section. While the templates strive to include essential parameters, further work will likely be necessary when adapting the templates to any particular process, especially if the process under consideration by the user is at a higher TRL.
Low TRL Modeling
The templates were developed based on the University of Michigan Global CO2 Initiative's Techno-Economic Assessment and Life Cycle Assessment Guidelines for CO2 Utilization (Version 1.1) (Zimmermann et al., 2020). However, there are several additional considerations required to satisfy the low TRL nature of the LCA and TEA templates. While Version 2.0 of the Guidelines will directly address early-stage technology assessment (Global CO2 Initiative, 2021b), insights from several other publications were used to inform template development.
Prospective assessment of low TRL technologies faces a myriad of methodological challenges. Common issues include a high degree of uncertainty about how the technology will fare at scale, a lack of terminology or precision of existing terminology, and a paucity of clear guidelines for performing such assessments (Bergerson et al., 2020). Other difficulties include comparability issues arising from functional inequivalence to existing technologies, the inability to perform and communicate about accurate uncertainty and sensitivity analyses, and the time-intensive nature of correctly performing such studies (Moni et al., 2020). Moni et al. also propose a series of approaches to overcome these challenges for early-stage LCA, including the definition of multiple functional units, the use of probability distributions instead of point values for uncertain input parameters, the use of scaling laws when attempting to analyze a system at scale, and enhancing transparency when communicating about the study and its uncertainties (2020). Given similarities between the structure of LCA and TEA modeling, it is assumed that these approaches can apply to early-stage TEA as well.
Van der Spek et al. explore challenges with ex-ante techno-economic assessment of carbon dioxide capture technology and conclude that initial estimations are possible given the availability of energy use data, a high-level equipment list, the selection of a modeling approach that matches the maturity of the technology under consideration, and the use of bottom-up equipment costing when reference equipment is not available for scaling (van der Spek et al., 2017). Roh et al. recommend a process of collecting primary data about the process (which will be limited based on the TRL of the technology), calculating secondary data using the primary data, and then computing performance indicators using a combination of this data (Roh et al., 2020).
Many of these recommendations and ideas are integrated into the TEA and LCA templates for this study. Scaling laws are used in each template for equipment sizing and associated calculations. These calculations are based on necessary throughput levels in each step to meet desired annual production volumes. Analysis of results and associated interpretation focus on hotspot identification using order-of-magnitude estimations rather than highly accurate results. Static, primary data is limited to the Inventory worksheets while intermediate, secondary data is calculated (when needed) in the Indicators and Impact Assessment worksheets, which allows for streamlined updating of inventory data in the future or by others who are less familiar with the model. The templates include a dedicated space for notes and recommend adding comments with sources for inventory entries and appropriate intermediate calculations to enhance transparency, usability, and the ability to review the models. Finally, there are dedicated areas for scenario, sensitivity, and uncertainty analyses, with demonstrative examples of each. These features will help guide users when assessing emerging technologies, updating the models over time, and communicating results to stakeholders.
There are numerous other valuable studies on approaches to prospective assessment of emerging technologies (Gavankar et al., 2015; Miller and Keoleian, 2015; Sharp and Miller, 2016; Lacirignola et al., 2017; Cucurachi et al., 2018; Thomassen et al., 2019; Bergerson et al., 2020; Hung et al., 2020; Thonemann et al., 2020; van der Hulst et al., 2020). However, many include advanced probabilistic analysis, specific advice for particular technological pathways, or the use of advanced software applications, all of which are outside the scope of this study.
With the creation of templates, there is an inevitable trade-off between including the depth necessary to capture every recommendation from the prospective LCA and TEA literature and making the templates simple enough for new practitioners to successfully understand and use. The templates in this study attempt to strike a balance between these trade-offs by including just enough detail in the models to offer order-of-magnitude estimations of important environmental and economic indicators while also listing numerous potential expansions of the templates that may be necessary to meet the goals of a particular study. Rather than being viewed as decisive models that should only be slightly altered, the templates created as part of this study are meant to serve as a starting point for others to build upon and modify according to their needs. When conducting LCAs and TEAs, the authors use the templates in this way, generally fundamentally altering some aspect of the model to suit the study's goal or the technology under consideration. While the templates simplify certain complex aspects of LCA and TEA modeling, many of these aspects—especially ones related to performing in-depth process modeling—are irrelevant at low TRLs due to extremely high degrees of uncertainty. Further work and case studies will help demonstrate the value of and refine the elements included in the templates.
LCA and TEA Approaches
The TEA and LCA methods used in this study are based on technical cost modeling and attributional life cycle assessment respectively. Technical cost modeling generates manufacturing costs using a process model based on a product's description, an operations model based on processing requirements, and a financial model based on resource requirements (Field et al., 2007). Factors such as selling, general, and administrative expenses; taxes; management costs; selling prices and profitability; and research and development costs are not included in technical cost models and should not be added to the templates. These factors vary by business, and TEA requires the isolation of costs that are directly relevant to the technology being assessed.
Attributional LCA allocates the environmental impacts of factors in the various life cycle stages to a product without analyzing indirect consequences of the product's manufacture, whereas a different type of LCA known as consequential LCA attempts to characterize the environmental consequences from a change in the level of output of a product (Brander et al., 2008). Attributional approaches generally rely on average impact data, whereas consequential approaches often require much more complicated economic models to parse out the cascading changes arising from a marginal change in the supply of a product. For example, consequential LCA might analyze emissions arising from incremental electricity use from increased production of a given product, whereas attributional LCA might just assign the average emissions from electricity generation to a product.
Due to this specified scope of the templates, separate analysis would need to be carried out to project the financial performance of businesses selling the technologies under consideration and the marginal environmental impacts from deployment.
Results
Template Structure
Each of the five template workbooks contains eight worksheets: About, Goal, Scope, Inventory, Indicators, Impact Assessment, Interpretation, and Source Guide. The worksheets and sections contained within are based on Global CO2 Initiative's LCA and TEA guidelines for carbon-utilizing technologies (Zimmermann et al., 2020) to ensure that every necessary step is included and visible to the user. Users can add worksheets and connect to other relevant workbooks as needed. Figure 2 shows an example worksheet.
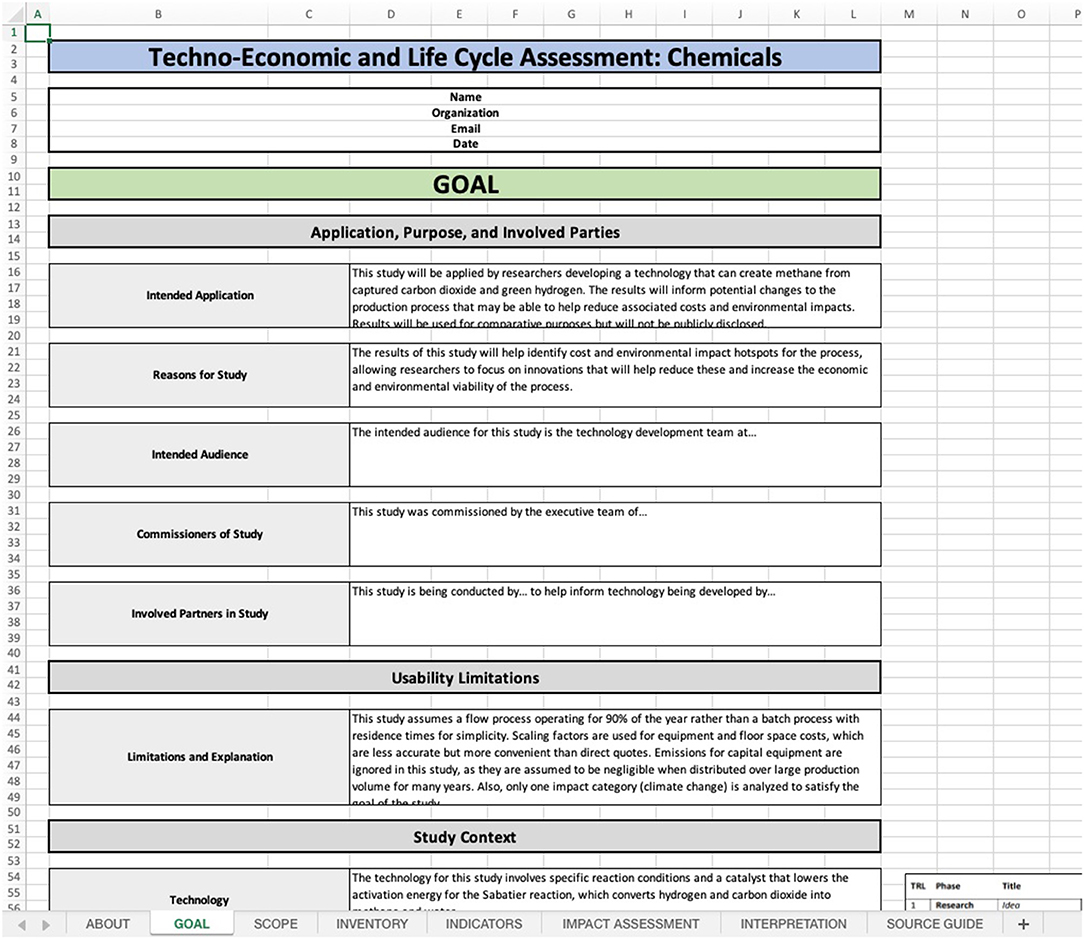
Figure 2. Example worksheet demonstrating the format of the template along with worksheets on the bottom.
The About sheet is nearly identical in each template and contains background information and a list of potential model expansions. The Goal sheet in each template contains four primary sections: Application, Purpose, and Involved Parties; Usability Limitations; Study Context; and Scenarios. The Scope sheet in each template contains six primary sections: Application, Functional Unit, and Reference Flow; System Boundaries, System Elements, and Unit Processes; Benchmark Product; Indicators; Impact Assessment Approach; and Multifunctionality and Allocation.
The Inventory worksheet sections within each template are more varied, but at minimum each one contains the following sections: Production Parameters; Scenario Specifications; Cost Parameters; Machine Parameters; and working sections for sensitivity and uncertainty analysis for both economic and environmental indicators. Inventory sheets also contain sections related to material and energy parameters as needed. Provision B.13 from the Global CO2 Initiative's guidelines recommends the separation of inventory data and indicator calculation to ensure transparency of the data used in the assessment (Zimmermann et al., 2020). Such separation also streamlines future updating of inventory data. Thus, there are no formulas used in the inventory of any template except for the sensitivity and uncertainty analysis sections. These sections must be in the Inventory worksheet due to Microsoft Excel's requirement that data tables are placed in the same worksheet as the parameter(s) they are varying.
The Indicators sheets all contain an Intermediate Calculations section that handles manipulations of inventory data that are necessary to calculate economic indicators and to conduct the impact assessment. These sheets also contain Cost Model and Indicator Summary sections. Each Impact Assessment sheet contains a list of Impact Assessment Factors—all limited to the climate change impact category in this study for simplicity—along with a section for the Impact Assessment Results Summary. All models pull data necessary for this summary from the corresponding Inventory and Indicators worksheets, but users could add another Intermediate Calculations section to this sheet if necessary.
The Interpretation sheet in each template contains the following sections: Economic Insights and Recommendations; Environmental Insights and Recommendations; Scenario Analysis; Sensitivity Analysis: Economic Indicators; Sensitivity Analysis: Environmental Indicators; Uncertainty Analysis: Economic Indicators; and Uncertainty Analysis: Environmental Indicators. Each sensitivity and uncertainty analysis section only analyzes the effects of varying two different parameters on final economic and environmental metrics as a demonstration, with production volume's effects on cost included in each economic sensitivity analysis section. Full studies may want to assess many more parameters and possibly produce visualizations such as tornado diagrams or spider plots to identify the parameters to which the results are the most sensitive. There are also various spreadsheet add-ins that can expedite this process, such as SensIt5 and the Sensitivity Analyzer.6 Finally, each workbook includes a Source Guide worksheet that lists various references for LCA and TEA data. These sources are useful for both collecting inventory data and performing impact assessments.
Interpreting Template Outputs
The applicability and ultimate value of using the templates will depend on the goal of the user's study and how the user performs and interprets the assessment. This section explains some possible ways to interpret and use the outputs of the default templates using the chemicals one as an example. Understanding how the templates can be used to create actionable insights is vital to deriving value from them.
It is important to note that the modeling results in this section should not be taken to be representative of an actual chemical synthesis process. These results are discussed to demonstrate how the templates work and the kinds of information they can communicate when used properly and with actual inputs.
Indicator and Impact Assessment Analysis
Indicator and impact assessment results will be available upon completion of the corresponding worksheets. Figure 3 shows the summary of the TEA indicators from the chemicals template including a corresponding pie chart.

Figure 3. Summary table and pie chart for TEA indicators showing distribution of raw material, labor, and manufacturing overhead costs along with energy consumption.
According to these results, total electricity costs comprise nearly 70% of overall manufacturing costs with carbon dioxide being the second highest cost contributor at only around 15% of costs. Few other cost items—other than capital equipment at around 7%—are significant. Energy consumed in the manufacturing process is 1.77 gigajoules per gigajoule of methane manufactured, implying a gate-to-gate efficiency of only around 56%. While energy consumption is often analyzed as part of life cycle assessment, the template classifies it as a technical indicator to be analyzed as part of the TEA for demonstrative purposes.
Figure 4 shows the results of the impact assessment from the chemicals template.
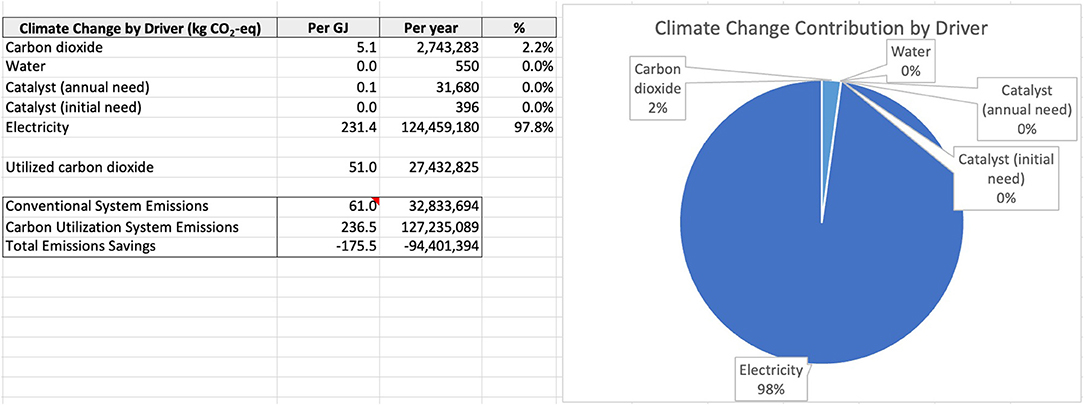
Figure 4. Summary table and pie chart for LCA impact assessment showing distribution of emissions between raw material, catalyst, and electricity needs along with total system emissions.
Based on this impact assessment, electricity usage in the base case leads to the vast majority (almost 98%) of process emissions, with the emissions attributable to the capture of the input carbon dioxide comprising most of the remaining emissions burden. As the chemicals template uses system boundary expansion as its LCA allocation approach, total emissions from the conventional system (producing both fossil methane and carbon dioxide) are compared to total system emissions from the carbon utilization system, which involves recycling of the carbon dioxide but extra emissions from methane synthesis. Ultimately, in this case, there are higher emissions from the carbon utilization process due to the significant use of non-renewable electricity.
Scenario Analysis
Once the user implements the core LCA and TEA models, they can conduct scenario, sensitivity, and uncertainty analyses as part of the interpretation phase of the study. In the chemicals template the interpretation phase begins with the assessment of two scenarios: the use of renewable electricity and the use of an alternate catalyst. Both scenarios are implemented using conditional statements that are activated when the user inputs a “1” in the corresponding cell in the Scenario Specifications section of the Scope worksheet. Using renewable electricity reveals an ~25% decrease in manufacturing cost per gigajoule of output and a 90% reduction in emissions per gigajoule of output due to the lower costs and emissions of renewable electricity paired with the significant influence of electricity costs and emissions in the model. Using the alternate catalyst has a negligible effect on costs and emissions as the catalyst only enhances the Sabatier reaction step and most of the costs and emissions are related to the electrolysis step.
Building scenarios into the templates can help users investigate the relative significance of different alternative states of the world and determine potentially promising research and development paths. Scenarios can also be quite useful when attempting to model potential benefits of various regulations for CCU technologies. Such regulations generally only apply in certain locations or at certain times, so modeling the core process and building in the option to include the impact of regulatory incentives—such as tax credits—is a common use of scenarios in studies.
Sensitivity and Uncertainty Analysis
The templates also allow for sensitivity analysis using Excel's data table functionality. This analysis evaluates the extent to which important indicators—such as cost and environmental impacts—change as particular parameters change. In the chemicals template, the sensitivity analysis looks at how costs change as production volume and the cost of electricity are varied. It also analyzes how emissions savings change as the per unit power ratings of the electrolyzer and the condenser are varied. Generally, per unit costs decrease with production volume in the templates as there are economies of scale related to equipment scaling and the distribution of static labor costs over a higher production volume. These are captured using equipment scaling factors and the allocation of fixed labor costs to each unit produced respectively. Scaling the process modeled in the chemicals template by an order of magnitude reduces unit costs by 10%. Figure 5 demonstrates the results of the sensitivity analysis of production volume. Related tornado diagrams or spider plots could be constructed using sensitivity data from more parameters.
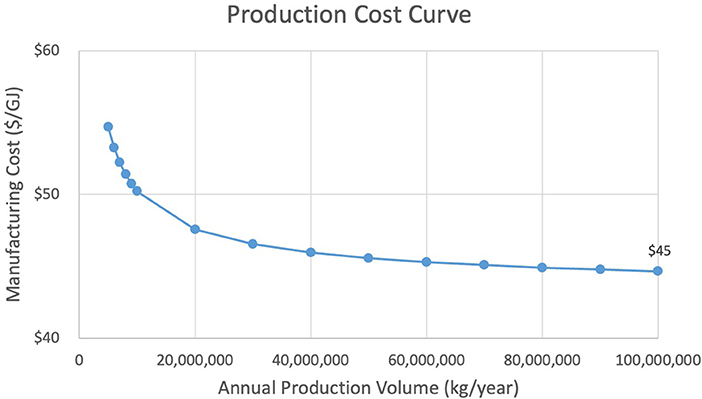
Figure 5. Manufacturing cost per gigajoule of output decreases as annual production volume increases.
In the ideal case, models should investigate the sensitivity of the results to each parameter to identify parameters to which the results are the most sensitive. However, this process can be resource-and time-intensive, and oftentimes these parameters can be identified manually by evaluating those that contribute the most to the largest cost and emissions contributors. For example, in the base case for the chemicals template, electricity emissions represent 98% of the process emissions, which strongly implies that parameters such as the power ratings of the machines as well as the emissions factor for electricity generate model sensitivity and should be prioritized when developing strategies for effective emissions reduction. Such analysis may not be possible in more complex models, however, implying that analysis of all parameters might be necessary in such cases. Such analysis can be facilitated with the aforementioned spreadsheet add-ins or a script that automates the process of determining sensitivities.
The templates are set up to conduct uncertainty analysis. Uncertainty analysis is similar in principle to sensitivity analysis in that it tests how results vary as parameters vary, but the motivation for uncertainty analysis is characterizing the effects of uncertainty about the value of the parameters rather than identifying the most influential parameters. Sensitivity analysis often varies all parameters by the same percentage to identify the most influential ones whereas uncertainty analysis only varies parameters within their discovered range of uncertainty.
Uncertainty as a concept can take four forms:
• Metrical: uncertainty and variability in the direct measurement of data;
• Structural: uncertainty due to the complexity and validation of models;
• Temporal: uncertainty associated with what occurred in the past or what will occur in the future; and
• Translational: uncertainty associated with the communication of data (Rowe, 1994).
Any of these types of uncertainty can manifest as practitioners find conflicting parameter data from various sources. Excel data tables can be used to test how results might change within identified uncertainty ranges. The chemicals template performs this analysis using carbon dioxide cost, water cost, annual catalyst loss, and reaction temperature. These are merely examples and there will not necessarily be uncertainty about any of these in any instantiation of chemical process modeling. In this template, only assumed uncertainty related to carbon dioxide cost was found to have a noticeable effect on the results of the model. Analyzing the extent to which uncertainty affects results can be particularly helpful for early-stage LCA and TEA where there will be significant levels of uncertainty regarding technical process parameters. The structure laid out in the templates can help users investigate this and create viability benchmarks for research and development plans.
Deriving Insights and Recommendations
The development of insights and recommendations will depend on the goal of a given study. Goals specified in the chemicals template include an assessment of economic and environmental viability relative to the benchmark product, the identification of cost and emissions hotspots, and the creation of strategies to effectively increase economic and environmental viability. Given these goals, the insights of the study relate to the costs and emissions figures in the base case as well as the results of the scenario, sensitivity, and uncertainty analyses. The technical indicator of energy consumed per gigajoule of methane produced is also covered in this section of the study.
Recommendations are made based on these insights and the results of this analysis. Given the vastly higher cost and the increased emissions associated with using the process as it is described in the template, multiple innovations would be required for the process to even have a chance at achieving economic and environmental viability. When using renewable electricity, the model demonstrates that it is possible to have an emissions benefit on a per gigajoule basis. However, manufacturing costs are still well above an order of magnitude more than the price of conventional methane in this scenario, implying that significant cost reductions would still be necessary to have a chance at economic viability.
When analyzing the base case TEA indicator results in the chemicals template, the costs of the carbon dioxide captured directly from the air are four times the market price of conventional methane. Thus, there is a vast cost disparity before even factoring in labor, machinery, and energy costs. The output thus implies that this process—at least as it is described in this example template—will likely never be able to be economically viable without massive subsidies, an extreme level of innovation, or a dramatic increase in the price of conventional methane. These results can be used to craft recommendations such as ceasing development altogether, seeking extremely cheap electricity, developing relevant supporting policies, or only deploying in niche contexts where conventional methane is inaccessible or too expensive. For example, the Sabatier reaction modeled in the template has been proposed for use on Mars given the lack of fossil methane there (Vogt et al., 2019).
As shown here, the templates can be used to derive insights about and craft related recommendations for the economic and environmental performance of early-stage CCUS technologies. However, the quality, usefulness, and practicality of these insights and recommendations will depend heavily on the nature of the process and how the models are implemented along with the user's ability to discern and describe them.
Recommendations for Using the Templates
Template Selection
When using the templates presented in this study, the first step is to choose the one that most closely matches the technology under consideration. This may not be a straightforward process. Assessing an algae refinement process, for example, might be easier with the chemicals template than with the algae products template if there is no growth phase included and standard chemical engineering equipment is used in the process. Assessing the cost of synthesis of a new direct air capture sorbent would likely be easier with the chemicals template rather than the DAC template, given that the DAC template focuses on the capture aspect rather than sorbent synthesis. It may even be necessary to combine methodologies presented in different models. For example, carbonated aggregate could be used in carbonated concrete, implying that the user would either need to conduct two separate assessments or combine the corresponding templates.
The templates can be applied in performing either a TEA or an LCA. For a TEA-only study, the Impact Assessment worksheet and corresponding sections in the study relating to environmental indicators can be deleted or ignored. For an LCA-only study, the Intermediate Calculations section should be moved from the Indicators sheet to the Impact Assessment sheet before deleting or ignoring the former along with all other economic indicators and data, as this section is shared between the Indicators and Impact Assessment sheets in the default templates to ensure consistency. Certain sections in the Scope worksheet, such as Indicators or Impact Assessment Approach, will also become irrelevant if conducting just one type of assessment.
“About” and “Goal” Worksheets
The About worksheet provides useful background information about the template. The next recommended step is filling out the Goal worksheet in the presented order of the boxes. Users can add writing space to the boxes by inserting rows. Text written in these boxes can later be pasted into corresponding reports or presentations as needed. It may be necessary to return to the Limitations and Explanation box once the study is complete as study and data limitations may not necessarily be apparent from the beginning of the study. Any scenarios that are added to the bottom of the Goal worksheet will also have to be added manually to the corresponding sections in the Inventory and Interpretation worksheets. There are snapshots of the Global CO2 Initiative's guidelines throughout the templates to assist with certain aspects of the study, such as classifying the technology readiness level.
“Scope” Worksheet
Next, the Scope worksheet should be completed in the presented order of the boxes. The images on the right from the Global CO2 Initiative's guidelines can provide guidance on selecting the proper functional unit and system boundaries. The system boundaries for all the templates are gate-to-gate for the TEA and cradle-to-gate for the LCA, as the products are similar enough if not exact substitutes in all the carbon utilization models and there is no specific comparison product in the DAC model. After specifying these elements, users should then write and visually map out the process they are modeling. The unit processes and system elements described in this part of the study guide the development of the rest of the template. As new indicators and impact categories are added, subsequent sheets need to be modified accordingly. New economic and technical indicators can be added on the Indicators worksheet by inserting rows in the summary area and new impact categories can be added to the Impact Assessment worksheet by adding factors in the Impact Assessment Factors section and adding new metric calculations in the existing summary area. Calculations related to potential credits from the utilization of waste or the production of by-products and co-products must also be added manually if specified in the Scope worksheet.
“Inventory” Worksheet
Once the Goal and Scope worksheets are completed, the Inventory worksheet can be populated. Users should find and insert their own data and sources to ensure that the template is modeling their specific process.
The databases and resources listed on AssessCCUS7 can be helpful when seeking inventory data. For example, pricing and scaling data for various types of equipment may be found by referring to capital costing data in Chemical Engineering Design (Sinnott and Towler, 2020); Rules of Thumb in Engineering Practice (Woods, 2007); Analysis, Synthesis, and Design of Chemical Processes (Turton et al., 2018); Plant Design and Economics for Chemical Engineers (Peters et al., 2003); or Perry's Chemical Engineers' Handbook (Perry et al., 1997). It could also be desirable to procure vendor quotes for enhanced accuracy in TEAs, but ballpark estimates for parameters such as raw material and equipment pricing are usually sufficient to perform the desired hotspot analysis and generate order-of-magnitude estimations. Hyperlinks to many of the databases listed on AssessCCUS and the references listed here can be found in the Source Guide worksheet located in each template.
New sections should be added to the Inventory worksheet if there are aspects of a given technology assessment that merit such new, dedicated sections. For example, the aggregates template features an inventory section that is dedicated to transportation parameters given the importance of mine tailing transportation in that model. New parameters related to raw materials, labor, machines, and other factors should be added to the sheet as needed.
When modifying the Inventory sheet, it is normal for cells in the Indicators and Impact Assessment sheets to show errors. These sheets need to be adjusted manually in following steps to perform accurate calculations. However, there are some parameters that are common to most models, such as electricity cost and production volume, that are used in the subsequent worksheets and may not need to be altered even when modeling a new technology. Knowing what to edit in the workbook and what to leave alone requires some elegance and modeling experience. Repeated use of the templates may reveal certain shortcuts—such as only modifying the labor parameters and not fundamentally altering the way labor costs are calculated—that will help save even more time when conducting an assessment.
Updating desired scenarios appropriately requires careful attention. The recommended format for scenarios is already included in each template and features scenarios that can be toggled on by typing “1” into the appropriate cell. Conditional statements will be required in subsequent worksheets to perform proper calculations using this method. It is also recommended in the Inventory sheet to list all sources (such as URLs or DOI numbers) in comments on the corresponding parameter cells to allow others to track the source of the data. If there are explanations for given parameters that cannot fit into the “Notes” areas, these can be included in comments as well. The sensitivity and uncertainty analysis areas should be ignored until entering the interpretation phase of the study.
“Indicators” Worksheet
For TEAs, the next phase is working on the Indicators worksheet. The first step here is to fill out the Intermediate Calculations section to calculate intermediate parameters, such as annual operating hours and annual energy use, using static data from the Inventory sheet. Separating static data from calculations helps enable future users of the template to change input parameters without having to be concerned about breaking the model. Comments and notes in the Indicators sheet are still helpful for clarifying particular calculations to users if their function is not immediately apparent. Common intermediate calculations in the Indicators sheet include annual materials requirements, annual operating and labor hours, machine throughput, machine sizing, machine costing, machine energy use, and machine floor space. The intermediate calculations can then be used in both the Cost Model section as well as on the Impact Assessment sheet if an LCA is also being performed. Using the same calculation on both sheets avoids the need to perform these calculations multiple times and update both sections in the event of changes. When updating the cost model, it is important to ensure that annual and per unit costs are being calculated correctly and on the right basis. It is important to note that it is possible to distribute the existing cost model in the templates into the different unit processes/system elements defined in the scope phase by adding these steps in the space to the right of the existing Cost Model section, allowing for a more detailed breakdown of contributors to manufacturing costs.
“Impact Assessment” Worksheet
For LCAs, the next phase is populating the Impact Assessment worksheet. This worksheet should be approached in the same way as the Indicators sheet, carefully checking that inventory data and subsequent intermediate calculations are being manipulated in the proper way to produce the desired results. This sheet requires input of impact assessment factors, which users can source from a variety of databases, such as the ones listed in the Source Guide worksheet or on AssessCCUS.8 It is recommended to pay particular attention to credits arising from carbon dioxide utilization and co-products/by-products to ensure that results are interpreted and communicated properly. Section C.4.3 of the Global CO2 Initiative's life cycle assessment guidelines feature an in-depth treatment of how to approach handling such multi-functionality (Zimmermann et al., 2020).
“Interpretation” Worksheet
The last phase of using the templates is filling out the Interpretation sheet. The templates feature example interpretation sections that discuss results based on the placeholder data in the models. These sections must be updated manually as changes are made. According to the ISO 14040 LCA guidelines, the interpretation phase for at least LCAs involves an iterative approach, where practitioners reassess choices in other phases of the study based on whether a particular round of interpretation is satisfying the goal of the study (2006) (ISO, 2006). The approach in the templates involves first conducting scenario, sensitivity, and uncertainty analyses and then recording corresponding insights and recommendations. Scenario analysis is conducted by inputting a “1” in the appropriate cell in the Scenario Specifications section of the Scope worksheet. Sensitivity and uncertainty analyses are conducted in the templates by varying specific parameters and using an Excel data table or add-in to model how particular results change as the inputs change. Data tables can only be applied in the same sheet as where the input data is located, so these tables are located in the Inventory worksheet instead of the Interpretation one. Users can also generate visualizations and paste them into the Interpretation sheet, which each template demonstrates with the sensitivity analysis of annual production volume. Final insights and recommendations can then be analyzed further in a report or presented to the audience of the study.
Discussion
Expected Template Applications
The templates can be downloaded in the Supplementary Material. Studying and verifying the economic and environmental performance of new technologies is vital for accelerating deployment, and these pre-made templates can help various audiences learn about and expedite the assessment process. Specific potential use cases are described here.
Researchers
LCAs and TEAs for CCUS technologies are a common type of study for engineers and scientists working in the space. Characterizing the expected environmental benefits of a particular technology or pathway is important for making go/no go decisions about research pathways as well as focusing further research and development on effectively improving environmental performance. Understanding the economic performance of technologies is important for similar reasons. While most scholars are perfectly capable of performing accurate assessments, these templates can help expedite the process by removing barriers surrounding certain mundane aspects of completing studies such as structuring spreadsheets and checking for completeness and compliance with guidelines. Finally, this study may also serve as a starting point for others to build on the template approach or to generate templates for new classes of technologies.
Entrepreneurs and Corporate Development Executives
Entrepreneurs and corporate development executives will play an increasingly important role in CCUS as the technologies are commercialized. These individuals work on bridging the gap between the laboratory and the market by finding resources to help develop and demonstrate the technologies to the point when they are ready for mass deployment. Often, this audience will need a thorough understanding of the economics of the process to justify investment, and models such as these can help with understanding how costs might change depending on different scenarios or upon scaling. This information is important when developing a business case and trying to ascertain the technology's potential for value creation. Many entrepreneurs and corporate development executives are also now seeking effective ways to mitigate climate change and potentially address other environmental problems, so LCA in general is becoming increasingly relevant. Identifying both economic and environmental hotspots for developing technologies can also help innovators and businesses set benchmarks and create performance targets. The templates can also help provide clarity about the types of data and considerations that inform TEA or LCA, potentially boosting confidence when engaging with an independent consultant or a firm that will conduct such assessments on behalf of a company. Such consultants and firms may also be able to provide professional advice to businesses that are themselves constructing models or interpreting results using these templates.
Investors
Like entrepreneurs and those working in corporate development, investors need a thorough understanding of the manufacturing costs associated with a new technology at various scales to ensure that there is potential for profit. Investors may want to conduct TEAs of technologies in which they are considering investing to perform due diligence and verify claims. For environmentally-minded investors, the same applies for performing their own LCAs. These templates could help expedite the process for employees at investment firms as well as draw attention to potentially relevant considerations for certain technologies. For example, the presence of the animal feed co-product in the algae products template could help prompt important questions about other potential co-products from an algae pathway that an investor might assess.
Students
Students hoping to learn more about techno-economic and life cycle assessment may find that the templates provide a structured approach for learning about how these studies can be performed. While students could arguably glean much of this from reading peer-reviewed LCA and TEA case studies, looking at assessment spreadsheets directly and tinkering with inputs might help build a more robust schema for performing such assessments. This background can be helpful for subsequent studies on related topics or even learning about modeling generally.
Other Potential Audiences
There are various other audiences who may find value in the templates. Consulting firms and independent consultants often offer LCA and TEA services, so the templates may be of value to them. Those in the LCA and TEA practitioner community may find value from these templates and be encouraged to build similar ones for other technology classes. Policymakers and members of the public who are interested in how cost and environmental metrics for technologies are calculated might also be able to gain something of value from the templates.
Potential Expansions
The templates developed as part of this study are necessarily incomplete. Users must identify the template class that most closely matches their assessment needs, and they must adapt it accordingly depending on their own study's goals. Inventory data specific to the process under consideration by the user will need to be added to the model. Current values in the templates are placeholders, which is why specific sources are not included in the comments on each relevant cell. These values can easily be deleted if there is a desire to build a model from scratch. Further user expansion of the templates may entail (a) including more process steps; (b) adding functionality for the integration of technical, economic, and environmental indicators into the templates if required; (c) modifying system boundaries; (d) integrating more equations modeling dynamic chemical and physical phenomena; (e) expanding mass and energy balance calculations; (f) using marginal rather than average economic and environmental inventory data; (g) implementing more advanced and code-based uncertainty and sensitivity analysis; and (h) simplifying parts of the model that might offer too much detail for a given study's goal.
Conclusion
A significant amount of innovation in carbon capture, utilization, and storage must occur expeditiously for global society to meet and compensate for overshoot of emissions targets and to develop and implement a non-fossil source of carbon for carbon-based products. This level of innovation can be supported and accelerated by standardized early-stage assessment of the economic and environmental performance of various technological pathways. While there are various high-level guidelines for techno-economic and life cycle assessment of such technologies, there is a dearth of usable, customizable, spreadsheet-based templates to aid in these assessments. By identifying CCUS pathways with the highest need for early-stage template development and synthesizing existing guidelines and approaches into actual templates, this study addresses part of the assessment gap for technologies including direct air capture, chemicals, algae products, concrete, and aggregates.
There are several limitations to the template approach. Streamlined templates run the risk of obfuscating some of the complexity involved with LCA and TEA, especially in terms of determining system boundaries and modeling complex production processes. More time and resources—and possibly partnering with experienced LCA and TEA practitioners—would be required to upgrade the template models into comprehensive assessments. The necessary level of depth for assessments depends on both the TRL of the technology under consideration as well as the goals of the commissioner of the study. Separately, as the templates already contain placeholder data, there is a chance that users will not find inventory data specific to their assessment to reduce the time necessary to complete the study. Therefore, it is highly recommended that users either erase the loaded inventory data to replace with their own or justify why the data already in the templates is suitable for their assessment. This could also apply to the very structure of the model; users are encouraged to modify the structure of the models in whatever way is required to meet the needs of their particular assessment. Finally, the structure of the templates may imply that indicators such as manufacturing cost per unit and carbon dioxide-equivalent emissions per unit are the primary indicators of interest for all TEAs and LCAs. This is not the case; these are common metrics for technology assessment but are by no means the only indicators that can be assessed with these methodologies. Therefore, it is recommended that users populate the Goal and Scope worksheets in the templates carefully and modify the subsequent model accordingly. This will increase the likelihood that the ultimate model satisfies the needs of the party that commissioned the study.
With these caveats in mind, these templates will help accelerate and standardize assessment as well as educate about and promote the usage of early-stage LCA and TEA. Going forward, other researchers could build on the templates offered here by adding content to the existing templates or developing templates for new technology classes. Implementing the templates as graphical user interfaces is another opportunity that the authors are actively exploring, as this could allow for even more streamlined assessments. Integrating Python or another programming language with the template approach could allow for more advanced visualizations and sensitivity and uncertainty analyses as well as potential integration with databases. Given the coming proliferation of new technologies to assist in the mitigation of climate change, as many high-quality assessment tools as possible will be required to enable optimal decision-making.
Data Availability Statement
The original contributions presented in the study are included in the article/Supplementary Material; further inquiries can be directed to the corresponding author.
Author Contributions
GF: methodology, templates, writing, tables, and figures. GF and CM: conceptualization. GF, VS, and CM: reviewing and editing. VS: supervision and funding acquisition. All authors contributed to the article and approved the submitted version.
Funding
This work was supported by the Global CO2 Initiative at the University of Michigan and the DTE Energy Professor Endowment.
Conflict of Interest
The authors declare that the research was conducted in the absence of any commercial or financial relationships that could be construed as a potential conflict of interest.
Publisher's Note
All claims expressed in this article are solely those of the authors and do not necessarily represent those of their affiliated organizations, or those of the publisher, the editors and the reviewers. Any product that may be evaluated in this article, or claim that may be made by its manufacturer, is not guaranteed or endorsed by the publisher.
Acknowledgments
The authors kindly acknowledge William Townsend for helping create the concrete template as well as providing feedback on the other templates.
Supplementary Material
The Supplementary Material for this article can be found online at: https://www.frontiersin.org/articles/10.3389/frsus.2021.764057/full#supplementary-material
Footnotes
1. ^https://assessccus.globalco2initiative.org/glossaries.
2. ^https://corporatefinanceinstitute.com/resources/templates/excel-modeling/.; http://netbeans.apache.org/kb/docs/php/code-templates.html.; https://legaltemplates.net/.
3. ^https://assessccus.globalco2initiative.org/ccus-overview/.
4. ^https://assessccus.globalco2initiative.org/glossaries/.
5. ^https://treeplan.com/sensit/.
6. ^https://www.add-ins.com/sensitivity-analyzer.htm.
7. ^https://assessccus.globalco2initiative.org/.
8. ^https://assessccus.globalco2initiative.org/lca/databases/.
References
Bergerson, J. A., Brandt, A., Cresko, J., Carbajales-Dale, M., MacLean, H. L., Matthews, H. S., et al. (2020). Life cycle assessment of emerging technologies: evaluation techniques at different stages of market and technical maturity. J. Ind. Ecol. 24, 11–25. doi: 10.1111/jiec.12954
Biniek, K., Henderson, K., Rogers, M., and Santoni, G. (2020). Driving CO2 Emissions to Zero (and Beyond) with Carbon Capture, Use, and Storage. Available online at: https://www.mckinsey.com/business-functions/sustainability/our-insights/driving-co2-emissions-to-zero-and-beyond-with-carbon-capture-use-and-storage (accessed June 11, 2021).
Brander, M., Tipper, R., Hutchison, C., and Davis, G. (2008). Technical Paper: Consequential and Attributional Approaches to LCA: A GUIDE to Policy Makers with Specific Reference to Greenhouse Gas LCA of Biofuels. Edinburgh: Econometrica Press.
Carbon Brief (2016). Explainer: 10 Ways “Negative Emissions” Could Slow Climate Change. Carbon Brief. Available online at: https://www.carbonbrief.org/explainer-10-ways-negative-emissions-could-slow-climate-change (accessed June 11, 2021).
Chen, W., Meng, J., Han, X., Lan, Y., and Zhang, W. (2019). Past, present, and future of biochar. Biochar 1, 75–87. doi: 10.1007/s42773-019-00008-3
CO2 Removal.Org (2018). CO2 Removal Technologies. Available online at: https://co2removal.org/co2-removal/technologies/ (accessed June 11, 2021).
CO2 Sciences and Global CO2 Initiative (2016). Global Roadmap for Implementing CO2 Utilization. University of Michigan.
Cucurachi, S., van der Giesen, C., and Guinée, J. (2018). Ex-ante LCA of emerging technologies. Procedia CIRP 69, 463–468. doi: 10.1016/j.procir.2017.11.005
Dipple, G., Kelemen, P., Woodall, C. M., Renforth, P., ben Kolosz, B., Paustian, K., et al (2021). CDR Primer: The Building Blocks of CDR Systems. Avaialbe online at: https://cdrprimer.org/read/chapter-2 (accessed June 11, 2021).
Dowlatshahi, S. (1992). Product design in a concurrent engineering environment: an optimization approach. Int. J. Prod. Res. 30, 1803–1818. doi: 10.1080/00207549208948123
European Academies Science Advisory Council (2018). Negative Emission Technologies: What Role in Meeting Paris Agreement Targets? Available online at: https://easac.eu/fileadmin/PDF_s/reports_statements/Negative_Carbon/EASAC_Report_on_Negative_Emission_Technologies.pdf (accessed June 11, 2021).
Fajardy, M., Patrizio, P., Daggash, H. A., and mac Dowell, N. (2019). Negative Emissions: Priorities for Research and Policy Design. Front. Clim. 1:6. doi: 10.3389/fclim.2019.00006
Field, F., Kirchain, R., and Roth, R. (2007). Process cost modeling: strategic engineering and economic evaluation of materials technologies. JOM 59, 21–32. doi: 10.1007/s11837-007-0126-0
FixTheWEO (2021). FixTheWEO. http://www.fixtheweo.org/ (accessed June 11, 2021).
Fuss, S., Lamb, W. F., Callaghan, M. W., Hilaire, J., Creutzig, F., Amann, T., et al. (2018). Negative emissions-Part 2: costs, potentials and side effects. Environ. Res. Lett. 13:063002. doi: 10.1088/1748-9326/aabf9f
Gavankar, S., Suh, S., and Keller, A. A. (2015). The role of scale and technology maturity in life cycle assessment of emerging technologies: a case study on carbon nanotubes. J. Ind. Ecol. 19, 51–60. doi: 10.1111/jiec.12175
Global CO2 Initiative (2021a). CO2 Products and Utilization. Available online at: https://www.globalco2initiative.org/ (accessed June 11, 2021).
Global CO2 Initiative (2021b). Preview of “TEA and LCA Guidelines for CO2 Utilization (Version 2).” Available online at: https://www.youtube.com/watch?v=WjIdCqlYH1M (accessed June 11, 2021).
Green, M. (2019). World's Energy Watchdog is Undermining Climate Change Battle, Critics Say. Reuters. Available online at: https://www.reuters.com/article/us-climate-change-energy-insight/worlds-energy-watchdog-is-undermining-climate-change-battle-critics-say-idUSKBN1XM2DV (accessed July 1, 2021).
Gulzar, A., Gulzar, A., Ansari, M. B., He, F., Gai, S., and Yang, P. (2020). Carbon dioxide utilization: a paradigm shift with CO2 economy. Chem. Eng. J. Adv. 3:100013. doi: 10.1016/j.ceja.2020.100013
Hepburn, C., Adlen, E., Beddington, J., Carter, E. A., Fuss, S., mac Dowell, N., et al. (2019). The technological and economic prospects for CO2 utilization and removal. Nature 575, 87–97. doi: 10.1038/s41586-019-1681-6
Hook, L., Laval, A., Harding, R., Smith, J., Milne, R., and Hume, N. (2021). Member Countries Push Back Against IEA's Net Zero Road Map. Financial Times. Available online at: https://www.ft.com/content/4bbae4a3-cf1f-4a09-9fe5-bf2dc2ee2c9c (accessed June 11, 2021).
Hung, C. R., Ellingsen, L. A. W., and Majeau-Bettez, G. (2020). LiSET: a framework for early-stage life cycle screening of emerging technologies. J. Ind. Ecol. 24, 26–37. doi: 10.1111/jiec.12807
International Energy Agency (IEA) (2019). Putting CO2 to Use. Available online at: https://www.iea.org/reports/putting-co2-to-use (accessed June 11, 2021).
IPCC (2014). Climate Change 2014: Mitigation of Climate Change. Contribution of Working Group III to the Fifth Assessment Report of the Intergovernmental Panel on Climate Change. IPCC.
IPCC (2018). Global Warming of 1.5 °C. An IPCC Special Report on the Impacts of Global Warming of 1.5 °C Above Pre-Industrial Levels and Related Global Greenhouse Gas Emission Pathways in the Context of Strengthening the Global Response to the Threat of Climate Change, Sustainable Development, and Efforts to Eradicate Poverty. IPCC.
ISO (2006). ISO 14040:2006 Environmental Management—Life Cycle Assessment—Principles and Framework. Available online at: https://www.iso.org/standard/37456.html (accessed June 11, 2021).
Kemper, J. (2017). Biomass with Carbon Capture and Storage (BECCS/Bio-CCS). Available online at: https://ieaghg.org/docs/General_Docs/IEAGHG_Presentations/2017-03-10_Bioenergy_lecture_2_Read-Only.pdf (accessed June 11, 2021).
Lacirignola, M., Blanc, P., Girard, R., Pérez-López, P., and Blanc, I. (2017). LCA of emerging technologies: addressing high uncertainty on inputs' variability when performing global sensitivity analysis. Sci. Total Environ. 578, 268–280. doi: 10.1016/j.scitotenv.2016.10.066
Miller, S. A., and Keoleian, G. A. (2015). Framework for analyzing transformative technologies in life cycle assessment. Environ. Sci. Techn. 49, 3067–3075. doi: 10.1021/es505217a
Minx, J. C., Lamb, W. F., Callaghan, M. W., Bornmann, L., and Fuss, S. (2017). Fast growing research on negative emissions. Environ. Res. Lett. 12:9. doi: 10.1088/1748-9326/aa5ee5
Minx, J. C., Lamb, W. F., Callaghan, M. W., Fuss, S., Hilaire, J., Creutzig, F., et al. (2018). Negative emissions-Part 1: research landscape and synthesis. Environ. Res. Lett. 13:063001. doi: 10.1088/1748-9326/aabf9b
Mission Innovation (2017). Report of the Mission Innovation Carbon Capture, Utilization, and Storage Expert's Workshop. Available online at: https://www.energy.gov/sites/default/files/2018/05/f51/Accelerating%20Breakthrough%20Innovation%20in%20Carbon%20Capture%2C%20Utilization%2C%20and%20Storage%20_0.pdf (accessed June 11, 2021).
Moni, S. M., Mahmud, R., High, K., and Carbajales-Dale, M. (2020). Life cycle assessment of emerging technologies: a review. J. Ind. Ecol. 24, 52–63. doi: 10.1111/jiec.12965
National Academies of Sciences E. and M. (2019a). Gaseous Carbon Waste Streams Utilization: Status and Research Needs. Washington, DC: National Academies Press.
National Academies of Sciences E. and M. (2019b). Negative Emissions Technologies and Reliable Sequestration: A Research Agenda. Washington, DC: National Academies Press.
Núñez-López, V., and Moskal, E. (2019). Potential of CO2-EOR for near-term decarbonization. Front. Clim. 1:5. doi: 10.3389/fclim.2019.00005
Øvad, T., and Larsen, L. B. (2016). “Templates: a key to success when training developers to perform UX tasks,” in Integrating User-Centred Design in Agile Development (Berlin: Springer), 77–96. doi: 10.1007/978-3-319-32165-3_3
Perry, R. H., Green, D. W., and Maloney, J. O. (Eds.). (1997). Perry's Chemical Engineers' Handbook, 7th Edn. New York, NY: McGraw-Hill.
Peters, A. (2018). This Sparkling Water is The First Drink to Get its Fizz from CO2 Captured from the Atmosphere. Fast Company. Available online at: https://www.fastcompany.com/90281380/this-sparkling-water-is-the-first-drink-to-get-its-fizz-from-co2-captured-from-the-atmosphere (accessed June 11, 2021).
Peters, M. S., Timmerhaus, K., and West, R. E. (2003). Plant Design and Economics for Chemical Engineers, 5th Edn. New York, NY: McGraw-Hill.
Psarras, P., Woodall, C. M., and Wilcox, J. (2021). CDR Primer: The Role of Carbon Utilization. Available online at: https://cdrprimer.org/read/chapter-5 (accessed June 11, 2021).
Roh, K., Bardow, A., Bardow, A., Bardow, A., Bardow, A., Bongartz, D., et al. (2020). Early-stage evaluation of emerging CO2 utilization technologies at low technology readiness levels. Green Chem. 22, 3842–3859. doi: 10.1039/C9GC04440J
Roussanaly, S., Berghout, N., Fout, T., Garcia, M., Gardarsdottir, S., Nazir, S. M., et al. (2021). Toward improved cost evaluation of carbon capture and storage from industry. Int. J. Greenh. Gas Control 106:103263. doi: 10.1016/j.ijggc.2021.103263
Rowe, W. D. (1994). Understanding uncertainty. Risk Anal. 14, 743–750. doi: 10.1111/j.1539-6924.1994.tb00284.x
Rubin, E. S., Short, C., Booras, G., Davison, J., Ekstrom, C., Matuszewski, M., et al. (2013). A proposed methodology for CO2 capture and storage cost estimates. Int. J. Greenh. Gas Control 17, 488–503. doi: 10.1016/j.ijggc.2013.06.004
Rueda, O., Mogollón, J. M., Tukker, A., and Scherer, L. (2021). Negative-emissions technology portfolios to meet the 1.5°C target. Glob. Environ. Chang. 67:102238. doi: 10.1016/j.gloenvcha.2021.102238
Sharp, B. E., and Miller, S. A. (2016). Potential for integrating diffusion of innovation principles into life cycle assessment of emerging technologies. Environ. Sci. Tech. 50, 2771–2781. doi: 10.1021/acs.est.5b03239
Sick, V. (2021). Spiers memorial lecture: CO2 utilization: why, why now, and how? Faraday Discuss. 230, 9-29. doi: 10.1039/D1FD00029B
Skone, T. J., Mutchek, M., Krynock, M., Cooney, G., Pegallapati, A., Rai, S., et al (2019). Carbon Dioxide Utilization Life Cycle Analysis Guidance For the U.S. DOE Office of Fossil Energy. Available online at: https://www.netl.doe.gov/projects/files/NETLCO2ULCAGuidanceDocument_092019.pdf (accessed June 11, 2021).
Smith, P., Davis, S. J., Creutzig, F., Fuss, S., Minx, J., Gabrielle, B., et al. (2016). Biophysical and economic limits to negative CO2 emissions. Nat. Clim. Chang. 6, 42–50. doi: 10.1038/nclimate2870
Smith, P., Friedmann, J., Fuss, S., Deich, N., Amador, G., Minx, J., et al (2017). Emissions Gap Report 2017: Chapter 7: Bridging the Gap–Carbon dioxide Removal. Available online at: https://wedocs.unep.org/bitstream/handle/20.500.11822/22108/EGR_2017_ch_7.pdf?isAllowed=yandsequence=1 (accessed June 11, 2021).
Terlouw, T., Bauer, C., Rosa, L., and Mazzotti, M. (2021). Life cycle assessment of carbon dioxide removal technologies: a critical review. Energy Environ. Sci. 14, 1701–1721. doi: 10.1039/D0EE03757E
Thomassen, G., van Dael, M., van Passel, S., and You, F. (2019). How to assess the potential of emerging green technologies? Toward a prospective environmental and techno-economic assessment framework. Green Chem. 21, 4868–4886. doi: 10.1039/C9GC02223F
Thonemann, N., Schulte, A., and Maga, D. (2020). How to conduct prospective life cycle assessment for emerging technologies? A systematic review and methodological guidance. Sustainability 12:1192. doi: 10.3390/su12031192
Turton, R., Shaeiwitz, J. A., Bhattacharyya, D., and Whiting, W. B. (2018). Analysis, Synthesis, and Design of Chemical Processes, 5th Edn. London: Pearson.
U.S. Department of Energy (2021). Department of Energy FY 2022 Congressional Budget Request-Budget in Brief . Available online at: https://www.energy.gov/sites/default/files/2021-05/doe-fy2022-budget-in-brief.pdf (accessed June 11, 2021).
U.S. National Energy Technology Laboratory (2021). Carbon Utilization Program. Available online at: https://netl.doe.gov/coal/carbon-utilization (accessed June 11, 2021).
van der Hulst, M. K., Huijbregts, M. A. J., van Loon, N., Theelen, M., Kootstra, L., Bergesen, J. D., et al. (2020). A systematic approach to assess the environmental impact of emerging technologies: a case study for the GHG footprint of CIGS solar photovoltaic laminate. J. Ind. Ecol. 24, 1234–1249. doi: 10.1111/jiec.13027
van der Spek, M., Ramirez, A., and Faaij, A. (2017). Challenges and uncertainties of ex ante techno-economic analysis of low TRL CO2 capture technology: lessons from a case study of an NGCC with exhaust gas recycle and electric swing adsorption. Appl. Energy 208, 920–934. doi: 10.1016/j.apenergy.2017.09.058
van der Spek, M., Roussanaly, S., and Rubin, E. S. (2019). Best practices and recent advances in CCS cost engineering and economic analysis. Int. J. Greenh. Gas Control 83, 91–104. doi: 10.1016/j.ijggc.2019.02.006
Vogt, C., Monai, M., Kramer, G. J., and Weckhuysen, B. M. (2019). The renaissance of the Sabatier reaction and its applications on Earth and in space. Nat. Catal. 2, 188–197. doi: 10.1038/s41929-019-0244-4
Warsi, Y., Kabanov, V., Zhou, P., and Sinha, A. (2020). Novel carbon dioxide utilization technologies: a means to an end. Front. Energy Res. 8:574147. doi: 10.3389/fenrg.2020.574147
Woods, D. R. (2007). Rules of Thumb in Engineering Practice. Hoboken, NJ: Wiley. doi: 10.1002/9783527611119
Xie, B., Loksa, D., Nelson, G. L., Davidson, M. J., Dong, D., Kwik, H., et al. (2019). A theory of instruction for introductory programming skills. Comput. Sci. Educ. 29, 205–253. doi: 10.1080/08993408.2019.1565235
Zimmermann, A. W., Buchner, G. A., and Schomäcker, R. (2021). Apples and apples: a shortcut assessment framework for early-stage carbon capture and utilization technologies based on efficiency, feasibility, and risk. Energy Technol. 9:2000691. doi: 10.1002/ente.202000691
Zimmermann, A. W., and Schomäcker, R. (2017). Assessing early-stage CO2 utilization technologies—comparing apples and oranges? Energy Technol. 5, 850–860. doi: 10.1002/ente.201600805
Keywords: life cycle assessment, techno-economic assessment, early-stage, carbon utilization, carbon removal, templates, technology classes
Citation: Faber G, Mangin C and Sick V (2021) Life Cycle and Techno-Economic Assessment Templates for Emerging Carbon Management Technologies. Front. Sustain. 2:764057. doi: 10.3389/frsus.2021.764057
Received: 24 August 2021; Accepted: 11 October 2021;
Published: 04 November 2021.
Edited by:
Michael Carbajales-Dale, Clemson University, United StatesReviewed by:
Arpit Bhatt, National Renewable Energy Laboratory (DOE), United StatesJulien Walzberg, National Renewable Energy Laboratory (DOE), United States
Copyright © 2021 Faber, Mangin and Sick. This is an open-access article distributed under the terms of the Creative Commons Attribution License (CC BY). The use, distribution or reproduction in other forums is permitted, provided the original author(s) and the copyright owner(s) are credited and that the original publication in this journal is cited, in accordance with accepted academic practice. No use, distribution or reproduction is permitted which does not comply with these terms.
*Correspondence: Grant Faber, Z2ZhYmVyQHVtaWNoLmVkdQ==