 Flavien Binet
 François Saunier
 Manuele Margni
- 1International Reference Center for Life Cycle of Products, Processes and Services (CIRAIG), Polytechnique Montréal, Industrial Engineering, Montréal, QC, Canada
- 2International Reference Center for Life Cycle of Products, Processes and Services (CIRAIG), Polytechnique Montréal, Chemical Engineering, Montréal, QC, Canada
- 3Institute of Sustainable Energy, School of Engineering, University of Applied Sciences and Arts Western Switzerland (HES-SO), University of Applied Sciences and Arts Western Switzerland, Sion, Switzerland
This research project aims to evaluate the potential reduction of environmental impacts from circular economy strategies on an industrial sector at a regional scale with a case study on Greenhouse Gas (GHG) emissions in Quebec's steel industry and its value chain. To do so, an integrated model has been created based on the matrix approach, building on material flow analysis (MFA) tracking flows and stocks and on life cycle assessment (LCA) to compute direct (from the activity, e.g., combustion process) and indirect (from the supply chain, e.g., production of raw material inside or outside of region) emissions. This theoretical model is designed to be applied to any emissions or environmental impacts from a specific sector in a given region and enable to model the effects of circularity strategies to both flows and related environmental impacts. The overall mitigation potential of individual or combined circular economy strategies on a specific sector could thus be evaluated across its entire value chain. In the case study, a set of the most promising circular strategies applicable in the Quebec context were identified, and the GHG reduction potential within and outside the province is calculated and compared with actual emissions. Six circular strategies were analyzed acting at three different levers, namely, GHG/material (increase iron recycling rate, switch to hydrogen-based reduction production), material/product (reduce weight of vehicle, limit over-specification in building construction), and product/service (increase buildings and cars lifetime, increase car-sharing), and therefore impact rather direct or indirect emissions on different stages of the steel life cycle. Combining these six strategies into a consolidated scenario shows that a circular-driven economy allows to cut down GHG emissions of the cradle-to-gate steel industry value chain by −55%, i.e., 1.67 Mt CO2e. Taking into account use phase of steel, overall reductions are estimated at −6.03 Mt CO2e, i.e., −30% of the whole life cycle.
Introduction
Production of anthropogenic Greenhouse Gas (GHG) has increased drastically in recent decades, threatening the global balance on a long-term basis (Pecl et al., 2017; IPCC, 2018). In this context, a group of nations, including Canada, has signed an international agreement (United Nations Framework Convention on Climate Change., 2017) to mitigate the quantity of GHG release in the atmosphere and thus limiting temperature rise well below 2°C in 2050 compared with 1990. Industrial GHG emissions have long been discarded and considered hard to reduce compared with the transport, building, or electricity sectors (Allwood et al., 2012). This is mainly explained because these emissions are disseminated across multiple actors and intrinsically related to the production of materials (iron reduction, Bayer cycle and Hall–Heroult process, clinker production, industrial heat, etc.).
Circular economy is an emerging concept that aims at decoupling economic activities and environmental degradation, switching from the current linear economy “take-make-dispose” model of production and consumption to closing the resource loop by ensuring the re-cycling and re-use of the resources (Upadhyay et al., 2021a). Despite consensus around a definition is often hard to be found (Kirchherr et al., 2017), it can be defined as “a production, exchange, and consumption system which optimizes the use of resources at all stages of the life cycles of a good or a service, in a circular logic, while reducing the environmental footprint and contributing to the well-being of individuals and communities” (Quebec circulaire, 2018). Circular strategies have multiple fields of action that can be classified as improving the efficiency of service, product, or material (Material Economics, 2018). Some strategies therefore have a direct influence on the mitigation of GHG emissions, and others have an indirect influence across the life cycle (Gallego-Schmid et al., 2020). Understanding the economic and environmental implications of circular economy will require the development of new tools to facilitate the modeling of environmental implications of circular economy actions at a regional scale.
Material flow analysis (MFA) is a relevant diagnostic tool in the context of a circular economy. Both MFA and life cycle assessment (LCA) are often used to assess environmental sustainability of production and consumption systems. MFA allows to track flows and stocks of various materials in activities along the value chain at different scales, from global scale to regional and local scale. MFA has a territorial approach for a material, allowing the collection of data on exchanges between the territory and the outside and between activities within the same territory (Brunner and Rechberger, 2004). MFA makes visible trajectories followed by materials studied and identifies activities causing losses to the environment and creation of waste. LCA allows to assess environmental impact associated with a product, service, or system throughout its whole life cycle (International Standard ISO, 14040, 2006; Jolliet et al., 2015). LCA allows to assess GHG emissions and more broadly environmental profile, to identify hotspots along the life cycle and also responsibility of emission occurring in each activity.
MFA is limited to mass flows and stock assessment and does not provide information regarding the related environmental impacts. On the other hand, LCA focuses on environmental impact caused from emissions and resources consumption related to the functional unit of a product or service, without considering constraints when scaling them up to an entire sector or region (Jolliet et al., 2015). Evaluating GHG emissions or potential environmental impacts of circular economy of an entire industrial sector requires using both methodologies. Combining these two methodologies seems to be the way to address the limitations of each tool. Studies such as De Meester et al. (2019) and Turner et al. (2016) have already proposed approaches combining LCA and MFA but limited to end-of-life evaluation, although these structured studies propose specific frameworks not transposable to other regions, materials, or scales. Allwood et al. (2010) also combined MFA and LCA in a prospective approach of forecasting the evolution of different materials and the related burdens but remains at the global scale without possibility to observe in detail a given material or given region.
The purpose of this research work is to evaluate the benefits and trade-offs associated with different circular economy strategies along the value chain of a whole industrial sector at a regional scale. To do so, the following research questions were identified: (i) how to develop a systematic framework combining both MFA and LCA methodologies to assess material flows and related environmental impacts, (ii) how to guide the practitioner to apply such a mathematical framework, and (iii) how to illustrate its application through a case study assessing the mitigation potential of GHG emissions from circular economy strategies on the Quebec steel industry and its value chain.
Materials and Methods
Mathematical Framework
The mathematical framework aims to compute LCA results into an MFA for a given material at a studied regional scale. The starting point is the MFA where an LCA layer is integrated. Each activity identified within the MFA is informed with gate-to-gate life cycle inventory data and scaled up to the material flow leaving this activity. We use the matrix approach (Heijungs et al., 1992) to combine LCA and MFA. The technological matrix describes inputs and outputs of goods and services of each activity within the system under study. Activities represent extraction, transformation, production, fabrication, use, end-of life and recycling processes, and import and export of commodities associated with them. The combination of elementary flows matrix (input from and output to the environment) and characterization factors matrix describes the environmental impacts associated with the activity.
The boundary of each activity can vary according to the goal of the study (i.e., circular strategies assessed), the specificity of the material and region under study, and depending on data availability. For instance, the use phase can be subdivided into large categories (housing, transportation, etc.). The production phase can also be subcategorized into different processes or technologies that are used within the same regional context. End-of-life activities can also be subcategorized depending on whether the material returns to the life cycle (recycling, remanufacturing, repair, reuse, etc.) and is exported or considered as a loss (landfill for example). Also, import or export can be subdivided according to the origin or destination.
Each activity adds a dimension to the technological matrix. The final demand vector represents the set of flows leaving the system boundaries and fulfilling the function of the whole system. The outgoing flows are the exports at each stage of the life cycle and the functions (i.e., services) delivered by the studied material in the use phase (transportation, housing, service, consumer goods, etc.).
When the technological matrix (A) and the final demand vector (f) are set, direct and indirect demands for products and services delivered by the system are calculated through the scaling vectors as by the following:
Each activity is linked with elementary flows (emission to air and to soil, resource consumption, etc.) exchanged with the environment (matrix B) that can be scaled to the final demand through the scaling factor to compute the life cycle inventory (vector g) as per Equation (3). The characterization factors matrix Q (i.e., environmental impact per unit of environmental intervention) multiplied by the life cycle inventory vector allows to calculate the impact vector h (environmental impact scaled and aggregated by impact categories) as per Equation (4).
Just as the dimensions of the technology matrix can evolve according to the desired level of detail in the activities, it is possible to increase the dimension of the elementary flow matrix B and the characterization factors matrix Q. For example, GHG emissions can be disaggregated and classified into emissions categories according to the location: direct if the emissions are on site of the activity (process or combustion emission), indirect region if the emissions are related to goods or services supplied from inside the studied regional context, and indirect outside if the emissions are linked to goods and services produced outside the studied regional context.
For simplification purpose, it is possible to aggregate the elementary flow matrix (B) characterizing exchanges with the environment and the characterization factors matrix (Q) into an environmental impact matrix (I) assessing directly the impact score for each impact category associated with the inventory of each activity Equation (5). The matrix of elementary flow B links activities in column with emissions and resources consumption in the row. The characterization factors matrix Q links each emission and resources consumption to impact categories (Heijungs and Suh, 2002). Each column in A, B, or I represents the activities within the life cycle system, and each matrix can be multiplied by the scaling vector to obtain the final demand vector f, the inventory vector g, or the environmental impact vector h, respectively. The environmental impact matrix I links each activity in column with environmental impact in line. Therefore, the matrix I is filled with information from gate-to-gate LCA for each activity.
The impact vector for a given product system can therefore be computed as the product of the impact matrix and the scaling factor as per Equation (6).
For example, the global warming environmental impact matrix provides directly greenhouse impact score for each activity by combining environmental intervention and characterization factors:
Figure 1 describes the flow of work to assess the mitigation potential of circular strategies developed for a given material at a regional scale. The first stage determines the scope of the analysis in order to perform the AFM and identify the hotspots, i.e., the activities with the highest material flows (stage 2). Stages 3 and 4 propose an iterative workflow to adapt the scope of the analysis consistently with the assessed circular strategies. For instance, activities modeled in the first iteration could be further refined. In stage 5, each gate-to-gate activity is informed with life cycle data. The baseline model is built by populating the technology matrix A and the environmental impact matrix with life cycle data (stage 6). Finally, implementing the circular economy strategies in the baseline model, one will be able to assess variation of material flows and impacts and thus determine the potential benefits of the circular economy on the material and region under study (stage 7).
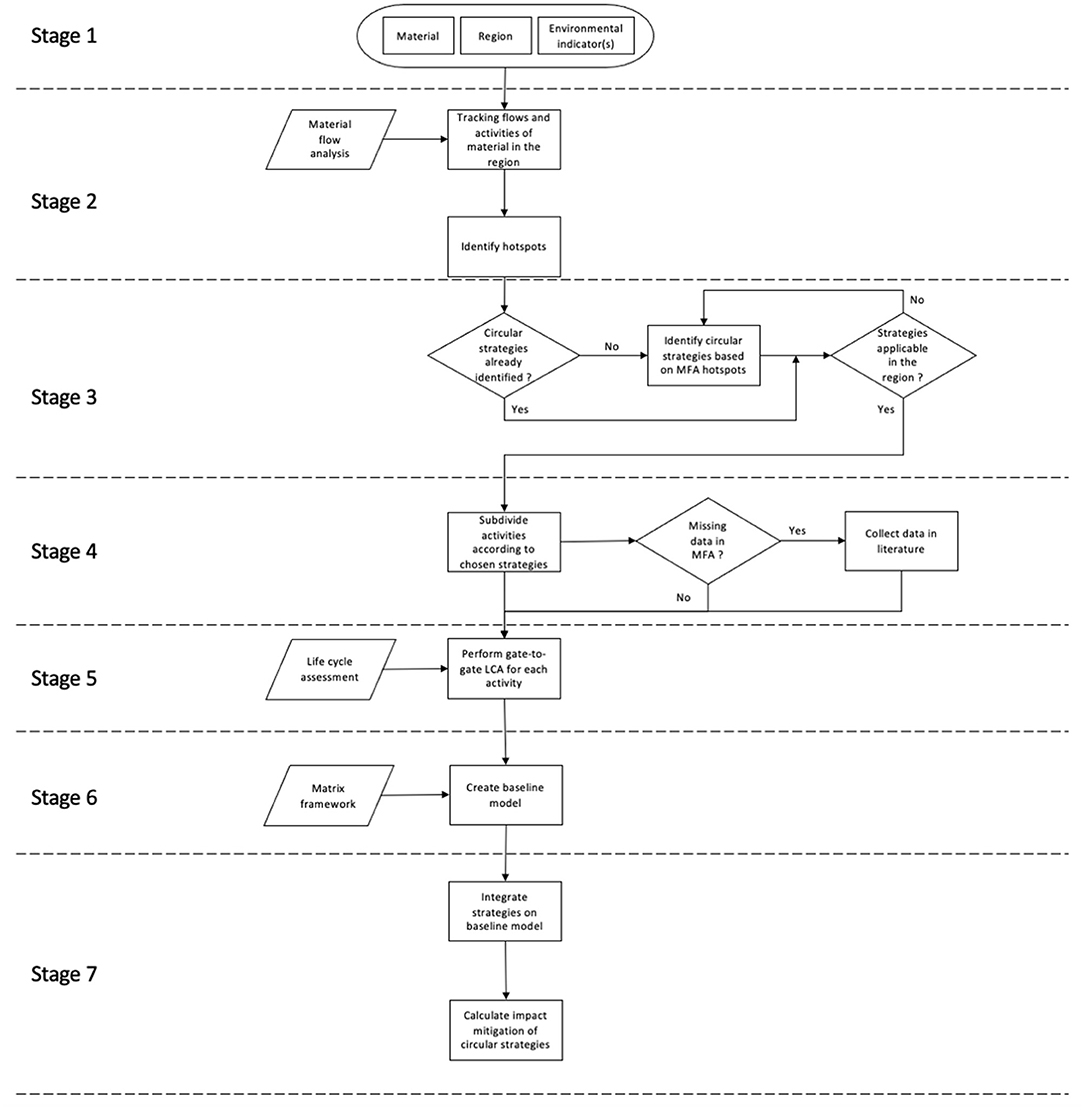
Figure 1. Flow chart of step to assess mitigation potential of circular economy strategies for a given material in a given region.
Illustrating Example
In order to illustrate how to build the matrices, we propose here an illustrative example composed of three activities within the region corresponding to the system boundaries of the MFA (P1, P2, P3), one import activity (P4), and one export activity (P5) with axy representing the flows between these activities.
Each activity gate-to-gate or cradle-to-gate adds a dimension in the matrices (in this example, the technological matrix A has a dimension of 5 × 5). Each column represents an activity (production process and consumptive process), and each line represents a flow associated with an activity (Table 1).
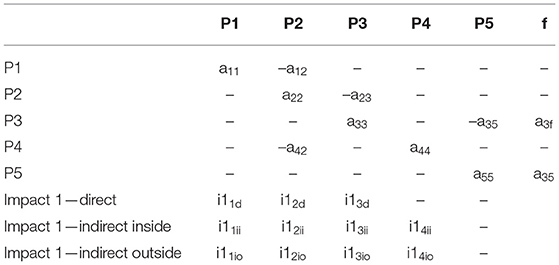
Table 1. Technological matrix A, final demand vector f, and environmental impacts matrix I of the illustrating example.
The final demand vector (f) reports the material flows leaving the system boundaries of the MFA (export flow a35) and/or service delivered by the functional unit (requiring a flow to be completed: here a3f).
In Figure 2, environmental impacts are presented for each activity (iαxy, α represents each impact category, x the activity associated with the impact, and y the location) and are differentiated according to the location: generated on site (direct, iαxd), indirectly through the supply chain within the region (indirect inside, iαxii), and outside the region (indirect outside, iαxio) through import of goods and services. This is a very simple model as environmental impacts categories associated with an activity are multiple (we can duplicate the impact lines by the number of impact categories under study); here, we illustrated only one impact category subdivided by location to illustrate the flexibility of the framework in defining different levels of detail. ix refers to the environmental impacts of this activity processing a given fixed flow (quantity in the diagonal of the matrix). Environmental impacts of the whole system scaled to the functional unit defined by the vector of final demand f are calculated using Equation (6).
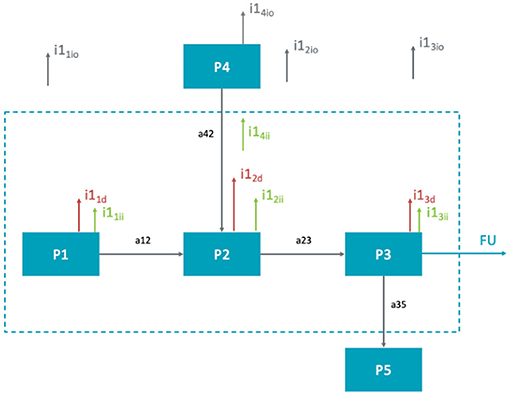
Figure 2. Illustrating example with 5 activities, axy representing flows and iαxy impacts associated to each activity.
Case Study
We applied this methodology to assess the mitigation potential of GHG emissions from circular economy strategies in the iron and steel industry (ISI) and its value chain in the regional context of Quebec, Canada (stage 1 of flowchart, Figure 1). Quebec has set itself the goal of a 37.5% reduction by 2030 and a reduction of more than 80% by 2050 of GHG emission compared with 1990 (Environment and Climate Change Canada, 2016). Today, the industrial sector represents 29% of Quebec GHG emissions with steel sector contributing to a share of 6% and mining (extraction and treatment) 6% also (Environment and Climate Change Canada, 2018; Ministère de l'Environnement et de la Lutte contre les changements climatiques, 2019). Iron and steel is a relevant sector as its entire life cycle is present in Quebec, from extraction to end of life and exchange with outside the regions occur at all stages of the life cycle.
Identification of Six Relevant Circular Strategies
Circular strategies are identified along the industrial sector value chain focusing on three efficiency levers as expressed by Equation (8) (The Circular Economy—a powerful force for climate mitigation, Material Economics, 2018):
GHG/material expressing material efficiency (emitting less to produce the same quantity of material), material/product expressing product efficiency (using less material to create the same product), and product/service expressing service efficiency (using less product to achieve the same service).
We identified (stage 3 of flowchart, Figure 1) two strategies for each lever based on the GHG mitigation potential already evaluated in previous studies for iron and steel industries or who appears to be the most promising in literature (Allwood et al., 2012; Kim and Wallington, 2013; Ryberg et al., 2018; Geerken et al., 2019; Hertwich et al., 2019; Laing et al., 2019; Material Economics, 2019; Milovanoff et al., 2019; Rissman et al., 2020; Upadhyay et al., 2021b): all end-of-life steel is recycled in Quebec (R), modification of production processes to hydrogen steel making (H), limit over-specification in building construction (O), light-weighting of vehicles (LW), extension of lifetime of buildings and vehicles (LT), and increase car-sharing (CS). A quantified description of each strategy and the data used to model them is provided in section Strategies.
Application of the MFA–LCA Framework to Evaluate the 2015 Baseline Scenario
An MFA of iron and steel value chain in Quebec has been carried out by the Institute for Environment, Sustainable Development and Circular Economy for 2015 reference year and available in Supplementary Material S1 (EDDEC, 2017), a simplified version is shown in Figure 3 (stage 2 in Figure 1).
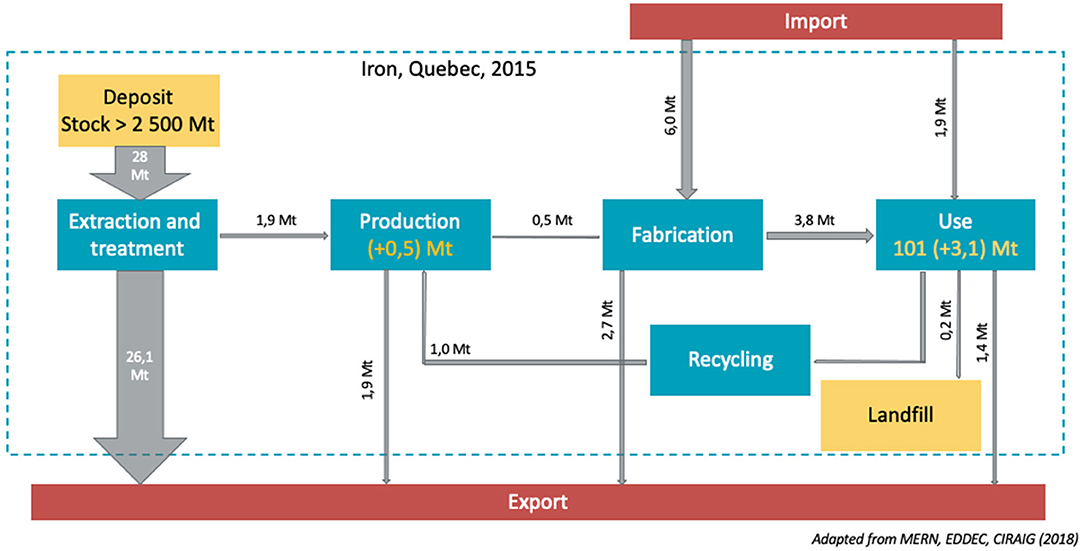
Figure 3. Detailed activities of the Quebec's iron and steel industry and value chain assess in the case study.
The scope of the analysis includes all activities occurring in Quebec from metal extraction to end-of-life management. This included all the exchanges with other Canadian provinces or countries and those with the environment. Extraction and treatment include all activities from mining to crushing, concentration and pelletizing, production includes the primary processing industry, and fabrication represents secondary and tertiary processing industries (EDDEC, 2017). This MFA shows that an important part of the iron extracted in Quebec, annually ~26.1 million tons, is directly exported as iron ore or after a first treatment in iron pellets. The vast majority of iron consumed in Quebec is imported within semi-finished products during the fabrication stage (6 Mt/year) and as finished products in consumer goods in the use phase (1.9 Mt/year). The stock of iron in use in Quebec is estimated at 101 million tons with an increase of 3.1 million tons/year (EDDEC, 2017).
The AFM allows to map the activities of the system and provides the exchanges between these activities. To evaluate the circular strategies applied on the demand (over-specifications, light-weighting, and car-sharing), we had to disaggregate the use phase into more specific activities: mobility, construction, and service (stage 4 in Figure 1).
For the use phase, all activities are separated into two categories, whether the function is delivered by already existing stock (old) or delivered by flows feeding stock in the given year (new). Emissions of manufacturing the old stock are not taken into account into the model as those emissions occurred on previous years, while emissions of manufacturing the new stock are taken into account in the production or import stage as the flow of those new product enters the use phase in the studied year. With regard to the use phase, distinction has to be made between passive products (construction and service) and active products (vehicles). The weight of vehicles influences their consumption and therefore their emissions (Kim and Wallington, 2013; Milovanoff et al., 2019). Hence, the quantity (weight) and composition (steel, aluminum) (Modaresi et al., 2014) of material used in these products (vehicles) have a direct impact on the GHG emissions (Milovanoff et al., 2019), so the fraction of iron weight of the vehicle is associated with a fraction of vehicle fuel consumption.
Mobility activity calculates the annual flow of new vehicles releases and stock of old vehicles in activity following three size categories: cars for vehicles less than 3,000 cm3 capacity, light truck for vehicles over, and truck for heavy trucks and buses. The flow and stock of iron linked to mobility in the use phase are calculated from the average weight of vehicle in each category and the corresponding steel content. Data on vehicle flow and stock (Table 2) and transport emission are found through regional statistics (SAAQ statistics: Turmel, 2017).
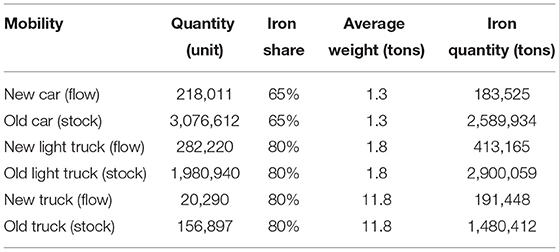
Table 2. Flow of new vehicle put on the market and stock of old vehicle in activity in Quebec in 2015.
The share of fuel consumption's emission linked to iron informs the environment impact matrix for each category of vehicles. For simplification, emissions of new and old vehicles are considered similar, but further research could address prospective consumption of vehicles. Environmental impact related to the share of iron within each type of vehicle is calculated by the following equation:
For construction and services activities, iron flow (product brought to the market in the given year) and stock (product already in activity) are extrapolated for the Quebec context using iron stock estimation link to Quebec's population (Pauliuk and Müller, 2014). Services group all other products containing iron outside of vehicles and construction products, ranging from healthcare, education, and nutrition to consumable and communication products.
The final demand vector f provides the amount of steel needed to maintain the stock supporting 1 year of mobility, 1 year of construction, and 1 year of service. The technological matrix A describing baseline scenario of the Quebec's iron situation in 2015 is described in Supplementary Material S2.
For each activity of the MFA, we perform a gate-to-gate LCA to compute GHG emissions and assess potential impacts on global warming along the value chain of ISI in Quebec (stage 5 in Figure 1), including the following sub-processes: extraction of iron ore, aggregation into iron pellets (extraction and treatment), direct reduction iron (DRI) steel production and electric arc furnace (EAF) production (production), fabrication of steel product, and recycling of end-of-life steel. In Quebec, ISI uses only DRI coupled with EAF to create steel from iron pellets and different levels of secondary steel scrap (Pineau et al., 2019). Assumption on actual secondary scrap level added in the EAF in Quebec is 30% scrap and 70% primary steel from direct reduction. The MFA informs the actual rate of post-consumption recycling at ~38.5% in Quebec (EDDEC, 2017). The rest of the iron is either exported (54%) or sent to landfill (7.5%).
Concerning the use phase, we simplified the direct GHG emissions of transport to only fuel combustion in car as it represents 99% (Roy and Ménard, 2016) of direct emission [as per Equation (9)]. For construction and service, the direct emissions are negligeable.
The life cycle inventory data are taken from the EcoInvent 3.6 database (Wernet et al., 2016). Life cycle impact assessment is performed using SimaPro? 9.1 (Pre-sustainability, 2020), using the IPCC 2013 methodology (GWP 100 years) (Stocker et al., 2013).
To model the indirect GHG emissions from imported material in the region through semi-finished and finished products in the manufacturing and use phase, we assumed a production by the principal technique used worldwide: Blast Oxygen Furnace for steel (Ryberg et al., 2018) because precise data on the exact countries from which the material originates are often hard to find. We have simplified the model here to consider that steel imported generates emissions only outside the region.
The GHG impact scores for the iron life cycle value chain of Quebec with reference year 2015 (baseline) are calculated through Equation (6) combining matrices A and I and vector f (stage 6 in Figure 1).
Strategies
Table 3 describes the circular strategies evaluated against the baseline scenario of 2015.
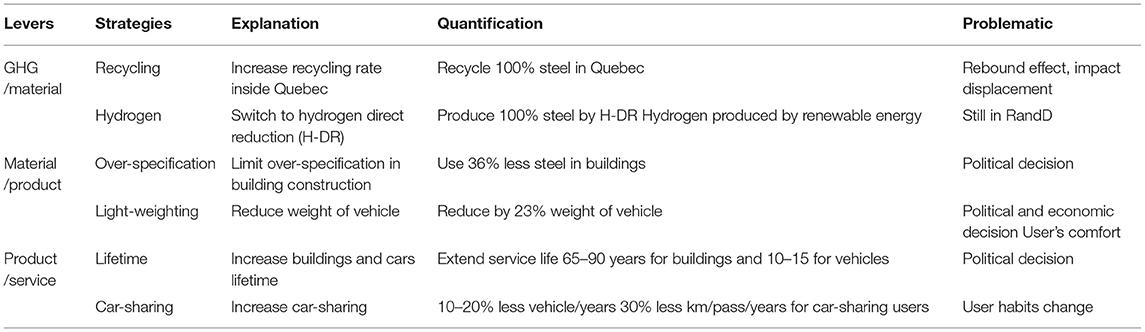
Table 3. Circular strategies in the three levers GHG/material, material/product, and product/service and modeling assumptions.
Recycling (R)
The recycling strategy focuses on the iron flows leaving the use phase in the MFA, i.e., ~2.6 million tons. One million is already recycled in the metallurgy in Quebec, 1.4 million tons is exported, and 0.2 tons ends up into the landfill (EDDEC, 2017). The recycling strategies assume 100% end-of-life recycling rate within Quebec. This new secondary steel flow (2.6 million tons/year) from the metallurgy will substitute primary steel production and therefore extraction and treatment of the corresponding amount needed of iron pellet and iron ore.
Hydrogen Steel Making (H)
Actual direct reduction in Quebec uses natural gas as energy source for primary steel making. Hydrogen direct reduction process uses a similar technology with hydrogen as energy source in substitution of natural gas (Kushnir et al., 2020). Hydrogen can be produced using water electrolysis. Vogl et al. (2018) showed that 3.48 MWh of electricity is needed to reduce 1 ton of liquid steel using hydrogen direct reduction steel making, with 2/3 use in an electrolyser to create hydrogen using electricity and the rest mainly in EAF (depending also on the amount of secondary steel use in the arc furnace). As Vogl et al. highlighted, emission intensity of electricity grid (kg CO2/MWh) highly influences the GHG emission of steel making. Quebec hydroelectricity has an emission factor of 1.3 kg CO2eq/MWh (Carbon footprint, 2019). A massive advantage for Quebec is that recycling and hydrogen steel making (H-DR) needs the same kind of infrastructure as DRI compared with BOF, with replacing natural gas combustion by hydrogen. Moreover, the hydrogen can be produced using electrolysis technology, and emission should be mitigated as Quebec's electricity comes from renewable source (95% hydroelectricity).
Over-specification (O)
Approximately 65% of steel stock in Quebec is retained in construction and represents 35–40% of additional steel needed per year. As Almirall et al. (2019) emphasized, legislation and construction code play a fundamental role in material intensity utilization, ensuring maximum quality and safety without minimizing material use for the same standard. Over-specification has been proven, and estimation ranges up to 50% of steel used in construction (Austin, 1998; Allwood et al., 2012, 2013; Moynihan and Allwood, 2014). However, this over-specification has a massive environmental impact as this extra steel contributes unnecessarily to GHG emission (Moynihan and Allwood, 2014). To follow Allwood et al. and Moynihan consideration, we assumed reduction of 36% steel needed for construction in Quebec by avoiding over-specification.
Light-Weighting (LW)
Substituting conventional material by lightweight material in vehicle reduces fuel consumption and therefore GHG emission related to burning this fuel (Kim and Wallington, 2013). A special attention must be made when substituting material to not shift impact into another stage of the life cycle (Hottle et al., 2017). Light-weighting can reduce mass by 11% in steel-intensive scenario and up to 26% in aluminum scenario (Modaresi et al., 2014). Focusing on reducing vehicles fleet to smaller car than on material substitution can reduce fuel consumption and material requirements (Dhingra and Das, 2014; Hertwich et al., 2019). Weight is a relevant indicator to reveal the share of emissions indirectly related to steel. The share of steel in vehicles ranges from 45% for trucks (80% when empty) to 65% for cars and up to 80% for light trucks (Milovanoff et al., 2019), for an average of 72% of steel for the entire fleet (car and light trucks) circulating in Quebec. As vehicle fleet is mainly made of steel, reducing vehicle weight reduces the quantity of steel needed (Milovanoff et al., 2019). Light-weighting by 25% (due to material efficiency and right-sizing) will impact import of steel in the use phase as vehicles are produced outside Quebec and imported as finished product (EDDEC, 2017). In addition, light-weighting will mitigate GHG emissions in the use phase as lighter vehicles consume less fuel and emit less GHG (Kim and Wallington, 2013).
Lifetime (LT)
Lifetime extension is often debated as an efficient solution to mitigate GHG emission in the vehicle industry; as fuel efficiency increases each year by ~1.8–3% (Hertwich et al., 2019), is it preferable to keep an old car or get a new one emitting less taking into account the production stage? (Kagawa et al., 2013). Eventually, fuel efficiency will reach a peak, and lifetime extension will become mandatory.
Lifetime extension in building is well explored to reduce resource demands and mitigate GHG emission (Müller, 2006; Hu et al., 2010), especially in Asia (Cai et al., 2015) where building life service is shorter than in the US (Aktas and Bilec, 2012) and Europe (Sandberg et al., 2016). Building lifetime is often limited by issues of use and design, more than by end of life of structural materials (Rissman et al., 2020).
In Quebec, building lifetime is estimated to be 65 years, and vehicle life service is ~10 years (Pauliuk and Müller, 2014). Hypothesis was made to increase the building life to 90 years and vehicle to 15 years. As utilities last longer, need of replacement decreases, and steel demand drops, impacting importation flow (as semi-finished product for construction and finished product for vehicle) and production flow, therefore corresponding to primary steel production and iron extraction.
Car-Sharing (CS)
Considering that personal vehicles are only used on average ~5% of their life and way beyond their capacity (on average 1/3) (ORNL/FHWA, 2017; US DOT, 2017), shifting away from personal vehicle to a new transportation system has the potential to reduce emissions (Hertwich et al., 2019). Car-sharing, ridesharing, and car-pooling increase vehicle use, appearing to be highly attractive in GHG mitigation (Yu et al., 2017; Yin et al., 2018) the higher the population density is (Chester et al., 2010). Vehicle ownership can be motivated by other reasons than simple necessity, but ownership influences vehicle utilization (Bourel, 2005) as the car-sharing user uses the car less than the owner (Communauto, 2016). Litman (2000) evaluated the reduction potential of person-km (pkm) by 40%−60%, a conservative hypothesis of 30% was made for this study for the car-sharing users. Car-sharing allows to reduce the need of new vehicle and the use of those vehicles. As vehicles are mostly produced outside Quebec and imported as finished product in the use phase (EDDEC, 2017), reduction of vehicle needed reduces the flow of steel. Hypothesis of vehicle reduction is 20% of cars and 10% of light trucks. Reduction in the number of vehicles in service impacts also the annual quantity of fuel used in Quebec (2.2.4: Lifetime).
GHG mitigation potential of each strategy is calculated (stage 7 in Figure 1) as the difference of the impact scores of each circular strategy scenario implemented at the scale of Quebec minus the baseline scenario.
Most of the strategies have a direct impact on the factors of the technological matrix (A), as flows change when implementing the strategies, except for the hydrogen steel making that modifies only the GHG emissions in the environment impact matrix (I). The cumulative GHG mitigation potential from all six strategies is calculated by implementing all circular strategies one after the other until the 6th strategy.
Results
Material Flow and Life Cycle GHG Emissions for the 2015 Baseline
Life cycle GHG emission of the iron and steel value chain in Quebec for the 2015 baseline year is illustrated in Figure 4. Direct emissions from iron and steel activities in Quebec are mainly occurring at extraction/treatment and production sites with 1.17 and 1.24 Mt CO2eq/year, respectively. Indirect emissions from their supply chains account for additional 1.81 Mt CO2eq/year (4/5 occurring outside and 1/5 within Quebec). Put in perspective with the overall life cycle emissions from the iron and steel value chain of Quebec, production and extraction/treatment activities represent 9.6% of 43.93 Mt CO2eq/year. Fabrication and use phase are the most important contributors with 35% and 54.7%, respectively. 98% of GHG emissions from fabrication activities are occurring outside Quebec, through the import of semi-finished steel products. Direct emissions are less than 2% (0.2 Mt CO2/year). Emissions related to steel-based products in the use phase amount at 16.8 Mt CO2eq/year (directly emitted in Quebec) plus 5.04 Mt CO2eq/year (indirectly emitted from finished products supplied from outside Quebec). Indirect outside QC emission from the use phase corresponds to emission due to fuel production consumed by vehicles. Emissions from recycling activities are much lower than those from primary steel production (0.03 Mt CO2eq/Mt steel and 1.2 Mt CO2eq/Mt steel, respectively) because the primary steel production process is much more energy intensive than recycling end-of-life steel that does not require the use of direct reduction and is directly diluted into the EAF.
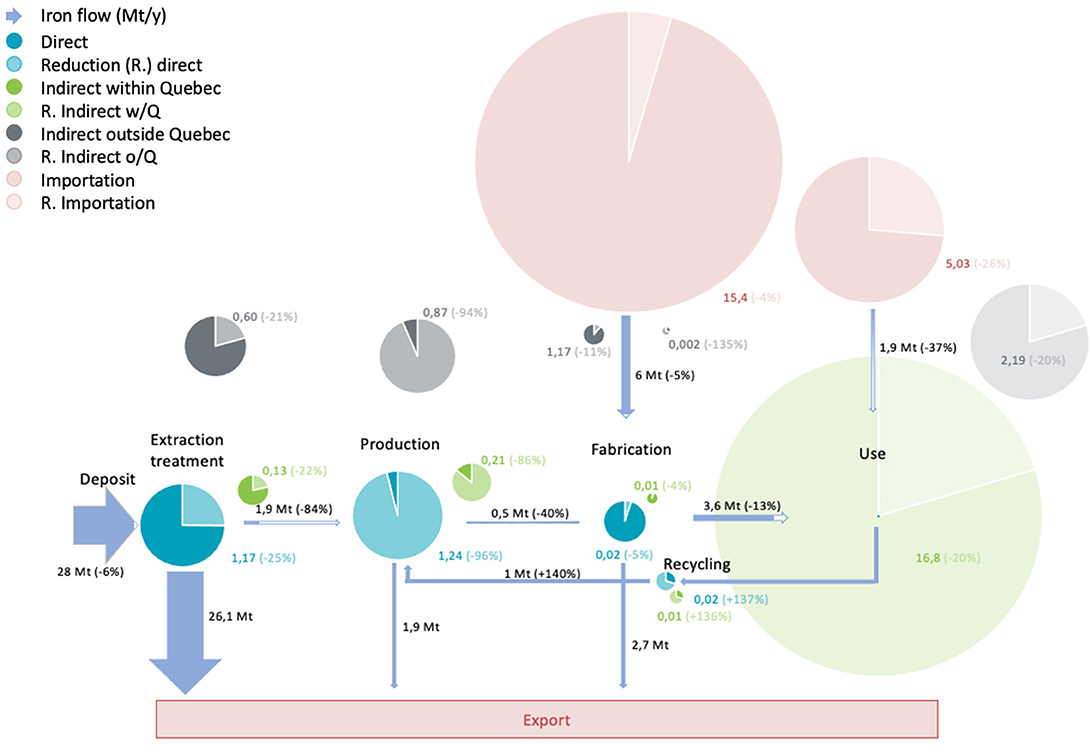
Figure 4. Model MFA-LCA for Quebec in 2016 after the implementation of circular strategies: Recyling, Hydrogen direct reduction, Over-specification, Light-weighting, Lifetime, Car-Sharing. Arrows represent flows between each activity and cercles represent emissions of each activity. The quantity (in Mt for flows and MtCO2eq for emissions) represents baseline scenario (darker parts) and the percentages are the evolution due to the implementation of the strategies (lighter parts).
Iron ore represents 13.1% of impacts from pellet production, and pellet represents 13% of steel production. Scaled to the quantity processed by the extraction activity, the impact of the extraction/treatment stage is almost the same as production. Detailed GHG emissions per sub-process is available in Supplementary Material S3. For mining in machinery-related emission, fuel consumption (7.89 kg CO2eq/ton iron ore) and explosive emission (7.70 kg CO2eq/ton iron ore) are the highest contributors. In the pelletizing process, emission related to heat production is the most impacting process as very high temperature is needed (~1,200°C, 74.3 kg CO2eq/ton iron pellet). Looking at the whole steel industry, pellet production is an important contributor (188.7 kg CO2eq/ton steel) but not as much as heat-related emission (416.2 kg CO2eq/ton steel), where high temperature is needed in the process (~1,000°C) (Allwood et al., 2012). As this heat is created mostly by burning natural gas, emission associated with extraction, production, and transport of the natural gas added up to 227.7 kg CO2eq/ton steel. One important consideration is the fact that steel captures a part of carbon from natural gas (61.5 kg CO2eq/ton steel). So, emissions from natural gas supply chain are proportionally higher than actual emission from heat production. Hotspots of the 2015 baseline scenario are therefore direct emission of the iron and steel industry (extraction, treatment, and production of steel), indirect emission of the use phase (inside and outside system boundaries), and emission related to import of semi-finished and finished steel products. LCA results per activity is provided in the environmental matrix I in Supplementary Material S2.
Assessment of Circular Economy Strategies
Each strategy impacts differently the value chain of iron and steel in Quebec. Some strategy mitigates direct emission (hydrogen for steel production) or indirect emission (light-weighting of vehicles), and some modifies flows between activities at different stages of the life cycle (recycling) or between Quebec and outside world (car-sharing) or both (over-specification of buildings, lifetime extension).
Taking a look at mitigation potential of each strategy one by one, direct emission is most impacted by hydrogen steel making (−0.9 Mt CO2eq in the production stage) and increasing recycling (−0.99 Mt CO2eq in the production stage and −0.25 Mt CO2eq in the extraction/treatment stage, for a 0.03 Mt CO2eq increase in the recycling stage). Emission from the use stage is mitigated by lightening of vehicles (−2.84 Mt CO2eq inside Quebec and −0.37 Mt CO2eq outside) and car-sharing (−0.79 Mt CO2eq inside and −0.1 Mt CO2eq outside). Considering emission from import, flow entering Quebec is mitigated mostly by increasing lifetime of vehicle and building (−0.22 Mt steel imported and −0.56 Mt CO2eq in the fabrication stage and −0.27 Mt steel imported and −0.71 Mt CO2eq in the use stage) and with lightening vehicle (−0.19 Mt steel imported and −0.5 Mt CO2eq in the use phase).
Supplementary Material S4: Table S4 reports the GHG mitigation potentials for each strategy by life cycle stage and type of emission.
Combining Circular Strategies
When modeling the integration of the six strategies all together, the GHG mitigation potential of an individual strategy might change because of the interactions between them. For example, if we implement hydrogen steel making, the gain from recycling strategy will be lower because the emissions from primary production will already be lower. Similarly, if the recycling strategy is introduced first, the gains from hydrogen steel making will be lower because the flows of primary steel to be produced will be lower. Nevertheless, whatever the order of integration, the final outcome of modeling all strategies is always the same. Figure 5 presents a waterfall diagram combining all six strategies in the order as illustrated in the x-axes. Emissions in the production stage are dropping massively (−96% direct, −86% indirect inside region, −94% indirect outside Quebec) as H-DR is a very efficient strategy to mitigate emission (Figure 5). Emissions associated with the recycling phase increase (+235% at 0.11 Mt CO2eq) as flow of steel recycled doubles (2.6 Mt).
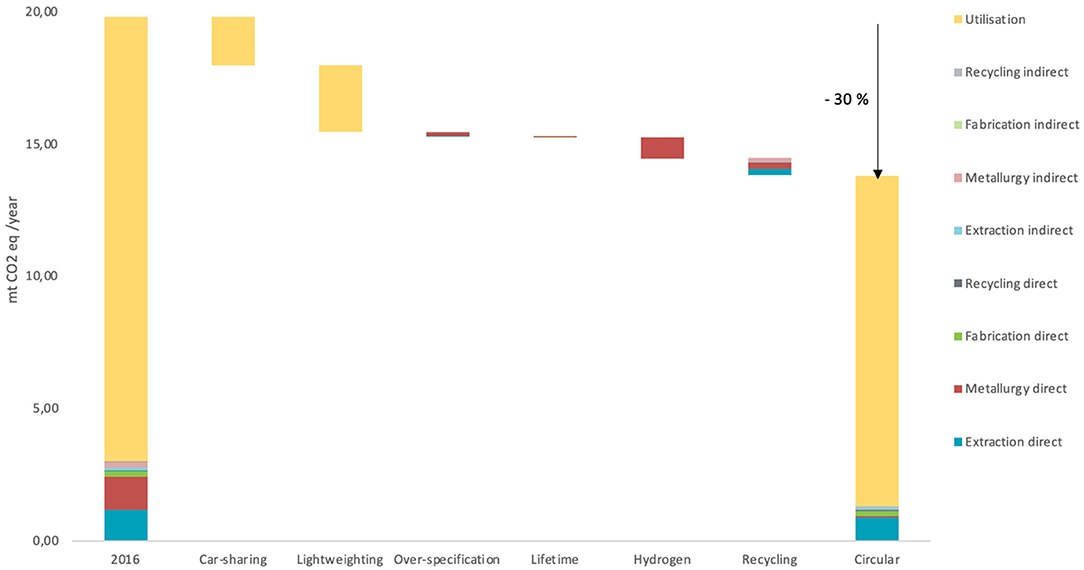
Figure 5. Breakdown of emissions in the iron and steel value chain for 2015 in Quebec depending on the step of the life cycle, and breakdown of emissions from circular strategies. Emissions associated with the use phase are represented in yellow. Only direct and indirect inside Quebec are considered, emissions outside Quebec from imported commodities are not taken into account.
Looking at the entire value chain, GHG mitigation potential can be even larger further downstream, in the use stage of the life cycle. Comparing industrial emission from the whole iron value chain (Figure 5) gives a different perspective, as we go from 3 million tons GHG a year to nearly 20 million tons GHG a year. Some strategies acting on the use phase show a larger mitigation potential than those on the ISI. Light-weighting reduces GHG emission in Quebec by 2.53 Mt CO2eq/year as hydrogen steel making (H-DR) 0.80 Mt CO2eq/year. In the first case, the indirect emissions result from the use of steel in active products, and in the second one, they relate to direct emissions in the ISI. We did not plot emissions occurring outside Quebec in Figure 5. H-DR is one of the most promising strategies to mitigate emission in the steel industry (−0.8 Mt CO2eq), and Quebec already benefits from excellent environmental conditions (already using DRI and hydropower).
Discussion
Original Research
This is not the first study making an attempt to link MFA and LCA; the literature provides few applications around the end-of-life stage: Wager et al. (2011), Kiddee et al. (2013), Rochat et al. (2013), and Sevigné-Itoiz et al. (2014). The scope of analysis of these studies is restricted around the end-of-life stage and builds on different mathematical frameworks that are not designed to be easily reproductible into other contexts. Our study expanded the scope of the analysis to account for the whole value chain of a material and provided a general framework and decision tree to guide a practitioner in applying it in any context to assess mitigation potential of circular economy strategies for any material in any region. Additionally, this framework could be applicable to already existing study providing an MFA in order to assess the mitigation potential of environmental impacts.
Case Study Limitation
The strategies presented in the case study are only some examples of circular strategies applicable in the Quebec context. Further strategies could be identified and evaluated through our model to understand the full potential of circular economy on iron and steel value chain. Some strategies could influence iron flows and the mitigation potential of GHG emission on other activities than the ones assessed in this study.
As seen in section Combining Circular Strategies, the order of implementation of the strategies might change their contribution to the impact mitigation, but no matter which order of implementation, the final result was the same. The question of the order of implementation of the strategies is therefore raised, as well as the maturity of certain solutions, some of which are applicable as of now, others still in R&D (hydrogen), some others depend on normative decisions (over-specification), in the change of consumption habits (car-sharing, light-weighting), or economic factors (recycling).
For the mobility activity in the use phase of the iron value chain, the choice has been made to model the emission of the entire Quebec fleet over 1 year and not the lifetime emissions of the fleet put into service in the studied year. In our case study, as we made the simplified assumption that the fuel consumption of new and old vehicles is the same, this modeling choice does not make a noticeable difference as long as the technology of the fleet and the number of vehicles remain stable (between the increase of light truck and the decrease of cars). However, if we consider the improvement of the vehicles consumption, the results could differ. Indeed, since impacts are dependent on vehicle emissions [as per Equation (10)], a decrease in vehicle consumption would lead to a decrease in emissions and therefore in impacts. A model taking into account the consumption of vehicles according to their market launch could be integrated into the model and refine the impacts of the mobility activity.
Framework Limitation
The mathematical framework is dependent on the quality and availability of data, especially the MFA.
The matrix approach was designed by calculating the impact scores by activity and reporting them gate-to-gate with respect to the iron flows (using LCA data and software). This allows to have the impacts in the matrix, easily understandable, and visualization of each technological change or circular strategy implementation is noticeable and comparable. Alternatively, we could have developed a technological matrix using the foreground in the matrix and disaggregating the impacts for each reference flow and not aggregated by activity. In this case, all data would have been in the matrices, and the use of third party LCA software would not have been necessary. However, the matrices would have lost clarity and ease of use to quickly compare scenarios and strategies.
The flexibility of the model is one of its great advantages; nevertheless, this flexibility is correlated to a complexification for each added activity. The activity understudy must be chosen carefully at the beginning of the assessment in order to get the maximum value of the mathematical framework. Reproducibility and robustness of the model should be assessed by applying the framework to other materials and other regions beyond this first case study on steel in Quebec.
The scope of the analysis was to study the mitigation potential of GHG emissions inside Quebec without extending the boundaries to the iron flows outside the system. For the import flows, we have considered their decrease due to the reduction of iron requirements after the application of the circular strategies. However, we did not study the benefit if some strategies were applied outside the system boundary (e.g., hydrogen steel making could reduce the emissions from steel production outside Quebec, and therefore the flow of imported goods will be less impactful in terms of GHG emissions). Similarly, we did not assess the impact of iron and steel flows leaving the system at each stage of the life cycle; these export flows were considered constant throughout the study to avoid biasing the model.
In connection with this assumption on exports, it has been considered a fixed frame of flows and emissions related to iron in Quebec (for the year 2015). Nevertheless, the model could be adapted to have a prospective vision on future flows with an evolving final demand vector (according to local consumption and adjustable exports).
Conclusion
The model developed by this research work enables to put into perspective potential impacts from GHG emissions from activities across all stages of the value chain of a material (extraction, primary production, and fabrication, also including the use phase and end-of-life) scaled at the level of a territory. This holistic view is relevant to support policy-making and other decision-makers involved in the value chain of a material, in evaluating and ranking the impact mitigation potential of circular strategies. Additionally, it sheds light on the trade-offs between material circularity and potential environmental impacts generated from onsite emissions (scope 1), indirectly from upstream activities within the territory and from outside the territory due to the import finished or semi-finished goods.
With the case study of iron and steel value chain in Quebec, our work showed that it is key to go beyond the traditional and narrow view that focuses on onsite emissions from production activities only. Including the use phase in the scope of the analysis, the GHG mitigation potential of the six circular economy strategies increased from 1.67 to 6.03 Mt CO2eq/year. Understanding the fate of the material and how it is used allows to identify the hotspots across both production and consumption activities of the material value chain at the scale of a territory and therefore identifying new levers toward a circular and decarbonized economy. The case study also emphasizes that reducing material intensity provides significant benefits in mitigating GHG emission both at the use stage and at the production stage. In this respect, circular economy is instrumental in order to achieve Quebec's 80% GHG emission reduction target for 2050.
Last but not the least, this research work provides a general framework that is replicable to other sectors and other territorial boundaries and that can be expanded on other environmental impacts.
Data Availability Statement
The original contributions presented in the study are included in the article/Supplementary Material, further inquiries can be directed to the corresponding author/s.
Author Contributions
FB: methodology, analysis, results, figures, and writing-original draft. FS and MM: supervision and writing-review and editing. All authors contributed to the article and approved the submitted version.
Funding
This research is supported by the founding of the FRQNT (Fonds de Recherche du Quebec-Nature et Technologies).
Conflict of Interest
The authors declare that the research was conducted in the absence of any commercial or financial relationships that could be construed as a potential conflict of interest.
Publisher's Note
All claims expressed in this article are solely those of the authors and do not necessarily represent those of their affiliated organizations, or those of the publisher, the editors and the reviewers. Any product that may be evaluated in this article, or claim that may be made by its manufacturer, is not guaranteed or endorsed by the publisher.
Acknowledgments
The authors are grateful for the valuable contribution to this work provided by the research team from the project on the potential of the circular economy to reduce greenhouse gas emissions of Quebec's industrial emitters.
Supplementary Material
The Supplementary Material for this article can be found online at: https://www.frontiersin.org/articles/10.3389/frsus.2021.738890/full#supplementary-material
References
Aktas, C. B., and Bilec, M. M. (2012). Impact of lifetime on U.S. residential building LCA results. Int. J. Life Cycle Assess. 17, 337–349. doi: 10.1007/s11367-011-0363-x
Allwood, J. M., Ashby, M. F., Gutowski, T. G., and Worrell, E. (2013). Material efficiency: Providing material services with less material production. Philosophic. Transact. Royal Soc. Mathematic. Physic. Eng. Sci. 371:1986. doi: 10.1098/rsta.2012.0496
Allwood, J. M., Cullen, J. M., Carruth, M. A., Cooper, D. R., and McBrien, M. (2012). Sustainable Materials: With Both Eyes Open. Cambridge: UIT Cambridge.
Allwood, J. M., Cullen, J. M., and Milford, R. L. (2010). Options for achieving a 50% cut in industrial carbon emissions by 2050. Environ. Sci. Technol. 44, 1888–1894. doi: 10.1021/es902909k
Almirall, C., Petit-Boix, A., Sanjuan-Delmás, D., de la Fuente, A., Pujadas, P., and Josa, A. (2019). Environmental effects of using different construction codes applied to reinforced concrete beam designs based on Model Code 2010 and Spanish Standard EHE-08. Eng. Struct. 179, 438–447. doi: 10.1016/j.engstruct.2018.11.013
Bourel, C. (2005). Les impacts du Métrobus de Quebec : la question du report modal. [Master's thesis]. [Université Laval].
Brunner, P. H., and Rechberger, H. (2004). Practical Handbook of Material Flow Analysis. BocaRaton/London/New York/Washington, DC: CRC Press LLC.
Cai, W., Wan, L., Jiang, Y., Wang, C., and Lin, L. (2015). Short-lived buildings in China: impacts on water, energy, and carbon emissions Environ. Sci. Technol. 49, 13921–13928. doi: 10.1021/acs.est.5b02333
Carbon footprint, (2019). Carbon Footprint—Country Specific Electricity Grid Greenhouse gas Emission Factors. Available online at: https://www.carbonfootprint.com/docs/2019_06_emissions_factors_sources_for_2019_electricity.pdf (accessed January 10, 2021).
Chester, M. V., Horvath, A., and Madanat, S. (2010). Comparison of life cycle energy and emissions footprints of passenger transportation in metropolitan regions. Atmos. Environ. 44, 1071–1079. doi: 10.1016/j.atmosenv.2009.12.012
Communauto (2016). Projet de Politique de stationnement de la Ville de Montréal. Mémoire de Communauto.
De Meester, S., Nachtergaele, P., Debaveye, S., Vos, P., and Dewulf, J. (2019). Using material flow analysis and life cycle assessment in decision support: A case study on WEEE valorization in Belgium. Resourc. Conserv. Recycl. 142, 1–9. doi: 10.1016/j.resconrec.2018.10.015
Dhingra, R., and Das, S. (2014). Life cycle energy and environmental evaluation of downsized versus lightweight material automotive engines. J. Clean. Prod. 85, 347–358. doi: 10.1016/j.jclepro.0.2014.08.107
EDDEC (2017). Métaux et économie circulaire au Quebec. Available online at: https://mern.gouv.qc.ca/publications/mines/metaux-economie-circulaire-quebec.pdf. [accessed October 22, 2019].
Environment and Climate Change Canada (ECCC) (2016). Rapport d'inventaire national 1990-2016 : sources et puits de gaz à effet de serre au Canada. Déclaration du Canada à la convention-cadre des nations unies sur les changements climatiques, Gatineau.
Environment and Climate Change Canada (ECCC) (2018). Canada's Mid-Century Long-term Low Greenhouse Gas Development Strategy. Report submitted to the United Nations Framework Convention on Climate Change.
Gallego-Schmid, A., Chen, H.-M., Sharmina, M., and Mendoza, J. M. F. (2020). Links between circular economy and climate change mitigation in the built environment. J. Clean. Product. 260:121115. doi: 10.1016/j.jclepro.2020.121115
Geerken, T., Schmidt, J., Boonen, K., Christis, M., and Merciai, S. (2019). Assessment of the potential of a circular economy in open economies—case of Belgium. J. Clean. Prod. 227, 683–699. doi: 10.1016/j.jclepro.2019.04.120
Heijungs, R., Guinée, J. B., Lankreijer, R. M., Udo de Haes, H. A., and Wegener Sleeswijk, A. (1992). Environmental life cycle assessment of products. Guide—October 1992. Centre of Environmental Science, Leiden.
Heijungs, R., and Suh, S. (2002). The Computational Structure of Life Cycle Assessment. New York, NY: Springer-Science+Business Media, B.V.
Hertwich, E. G., Ali, S., Ciacci, L., Fishman, T., Heeren, N., Masanet, E., et al. (2019). Material efficiency strategies to reducing greenhouse gas emissions associated with buildings, vehicles, and electronics—a review. Environ. Res. Lett. 14:e3. doi: 10.1088/1748-9326/ab0fe3
Hottle, T., Caffrey, C., McDonald, J., and Dodder, R. (2017). Critical factors affecting life cycle assessments of material choice for vehicle mass reduction. Transp. Res. D 56, 241–257. doi: 10.1016/j.trd.2017.08.010
Hu, M., Pauliuk, S., Wang, T., Huppes, G., van der Voet, E., and Müller, D. B. (2010). Iron and steel in chinese residential buildings: a dynamic analysis. Resour. Conserv. Recycl. 54, 591–600. doi: 10.1016/j.resconrec.2009.10.016
International Standard ISO 14040. (2006). Environmental Management—Life Cycle Assessment—Principle and Framework. Geneva: International Standard ISO 14040. ISO 14040:2006.
IPCC (2018). “Summary for Policymakers,” in Global Warming of 1.5°C. An IPCC Special Report on the impacts of global warming of 1.5°C above pre-industrial levels and related global greenhouse gas emission pathways, in the context of strengthening the global response to the threat of climate change, sustainable development, and efforts to eradicate poverty, eds V. Masson-Delmotte., P. Zhai., H.-O. Partner., D. Roberts, J. Skea, P. R. Shukla, 24.
Jolliet, O., Saade-Sbeih, M., Shaked, S., Jolliet, A., and Crettaz, P. (2015). Environnmental Life Cycle Assessment. New York, NY: CRC Press.
Kagawa, S., Hubacek, K., Nansai, K., Kataoka, M., Managi, S., Suh, S., et al. (2013). Better cars or older cars? assessing CO2 emission reduction potential of passenger vehicle replacement programs. Glob. Environ. Change 23, 1807–1818. doi: 10.1016/j.gloenvcha.2013.07.023
Kiddee, P., Naidu, R., and Wong, M. H. (2013). Electronic waste management approaches: an overview. Waste Manage. 33, 1237–1250. doi: 10.1016/j.wasman.2013.01.006
Kim, H. C., and Wallington, T. J. (2013). Life-Cycle Energy and greenhouse gas emission benefits of lightweighting in automobiles: review and harmonization. Environ. Sci. Technol. 47, 6089–6097. doi: 10.1021/es3042115
Kirchherr, J., Reike, D., and Hekkert, M. (2017). Conceptualizing the circular economy: an analysis of 114 definitions. Resour. Conserv. Recycl. 127, 221–232. doi: 10.1016/j.resconrec.2017.09.005
Kushnir, D., Hansen, T., Vogl, V., and Åhman, M. (2020). Adopting hydrogen direct reduction for the Swedish steel industry: a technological innovation system (TIS) study. J. Clean. Prod. 242, 118–185. doi: 10.1016/j.jclepro.2019.118185
Laing, T., Upadhyay, A., Mohan, S., and Subramanian, N. (2019). Environmental improvement initiatives in the coal mining industry: maximization of the triple bottom line. Product. Plann. Control Manage. Operat. 30, 426–430. doi: 10.1080/09537287.2018.1501813
Litman, T. (2000). Evaluating carsharing benefits. Transport. Res. Rec. 1702, 31–35. 10.3141/1702-04. doi: 10.3141/1702-04
Material Economics, (2018). The Circular Economy—A Powerful Force for Climate Mitigation. Available online at: https://materialeconomics.com/publications/the-circular-economy-a-powerful-force-for-climate-mitigation-1. (accessed February 1, 2020).
Material Economics, (2019). Industrial transformation 2050—Pathways to Net-Zero Emissions from EU Heavy Industry. Available online at: https://materialeconomics.com/publications/industrial-transformation-2050. (accessed February 1, 2020).
Milovanoff, A., Kim, H. C., De Kleine, R., Wallington, T. J., Posen, I. D., and MacLean, H. L. (2019). A dynamic fleet model of U.S light-duty vehicle lightweighting and associated greenhouse gas emissions from 2016 to 2050. Environ. Sci. Technol. 53, 2199-2208. doi: 10.1021/acs.est.8b04249
Ministère de l'Environnement et de la Lutte contre les changements climatiques, (2019). Registre des émissions de gaz à effet de serre. Quebec: Gouvernement du Quebec. Available online at: www.environnement.gouv.qc.ca/changements/ges/registre/index.htm. (accessed December 14, 2019).
Modaresi, R., Pauliuk, S., Lovik, A. N., and Müller, D. B. (2014). Global Carbon benefits of material substitution in passenger cars until 2050 and the impact on the steel and aluminum industries. Environ. Sci. Technol. 48, 10776–10784. doi: 10.1021/es502930w
Moynihan, M. C., and Allwood, J. M. (2014). Utilization of structural steel in buildings. Proceed. Roy. Soc. A: Mathematic. Physic. Eng. Sci. 470:170. doi: 10.1098/rspa.2014.0170
Müller, B. D. (2006). Stock dynamics for forecasting material flows—case study for housing in the Netherlands. Ecol. Econ. 59, 142–156 doi: 10.1016/j.ecolecon
ORNL/FHWA (2017). National Household Travel Survey 2017. Oak Ridge National Laboratory and US Department of Transport Federal Highway Administration.
Pauliuk, S., and Müller, D. B. (2014). The role of in-use stocks in the social metabolism and in climate change mitigation. Glob. Environ. Change 24, 132–142. doi: 10.1016/j.gloenvcha.2013.11.006
Pecl, G. T., Araújo, M. B., and Williams, S. E. (2017). Biodiversity redistribution under climate change: Impacts on ecosystems and human well-being. Science 355:6332. doi: 10.1126/science.aai9214
Pineau, P.-O., Gauthier, P., Whitmore, J., Normandin, D., Beaudoin, L., and Beaulieu, J. (2019). Portrait et pistes de réduction des émissions industrielles de gaz à effet de serre au Quebec : Volet 1 - Projet de recherche sur le potentiel de l'économie circulaire sur la réduction de gaz à effet de serre des émetteurs industriels québécois. Chaire de gestion du secteur de l'énergie, HEC Montréal.
Pre-sustainability. (2020). Simapro v8. Available online at: http://www.pre-sustainability.com/simapro (accessed September 30, 2020).
Quebec circulaire (2018). GMT, CPQ, CPEQ, EEQ. Circular Economy in Quebec—Economic Opportunities and Impacts. Available online at: http://instituteddec.org/DEV/wp-content/uploads/2018/08/circular-economy-quebec_summary.pdf. (accessed July 30, 2020).
Rissman, J., Bataille, C., Masanet, E., Aden, N., Morrow, W. R., Zhou, N., et al. (2020). Technologies and policies to decarbonize global industry: Review and assessment of mitigation drivers through 2070. Appl. Energy 266:114848. doi: 10.1016/j.apenergy.2020.114848
Rochat, D., Blinder, C. R., Diaz, J., and Jolliet, O. (2013). Combining material flow analysis, life-cycle assessment, and multi-attribute utility theory. J. Ind. Ecol. 17, 642–655. doi: 10.1111/jiec.12025
Roy, P.-O., and Ménard, J.-F. (2016). Analyse du cycle de vie comparative des impacts environnementaux potentiels du véhicule électrique et du véhicule conventionnel dans un contexte d'utilisation Québécois. CIRAIG, Hydro-Quebec.
Ryberg, M. W., Wang, P., Kara, S., and Hauschild, M. Z. (2018). Prospective Assessment of Steel Manufacturing Relative to Planetary Boundaries: Calling for Life Cycle Solution. Procedia CIRP: Elsevier B.V, 451–456.
Sandberg, N. H, Sartori, I., Heidrich, O., Dawson, R., Dascalaki, E., Dimitriou, S., Vimm-r, T., Filippidou, F., Stegnar, G., et al. (2016). Dynamic building stock modelling: application to 11 european countries to support the energy efficiency and retrofit ambitions of the EU. Energy Build. 132, 26–38. doi: 10.1016/j.enbuild.2016.05.100
Sevigné-Itoiz, E., Gasol, C. M., Rieradevall, J., and Gabarell, X. (2014). Environmental consequences of recycling aluminum old scrap in a global market. Resourc. Conserv. Recycling 89, 94–103. doi: 10.1016/j.resconrec.2014.05.002
Stocker, T. F., Qin, D., Plattner, G. K., Tignor, M. M. B., Allen, S. K., Boschung, J., Nauels, A., Xia, Y., Bex, V., and Midgley, P. M. (2013). IPCC Climate Change 2013: The Physical Science Basis. Working Group I Contribution to the Fifth Assessment Report of the Intergovernmental Panel on Climate Change. Cambridge: Cambridge University Press.
Turmel, É. (2017). Société and de l'assurance automobile du Quebec, Direction de la recherche et du développement en sécurité, routière Dossier statistique : Bilan 2016 : accidents, parc automobile, permis de conduire. Available online at: https://saaq.gouv.qc.ca/fileadmin/documents/publications/espace-recherche/dossier-statistique-bilan-2016.pdf. (accessed August 14, 2020).
Turner, D. A., Williams, I. D., and Kemp, S. (2016). Combined material flow analysis and life cycle assessment as a support tool for solid waste management decision making, J. Clean. Product. 129, 234–248. doi: 10.1016/j.jclepro.2016.04.077
United Nations Framework Convention on Climate Change, (2017). Paris Agreement—Status of Ratification. Available inline at: http://unfccc.int/paris_agreement/items/9444.php. (accessed January 20, 2020).
Upadhyay, A., Kumar, A., and Akter, S. (2021a). An analysis of UK retailer's initiatives toward circular economy transition and policy-driven directions. Clean Technolo. Environ. Policy. 21, 1–9. doi: 10.1007/s10098-020-02004-9
Upadhyay, A., Kumar, A., Kumar, V., and Alzaben, A. (2021b). A novel business strategies framework of do-it-yourself practices in logistics to minimize environmental waste and improve performance. business strategy and the environment. Early view. 28:46. doi: 10.1002/bse.2846
US DOT. (2017). How Much Time Do Americans Spend Behind the Wheel? Volpe National Transportation Systems Center. Available online at: https://volpe.dot.gov/news/how-much-time-doamericans-spend-behind-wheel. (accessed October 1, 2020).
Vogl, V., Åhman, M., and Nilsson, L. J. (2018). Assessment of hydrogen direct reduction for fossil-free steelmaking. J. Clean. Prod. 203, 736–745. doi: 10.1016/j.jclepro.2018.08.279
Wager, P. A., Hischier, R., and Eugster, M. (2011). Environmental impacts of the Swiss collection and recovery system for Waste Electrical and Electronic Equipment (WEEE): A. follow-up. Sci. Total Environ. 409, 1746–1756. doi: 10.1016/j.scitotenv.2011.01.050
Wernet, G., Bauer, C., Steubing, B., Reinhard, J., Moreno-Ruiz, E., and Weidema, B. (2016). The ecoinvent database version 3 (part i): overview and methodology. Int. J. Life Cycle Assess. 21, 1218–1230. doi: 10.1007/s11367-016-1087-8
Yin, B., Liu, L., Coulombel, N., and Vigui,é, V. (2018). Appraising the environmental benefits of ride-sharing: the Paris region case study. J. Clean. Prod. 177, 888–898. doi: 10.1016/j.jclepro.2017.12.186
Keywords: circular economy, life cycle assessment, material flow analysis, iron and steel, quantitative method
Citation: Binet F, Saunier F and Margni M (2021) Assessing the Mitigation Potential of Environmental Impacts From Circular Economy Strategies on an Industrial Sector and Its Value Chain: A Case Study on the Steel Value Chain in Quebec. Front. Sustain. 2:738890. doi: 10.3389/frsus.2021.738890
Received: 09 July 2021; Accepted: 06 October 2021;
Published: 11 November 2021.
Edited by:
Michal Miedzinski, University College London, United KingdomReviewed by:
Arvind Upadhyay, University of Brighton, United KingdomKiriaki M. Keramitsoglou, Democritus University of Thrace, Greece
Copyright © 2021 Binet, Saunier and Margni. This is an open-access article distributed under the terms of the Creative Commons Attribution License (CC BY). The use, distribution or reproduction in other forums is permitted, provided the original author(s) and the copyright owner(s) are credited and that the original publication in this journal is cited, in accordance with accepted academic practice. No use, distribution or reproduction is permitted which does not comply with these terms.
*Correspondence: Flavien Binet, Zmxhdmllbi5iaW5ldEBwb2x5bXRsLmNh