 Hans Böhm
 Markus Lehner2
- 1Energieinstitut an der Johannes Kepler Universität, Linz, Austria
- 2Montanuniversität Leoben, Chair of Process Technology and Industrial Environmental Protection, Leoben, Austria
- 3Montanuniversität Leoben, Chair of Energy Network Technology, Leoben, Austria
Energy-intensive industries still produce high amounts of non-renewable CO2 emissions. These emissions cannot easily be fully omitted in the short- and mid-term by electrification or switching to renewable energy carriers, as they either are of inevitable origin (e.g., mineral carbon in cement production) or require a long-term transition of well-established process chains (e.g., metal ore reduction). Therefore, carbon capture and utilization (CCU) has been widely discussed as an option to reduce net CO2 emissions. In this context, the production of synthetic natural gas (SNG) through power-to-methane (PtM) process is expected to possess considerable value in future energy systems. Considering current low-temperature electrolysis technologies that exhibit electric efficiencies of 60–70%el, LHV and methanation with a caloric efficiency of 82.5%LHV, the conventional PtM route is inefficient. However, overall efficiencies of >80%el, LHV could be achieved using co-electrolysis of steam and CO2 in combination with thermal integration of waste heat from methanation. The present study investigates the techno-economic performance of such a thermally integrated system in the context of different application scenarios that allow for the establishment of a closed carbon cycle. Considering potential technological learning and scaling effects, the assessments reveal that compared to that of decoupled low-temperature systems, SNG generation cost of <10 c€/kWh could be achieved. Additional benefits arise from the direct utilization of by-products oxygen in the investigated processes. With the ability to integrate renewable electricity sources such as wind or solar power in addition to grid supply, the system can also provide grid balancing services while minimizing operational costs. Therefore, the implementation of highly-efficient power-to-gas systems for CCU applications is identified as a valuable option to reduce net carbon emissions for hard-to-abate sectors. However, for mid-term economic viability over fossils intensifying of regulatory measures (e.g., CO2 prices) and the intense use of synergies is considered mandatory.
Introduction
Based on its goal of achieving climate neutrality by 2050 and reducing greenhouse gas emissions to at least 55% below 1990 levels by 2030, the European Union has just recently tightened its climate target plan (EC, 2020). While major efforts toward these goals have been put forth by the extension of renewable power sources, the requirement for alternative energy carriers such as renewable gases remains evident (Jensen et al., 2020). Particularly for industrial production processes, decarbonization by electrification is not always possible due to the required energy densities or the process-related demand for specific materials or gases. Additionally, individual production processes induce carbon emissions that are not fuel-related, and thus, they are still present in scenarios with a completely sustainable energy supply. For example, this applies to mineral industries such as cement production, where up to two-thirds of the CO2 emissions are related to carbon that is bound to raw materials. Hence, carbon capture and storage (CCS) or utilization (CCU) is an inevitable measure of according roadmaps to carbon neutrality (CEMBUREAU, 2020). Similar requirements apply to heavy industry processes such as crude steel production that currently rely on long-term optimized and well-established processes, where a transition to renewable processes requires the establishment of fundamentally different production routes (Rechberger et al., 2020). Intermediate alternatives based on the methanation of steel gases that are available in conventional steel production processes have been previously investigated (Rosenfeld et al., 2020).
In this context, power-to-gas or power-to-methane can be considered as a valuable option for utilizing these process-related carbon emissions and generating a re-integratable substitute fuel (or process gas). Based on the implied requirement for carbon capture and internal reuse, closed carbon cycles can be created to thus omit net carbon emissions. However, the available low-temperature electrolysis technologies only allow for moderate system efficiencies of 46–60%LHV, related to the lower heating value (LHV) (Buttler and Spliethoff, 2018). In combination with catalytic methanation, the overall power-to-methane efficiency is ~40–50%LHV when assuming complete conversion (Frank et al., 2018). With solid oxide electrolysis (SOEL), higher electric efficiencies can be achieved due to operation at temperatures of 600–1,000°C (Zheng et al., 2017), particularly when supplied with steam (Buttler and Spliethoff, 2018). The appropriate heat demand can be supplied from external sources or, in the case of power-to-methane, from the exothermal methanation process that can be operated at temperatures of 250–700°C (Götz et al., 2016; Rönsch et al., 2016). Additionally, SOEL technology provides the ability to perform co-electrolysis of H2O and CO2, thus allowing for the generation of a suitable syngas composition for the downstream methanation process (Banerjee et al., 2018; Biswas et al., 2020). These synergies allow to significantly increase the overall system efficiencies by a high thermal integration of the electrolysis and the methanation process (see Figure 1). In particular, the waste heat emitted in the methanation reactor is directly utilized to evaporate and preheat the water supply for the steam-driven co-electrolysis without external heat supply. Thus, the external energy demand, primarily electricity, is reduced by the heat of evaporation or beyond depending on individual operating conditions. By implementing these systems at or in close proximity to relevant industries efforts for storage, transport and distribution could additionally be reduced and thus efficiencies increased even further.
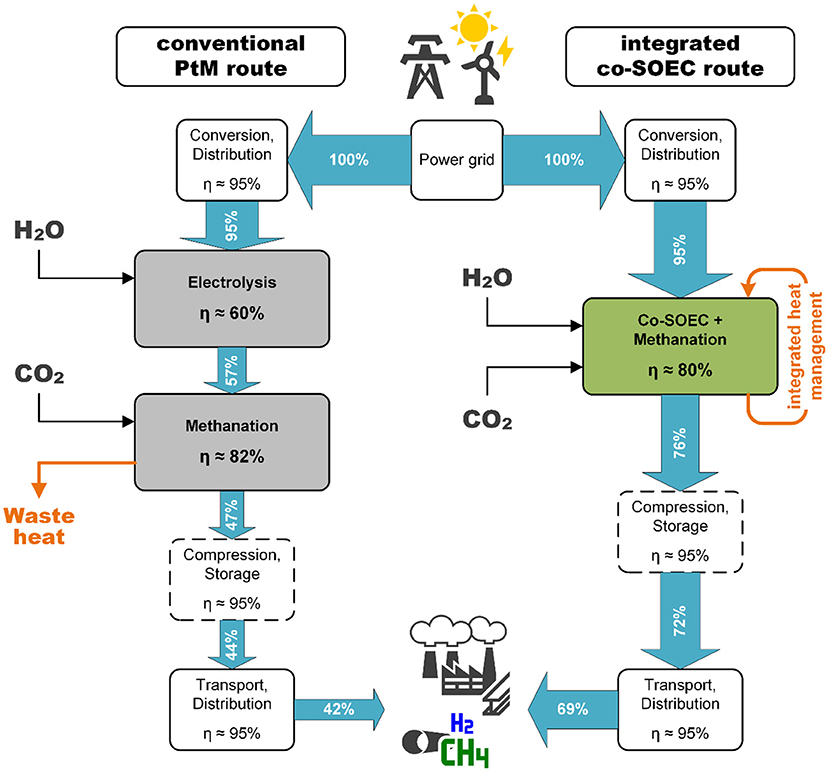
Figure 1. Comparison of efficiency chains of power-to-methane routes using conventional technologies vs. the thermally integrated co-electrolysis approach.
The resulting gross reaction equations for an appropriate combination of co-electrolysis and CO methanation are provided in Equations (1 and 2) according to a previous study (Krammer et al., 2021). With thermal integration, an overall thermal efficiency of 83%LHV could be achieved for the power-to-methane process.
Considering these elevated efficiencies, such a system is also expected to provide higher economic competitiveness in regard to operation than are conventional power-to-gas systems. The general positive effect of heat integration for high-temperature electrolysis in terms of hydrogen production was reported by Buttler et al. (2015). The significant increase in the efficiency of power-to-X processes by thermal integration of co-electrolysis and downstream synthesis, like Fischer-Tropsch, was also found by Herz et al. (2018). More recently, Zhang and Desideri (2020) determined that co-electrolysis-based power-to-methanol implementations can reach payback times of 3–5 years for optimized systems. While former studies emphasize the impact of electricity prices on product generation costs, the competitiveness of such a system is highly dependent upon the costs of the SOEL stack. Since high-temperature electrolysis technology is still in a lab-scale and R&D status (Grigoriev et al., 2020), current investment costs are expected to decrease considerably. Hence, the present study considers the impact of learning and scaling effects for future implementation scenarios as projected by Böhm et al. (2020). Additionally, recent studies have demonstrated that the utilization of by-product oxygen significantly impacts the techno-economic performance of power-to-gas plants in certain application scenarios (Röben et al., 2021). Therefore, this impact was closely managed within this study.
To ensure sustainable production and reutilization of synthetic gas from fossil carbon, the use of renewable power is mandatory in addition to the establishment of a closed carbon cycle. Therefore, the direct integration of renewable energy sources such as wind or photovoltaics (PV) is a major topic for future power-to-gas plants. The flexibility to follow intermittent production and to operate in a grid-supportive manner is an important factor in successfully applying power-to-gas processes for decarbonization (Schreiber et al., 2020). However, due to comparably long start-up times and high standby energy demand (Buttler and Spliethoff, 2018; Smolinka et al., 2018), high-temperature electrolysis is often considered as less suitable for operation with intermittent energy sources. This aspect was thus given attention to in the evaluation of electricity supply in the investigated implementation scenarios.
The present study aims to analyze the competitiveness of co-electrolysis-based power-to-gas implementations in application scenarios that are not expected to become completely carbon neutral in the mid- or long-term based on their origin. Therefore, a comprehensive techno-economic assessment was performed under the presumption of the creation of closed carbon cycles. Hence, appropriate costs for CO2 capture and emission abatement savings are taken into account. Additionally, to increase the techno-economic performance, the potential for internal and external utilization of by-products is considered. While focusing on two apparent implementation scenarios, the study does not intend to cover all relevant use cases. Instead, it identifies economic performance of the technology that come with an exploitation of synergy potentials.
Materials and Methods
System Boundary and Process Definition
The analyses in this study focus on the integrated power-to-gas system that includes co-electrolysis and catalytic methanation. The system is presumed to be implemented in close proximity to an industrial carbon source (industrial site) that simultaneously utilizes the produced gas as a substitute natural gas (SNG). Thus, the system enables a closed carbon cycle without net carbon emissions. Process streams such as electricity, CO2, and O2 from and to the power-to-gas system are only considered according to their energetic and economic values and are otherwise outside of the system boundary. The process scheme is illustrated in Figure 2.
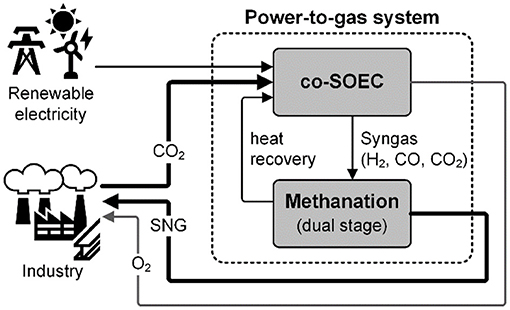
Figure 2. System boundary of the power-to-gas system establishing a closed carbon cycle with the integrating industry (bold streams).
Due to the thermal coupling of the co-electrolysis and methanation subsystems, the power-to-gas system is expected to achieve an overall electric efficiency of > 79% that is related to the LHV of the product gas. This type of process is currently under development in the Austrian flagship research project HydroMetha that targets (FFG, 2018) an overall electric efficiency of >80% without external heat integration. Thus, the projections for future scenarios presume an increase in efficiency up to 82.5% by 2050. The general feasibility of these efficiencies was confirmed by a previous study (Wang et al., 2019). Although the industrial scenarios investigated in the techno-economic study aim for high annual loads of the appliance, the investigations examining direct supply from wind power imply the occurrence of part-load operation. However, as appropriate studies on the part-load operation of high-temperature electrolysis have suggested (Buttler et al., 2015; Sanz-Bermejo et al., 2015), an operation exhibiting constantly high efficiencies is possible and presumed as feasible for the analyses. Additionally, for large-scale applications, part-load operation will be less of an issue due to the incorporation of modularization (Smolinka et al., 2018).
The methanation subsystem is considered as a two-stage and dual pressure level methanation process. This configuration was investigated by Krammer et al. (2021) with relation to integration with co-electrolysis as part of the HydroMetha project. Their analyses revealed that a two-stage process with intermediate compression to up to 10 bar resulted in the highest methane concentrations in the product gas. For the calculations herein, a product gas composition with a methane content of 89.0% and a hydrogen content of 9.5% was assumed, resulting in an LHV of the product gas of 9.13 kWh/m3. Although a hydrogen content of >4 vol% does not allow for a direct feed-in to Austrian public gas grids without further processing, the product gas is presumed to be suitable for industrial combustion processes as a natural gas substitute (Krammer et al., 2021). The substitution of conventional fuels is considered equivalent to the LHV.
For dual-level pressure methanation, an intermediate compression of the co-electrolysis synthesis gas is necessary. Therefore, isothermal compression with an electric energy demand of 0.153 kWh per m3 at an efficiency of 75% according to a previous study (Campbell et al., 2014) was presumed. Based on the industrial application scenarios and similar load flexibility and thermal integration of the electrolysis and methanation processes, the requirement for additional (intermediate) gas storage in the investigated use cases was omitted.
Scenario Definition and Implied Parameters
Based on the constraints inherent to the decarbonization of these well-established industries and their local value in the Austrian energy transition, cement production and primary steelmaking were chosen as relevant use cases for this techno-economic CCU assessment. Furthermore, due to the evaluated process temperatures, both applications provide the potential for additional heat integration. The different integrations of the power-to-gas process for these scenarios are discussed below. However, both scenarios share certain implications such as utilization of oxygen or participation in the European emission trading system (EU ETS).
For the evaluations presented in the scope of the present paper, only the economic effects of synergetic utilization of products (SNG and oxygen) and recycling of carbon emissions are considered in relation to the defined use cases. Thus, the underlying process configurations and potentially required adaptions are considered to be available and feasible. The parameters related to the application scenarios are summarized in Table 1 and are justified in subsequent chapters.
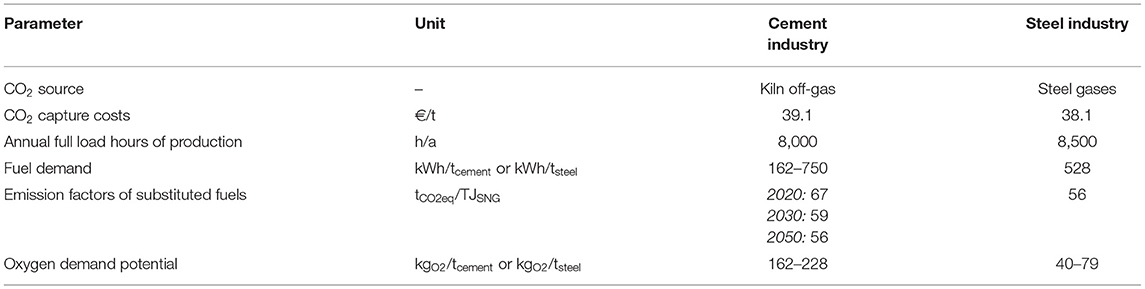
Table 1. Scenario-specific calculation parameters.
Cement Production
The production of cement results in the emission of 0.54 t CO2 per ton cement (IEA, 2018). According to Rodin et al. (2020), the average per-site emissions of cement plants under the EU ETS account for ~266 kt per year. As 60–65% of these emissions are related to the calcination process (CEMBUREAU, 2020) and thus are not directly affected by switching to renewable fuels, approaches for CCU/CCS are mandatory for the decarbonization of this industry sector.
In addition to amine-based CO2 capture, calcium looping, and membrane-based technologies, oxyfuel combustion is a widely discussed option to capture CO2 from the calcination process (Rolfe et al., 2018; Ditaranto and Bakken, 2019; Voldsund et al., 2019). This would allow for a high concentration of CO2 (> 95 vol%) to be present in the flue gas and thus reduce the efforts required for separation and conditioning for utilization. Therefore, the combustion air is substituted with oxygen to eliminate the presence of inert nitrogen. The required oxygen is commonly produced by dedicated cryogenic air separation (CAS). With the integration of electrolysis, the generated by-product oxygen could (partially) substitute the need for external production, thus reducing the operational costs of the oxyfuel process. According to a previous study (Carrasco-Maldonado et al., 2016), the O2 demand for oxyfuel in a medium-sized cement production plant is estimated to be ~0.25–0.35 t O2 per ton clinker or 162–228 kgO2/tcement at a clinker to cement ratio of 0.65 (IEA, 2018).
Based on Austrian industry data, (VÖZ, 2017) the fuel demand per ton cement produced is ~750 kWh, and ~78% (i.e., 588 kWh) of this is covered by alternative fuels. The residual non-electric energy demand is supplied by fossil fuels (coal, fuel oil, coke, and natural gas). Despite the relatively low content of natural gas (~0.66 m3/tcement), it is presumed that the use of solid and liquid fossil fuels is driven by economic aspects rather than by technical reasons, and thus, a substitution by SNG is possible.
Steel Production
Although the direct reduced iron (DRI) process using hydrogen is a current topic of extensive research for renewable hydrogen production (Rechberger et al., 2020), it requires a complete adaptation of well-established and highly efficient processes. As these transitions of production require long-term efforts, alternative pathways for the integration of renewables and internal utilization of carbon emissions have been investigated (Rosenfeld et al., 2020; Medved et al., 2021). Additionally, natural gas is still required for post-processing within integrated steelworks such as hot and cold rolling. These demands could be substituted by SNG from the methanation process in the mid-term while capturing and utilizing carbon emissions. Additionally, high-temperature electrolysis would already be established for a long-term transition to hydrogen-based direct reduction.
The scenario evaluated herein presumes the integration of the power-to-gas plant into a conventional integrated steel plant implementing blast furnace (BF) and basic oxygen furnace (BOF) according to a previous study (Rosenfeld et al., 2020). The natural gas demand in this configuration is ~528 kWh per ton of crude steel. Depending on the individual configuration of the steelwork, additional utilization paths for SNG may be available within the steelwork.
To provide oxygen for the steelmaking process for use in the converter in the conventional routes or in the subsequent electric arc furnace (EAF) process in the DRI route, integrated steelworks possess a dedicated oxygen production plant for cryogenic air separation (CAS). This oxygen demand can be partially supplied by the integrated electrolysis process, thus reducing the operational costs of the overall steelmaking process. According to a previous study (Kirschen et al., 2011), the oxygen demand for DRI-based steel production is 28 m3/tsteel, while it is ~55 m3/tsteel for the BOF route (Bieda, 2012).
Oxygen Supply
In addition to the main product hydrogen, the co-electrolysis process produces oxygen as a by-product (see Equations 1 and 2). Although it is available as a separate stream from water and carbon dioxide splitting, it is typically emitted to the atmosphere without further use. Based on stoichiometric reaction and full conversion, 2 mol oxygen per mol methane (4 kgO2/kgCH4) are produced. Potentially higher amounts that are caused by intentional hyperstoichiometric hydrogen production as a means to ensure complete carbon conversion are neglected in relation to methane as the target product.
As previously mentioned, oxygen used for large-scale supply (>200 t/d) is conventionally produced by CAS units (Luo and Liu, 2018). However, separation from ambient air is conducted with high electric energy demands of ~250–300 kWh per ton O2 (Wu et al., 2018). To evaluate the economic impact of by-product oxygen use in the investigated scenarios, the costs of conventional oxygen supply were assessed in comparison to those that have been previously published. The available data range from ~50 €/tO2 (Kuparinen and Vakkilainen, 2017; Rosenfeld et al., 2020) to 150 €/tO2 (Guilera et al., 2018). Consistent with other data within that range (Breyer et al., 2015; Parra et al., 2017), a reference price of 85 €/tO2 was used.
CO2 Certificates and Capture Potentials
As previously mentioned, the investigated application scenarios provide significant amounts of process-related CO2 emissions. For cement production, the average emission of 0.54 tCO2/tcement with up to 65% from mineral origin (cf. section Cement Production) results in ~350 kg of non-fuel-related CO2 emissions per ton cement. According to previous reports (Bains et al., 2017; Rodin et al., 2020), the appropriate capture costs for carbon emissions in this industrial sector are 22–35 €/tCO2, with a capture efficiency of up to 90%. However, this range is related to post-combustion capture and lower CO2 content in the flue gas compared to that of the oxyfuel process. Thus, for the consideration of an oxyfuel scenario, the input costs of CO2 for the power-to-gas process are presumed to be at the lower end of this range. The fuel substituted in the cement scenario represents a mix of fossil fuels (coal, fuel oil, natural gas) and refuse-derived fuels. Based on the sustainability reports from the Austrian cement industry association (VÖZ) and common emission factors, the average emissions relate to ~67 t CO2 per TJ of fuel used today (VÖZ, 2015, 2017; Jurich, 2016). Presuming that the use of coal and fuel oil will be omitted predominantly to achieve future emission targets, and the used refuse-derived fuels reach emission levels in the range of natural gas (cf. VÖZ, 2015), and the average emissions of the fuels to be substituted by the produced SNG are expected to be equivalent to the emission factors of natural gas at 56 tCO2/TJ (Jurich, 2016).
According to a previous report (IEA, 2020), the current average direct CO2 emissions relate to 1.4 t per ton of crude steel. Although the majority of these carbon emissions originate from the use of coke in the BF and BOF routes, production by natural gas-based DRI-EAF still results in direct emissions of ~1.0 tCO2/tsteel. However, the SNG produced by the investigated power-to-gas system is intended to primarily substitute natural gas that is used energetically or as a process gas for finishing or use in the DRI route. Thus, the emission factors for the substituted fuels are related to those of natural gas at 56 tCO2/TJ (Jurich, 2016). Referring to a previous report (Rodin et al., 2020), the capture costs for CO2 in iron and steel production would be in the range of 19–83 €/tCO2 at capture rates of up to 90% without further specification of the underlying steel production process. As a further specification of the steel plant is not intended in the present study, an average value of 38 €/tCO2 is presumed to be the input cost for CO2 in the techno-economic evaluation.
In comparison to the conventional processes (for cement and steel production), the implementation of a closed carbon circle is presumed to reduce the direct emissions generated by the substituted fossil fuel. Therefore, the costs for emission-related certificates according to the European emission trading system (EU ETS) are reduced. The avoidance of CO2 certificate costs is a major benefit of the power-to-gas concept beyond the conventional processes and is thus considered as a reduction of SNG generation costs in the techno-economic assessment. Currently, CO2 certificates are traded at a price of ~25 €/tCO2 (EEX, 2021). However, these are expected to increase significantly in the future as a regulatory measure to effectively reduce industrial carbon emissions.
Learning and Scaling Effects
To allow for a projection on cost developments for future implementations up to the year 2050, an appropriate cost reduction effect in regard to the capital expenditures (CAPEX) of the power-to-gas technologies was considered. Therefore, a component-based approach was used to evaluate the technological learning effects based on well-known technologies and processes. This model was previously developed and applied to the most common electrolysis and methanation technologies (Böhm et al., 2020). The details of the mathematical description can be found in a previous report (Böhm et al., 2019).
with:
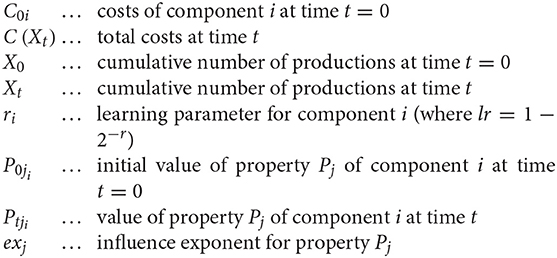
In the present study, the learning curve models evaluated in a previous article (Böhm et al., 2020) for SOEC and catalytic methanation were used. Though these two models use different references for their specific CAPEX values, the electrolysis model refers to the electric input power and the methanation model refers to the power of the product gas. As the power-to-gas system considered herein is assessed as a coherent system, the reference was harmonized to the electric input power of electrolysis. Thus, a potential change in efficiency exerts an impact on the conversion of the methanation learning curve. Therefore, an additional “Learning Property” (Böhm et al., 2019) was introduced for the methanation portion that represents the development of the electrolysis efficiency in relation to the cumulative production development:
The reference value P0 and the learning rate were evaluated based on the overall electric efficiency of the power-to-gas system of 79% today and on a presumed development to 82.5% until 2050. This resulted in a learning rate for the property of lr = −0.003. The influence exponent in Equation (4) is ex = 1 (linear dependency).
Based on the cost structures defined in Böhm et al. (2020) for SOEC and methanation that were both confirmed to be widely applicable to the integrated co-SOEC and methanation approach used in the HydroMetha project (FFG, 2018), the CAPEX of the investigated power-to-gas system was evaluated for different scales ranging from 1,000 to 10,000 kWel. The resulting CAPEX characteristics in relation to the plant scale and the time of implementation are shown in Figure 3. In this context, it should be noted that these learning effects are not directly related to the year of installation but rather to the actual development of cumulative production. Therefore, the given year dates rather have a designative character to represent the impact of CAPEX reduction potentials than to an actual time value.
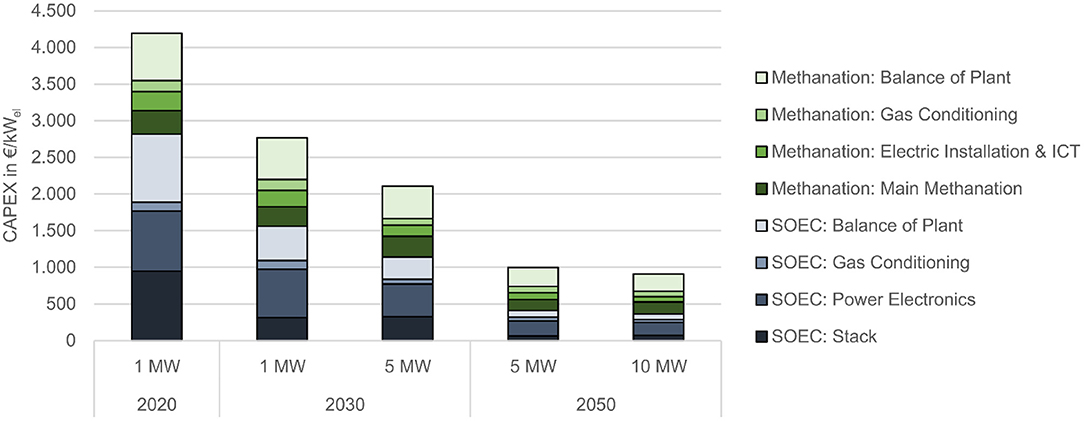
Figure 3. CAPEX development of the power-to-gas system due to technological learning and scaling effects.
Electricity Supply
According to the chosen scenarios that represent energy-intensive industrial use cases, a high load of the application throughout the year as assessed by a high number of annual full load hours (FLH) is presumable. Thus, a grid-based power supply could be considered as the most practical source of electric input with respect to the base load operation, costs, and security of supply. However, as power-to-gas systems are often considered as energy storage and load balancing options, the applicability of the system in combination with volatile renewable energy sources (RES) was evaluated. To achieve this, three different scenarios for power supply were investigated and included (i) direct supply from wind parks, (ii) hybrid supply from wind and grid, and (iii) spot market grid supply.
Direct Supply From Wind Parks
To evaluate the suitability of the power-to-gas system for grid-supportive operation in the context of peak load operation from RES, a direct supply from a representative wind park was investigated. Therefore, the production of an existing Austrian wind park possessing a nominal capacity of 21.35 MW (VERBUND AG, 2021) was simulated based on meteorological data using www.renewables.ninja (Pfenninger and Staffell, 2016; Staffell and Pfenninger, 2016). The plant was chosen due to its proximity to the Eastern Austrian industry regions and to several biomethane plants that can be utilized as potential additional sources for biogenic CO2 (European Biomethane Map, 2020). Furthermore, the power plant size is at an appropriate scale for the investigated electrolyzer capacity range of 1–10 MW. The analyses are based on a full year of data to exclude seasonal effects, and we refer to the year 2019 as the latest available dataset.
Depending on its scale, the power-to-gas system is intended to be operated with an appropriate peak load of the electricity produced from the wind park. According to the co-SOEC characteristics, minimum operation times and standby demands were considered (cf. Table 2). Hence, co-electrolysis is started up when the intended peak load exceeds the minimum load for at least the minimum operation time. When there is no appropriate peak load supply available from the wind power plant, the electrolyzer is set to hot-standby mode or is turned off if no operation is expected for a longer time period. The parameter values were chosen with respect to the general characteristics of high-temperature electrolysis according to cold and warm start times and flexibility (Buttler and Spliethoff, 2018; Smolinka et al., 2018). The electricity demand for the hot-standby mode is drawn from the grid at the spot market price according to the appropriate EXAA data (EXAA, 2019). Figure 4A presents the resulting electricity supply profile for the 1st month of the simulation year.
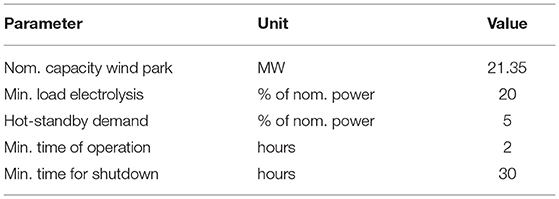
Table 2. Direct supply operation parameters.
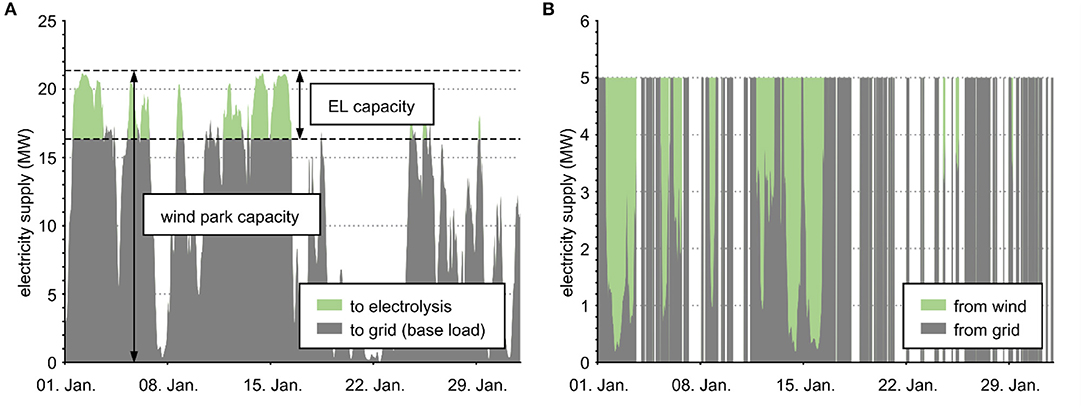
Figure 4. Co-SOEC electricity supply profiles (one month). (A) peak load supply from wind park, (B) electrolyzer supply profile for hybrid supply operation.
Hybrid Supply From Wind and Grid
To extend the annual time of operation for the electrolyzer, to reduce CAPEX-related SNG production costs but also allow for operation in an industrial context, a hybrid electricity supply is considered. In addition to the direct wind supply, the system is operated using electricity purchased from the spot market. Depending on the requested number of FLH, hours with the lowest prices in the year are preferred while also accounting for co-SOEC characteristics as described in the previous section. First, the times at which the system is already in operation through direct supply are prioritized until the nominal load is reached. Then, the cost limit for electricity from the spot market is increased continuously until the requested number of FLH is reached. The resulting electricity supply profile mix for the power-to-gas system is presented in Figure 4B for the first month of the simulation year.
Spot Market Grid Supply
The system is operated using electricity from the spot market with preference for hours with the lowest prices of the year while also accounting for co-SOEC characteristics as per section Direct Supply From Wind Parks. For consistency with the other scenarios, the historical EXAA spot market data for the reference year 2019 was used (EXAA, 2019).
Although EXAA also offers designated green electricity at the spot market price, the data demonstrate that there is apparently no trade based on it and that periodically recurring prices are not market-driven. Thus, even though the use of renewable electricity was preferred, the present analysis refers to gray electricity prices to evaluate the influence of spot market prices.
Techno-Economic Evaluation
The techno-economic assessment in this study primarily analyzes the specific production costs for SNG from the power-to-gas plant arising in the individual implementation scenarios. Therefore, the energy output-related levelized costs of product (LCoP) were calculated according to Böhm et al. (2020). The calculation is based on the LCoE approach that is often used to evaluate the costs of electricity production (de Visser and Held, 2014; IEA et al., 2020).
The assessment considers a full year of operation in which the total annual costs are calculated using the annuity method (VDI, 2012). In Equation (6), A represents the annuity of the fixed total annual payments such as capital- and operation-related (e.g., insurance and maintenance) costs. Cvar represents variable costs and revenues that are dependent upon the corresponding material and energy streams and thus related to the annual time of operation and potential variable load conditions such as part-load efficiencies. These include the demand-related costs for resources, such as electricity, CO2, and water, and they also include by-product sales. Eout is the total annual energy output of the power-to-gas plant corresponding to the SNG produced.
Capital-related annuity considers the investment costs of the main equipment of a power-to-gas plant. Additionally, it includes future costs for the expected replacement of individual components within the set observation period. It is defined as:
where I0 is the initial investment cost, and I1…In represents the first to nth replacement investment. R represents the residual value of the plant at the end of the observation period. The cash values of the replacement investments and residual value are calculated considering the interest rate factor q = 1+i (where i is the interest rate) and the presumed deprecation period TN:
The annuity factor a in Equation (7) is calculated based on the interest rate factor and observation period:
As only investment costs for the main equipment of the power-to-gas plant are directly included in the capital-related annuity, additional costs that arise such as those for engineering, construction, and commissioning of the plant were considered in the form of appropriate overhead factors (Peters and Timmerhaus, 1991; Perry et al., 1999; Sinnott and Towler, 2020) (see Appendix Section 1.2).
The annuity of operation-related costs (maintenance and insurance) was considered as a fixed factor related to the initial investment I0 and was likewise provided with the annuity factor a. The actual values are listed in Table 3 along with the other calculation parameters relevant for the techno-economic assessment.
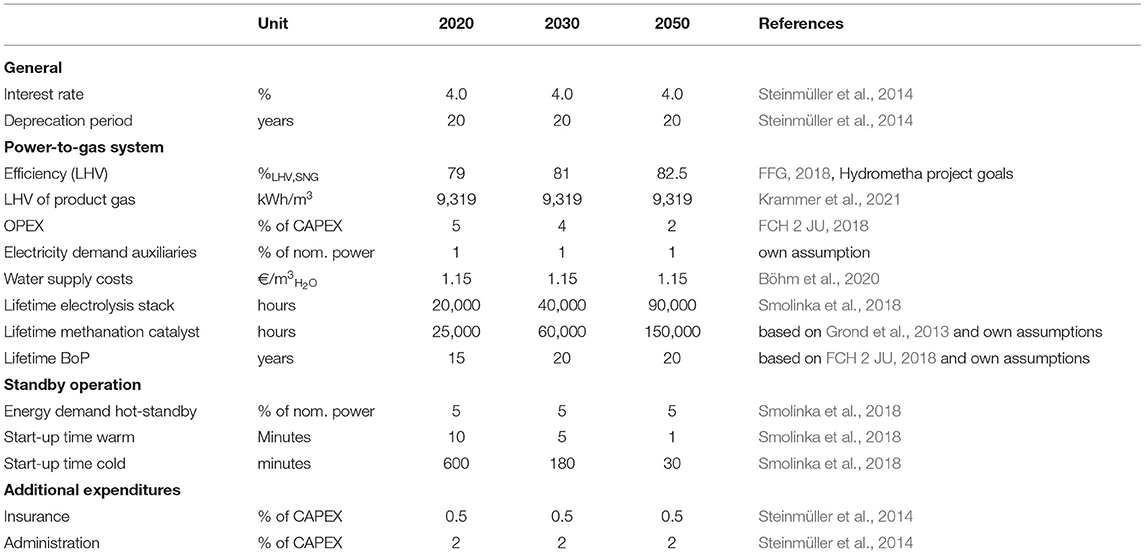
Table 3. Calculation parameters for the techno-economic assessment.
Results and Discussion
Optimization of Electricity Supply Costs
As electric power is the main input energy for the power-to-gas system, the relationship regarding this power type in the investigated application scenarios is analyzed independently of the other plant costs. This includes the costs of the direct supply of peak electricity production from local wind parks. Operation at peak production is considered preferable in terms of grid service and allows the electricity supply to the grid to be more base-load oriented while preventing curtailment or shutdown of electricity production. Thus, the supply costs for the electrolyzer are expected to be lower than the average generation costs from onshore wind. To estimate the potential electricity supply costs for this peak load operation, the appropriate spot market prices for the times of available wind power supply were evaluated. The analyses revealed that these average costs for an alternative direct grid supply would be no lower than 38.85 €/MWh for the investigated production site and the Austrian spot market (cf. Figure 5A). Although this value is lower than that of the average annual spot market prices of 40.16 €/MWh in 2019 (EXAA, 2019), it is still higher than 44% of the quarter-hourly values. Therefore, operation at peak load wind production does not necessarily correlate with the times of lowest spot market prices.
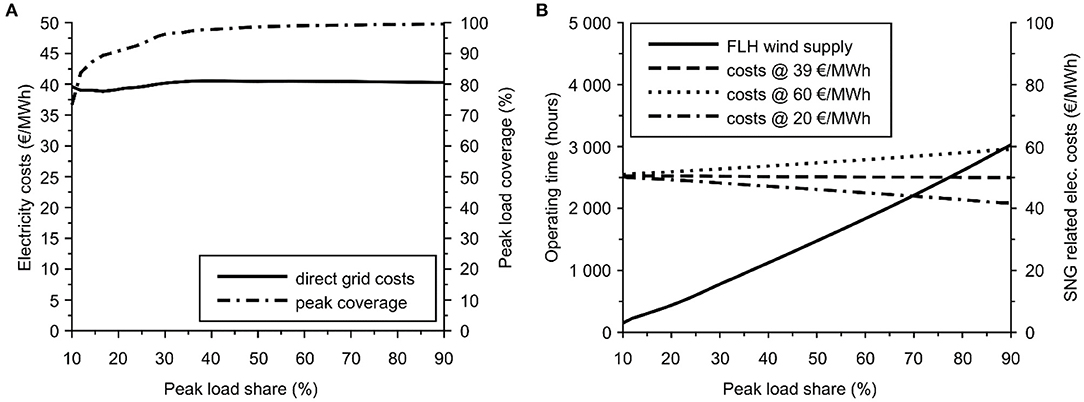
Figure 5. Influence of the electrolyzer to wind park capacity ratio (peak load share) on (A) peak coverage and supply costs and (B) on full load hours and production costs.
As the definition of peak electricity production in the context of this analysis is dependent upon the electrolyzer capacity, the impact of this parameter on peak load coverage, costs, and the available FLH of electrolyzer operation was analyzed. Depending on the value of the ratio of electrolyzer capacity to wind park capacity, which is referred to as peak load share, this analysis has shown that at a ratio of 19% (4 MW electrolyzer in the case of the 21 MW wind park), up to 90% of the resulting production peaks could be utilized by the electrolysis (Figure 5A). Additionally, with higher peak load share up to 3000 FLH per year could be reached from the direct supply operation (Figure 5B). Therefore, even under the limitations of the co-SOEC in terms of load flexibility, this technology offers significant potential for operation with volatile renewable energy sources for providing both grid services and dedicated supply.
Based on these results, the electricity supply costs for direct supply from wind were presumed to be 39 €/MWh for the subsequent calculations so that they did not compete with grid supply costs in the hybrid supply scenario. The resulting electricity supply costs for production and standby operations were evaluated in relation to the annual full load hours of operation. In regard to the investigated electricity supply scenarios (cf. section Electricity Supply), the scenario for direct wind supply is identical to the hybrid supply scenario up to the maximum amount of available FLH as shown in Figure 5B and is therefore not discussed separately.
As presented in Figure 6A for the hybrid supply scenario, the electricity costs related to SNG production are discontinuous for low annual FLH. Starting with constant supply costs for production but increasing standby costs, electricity-related production costs become larger until the maximum amount of FLH for direct wind supply is reached (~550 FLH for the 5 MW electrolysis vs. 21 MW wind park case). Subsequently, when maximizing the system load at times that the power-to-gas system is already in operation, the costs initially decrease before increasing according to the bound grid electricity costs. After this, the supply costs again decrease with increasing annual FLH due to prioritization of hours with the lowest spot market prices, and they ultimately reach a minimum of 42.3 €/MWhSNG at 2,100 FLH for the 5 MW electrolysis. Due to the higher standby demand, the minimum for a 10 MW electrolysis is slightly higher at 45.8 €/MWhSNG and 4,700 FLH. Considering the cost-optimized operation with electricity supply only from the spot market price (Figure 6B), production costs continuously increase with an increase in annual full load hours. Even though electricity costs for hot-standby operation increase significantly (up to 84 €/MWh), this is compensated for by the decreasing time of operation in this mode.
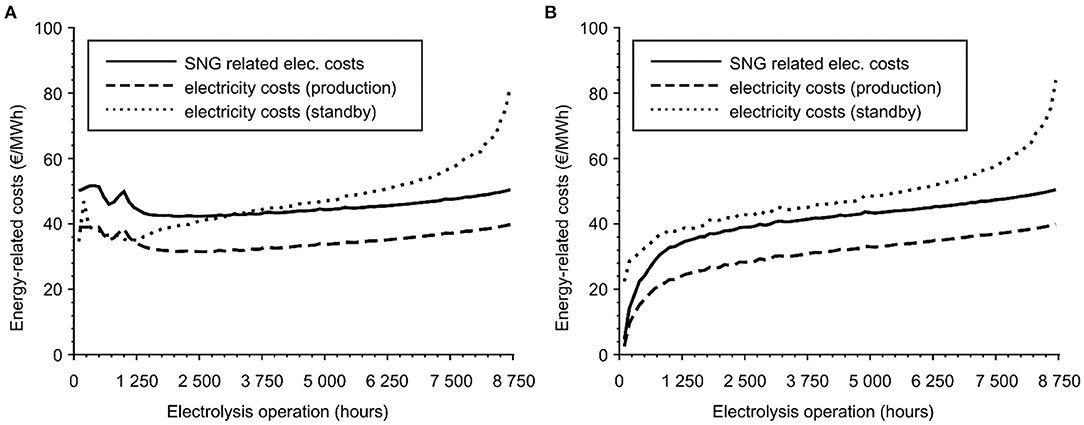
Figure 6. Electricity supply costs and electricity-related production costs for (A) the hybrid electricity supply and (B) the grid-only electricity supply.
Evaluating the results in relation to the implementation in an industrial context, the most relevant range is from 7,500 FLH and above. In this range, both supply scenarios (hybrid and grid-only) result in similar electricity-related production costs of 47.4–50.5 € per MWh SNG produced. Additionally, the dependency on the peak load share (ratio of electrolyzer to wind plant capacity) is insignificant and within the range of 50.0–50.5 €/MWh (90%−10%) for the set wind supply costs. Thus, without considering the significant incentives for providing grid services by peak load coverage of wind power plants, an operation has no significant impact on the electricity supply costs in terms of industrial applications. Additionally, for low peak load shares, the impact of direct wind supply costs was less significant (cf. Figure 5B). However, these direct supply costs become more relevant for higher ratios, and this, in turn, reduces the available base load produced for the grid and thus counteracts the idea of peak-shaving. Therefore, a grid-supportive implementation of an industrial power-to-gas plant can be achieved in a manner that results in low economic impacts on electricity producers and consumers.
SNG Generation Costs
The evaluation of the resulting SNG generation costs for the two investigated industries (Figure 7) revealed that the application scenario itself exerts only a minor impact on the product costs. Both scenarios reach product cost levels of 20–26 c€/kWh for current state implementations with expected cost reduction potentials of 50 to 80% for future installations. The slightly lower product costs for the current state (2020) steel industry scenario are primarily related to the higher number of annual full load hours compared to the cement industry (8,500 vs. 8,000). However, this advantage almost completely disappears for mid- and long-term implementation due to the significant reduction in fixed cost factors (CAPEX and OPEX) that occurs as a result of projected technological learning and scaling effects. Accounting for up to 59% of the overall generation costs for a 1 MW plant today, this cost share is expected to be reduced to only 16% when assuming a 10 MW plant in 2050. These cost reductions are primarily induced by technological learning according to the electrolysis uptake projected in a previous report (Böhm et al., 2020). Additionally, high-temperature electrolysis systems are expected to exhibit a stronger cost dependency on the system scale than are low-temperature technologies. Hence, the implementation of large-scale systems up to 100 MW electrical capacity involves additional cost reduction potential for industrial applications (Böhm et al., 2020). Though, even without these additional scaling effects the higher efficiency of the thermally integrated co-electrolysis approach reveals significant economic benefits over projected large-scale implementations (50–100 MW) using conventional electrolysis and methanation in combination with PV or wind power (Böhm et al., 2020). Also, in comparison with assessments for PtM in single MW scales, as analyzed by Gorre et al. (2019) the economic advantage of higher system efficiencies beyond yet higher CAPEX is apparent as long as electricity prices are not significantly below current levels.
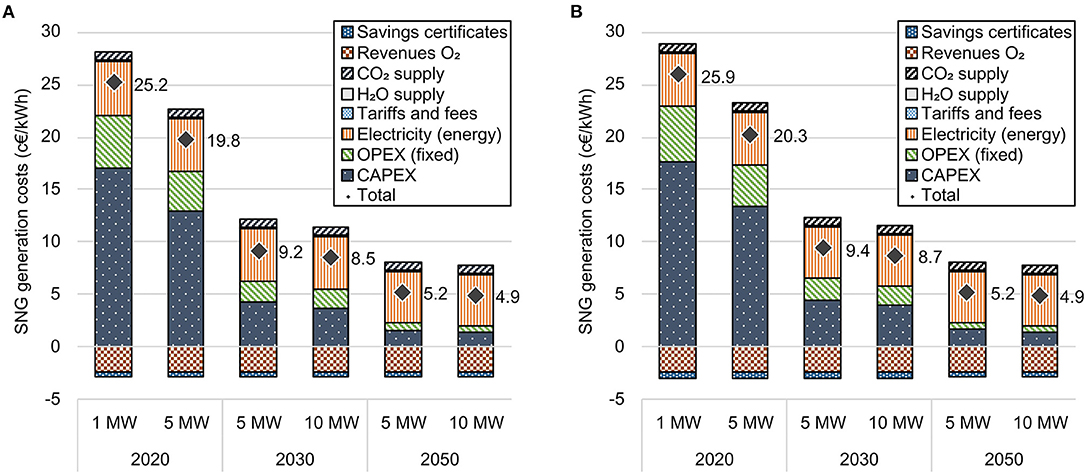
Figure 7. SNG generation costs for different plant capacities and years of implementation. (A) steel industry scenario, (B) cement industry scenario.
Based on the current certificate cost for CO2 emissions of 25 €/tCO2, the impact of avoiding the buying or selling of excess allowances is relatively low. Even for the cement industry scenario where the emission factors of the substituted fuels are ~19% higher than those of the natural gas substituted for the steel industry, the savings only compensate for <3% of the overall generation costs in the 2020 scenario. With decreasing CAPEX, this becomes more relevant in the long term and can account for up to 6% of the SNG generation costs. However, to generate a significant impact, certificate costs would need to increase significantly (see section SNG Generation Costs).
Although the implementation in an industrial context generally suggests an operation of the power-to-gas plant at a high annual load, the lower electricity supply costs at a lower number of annual FLH may appear beneficial from a cost perspective. However, as presented in Figure 8, the impact of high fixed costs (CAPEX) for the 5 MW reference implementation out-values this supply cost advantage for both the hybrid and grid-only supply. Considering the presumption of constant electricity costs for the entire period until 2050, the cost curve flattens at >7,000 FLH with potential cost advantages in that range for large-scale implementations (> 100 MW). However, in relation to the decreasing cost share of CAPEX (cf. Figure 7), this can be considered insignificant.
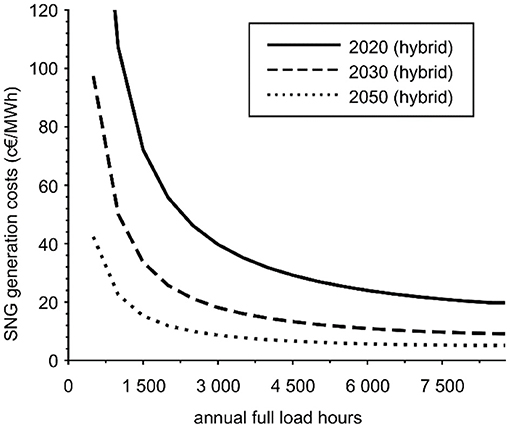
Figure 8. SNG generation costs in dependence of annual FLH of operation for the 5 MW reference plant.
Impact of By-Product Oxygen Use
As shown in Figure 7, the savings due to the utilization of by-product oxygen exert a significant impact on the overall SNG generation costs and can substitute for 9–30% of the given expenditures. Based on gross reactions (cf. Equation 1 and 2) and the LHV of the product gas, ~282 kg of O2 per MWh of SNG were produced by the co-electrolysis process. This relates to 223–233 kgO2/MWh of input power depending on the process efficiencies.
In relation to the average oxygen demand of an oxyfuel cement plant, the required electrolysis capacity would relate to 91–128 kW/ktcement (for 8,000 FLH per year) or ~434–610 MW for a complete adaption of the Austrian cement production (4.8 Mt in 2016 acc. to VÖZ, 2017). In contrast, fuel substitution requires a power-to-gas plant capacity that ranges from ~25 kW/ktcement (fossil fuels only) to 119 kW/ktcement (including alternative fuels). Therefore, depending on the substituted fuel input and the oxygen requirement of the oxyfuel process, the savings generated from by-product oxygen utilization are related to external sales instead of direct use (up to 0.56 c€/kWhSNG).
The oxygen demand in the investigated steel plant scenario depends upon the underlying steel production process and ranges from 40 kgO2/tsteel for DRI to 78 kgO2/tsteel for conventional BOF routes. Considering the primary use of SNG over hydrogen production to extend the lifetime of the BOF route, an electrolyzer capacity of ~39–41 kW/tsteel would be required to meet that demand (for 8,500 FLH per year). In contrast, the required power-to-gas capacity to substitute the natural gas demand of the steel plant is 75–79 kW/tsteel. Therefore, for a complete substitution of the natural gas input, the by-product oxygen would exceed the actual demands of the investigated steel plant. Consequently, the requirement of external oxygen production becomes obsolete, and external sales of the by-product oxygen are necessary to completely enable the considered revenues.
CO2 Mitigation and Resulting Certificate Savings
As discussed previously, the impact of CO2 certificate savings on the overall SNG generation costs is insignificantly low under the current conditions. Under these conditions, economic competitiveness with fossil fuels cannot be achieved. Compared to the EU-28 average price of natural gas for non-household consumers that was ~3.27 c€/kWh in 2019 (Eurostat, 2020), in future evaluations the calculated product costs are 1.5–3 times as high, even if all revenues and savings are included. However, with increasing carbon prices, the integrated generation of SNG as a carbon neutral fuel in the context of a closed carbon circle may provide significant benefits over the consumption of taxed fossil fuels. Presuming a CO2 price of 150 €/t, the effective generation costs of SNG for the given applications would fall below the current price for natural gas for the 2050 (5 MW) scenario. For a carbon price of 330 €/t that was suggested to be necessary by the mid-century to achieve rapid decarbonization (Rockström et al., 2017, 400$/t), a similar level of competitiveness could already be reached at the 2030 CAPEX levels. From a long-term perspective (2050 scenario), this level of carbon pricing could even lead to negative effective generation costs, as the appropriate savings (6.6 c€/kWh) and revenues from by-product sales exceed the actual production costs.
Sensitivity Analysis
To evaluate the impact of the individual calculation parameters used in the techno-economic assessment, a sensitivity analysis was performed. In Figure 9 the variation of the resulting generation costs is presented for a parameter variation of ±25% from the appropriate reference value for the implementation scenarios 2020 and 2050. The most significant relative impact is electric efficiency, particularly if the projected values cannot be provided. Thus, a reduction of 25%, which represents an absolute value of 59 and 62% respectively according to the scenario, the SNG generation costs are calculated to increase by up to 45%. Depending on the dominance in the overall cost structure, the impacts of CAPEX and electricity costs are also significant in the sensitivity analysis. Therefore, the impact of potentially increasing electricity costs can be decisive for the economic viability of future implementations. The data presented in Figure 9 reveal that the impact of supply costs on SNG generation costs typically increases with a decrease in the overall costs. In contrast, the sensitivity to durability and replacement intervals decrease according to the expected development of component and system lifetimes that can result in longer operation periods.
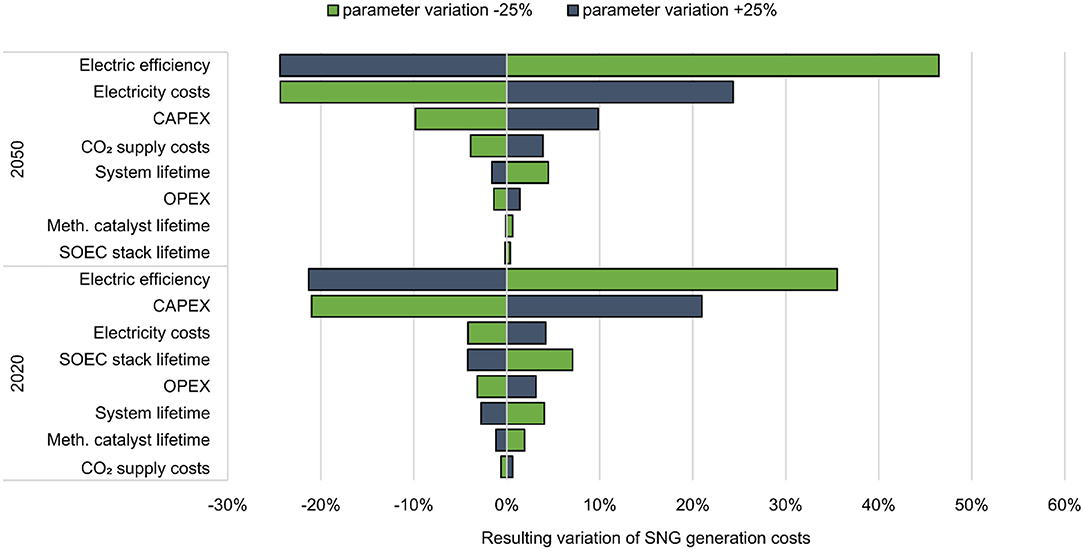
Figure 9. Impact of calculation parameter variation on the resulting SNG generation costs.
Although most calculation parameters exert a linear impact on the resulting generation costs, lifetimes and observation period, as well as the system efficiency exhibit a non-linear dependency. As illustrated in Figure 10, the impact of the system and component lifetimes increases with decreasing values as the number of replacement investments increases. The same scenario applies to the observation period that defines the annuity of the CAPEX according to Equation (10). However, the impact of these parameters decreases at higher values. Figure 10 again illustrates the high impact of the actual efficiency on the resulting costs that further increase at lower values. For positive variation, the absolute value was limited to 100%el, LHV.
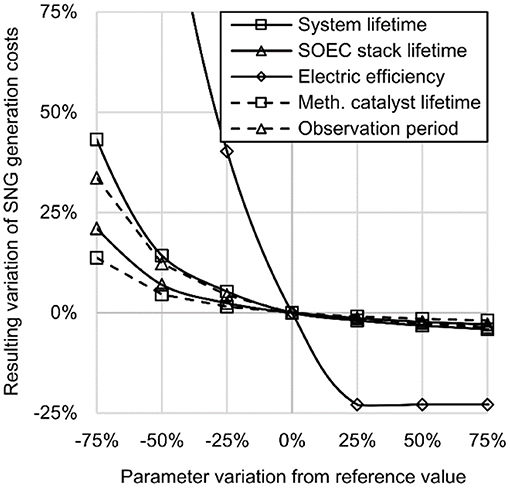
Figure 10. Sensitivity analysis of non-linear impact parameters for the 2030 reference case.
Another relevant impact on future installations can occur from tariffs and fees that must be paid for the operation of power-to-gas plants and their integration into public energy networks (power and gas grids). For the given calculations, Austrian conditions according to the regulatory framework in place by the end of 2020 were considered. Although this currently results in negligible cost factors (approx. 0.2 c€/kWh), individual charges, taxes, and levies are still legally unclear and can change in future regulations. Additionally, they differ between countries. Thus, this cost factor should be monitored in future studies.
Conclusion
The investigations performed in this study evaluate the current and future economic competitiveness of high-performance power-to-gas systems in energy-intensive industries. Therefore, highest efficiencies of power-to-gas systems are required. This requirement is met by combining high-temperature co-electrolysis with catalytic methanation in a thermally integrated complete system. The proposed implementation scenarios aim to allow for the creation of closed carbon cycles for industrial sectors and plants that are expected to still rely on non-avoidable process-related carbon emissions in their mid- and long-term transition to renewable processes. In this context, our analyses have revealed that the production costs for the given system performances will reach values of 15 c€/kWh and below when appropriate learning curve and scaling effects occur for this low TRL technology. The effective generation costs of the primary product can be further reduced by the utilization of by-product oxygen, either by direct use in related process streams substituting dedicated production capacities or by external sales. However, despite accounting for these side effects, effective generation costs are expected to be two to three times as high as the current industrial costs for natural gas, even in long-term scenarios. Therefore, effective pricing of carbon emissions must be established to allow these synthetic fuel substitutes to be competitive with fossil fuels. It has been shown that a carbon price of 150 €/tCO2 can enable beneficial business cases for large-scale implementations from a long-term perspective. Similarly, if carbon pricing is implemented as proposed with appropriate costs of 330 €/tCO2 and higher, cost parity with fossil fuels could be reached even earlier and prior to exhausting long-term scaling effects. Thus, even short- and mid-term implementations (e.g., 2025–2030) could benefit from long-term savings.
As another aspect of the integration of power-to-gas technology in future energy systems, the applicability of renewable electricity supply was investigated. As co-electrolysis, or solid-oxide electrolysis in general, is often considered to be inflexible to load changes, more dynamic electrolysis technologies (e.g., PEM) are preferred to provide grid services. However, simulations of direct coupling with wind power have shown that a grid-supportive operation is possible. Additionally, with direct supply costs of ~39 €/MWh, the power-to-gas plant can be operated in a manner that is cost-effective compared to spot-market prices while providing economic alternatives for wind park operators to curtailment or shutdown at production peaks.
Although this study demonstrates the general potential of co-electrolysis-based power-to-gas plants in industrial applications, these effects are still dependent on the positive development of the technology beyond the current TRL. In this context, the technology has to compete with more mature and thus less cost-intense technologies. Thus, in addition to the achievement of set efficiency goals of the heat integration approach, this requires appropriate efforts in regard to upscaling both capacities and numbers over the next years in combination with the according R&D tasks. Furthermore, for the considered industrial applications implementations at single MW-scale will not suffice to meet actual demands for a fully decarbonized production. Hence, additional investigations will have to be performed for plant scales beyond 100 MW where a legitimate upscaling from current technology status cannot be done.
Data Availability Statement
The raw data supporting the conclusions of this article will be made available by the authors, without undue reservation.
Author Contributions
HB conceived and designed the study, was responsible for data acquisition, calculations, and analysis, and wrote the first draft of the manuscript. ML and TK reviewed and edited the manuscript prior to submission. All authors contributed to manuscript revisions and read and approved the submitted version.
Funding
The contents included in this chapter are part of the national Austrian flagship project HYDROMETHA (contract # 864578) that has received funding from the Austrian Climate and Energy fund under the framework of the Energy Research Program.
Conflict of Interest
The authors declare that the research was conducted in the absence of any commercial or financial relationships that could be construed as a potential conflict of interest.
Publisher's Note
All claims expressed in this article are solely those of the authors and do not necessarily represent those of their affiliated organizations, or those of the publisher, the editors and the reviewers. Any product that may be evaluated in this article, or claim that may be made by its manufacturer, is not guaranteed or endorsed by the publisher.
Acknowledgments
The support of the Energieinstitut an der Johannes Kepler Universität Linz and the Austrian Research Promotion Agency (FFG) is gratefully acknowledged.
Supplementary Material
The Supplementary Material for this article can be found online at: https://www.frontiersin.org/articles/10.3389/frsus.2021.726332/full#supplementary-material
References
Bains, P., Psarras, P., and Wilcox, J. (2017). CO2 capture from the industry sector. Progr. Energy Combust. Sci. 63, 146–172. doi: 10.1016/j.pecs.2017.07.001
Banerjee, A., Wang, Y., Diercks, J., and Deutschmann, O. (2018). Hierarchical modeling of solid oxide cells and stacks producing syngas via H2O/CO2 Co-electrolysis for industrial applications. Appl. Energy 230, 996–1013. doi: 10.1016/j.apenergy.2018.08.122
Bieda, B. (2012). Life cycle inventory processes of the arcelormittal poland (AMP) S.A. In Kraków, poland—basic oxygen furnace steel production. Int. J. Life Cycle Assess. 17, 463–470. doi: 10.1007/s11367-011-0370-y
Biswas, S., Kulkarni, A. P., Giddey, S., and Bhattacharya, S. (2020). “A Review on synthesis of methane as a pathway for renewable energy storage with a focus on solid oxide electrolytic cell-based processes. Front. Energy Res. 8:112. doi: 10.3389/fenrg.2020.570112
Böhm, H., Goers, S., and Zauner, A. (2019). Estimating future costs of power-to-gas—a component-based approach for technological learning. Int. J. Hydrog. Energy 44, 30789–30805. doi: 10.1016/j.ijhydene.2019.09.230
Böhm, H., Zauner, A., Rosenfeld, D. C., and Tichler, R. (2020). Projecting cost development for future large-scale power-to-gas implementations by scaling effects. Appl. Energy 264:114780. doi: 10.1016/j.apenergy.2020.114780
Breyer, C., Tsupari, E., Tikka, V., and Vainikka, P. (2015). Power-to-gas as an emerging profitable business through creating an integrated value chain. Energy Proced. 73, 182–189. doi: 10.1016/j.egypro.2015.07.668
Buttler, A., Koltun, R., Wolf, R., and Spliethoff, H. (2015). A Detailed techno-economic analysis of heat integration in high temperature electrolysis for efficient hydrogen production. Int. J. Hydro. Energy 40, 38–50. doi: 10.1016/j.ijhydene.2014.10.048
Buttler, A., and Spliethoff, H. (2018). Current status of water electrolysis for energy storage, grid balancing and sector coupling via power-to-gas and power-to-liquids: a review. Renew. Sustain. Energy Rev. 82, 2440–2454. doi: 10.1016/j.rser.2017.09.003
Campbell, J. M., Hubbard, R. A., and Snow-McGregor, K. (2014). Gas Conditioning and Processing: The Equipment Modules—Volume 2. 9th edition. Norman, Oklahoma: Campbell/PetroSkills.
Carrasco-Maldonado, F., Spörl, R., Fleiger, K., Hoenig, V., Maier, J., and Scheffknecht, G. (2016). Oxy-fuel combustion technology for cement production—state of the art research and technology development. Int. J. Greenhouse Gas Control 45, 189–199. doi: 10.1016/j.ijggc.2015.12.014
CEMBUREAU (2020). Cementing the European Green Deal: Reaching Climate Neutrality Along the Cement and Concrete Value Chain by 2050. Available online at: https://cembureau.eu/media/kuxd32gi/cembureau-2050-roadmap_final-version_web.pdf (accessed February 24, 2021).
de Visser, E., and Held, A. (2014). Methodologies for Estimating Levelised Cost of Electricity (LCoE). Utrecht. (accessed October 03, 2019).
Ditaranto, M., and Bakken, J. (2019). Study of a full scale oxy-fuel cement rotary kiln. Int. J. Greenhouse Gas Control 83, 166–175. doi: 10.1016/j.ijggc.2019.02.008
EC (2020) Stepping up Europe's 2030 Climate Ambition: Investing in a Climate-Neutral Future for the Benefit of Our People.Available online at: https://eur-lex.europa.eu/legal-content/EN/TXT/?uri=CELEX:52020DC0562 (accessed May 03 2021).
EEX (2021). Environmental Markets. Available online at: https://www.eex.com/en/market-data/environmental-markets (accessed April 15, 2021).
European Biomethane Map (2020). Infrastructure for Biomethane Production. 2020: Gas Infrastructure Europe (GIE); European Biogas Association (EBA). https://www.gie.eu/maps_data/downloads/2020/GIE_EBA_BIO_2020_A0_FULL_471.pdf (accessed April 02, 2021).
Eurostat (2020). Gas Prices for Non-Household Consumers - Bi-Annual Data (From 2007 Onwards): Nrg_pc_203. Available online at: http://ec.europa.eu/eurostat/product?code=nrg_pc_203 (accessed January 31, 2020).
EXAA (2019). Historical DataEXAA Energy Exchange Austria. Available online at: https://www.exaa.at/en/marketdata/historical-data (accessed October 08, 2019).
FCH 2 JU (2018). Addendum to the Multi—Annual Work Plan 2014–2020. Available online at: https://www.fch.europa.eu/sites/default/files/MAWP%20final%20version_endorsed%20GB%2015062018%20%28ID%203712421%29.pdf (accessed April 27, 2021).
FFG (2018). FFGProjektdatenbank—HydroMetha. Available online at: https://projekte.ffg.at/projekt/2903976 (accessed December 13, 2018).
Frank, E., Gorre, J., Ruoss, F., and Friedl, M. J. (2018). Calculation and analysis of efficiencies and annual performances of power-to-gas systems. Appl. Energy 218, 217–231. doi: 10.1016/j.apenergy.2018.02.105
Gorre, J., Ortloff, F., and van Leeuwen, C. (2019). Production costs for synthetic methane in 2030 and 2050 of an optimized power-to-gas plant with intermediate hydrogen storage. Appl. Energy 253:113594. doi: 10.1016/j.apenergy.2019.113594
Götz, M., Lefebvre, J., Mörs, F., McDaniel Koch, A., Graf, F., Bajohr, S., Reimert, R., and Kolb, T. (2016). Renewable power-to-gas: a technological and economic review. Renew. Energy 85, 1371–1390. doi: 10.1016/j.renene.2015.07.066
Grigoriev, S. A., Fateev, V. N., Bessarabov, D. G., and Millet, P. (2020). Current status, research trends, and challenges in water electrolysis science and technology. Int. J. Hydrog. Energy 45, 26036–26058. doi: 10.1016/j.ijhydene.2020.03.109
Grond, L., Schulze, P., and Holstein, J. (2013). Systems analyses power to gas—deliverable 1: technology review—final report. Renew. Sustain. Energy Rev. 92, 794-806.
Guilera, J., Ramon Morante, J., and Andreu, T. (2018). Economic viability of SNG production from power and CO2. Energy Convers. Manage. 162, 218–224. doi: 10.1016/j.enconman.2018.02.037
Herz, G., Reichelt, E., and Jahn, M. (2018). Techno-economic analysis of a Co-electrolysis-based synthesis process for the production of hydrocarbons. Appl. Energy 215, 309–320. doi: 10.1016/j.apenergy.2018.02.007
Jensen, I. G., Wiese, F., Bramstoft, R., and Münster, M. (2020). Potential role of renewable gas in the transition of electricity and district heating systems. Energy Strateg. Rev. 27:100446. doi: 10.1016/j.esr.2019.100446
Jurich, K. (2016). “CO2 emission factors for fossil fuels.” in Climate Change. (accessed may 15, 2018).
Kirschen, M., Badr, K., and Pfeifer, H. (2011). Influence of direct reduced iron on the energy balance of the electric arc furnace in steel industry. Energy 36, 6146–6155. doi: 10.1016/j.energy.2011.07.050
Krammer, A., Medved, A., Peham, M., Wolf-Zöllner, P., Salbrechter, K., and Lehner, M. (2021). Dual pressure level methanation of Co-SOEC syngas. Energy Technol. 9:2000746. doi: 10.1002/ente.202000746
Kuparinen, K., and Vakkilainen, E. (2017). Green pulp mill: renewable alternatives to fossil fuels in lime kiln operations. BioResources 12:48. doi: 10.15376/biores.12.2.4031-4048
Luo, C., and Liu, J. (2018). “Oxygen production for Oxy-Fuel combustion,” in Oxy-Fuel Combustion, ed by Chuguang Zheng and Zhaohui Liu (Amsterdam: Elsevier), 263–87.
Medved, A. R., Lehner, M., Rosenfeld, D. C., Lindorfer, J., and Rechberger, K. (2021). Enrichment of integrated steel plant process gases with implementation of renewable energy. Johns. Matthey Technol. Rev. 65:453. doi: 10.1595/205651321X16161444481140
Parra, D., Zhang, X., Bauer, C., and Patel, M. K. (2017). An integrated techno-economic and life cycle environmental assessment of power-to-gas systems. Appl. Energy. 193, 440–454. doi: 10.1016/j.apenergy.2017.02.063
Perry, R. H., Green, D. W., and Maloney, J. O. (1999). Perry's Chemical Engineers' Handbook. 7. ed., [3. Nachdr.]. Perry's chemical engineers' platinum edition. New York, NY: McGraw-Hill (accessed November 16, 2018).
Peters, M. S., and Timmerhaus, K. D. (1991). Plant Design and Economics for Chemical Engineers. 4. ed. McGraw-Hill chemical engineering series. New York, NY: McGraw-Hill.
Pfenninger, S., and Staffell, I. (2016). Long-term patterns of European PV Output Using 30 years of validated hourly reanalysis and satellite data. Energy 114, 1251–1265. doi: 10.1016/j.energy.2016.08.060
Rechberger, K., Spanlang, A., Sasiain Conde, A., Wolfmeir, H., and Harris, C. (2020). Green hydrogen-based direct reduction for low-carbon steelmaking. Steel Res. 2000:110. doi: 10.1002/srin.202000110
Röben, F. T., Schöne, N., Bau, U., Reuter, M. A., Dahmen, M., and Bardow, A. (2021). Decarbonizing copper production by power-to-hydrogen: a techno-economic analysis. J. Clean. Product. 2021:127191. doi: 10.1016/j.jclepro.2021.127191
Rockström, J., Gaffney, O., Rogelj, J., Meinshausen, M., Nakicenovic, N., and Schellnhuber, H. J. (2017). A roadmap for rapid decarbonization: emissions inevitably approach zero with a “Carbon Law”. Science 355, 1269–1271. doi: 10.1126/science.aah3443
Rodin, V., Lindorfer, J., Böhm, H., and Vieira, L. (2020). Assessing the potential of carbon dioxide valorisation in Europe with focus on biogenic CO2. J. CO2 Utiliz. 41:101219. doi: 10.1016/j.jcou.2020.101219
Rolfe, A., Huang, Y., Haaf, M., Pita, A., Rezvani, S., Dave, A., and Hewitt, N. J. (2018). Technical and environmental study of calcium carbonate looping versus oxy-fuel options for low CO2 emission cement plants. Int. J. Greenhouse Gas Control 75, 85–97. doi: 10.1016/j.ijggc.2018.05.020
Rönsch, S., Schneider, J., Matthischke, S., Schlüter, M., Götz, M., Lefebvre, J., Prabhakaran, P., and Bajohr, S. (2016). Review on methanation—from fundamentals to current projects. Fuel 166, 276–296. doi: 10.1016/j.fuel.2015.10.111
Rosenfeld, D. C., Böhm, H., Lindorfer, J., and Lehner, M. (2020). Scenario analysis of implementing a power-to-gas and biomass gasification system in an integrated steel plant: a techno-economic and environmental study. Renew. Energy 147, 1511–1524. doi: 10.1016/j.renene.2019.09.053
Sanz-Bermejo, J., Muñoz-Antón, J., Gonzalez-Aguilar, J., and Romero, M. (2015). Part load operation of a solid oxide electrolysis system for integration with renewable energy sources. Int. J. Hydro. Energy 40, 8291–8303. doi: 10.1016/j.ijhydene.2015.04.059
Schreiber, A., Peschel, A., Hentschel, B., and Zapp, P. (2020). Life cycle assessment of power-to-syngas: comparing high temperature co-electrolysis and steam methane reforming. Front. Energy Res. 8:850. doi: 10.3389/fenrg.2020.533850
Sinnott, R., and Towler, G. (2020). “Costing and Project Evaluation.” in Chemical Engineering Design, eds Ray K. Sinnott and T. Gavin 6. edition, 275–369. Coulson and Richardson's Chemical engineering series [vol. 6]. Oxford, Cambridge, MA: Butterworth-Heinemann. (accessed April 13, 2021).
Smolinka, T., Wiebe, N., Sterchele, P., Palzer, A., Lehner, F., Jansen, M., et al. (2018). Studie IndWEDe: Industrialisierung Der Wasser-elektrolyse in -Deutschland: -Chancen Und -Herausforderungen Für Nachhaltigen Wasserstoff Für Verkehr, Strom Und -Wärme. Berlin. (accessed November 16, 2018).
Staffell, I., and Pfenninger, S. (2016). Using bias-corrected reanalysis to simulate current and future wind power output. Energy 114, 1224–1239. doi: 10.1016/j.energy.2016.08.068
Steinmüller, H., Reiter, G., Tichler, R., Friedl, C., Furtlehner, M., Lindorfer, J., et al. (2014). Power to Gas—Eine Systemanalyse: Markt- Und Technologiescouting Und—Analyse.
VDI (2012). VDI 2067 Blatt 1—Wirtschaftlichkeit Gebäudetechnischer Anlagen: Grundlagen Und Kostenberechnung ICS 91.140.01, no. VDI 2067.
VERBUND AG (2021). VERBUND's Bruck-Göttlesbrunn Wind Farm. Available online at: https://www.verbund.com/en-at/about-verbund/power-plants/our-power-plants/windpark-bruck-goettlesbrunn (accessed April 02, 2021).
Voldsund, M., Gardarsdottir, S., Lena, E., de; Pérez-Calvo, J.-F., Jamali, A., Berstad, D., Fu, C., Romano, M., Roussanaly, S., Anantharaman, R., Hoppe, H., Sutter, D., Mazzotti, M., Gazzani, M., Cinti, G., and Jordal, K. (2019). Comparison of technologies for CO2 capture from cement production—Part 1: technical evaluation. Energies 12:559. doi: 10.3390/en,12030559
VÖZ (2015). Nachhaltigkeitsbericht 2014 Der Österreichischen Zementindustrie. Wien. Available online at: https://www.zement.at/downloads/nachhaltigkeitsbericht__2014.pdf (accessed April 14, 2021).
VÖZ (2017). Nachhaltigkeitsbericht 2016 Der Österreichischen Zementindustrie. Wien. Available online at: https://www.zement.at/downloads/downloads_2017/nachhaltigkeitsbericht_2016_web.pdf (accessed July 08, 2019).
Wang, L., Rao, M., Diethelm, S., Lin, T.-E., Zhang, H., Hagen, A., et al. (2019). Power-to-methane via Co-electrolysis of H2O and CO2: the effects of pressurized operation and internal methanation. Appl. Energy 250, 1432–1445. doi: 10.1016/j.apenergy.2019.05.098
Wu, F., Argyle, M. D., Dellenback, P. A., and Fan, M. (2018). Progress in O2 Separation for oxy-fuel combustion–a promising way for cost-effective CO2 capture: a review. Progr. Energy Combust. Sci. 67, 188–205. doi: 10.1016/j.pecs.2018.01.004
Zhang, H., and Desideri, U. (2020). Techno-economic optimization of power-to-methanol with Co-electrolysis of CO2 and H2O in solid-oxide electrolyzers. Energy 199:117498. doi: 10.1016/j.energy.2020.117498
Keywords: co-electrolysis, methanation, power-to-gas, techno-economy, oxygen utilization, CCU, cement industry, steel industry
Citation: Böhm H, Lehner M and Kienberger T (2021) Techno-Economic Assessment of Thermally Integrated Co-Electrolysis and Methanation for Industrial Closed Carbon Cycles. Front. Sustain. 2:726332. doi: 10.3389/frsus.2021.726332
Received: 16 June 2021; Accepted: 27 August 2021;
Published: 27 September 2021.
Edited by:
Andrea Lanzini, Politecnico di Torino, ItalyReviewed by:
Elkhan Richard Sadik-Zada, Ruhr University Bochum, GermanyKavitha S, Anna University Regional Campus Tirunelveli, India
Copyright © 2021 Böhm, Lehner and Kienberger. This is an open-access article distributed under the terms of the Creative Commons Attribution License (CC BY). The use, distribution or reproduction in other forums is permitted, provided the original author(s) and the copyright owner(s) are credited and that the original publication in this journal is cited, in accordance with accepted academic practice. No use, distribution or reproduction is permitted which does not comply with these terms.
*Correspondence: Hans Böhm, Ym9laG1AZW5lcmdpZWluc3RpdHV0LWxpbnouYXQ=