
94% of researchers rate our articles as excellent or good
Learn more about the work of our research integrity team to safeguard the quality of each article we publish.
Find out more
ORIGINAL RESEARCH article
Front. Surg. , 13 March 2024
Sec. Neurosurgery
Volume 11 - 2024 | https://doi.org/10.3389/fsurg.2024.1363431
 Markus Huber1
 Markus M. Luedi1
 Gerrit A. Schubert2,3Christian Musahl2Angelo Tortora2Janine Frey4Jürgen Beck5,6
 Luigi Mariani7
 Emanuel Christ8,†
 Lukas Andereggen2,9*†,‡
Background: In clinical practice, the size of adenomas is crucial for guiding prolactinoma patients towards the most suitable initial treatment. Consequently, establishing guidelines for serum prolactin level thresholds to assess prolactinoma size is essential. However, the potential impact of gender differences in prolactin levels on estimating adenoma size (micro- vs. macroadenoma) is not yet fully comprehended.
Objective: To introduce a novel statistical method for deriving gender-specific prolactin thresholds to discriminate between micro- and macroadenomas and to assess their clinical utility.
Methods: We present a novel, multilevel Bayesian logistic regression approach to compute observationally constrained gender-specific prolactin thresholds in a large cohort of prolactinoma patients (N = 133) with respect to dichotomized adenoma size. The robustness of the approach is examined with an ensemble machine learning approach (a so-called super learner), where the observed differences in prolactin and adenoma size between female and male patients are preserved and the initial sample size is artificially increased tenfold.
Results: The framework results in a global prolactin threshold of 239.4 μg/L (95% credible interval: 44.0–451.2 μg/L) to discriminate between micro- and macroadenomas. We find evidence of gender-specific prolactin thresholds of 211.6 μg/L (95% credible interval: 29.0–426.2 μg/L) for women and 1,046.1 μg/L (95% credible interval: 582.2–2,325.9 μg/L) for men. Global (that is, gender-independent) thresholds result in a high sensitivity (0.97) and low specificity (0.57) when evaluated among men as most prolactin values are above the global threshold. Applying male-specific thresholds results in a slightly different scenario, with a high specificity (0.99) and moderate sensitivity (0.74). The male-dependent prolactin threshold shows large uncertainty and features some dependency on the choice of priors, in particular for small sample sizes. The augmented datasets demonstrate that future, larger cohorts are likely able to reduce the uncertainty range of the prolactin thresholds.
Conclusions: The proposed framework represents a significant advancement in patient-centered care for treating prolactinoma patients by introducing gender-specific thresholds. These thresholds enable tailored treatment strategies by distinguishing between micro- and macroadenomas based on gender. Specifically, in men, a negative diagnosis using a universal prolactin threshold can effectively rule out a macroadenoma, while a positive diagnosis using a male-specific prolactin threshold can indicate its presence. However, the clinical utility of a female-specific prolactin threshold in our cohort is limited. This framework can be easily adapted to various biomedical settings with two subgroups having imbalanced average biomarkers and outcomes of interest. Using machine learning techniques to expand the dataset while preserving significant observed imbalances presents a valuable method for assessing the reliability of gender-specific threshold estimates. However, external cohorts are necessary to thoroughly validate our thresholds.
Prolactinomas account for the most common type of secretory pituitary adenomas in humans (1). In daily practice, they constitute a therapeutic challenge, both for endocrinologists and neurosurgeons alike, insofar as concurrent effective treatment options exist (2, 3). Dopamine agonists (DAs) are the first-line choice, with strong efficacy to achieve both serum prolactin (PRL) normalization and adenoma size reduction, even to the extent of definitive cure (4). In recent years, surgery was increasingly considered as first-line therapy in patients who have a reasonable likelihood of cure, with the aim of minimizing the need for continuous DA therapy in the long term (2, 3, 5, 6), including potential side effects (7–9).
With regard to the long-term cure, prolactinoma size plays a critical role in triaging patients towards the optimal first-line therapy. Thereby, an increased adenoma size (i.e., macroadenoma) is generally associated with elevated serum PRL levels (10–13). In the context of adenoma size, important gender differences exist. Namely, microprolactinomas are more commonly found in women, and macroprolactinomas in men, given the often unreported or subclinical symptoms of hypogonadism in the latter (6, 14, 15). Current serum prolactin thresholds for distinguishing between micro- and macroadenomas are inadequate due to imprecision, insufficient consideration of individual variations, and overlooking factors like age, gender, and medical conditions, which can affect prolactin levels, making them unsuitable for generalization across all adenoma volumes and thus requiring urgent refinement to improve their accuracy and clinical applicability. As adenoma size correlates with the degree of hyperprolactinemia, optimal prolactin thresholds that account for the observed gender differences in both serum prolactin levels and adenoma size are warranted to robustly guide and triage these patients for optimal first-line therapy robustly.
For a given biomarker and the sampled values from two populations with different disease status, a widely adopted approach used to compute an threshold is the Youden Index (16, 17). Note, however, that there other approaches to derive a threshold and that the optimum may depend on the specific situation (18). The Youden Index is based on sensitivity and specificity values over all possible cut-off values to discriminate between the two populations: The biomarker level that maximizes the Youden Index is considered the optimal threshold. As an example of such a threshold for prolactinoma patients, a retrospective cohort study featuring 114 prolactinoma patients found an optimal threshold value of 204 μg/L and a strong discriminatory ability with respect to adenoma size in terms of the area under the receiver operating characteristic (AUROC: 0.976) (10).
However, given the observed differences in adenoma size and prolactin levels between female and male patients, a crucial question is how the gender-differences in both the average biomarker (prolactin) value and the observed outcomes affects the sample estimate of an optimal threshold, its uncertainty and—importantly—its reliability. Specifically, are high discriminatory metrics in such prolactinoma cohorts dominated by the observation that most male patients presented a macroadenoma? Moreover, is there evidence to calculate gender-dependent prolactin thresholds—and if there is—what would the diagnostic implications of such gender-specific thresholds be?
To start, we present an uncertainty quantification framework to address these questions and apply the proposed framework to a large cohort of prolactinoma patients (N = 133). The framework features a novel multilevel Bayesian logistic regression approach to compute both global and gender-specific prolactin thresholds. The size of the observational constraint is assessed in terms of Bayesian credible intervals. Additionally, we employ a modern ensemble machine learning method [a so-called super learner (19)] to investigate the robustness of the prolactin threshold estimates and their sensitivity to sample size and sampling variability. We emphasize the potential role of machine learning as a hypothesis-generating approach, wherein the additional cohorts in the future can delve deeper into narrowing the uncertainty surrounding prolactin thresholds. Additionally, we conclude by delving into the implications of diverse threshold estimates on clinical practice regarding sensitivity and specificity, and we explore the applications of this framework within the realm of patient-centered care. Furthermore, we address the limitations of this framework and outline potential avenues for future research.
Data collected from our prolactinoma patients and stored in our institutional database between January 1996 and December 2015 included all consecutive patients with prolactinomas treated with first-line surgery or DA therapy of either micro- or macroprolactinomas. Diagnosis was based on clinical and biochemical assessment as well as a standard protocol for pituitary magnetic resonance imaging (MRI). In brief, PRL levels, including the immunoradiometric PRL assay (IRMA), which uses serum dilution in order to overcome the high-dose PRL hook effect (20), were assessed. The presence of macroprolactin was routinely assessed (21). MRI examination was done on a 1.5- or 3-Tesla system including a Proton/T2-weighted whole-brain study with unenhanced, contrast-enhanced, dynamic contrast-enhanced and post contrast-enhanced overlapping studies in the axial, sagittal and coronal planes throughout the sellar region (22) A microadenoma was defined as a tumor with a diameter of 1–10 mm, while a tumor with a diameter exceeding 10 mm was classified as a macroadenoma. Indication for first-line surgery or DA therapy was individually discussed at the weekly interdisciplinary pituitary tumor board meeting, with consensus tailored to preventing patients from becoming dependent on DA therapy over the long term (6, 14, 23). Pituitary surgery was performed using a transseptal, transsphenoidal microsurgical approach with sellar reconstruction.
Summary statistics in Table 1 are based on mean and standard deviation in case of normally distributed quantitative variables and with median and interquartile range otherwise. Categorical variables are presented with counts and frequencies.
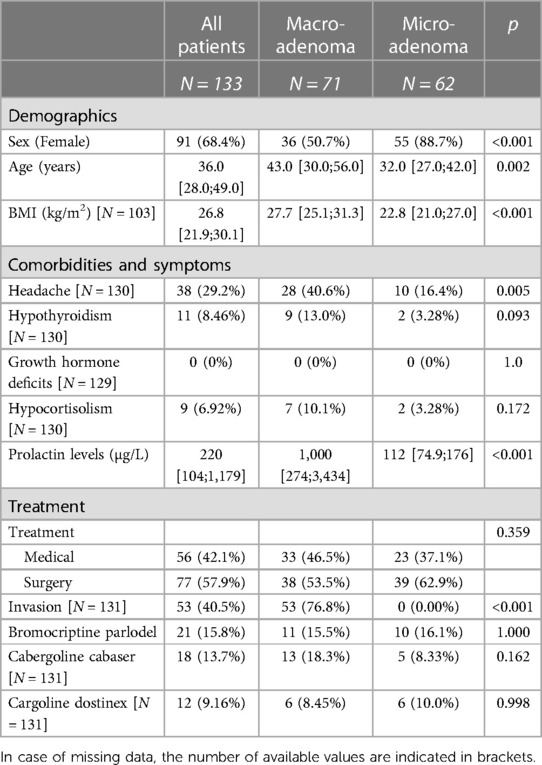
Table 1. Patients’ characteristics: demographics, comorbidities and symptoms as well as treatment information.
The Bayesian mixed-effect logistic regression model was computed with the R-package rstan (24). The model features log-transformed (base 10) serum prolactin as fixed-effect (independent variable), a random offset for gender and adenoma size as binary outcome (0: microadenoma, 1: macroadenoma). The assumption of linearity was assessed by plotting the log-odds of the predicted probability of a microadenoma versus the common logarithm (base 10) of the patient's prolactin levels using traditional logistic regression for simplicity, showing departure from linearity only for very low and very high serum prolactin levels (Supplementary Figure S9). 50,000 samples from the posterior distribution were drawn with the “NUTS“ (No-U-Turn) sampler (25) following a warmup phase of 25,000 samples. Convergence and efficiency of the Markov chain Monte Carlo (MCMC) samples were determined with the Rhat and Effective Sample Size metrics: we checked that Rhat was below 1.1 (26). Weakly informative priors were used by default for the Bayesian logistic regression model without a random offset. In the case of a random offset, the random intercepts were constrained to lay in the interval [−5, 5]. We performed a sensitivity analysis regarding the prior choice of the model parameters using both Cauchy and Normal distributions as priors (Supplementary Figure S5).
The Bayesian logistic regression model allows us to compute a distribution of the probability of a macroadenoma for each patient. Pooling these probability predictions separately for those patients diagnosed with a microadenoma and those with a macroadenoma allows us to assess how well the Bayesian logistic regression model discriminates between the two adenoma types. The more separate the probability distributions are, the more discriminatory information is embedded in the model predictions. The Kolmogorov–Smirnov (KS) statistic is based on the empirical cumulative distribution functions (ecdf) of the predicted probabilities for micro- and macroadenoma patients and quantifies the degree of separability between the two adenoma types. The KS statistic ranges from 0 (identical distribution) up to 1 (perfect separability). The maximum of the KS statistic for two given ecdfs is associated with a certain probability threshold to “optimally” discriminate between the model predictions of micro- and macroadenomas. Calculating the model predictions for a wide range of serum prolactin levels, we derive a two-dimensional density plot relating prolactin levels and the probability of a macroadenoma. We derive a probabilistic distribution of a prolactin threshold by evaluating the two-dimensional density plot at the optimal probability level which was derived with the KS statistic.
Gender-specific prolactin thresholds are derived in a similar fashion. With the use of the random intercept in the multilevel Bayesian logistic regression model, the calibration plots and calculations of the KS statistic can be done separately for female and male patients, resulting in gender-specific probability distribution for a prolactin threshold.
To examine the impact of sample size and sampling variability on the threshold estimates, we choose an ensemble machine learning algorithm—a so-called super learner (19)—to artificially augment the existing dataset with N = 133 prolactinoma patients. A super learner combines various individual machine learning algorithms (so-called base learners, e.g., a random forest) and creates weighted combinations of these base learners in a sort of meta-learner. The weighted combinations are based on a V-fold cross-validation of each base learner of the same V-fold split of the training data. In this study, we build a super learner based on the following base learners: Bayesian Additive Regression Trees, Gradient Boosting Machine, Neural Network, Generalized Additive Model, Linear Regression and Non-Negative Least Squares. As predictors we use age (in years), gender (female vs. male), adenoma size (micro- vs. macroadenoma) and BMI (kg/m2). Missing body mass index (BMI) values were imputed with the median BMI value. By default, we used 10-fold cross validation, and the super learners were evaluated by examining the weight of each base learner and the 10-fold cross validation for each learner (Supplementary Figure S2). The super learners were computed with the R-package SuperLearner (27).
After training the super learner on the working dataset (N = 133), we fitted a normal distribution to the age and BMI values for four subgroups: female patients diagnosed with a microadenoma, female patients diagnosed with a macroadenoma, male patients diagnosed with a microadenoma and male patients diagnosed with a macroadenoma. To achieve an augmented dataset that preserved the observed gender differences in both biomarker size and outcome, we sampled the same number of patients in each of the four subgroups and predicted the corresponding serum prolactin levels with the super learner. For example, we have seven male patients diagnosed with a microadenoma. We thus sampled seven values for age and BMI and calculate the corresponding prolactin levels. Repeating this procedure for all four subgroups, we derived a new “artificial” cohort with the same sample size (N = 133) and with the same number of patients in each of the four categories. Simply adding those “new” patients to the existing cohort doubled the initial sample size. We repeated the augmentation process until we had a sample size ten times larger than the initial cohort. To avoid convergence to the mean and to account for sampling variability, we added some random noise to the prolactinoma predictions of the super learner for each prediction. We further accounted for sampling variability by repeating this data augmentation process from N = 133 to N = 10 × 133 twenty times, thus resulting in a 20-member ensemble of augmented datasets. An example of one such ensemble is shown in Supplementary Figure S1.
As sensitivity analysis, we used a data transformation technique [Synthetic Minority Oversampling Technique; SMOTE (28)] to account for the statistical imbalance in the number of micro- and macroadenomas in the male subgroup. Using oversampling of male patients with a microadenoma, we derive a new cohort with 42 microadenomas and the original 35 macroadenomas, thus representing a more balanced male cohort. We repeat the analysis of the gender-specific threshold computations and the evaluation of test diagnostic with the SMOTE-augmented data. A full table of the results of this sensitivity analysis is provided in the Supplementary Table S1.
All computations were performed with R (29).
The serum prolactin levels in our cohort—stratified according to sex and grouped according to the size of the adenoma—are illustrated in Figure 1A. There are three main features of the cohort that catch the eye. First, male patients have higher prolactin levels [median 1,978.0 μg/L, interquartile range (IQR): 780.0–4,890.0 μg/L] than female patients (median 150.0 μg/L, IQR: 88.4–251.0 μg/L; unadjusted group comparison: p < 0.001). Second, there are more than twice as many female patients (91/133; 68.4%) as male patients (42/133; 31.6%). Third, there is a distinct gender difference in terms of the outcome: only 7/42 (16.6%) male patients featured a microadenoma, whereas the ratio between micro- and macroadenomas in female patients is more balanced: 55/91 (60.4%) females featured a microadenoma and 36/91 (39.6%) females were diagnosed with a macroadenoma.
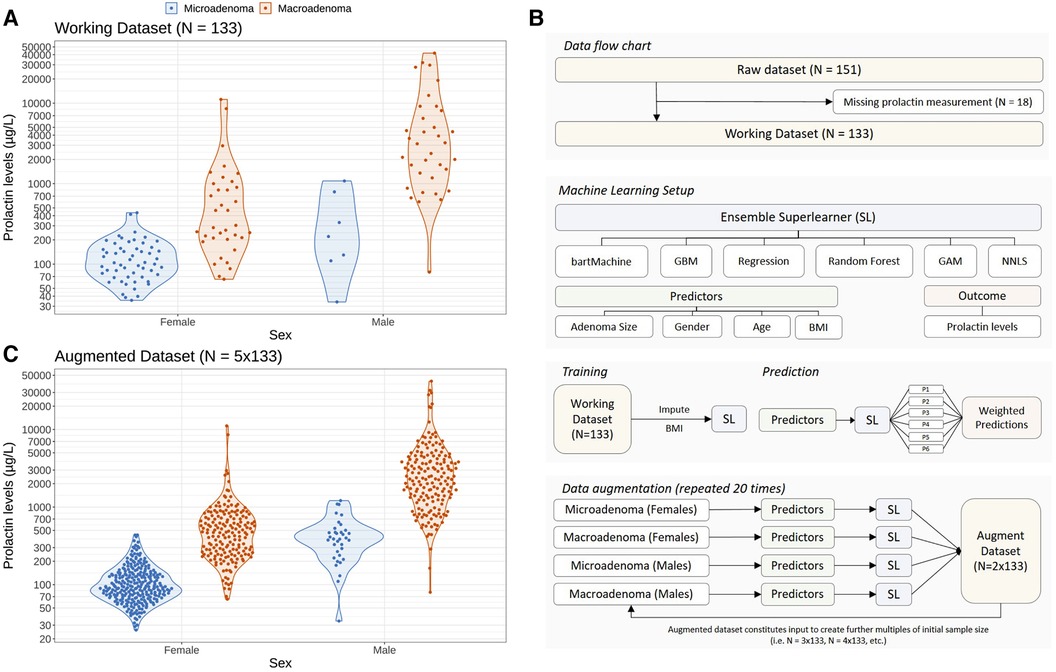
Figure 1. Problem setting of this study and statistical approach to augment the initial dataset using a machine learning ensemble approach in order to study the impact of sample size and sampling variability on optimal prolactin thresholds. (A) Distribution of prolactin levels in female and male patients stratified according to the clinical endpoint adenoma size (microadenomas vs. macroadenomas). Colored dots represent individual patients whereas the data distribution is indicated with violin plots. (B) Illustration of the machine learning setup to create augmented datasets preserving the observed gender difference in adenoma size shown in panel (A). An ensemble of six machine learning methods (so-called base learners) is trained on demographic variables (age, gender and body mass index) and adenoma size to predict the logarithmic serum prolactin levels. To create an augmented dataset, we sample from the observed demographic variables and predict the logarithmic prolactin levels for patients with micro- and macroadenomas separately for females and males. The so-called super learner weighs the predictions of the individual base learners, resulting in a new set of “artificial” patients and their prolactin levels. We repeat this training and prediction process several times to create augmented datasets with a sample size up to ten times the size of the original dataset (N = 133). By repeating this process 20 times and by adding random noise in the predictions of the prolactinoma values, we are able to create a 20-member ensemble of augmented data which accounts for both sample size and sampling variability (see Methods). (C) Illustration of an augmented dataset with a sample size five times the initial dataset (N = 5 × 133).
To investigate the robustness of the prolactin threshold estimates more broadly—in particular with regard to the low incidence of microadenomas in males—we statistically augmented the original dataset to get larger sample sizes using an ensemble of several machine learning algorithms (a so-called super learner) while preserving the observed difference of the original data. The patient flow chart and the machine learning setup are illustrated in Figure 1B. As an example, the augmented dataset featuring 5 times more patients than the original dataset is depicted in Figure 1C and demonstrates that the essential differences of the original data could be preserved. Further examples of the augmented datasets are illustrated in the Supplementary Figure S1.
We now begin to examine how a Bayesian statistical framework can be used to compute a global (that is, without distinguishing between female and male patients) prolactin threshold and to investigate the observational evidence for possible gender-specific thresholds.
Figure 2 illustrates the steps involved in computing these thresholds using both a simple and a multilevel Bayesian logistic regression model (BLRM). In this model we relate the logarithm of the odds of a macro-prolactinoma diagnosis linearly to the logarithm of the PRL levels of each patient (see Methods). The multilevel case allows for a random intercept for female and male patients individually, and thus allows the modeling of gender-specific thresholds containing the full information of the cohort data without the need to consider only the female and male subgroups in a separate fashion.
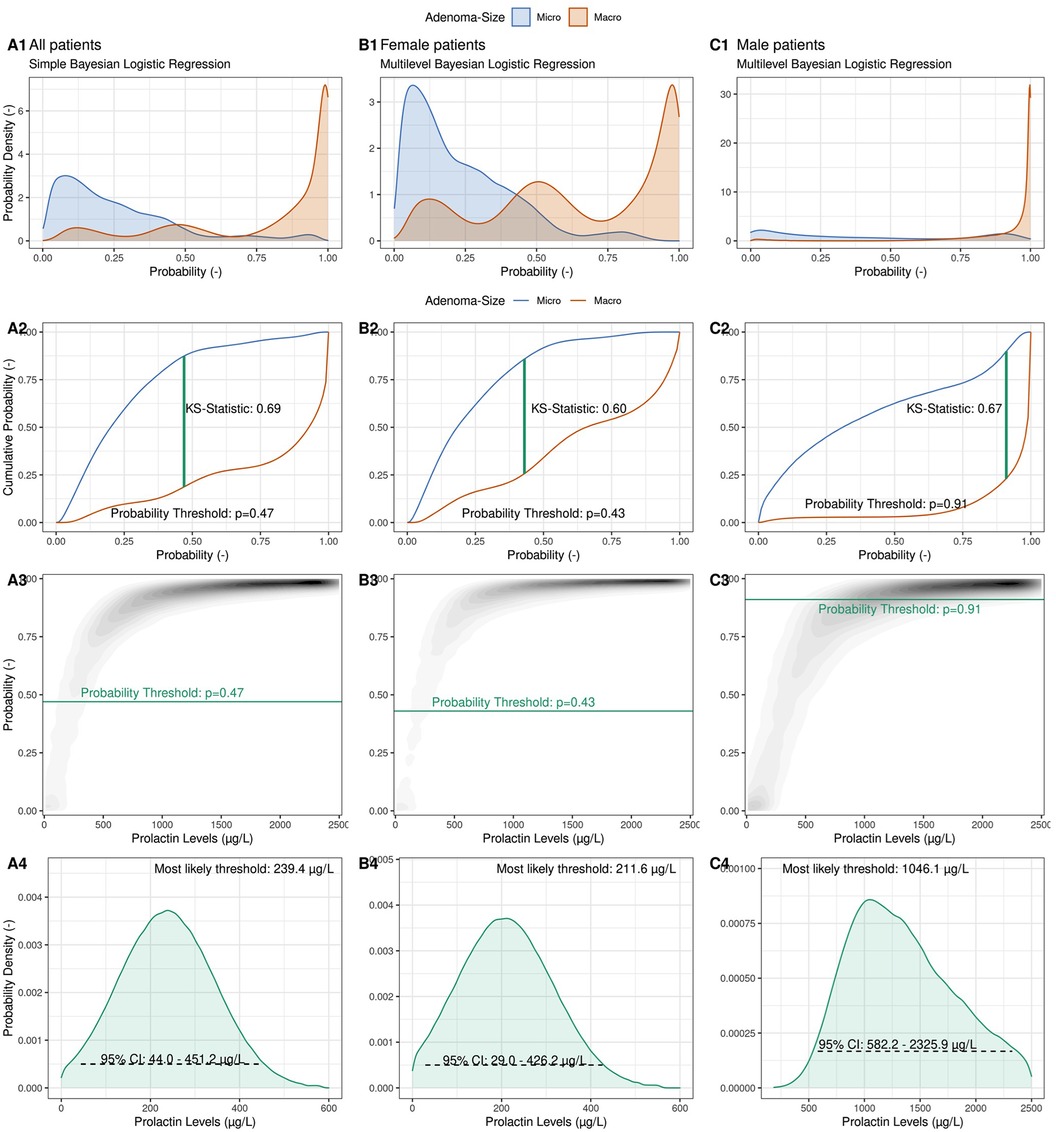
Figure 2. Illustration of the computation of a probabilistic prolactin threshold distribution using a simple Bayesian logistic regression framework. (Column A) A Bayesian logistic regression model is fit to the logarithmic prolactin values of our cohort (N = 133) with adenoma size as the outcome. The predicted probability distributions are shown separately for microadenomas (blue) and macroadenomas (red), allowing to inspect the degree of calibration and discrimination between the two types of adenomas (A1). Illustration of the derivation of an optimal probability threshold based on the cumulative probability distribution of the two adenoma classes using the Kolmogorov–Smirnov (K–S) statistic (A2) Projection of the optimal probability threshold onto a prolactin threshold distribution using the posterior probabilistic distribution of the Bayesian logistic regression (A3). Illustration of the derived observationally constrained distribution of the optimal prolactin threshold for all patients. The most likely threshold and the 95% credible interval (CI) are shown (A4). (Column B) Derivation of a female-specific prolactin threshold. (Column C) Derivation of a male-specific prolactin threshold.
The calibration of the BLRM is depicted in Figure 2 Panel A1, where aggregated predicted probabilities are shown for patients diagnosed with a microadenoma (blue) and with a macroadenoma (red), respectively. The model is well calibrated, and predicted probabilities above the (default) probability threshold of p = 0.5 are correctly associated with macroadenomas and vice versa for microadenomas. With the help of the empirical cumulative distribution function of these predicted probabilities and the Kolmogorow-Smirnov static (KS-statistic; see Methods), a prediction probability threshold of pthreshold = 0.48 can be calculated, which optimally discriminates between the two possible outcomes (Figure 2 Panel A2). Note that this probability threshold is close to the default threshold of p = 0.5.
After the BLRM was fit to the data, the predicted probabilities of a macroadenoma diagnosis for a range of possible prolactin levels could be visualized (Figure 2 Panel A3), with the curvature depending on the model parameters (the intercept and the slope). As before, low prolactin levels are associated with low probability of a macroadenoma, and vice versa. To derive an observationally constrained prolactin threshold, we read Figure 2 Panel A3 not from prolactin levels (abscissa) to predicted probabilities (ordinate), but in the other direction. That is, we relate probabilities to prolactin levels. Drawing the previously estimated optimal prediction probability threshold (pthreshold) as a horizontal line, we derive an observationally constrained probability distribution for the optimal global prolactin threshold, with a most likely value of 239.4 μg/L (95% credible interval: 44.0–451.2 μg/L) to discriminate between micro- and macroadenomas instead of a simple point estimate of the optimal threshold value. The width and shape of the threshold distribution reflects the amount of observational evidence as well as the assumptions regarding the choice of prior distributions for the model parameters. Note that computation of, for example, a 95% credible interval does not require frequentist interpretations such as repeated sampling or the use of bootstrapping methods to derive plausible ranges of the threshold value.
The multilevel BLRM allows a density plot of predicted probabilities to be drawn for female and male patients separately (Figures 2, columns B + C), and thus to derive observationally constrained probability distributions for gender-specific prolactin thresholds. For female patients, we derive a most likely threshold estimate of 211.6 μg/L (95% CI: 29.0–426.2 μg/L), which is slightly below the global threshold of 239.4 μg/L. We calculate a most likely threshold value of 1,046.1 μg/L for male patients; however, the width of the male-dependent prolactin threshold is very wide (95% CI: 582.2–2,325.9 μg/L). The observational constraints on the model parameters are low (Supplementary Figure S4). The male-specific prolactin threshold distributions show some dependency on the choice of priors, in particular for small sample sizes (Supplementary Figure S5).
To assess the sensitivity of the prolactin threshold estimates to the sample size and to sampling variability, we illustrate the most likely estimates and 95% credible intervals of the global and gender-specific prolactin thresholds as a function of sample size in Figure 3. The estimates of the global and female-specific thresholds are robust both in terms of sample size and sampling variability. In stark contrast, the male-specific threshold estimates vary significantly with respect to sampling variability: the most likely estimate can vary between 606.0 μg/L and 1,456.1 μg/L, and the 95% credible interval covers the range from 386.2 μg/L to 2,432.0 μg/L. Figure 3 further illustrates the corresponding estimates when the Youden Index is used to compute the thresholds and highlights the similarity of the two threshold methods. Note, however, that the width of the bootstrapped 95% confidence interval for the threshold derived with the Youden Index is generally smaller than the width of the 95% credible interval derived with the Bayesian framework (Supplementary Figure S6). Further highlights that the uncertainty ranges of the threshold estimates are reduced with increasing sample size.
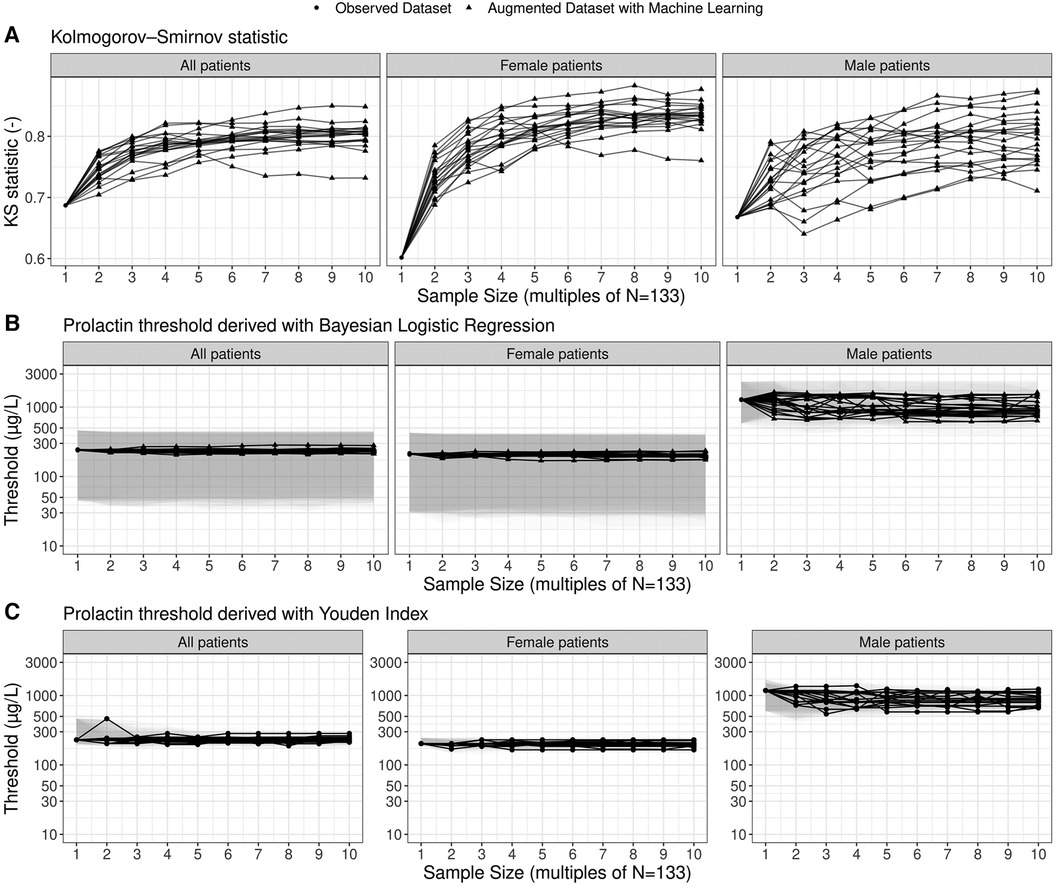
Figure 3. Estimates of prolactin threshold as a function of sample size and sampling variability. The sample size is shown as multiples of the original sample size of the working dataset (N = 133; see Figure 1). The most likely estimates (points and lines) and 95% credible intervals (shaded grey areas) are shown for the prolactin thresholds derived by means of the multilevel Bayesian logistic regression approach. In total, twenty ensembles of augmented datasets were created to account for sampling variability and each solid line refers to one particular member of the ensemble. For the thresholds based on the Youden Index, point estimates as well as non-parametric bootstrap 95% confidence intervals are shown.
When correcting for the imbalance in adenoma size in male patients, we derive higher prolactin thresholds for the entire cohort and the male subgroup with 460.9 μg/L (95% credible interval: 216.1–793.3 μg/L) and 1,326.0 μg/L (95% credible interval: 875.4–2,211.9 μg/L), respectively. The female-specific prolactin threshold remains similar with 213.8 μg/L (95% credible interval: – 2,211.9 μg/L).
To conclude, we examine the discriminatory ability of prolactin thresholds in terms of the area under the receiver operating characteristic (AUROC) and the effect of the global and gender-specific threshold values on the estimates of validity (sensitivity and specificity). An overview of the performance metrics is provided in Table 2. Figure 4 illustrates that the discriminatory capacity is high for the entire cohort (AUROC 0.91, 95%-CI: 0.85–0.95) as well as for the female subgroup (AUROC 0.87, 95%-CI: 0.78–0.94) and male subgroup (AUROC 0.93, 95%-CI: 0.83–1.00). For female patients, Figures 4E,F illustrate that sensitivity values are slightly higher when the female prolactin levels are evaluated with a female-specific threshold: 0.69 (95%-CI: 0.47–1.00) vs. 0.61 (95%-CI: 0.47–1.00). In contrast, using the female-specific threshold results in lower specificity values: 0.91 (95%-CI: 0.00–0.98) vs. 0.95 (95%-CI: 0.09–1.00). The same patterns are observed when the threshold are derived with the Youden Index (Table 2), but the credible intervals are much broader for the performance metrics derived with the Bayesian framework. Overall, using a female-specific threshold results in a more balanced performance in terms of sensitivity and specificity for female patients.
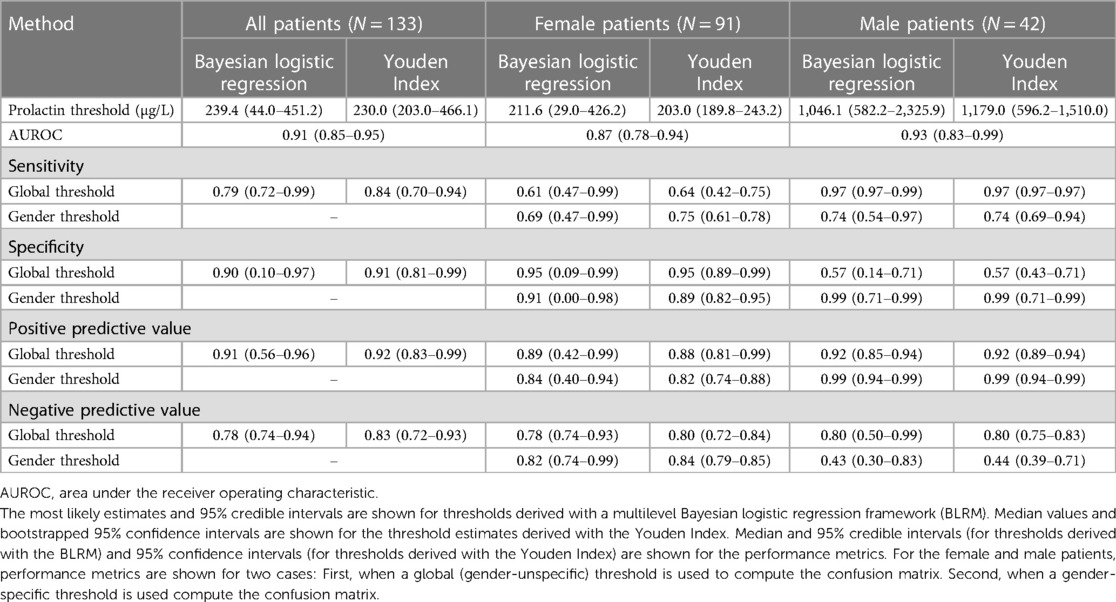
Table 2. Estimates of serum prolactin thresholds to discriminate between micro- and macroadenomas in a cohort of N = 133 prolactinoma patients and associated performance metrics.
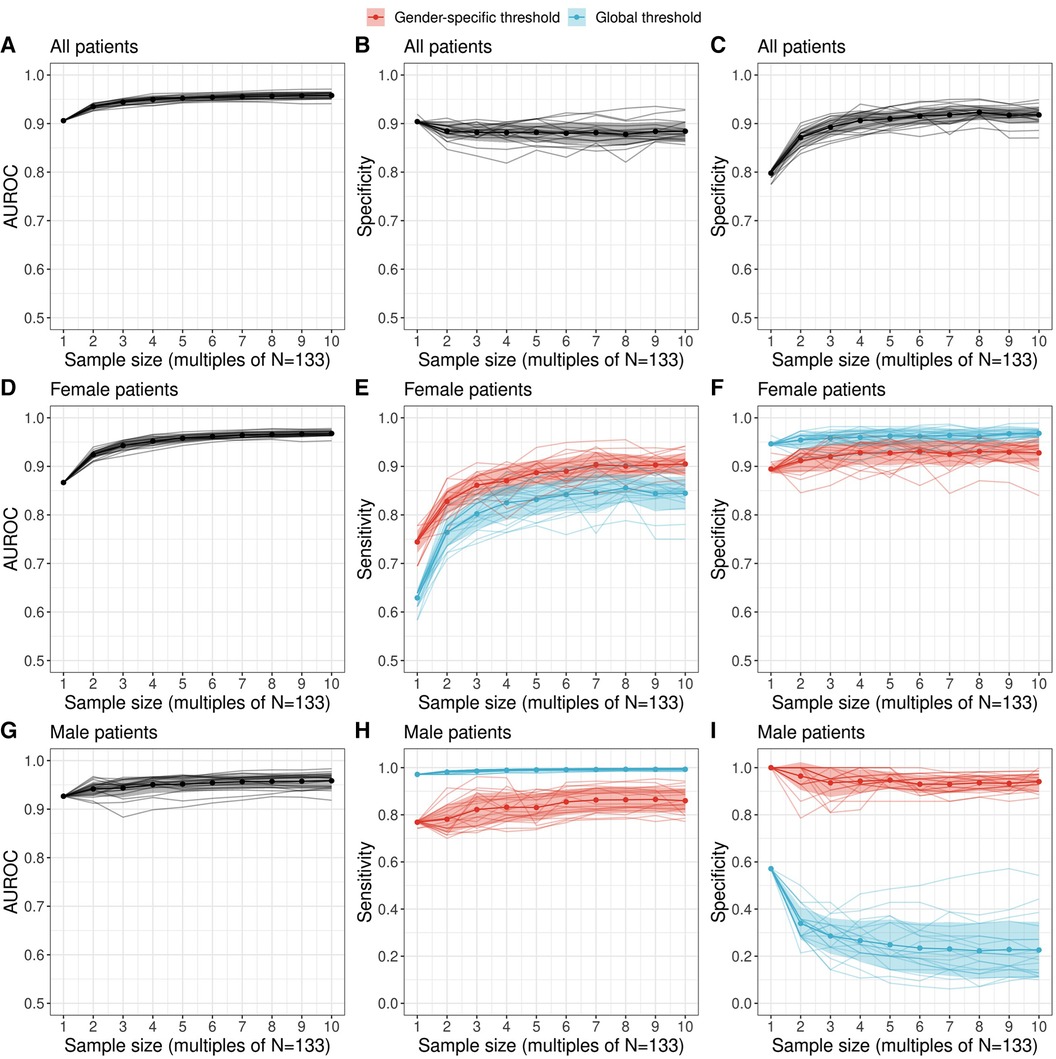
Figure 4. Performance of a diagnostic test relating serum prolactin levels to adenoma size (microadenoma vs. macroadenoma) as a function of sample size. Performance metrics were evaluated with the most likely prolactin threshold estimate derived with the proposed Bayesian logistic regression framework. We employed a machine learning ensemble (a so-called super learner) to derive augmented datasets which preserve the observed gender difference in adenoma size of the original dataset. The area under the receiver operating characteristic (AUROC) as well as sensitivity and specificity metrics are shown for all patients [(A–C) top row], female patients [(D–F) middle row] and male patients [(G–I) bottom row]. For female and male patients, the sensitivity and specificity was evaluated both for a global threshold (blue) and a gender-specific threshold (red) derived with a multilevel Bayesian logistic regression model (see Methods). Individual colored lines show the estimates of a twenty-member ensemble that representing sampling variability.
For male patients, Figures 4H,I highlight a key finding of this study: evaluating the prolactin levels of the male subgroup with a global prolactin thresholds results in very high sensitivity (0.97, 95%-CI: 0.97–1.00) but very low specificity (0.57, 95%-CI: 0.14–0.71), suggesting that male patients with true macroadenomas are very likely to be identified, whereas the test fails to detect true microadenomas in male patients. The reverse is true in the male subgroup when a male-specific threshold is used for diagnosis, resulting in high specifivity and moderate sensitivity (Table 2). Thus, for male patients, a negative diagnosis based on a global prolactin threshold can be useful for ruling out a macroadrenoma, whereas a positive diagnosis based on a male-specific prolactin threshold can be useful for ruling in a macroadrenoma. To aid in interpretation, one can refer to Figure 1 and mentally draw a horizontal line at the global threshold of 239.4 μg/L. As for female patients, using a female-specific threshold results in a more balanced testing regime, in which both sensitivity and specificity are high.
Importantly, the augmented datasets suggest that specificity for the male subgroups when based on a global prolactin threshold gets lower the larger the sample size becomes. This sample size dependence, as well as the low sensitivity suggested for larger cohorts, provides further motivation to use a male-specific threshold instead of a global prolactin threshold. These results are robust in terms of threshold method; i.e., when thresholds based on the Youden Index are employed (Supplementary Figure S10). We emphasize that the uncertainty ranges of the performance metrics are larger for the estimates derived with the Bayesian logistic regression framework, which results from the broader threshold estimates compared to the estimates based on the Youden Index (Figure 3).
The computation of an optimal cutoff threshold in prolactin levels to discriminate between micro- and microadenomas constitutes an essential step in the diagnosis, triage and treatment of patients. While there are traditional methods such as the Youden Index to derive such thresholds, issues i.e., with imbalanced datasets (30), the effect of the sample size on the measure of validity (31), the distribution of the biomarker in question (32), unquantifiable biomarker levels below a limit of detection (33) and the impact of prevalence (34) are increasingly investigated. We are advancing these efforts by introducing a novel Bayesian logistic regression framework to compute both global and gender-specific serum prolactin thresholds in prolactinoma patients.
In terms of clinical utility, a key result of this study is that for male patients, a negative diagnosis based on a global prolactin threshold can be useful for ruling out a macroadrenoma, whereas a positive diagnosis based on a male-specific prolactin threshold can be useful for ruling in a macroadrenoma. However, compared to men, a female-specific prolactin threshold has only limited impact on clinical utility in our cohort. Overall, we thus argue that in cases where it can be expected that the average biomarkers in two populations differ (e.g., the serum prolactin levels in female and male prolactinoma patients), it is essential to investigate the characteristics of a diagnostic test based on biomarker thresholds both in the entire cohort and in individual subgroups.
Diagnostic errors for correct detection of either microadenomas or macroadenomas are clinically equally important, in particular with regard to the presence of gender differences. The higher thresholds of 1,046.1 μg/L (95% CI: 582.2–2,325.9 μg/L) for men are of clinical interest, as they differ from the traditional applied cutoff values for prolactinoma detection. It is well established that men presenting with prolactinomas are more frequently diagnosed with a macroadenoma than women, suggesting that gender is an important determinant of adenoma size (6, 14, 15) while drug-induced hyperprolactinemia, systemic diseases or stalk effect generally account for lower serum prolactin values (35). In the context of the clinical utility of gender-specific prolactin thresholds, further analyses, e.g., in the decision curve analysis framework (36), are envisaged.
Given the importance of sample size and sampling variability, we employed a modern machine learning ensemble approach [a so-called super learner (19)] to examine the impact of these two key statistical characteristics on the threshold and performance estimates by statistically augmenting the initial data set and by introducing sampling uncertainty. This novel approach of modern machine learning resulted in important results: We were able to demonstrate that future, larger cohorts are likely able to reduce the uncertainty range of the prolactin thresholds—both for the Bayesian regression approach proposed here and the traditional approach using the Youden Index (Supplementary Figure S6). In addition, we found that male-specific thresholds are more sensitive to sampling variability and sample size than global and female-specific thresholds (Figure 3) and that a much bigger sample size is required for confidently constraining gender-specific thresholds (particularly so for the case of the male-specific threshold). However, we note that such data augmentation methods might further increase existing biases that may be inherent in the dataset. When accounting for statistical imbalances in the number of micro- and macroadenomas in male patients using a data augmentation method (SMOTE), differences in gender-specific prolactin thresholds with respect to adenoma size remained, with male-specific thresholds being significantly higher (Supplementary Table S1).
In terms of statistical methodology, a key advantage of regression models is that they provide a simple framework for covariate adjustment, and this is increasingly appreciated in the domain of classification settings using biomarkers (17, 37–42). Additionally, a regression approach provides an assessment of the calibration of the classifier, which is crucial in determining the reliability of a prediction model (43, 44). Using Bayesian methods to compute thresholds was proposed previously (45, 46); however, to the best of our knowledge this is the first study to combine a multilevel Bayesian logistic regression framework with the Kolmogorov–Smirnov statistic to estimate probability distributions of biomarker thresholds, which is of clinical importance. The Kolmogorov-Smirnov statistic is applied to empirical cumulative distribution functions (ecdfs) which also play an essential role in empirical estimation methods of the Youden Index (33, 47). An important distinction between the said methods and the framework described in this study is that ecdfs of predicted probabilities are considered, whereas ecdfs of a particular biomarker are used to compute the Youden Index.
This study features some inherent limitations. First, the uncertainty quantification presented here considers only internal validation; a more robust evaluation needs to be performed on an external dataset, which is a crucial step in establishing the reliability of the inferred threshold (48, 49). Thus data sharing and collaboration among medical researchers would benefit the uncertainty quantification of prolactin thresholds in two ways: the observational constraint can be better quantified within the Bayesian framework using larger cohorts and the threshold estimates can be externally validated. Second, the framework presented here is a first, yet important step providing broad opportunities for extensions and refinements, e.g., different super learners and data augmentation approaches can be used to generate hypotheses for future cohorts. Additionally, given the small sample sizes of current prolactinoma cohorts, uncertainty estimates based on non-parametric resampling methods such as used here for the thresholds based on the Youden Index might result in very similar threshold estimates with narrow confidence intervals as the same observations are repeatedly sampled. This issue could be overcome in future studies by using other bootstrap methods (50). Third, this study focused on introducing a novel framework for computing prolactin thresholds and could not account for the impact of qualities such as age on the prolactin levels. To do this, follow-up studies are needed.
The proposed framework constitutes a new step towards more patient-centered care in the treatment strategy of prolactinoma patients. Our results provide initial evidence that male-specific thresholds would be higher than female-specific thresholds. The advantages of the proposed framework is its ability to describe an entire cohort without resorting to subgroup analysis and its broad applicability to diagnostic settings where there are two subgroups in which the average biomarker and the outcome of interest differ. An important added value of the proposed threshold computation approach method is that it provides a broad and traceable means to assess the magnitude of the observational constraint on threshold value that is inherent in the data. This broader uncertainty assessment can be of particular value in the case of small sample sizes, where calculated thresholds can lead to overly optimistic estimates of sensitivity and specificity. Additionally, utilizing machine learning methods to enhance the collected dataset while maintaining crucial observed distinctions between two groups of interest offers a valuable approach to examining the robustness of threshold estimates. However, external cohorts are required to thoroughly validate our thresholds.
The original contributions presented in the study are included in the article/Supplementary Material, further inquiries can be directed to the corresponding author.
The research was approved by the Human Research Ethics Committee of Bern, Switzerland, in accordance with local laws and institutional guidelines (KEK n° 10-10-2006 and 8-11-2006). Written informed consent from participants or their legal guardians was not required, as the ethics committee waived this requirement as part of the study approval process.
MH: Writing – review & editing, Writing – original draft, Visualization, Investigation, Formal Analysis, Conceptualization. ML: Writing – review & editing. GS: Writing – review & editing. CM: Writing – review & editing. AT: Writing – review & editing. JF: Writing – review & editing, Data curation. JB: Writing – review & editing. LM: Writing – review & editing. EC: Writing – review & editing, Supervision, Conceptualization, Data curation. LA: Writing – review & editing, Writing – original draft, Supervision, Data curation, Conceptualization.
The author(s) declare that no financial support was received for the research, authorship, and/or publication of this article.
The assistance of Ms. Jeannie Wurz in editing the manuscript is greatly appreciated.
The authors declare that the research was conducted in the absence of any commercial or financial relationships that could be construed as a potential conflict of interest.
The handling editor BEG declared a past co-authorship with the authors LA, GS, CM, AT.
All claims expressed in this article are solely those of the authors and do not necessarily represent those of their affiliated organizations, or those of the publisher, the editors and the reviewers. Any product that may be evaluated in this article, or claim that may be made by its manufacturer, is not guaranteed or endorsed by the publisher.
The Supplementary Material for this article can be found online at: https://www.frontiersin.org/articles/10.3389/fsurg.2024.1363431/full#supplementary-material
1. Molitch ME. Diagnosis and treatment of pituitary adenomas: a review. JAMA. (2017) 317(5):516–24. doi: 10.1001/jama.2016.19699
2. Baussart B, Villa C, Jouinot A, Raffin-Sanson M-L, Foubert L, Cazabat L, et al. Pituitary surgery as alternative to dopamine agonists treatment for microprolactinomas: a cohort study. Eur J Endocrinol. (2021) 185(6):783–91. doi: 10.1530/EJE-21-0293
3. Mattogno PP, D’Alessandris QG, Chiloiro S, Bianchi A, Giampietro A, Pontecorvi A, et al. Reappraising the role of trans-sphenoidal surgery in prolactin-secreting pituitary tumors. Cancers (Basel). (2021) 13(13):3252. doi: 10.3390/cancers13133252
4. Auriemma RS, Pirchio R, De Alcubierre D, Pivonello R, Colao A. Dopamine agonists: from the 1970s to today. Neuroendocrinology. (2019) 109(1):34–41. doi: 10.1159/000499470
5. Huber M, Luedi MM, Schubert GA, Musahl C, Tortora A, Frey J, et al. Machine learning for outcome prediction in first-line surgery of prolactinomas. Front Endocrinol (Lausanne). (2022) 13. doi: 10.3389/fendo.2022.810219
6. Andereggen L, Frey J, Andres RH, Luedi MM, El-Koussy M, Widmer HR, et al. First-line surgery in prolactinomas: lessons from a long-term follow-up study in a tertiary referral center. J Endocrinol Investig. (2021) 44(12):2621–33. doi: 10.1007/s40618-021-01569-6
7. De Sousa SMC, Baranoff J, Rushworth RL, Butler J, Sorbello J, Vorster J, et al. Impulse control disorders in dopamine agonist-treated hyperprolactinemia: prevalence and risk factors. J Clin Endocrinol Metab. (2019) 105(3):e108–e18. doi: 10.1210/clinem/dgz076
8. Caputo C, Prior D, Inder WJ. The need for annual echocardiography to detect cabergoline-associated valvulopathy in patients with prolactinoma: a systematic review and additional clinical data. Lancet Diabetes Endocrinol. (2015) 3(11):906–13. doi: 10.1016/S2213-8587(14)70212-8
9. De Sousa SMC. Dopamine agonist therapy for prolactinomas: do we need to rethink the place of surgery in prolactinoma management? Endocr Oncol. (2022) 2(1):R31–50. doi: 10.1530/EO-21-0038
10. Leca BM, Mytilinaiou M, Tsoli M, Epure A, Aylwin SJB, Kaltsas G, et al. Identification of an optimal prolactin threshold to determine prolactinoma size using receiver operating characteristic analysis. Sci Rep. (2021) 11(1):9801. doi: 10.1038/s41598-021-89256-7
11. Wright K, Lee M, Escobar N, Pacione D, Young M, Fatterpekar G, et al. Tumor volume improves preoperative differentiation of prolactinomas and nonfunctioning pituitary adenomas. Endocrine. (2021) 74(1):138–45. doi: 10.1007/s12020-021-02744-8
12. Burke WT, Penn DL, Castlen JP, Donoho DA, Repetti CS, Iuliano S, et al. Prolactinomas and nonfunctioning adenomas: preoperative diagnosis of tumor type using serum prolactin and tumor size. J Neurosurg. (2020) 133(2):321–8. doi: 10.3171/2019.3.JNS19121
13. Faje A, Jones P, Swearingen B, Tritos NA. The prolactin per unit tumor volume ratio accurately distinguishes prolactinomas from secondary hyperprolactinemia due to stalk effect. Endocr Pract. (2022) 28(6):572–7. doi: 10.1016/j.eprac.2022.03.013
14. Andereggen L, Frey J, Andres RH, Luedi MM, Widmer HR, Beck J, et al. Persistent bone impairment despite long-term control of hyperprolactinemia and hypogonadism in men and women with prolactinomas. Sci Rep. (2021) 11(1):5122. doi: 10.1038/s41598-021-84606-x
15. Colao A, Sarno A, Cappabianca P, Briganti F, Pivonello R, Somma C, et al. Gender differences in the prevalence, clinical features and response to cabergoline in hyperprolactinemia. Eur J Endocrinol. (2003) 148(3):325–31. doi: 10.1530/eje.0.1480325
16. Youden WJ. Index for rating diagnostic tests. Cancer. (1950) 3(1):32–5. doi: 10.1002/1097-0142(1950)3:1%3C32::AID-CNCR2820030106%3E3.0.CO;2-3
17. Schisterman EF, Perkins NJ, Liu A, Bondell H. Optimal cut-point and its corresponding Youden Index to discriminate individuals using pooled blood samples. Epidemiology. (2005) 16(1):73–81. doi: 10.1097/01.ede.0000147512.81966.ba
18. Vetter TR, Schober P, Mascha EJ. Diagnostic testing and decision-making: beauty is not just in the eye of the beholder. Anesth Analg. (2018) 127(4):1085–91. doi: 10.1213/ANE.0000000000003698
19. Laan , Polley MJvd, Hubbard EC AE. Super learner. Stat Appl Genet Mol Biol. (2007) 6(1). doi: 10.2202/1544-6115.1309
20. Karavitaki N, Thanabalasingham G, Shore HC, Trifanescu R, Ansorge O, Meston N, et al. Do the limits of serum prolactin in disconnection hyperprolactinaemia need re-definition? A study of 226 patients with histologically verified non-functioning pituitary macroadenoma. Clin Endocrinol (Oxf). (2006) 65(4):524–9. doi: 10.1111/j.1365-2265.2006.02627.x
21. Cattaneo F, Kappeler D, Müller B. Macroprolactinaemia, the major unknown in the differential diagnosis of hyperprolactinaemia. Swiss Med Wkly. (2001) 131(9–10):122–6. doi: 10.4414/smw.2001.06127
22. Andereggen L, Gralla J, Schroth G, Mordasini P, Andres RH, Widmer HR, et al. Influence of inferior petrosal sinus drainage symmetry on detection of adenomas in cushing’s syndrome. J Neuroradiol. (2021) 48(1):10–5. doi: 10.1016/j.neurad.2019.05.004
23. Andereggen L, Frey J, Andres RH, Luedi MM, Gralla J, Schubert GA, et al. Impact of primary medical or surgical therapy on prolactinoma patients’ BMI and metabolic profile over the long-term. J Clin Transl Endocrinol. (2021) 24: 100258. doi: 10.1016/j.jcte.2021.100258
24. Stan Development Team. RStan: the R Interface to Stan. (2022). Available online at: https://mc-stan.org/users/interfaces/rstan (accessed July 13, 2021).
25. Homan MD, Gelman A. The No-U-Turn sampler: adaptively setting path lengths in hamiltonian monte carlo. J Mach Learn Res. (2014) 15(1):1593–623.
26. Gelman A, Rubin DB. Inference from iterative simulation using multiple sequences. Stat Sci. (1992) 7(4):457–72.
27. Polley E, LeDell E, Kennedy C, van der Laan M. SuperLearner: Super Learner Prediction. (2021). Available online at: https://cran.r-project.org/web/packages/SuperLearner/index.html (accessed August 08, 2022).
28. Chawla NV, Bowyer KW, Hall LO, Kegelmeyer WP. SMOTE: synthetic minority over-sampling technique. J Artif Int Res. (2002) 16(1):321–57.
29. R Core Team. R: A Language and Environment for Statistical Computing. Vienna, Austria (2020) https://www.r-project.org/ (accessed June 06, 2021).
30. He H, Garcia EA. Learning from imbalanced data. IEEE Trans Knowl Data Eng. (2009) 21(9):1263–84. doi: 10.1109/TKDE.2008.239
31. Leeflang MMG, Moons KGM, Reitsma JB, Zwinderman AH. Bias in sensitivity and specificity caused by data-driven selection of optimal cutoff values: mechanisms, magnitude, and solutions. Clin Chem. (2008) 54(4):729–37. doi: 10.1373/clinchem.2007.096032
32. Subtil F, Rabilloud M. Estimating the optimal threshold for a diagnostic biomarker in case of complex biomarker distributions. BMC Med Inform Decis Mak. (2014) 14(1):53. doi: 10.1186/1472-6947-14-53
33. Ruopp MD, Perkins NJ, Whitcomb BW, Schisterman EF. Youden Index and optimal cut-point estimated from observations affected by a lower limit of detection. Biometrical J. (2008) 50(3):419–30. doi: 10.1002/bimj.200710415
34. Smits N. A note on youden’s jand its cost ratio. BMC Med Res Methodol. (2010) 10(1):89. doi: 10.1186/1471-2288-10-89
35. Vilar L, Vilar CF, Lyra R, Freitas MC. Pitfalls in the diagnostic evaluation of hyperprolactinemia. Neuroendocrinology. (2019) 109(1):7–19. doi: 10.1159/000499694
36. Vickers AJ, Elkin EB. Decision curve analysis: a novel method for evaluating prediction models. Med Decis Making. (2006) 26(6):565–74. doi: 10.1177/0272989X06295361
37. Janes H, Pepe MS. Adjusting for covariates in studies of diagnostic, screening, or prognostic markers: an old concept in a new setting. Am J Epidemiol. (2008) 168(1):89–97. doi: 10.1093/aje/kwn099
38. Pere MS. A regression modelling framework for receiver operating characteristic curves in medical diagnostic testing. Biometrika. (1997) 84(3):595–608. doi: 10.1093/biomet/84.3.595
39. Pepe MS. An interpretation for the ROC curve and inference using GLM procedures. Biometrics. (2000) 56(2):352–9. doi: 10.1111/j.0006-341X.2000.00352.x
40. Faraggi D. Adjusting receiver operating characteristic curves and related indices for covariates. J Royal Stat Soc Ser D (the Statistician). (2003) 52(2):179–92.
41. Schisterman EF, Reiser B, Faraggi D. ROC analysis for markers with mass at zero. Stat Med. (2006) 25(4):623–38. doi: 10.1002/sim.2301
42. Schisterman EF, Faraggi D, Reiser B, Hu J. Youden Index and the optimal threshold for markers with mass at zero. Stat Med. (2008) 27(2):297–315. doi: 10.1002/sim.2993
43. Van Calster B, McLernon DJ, van Smeden M, Wynants L, Steyerberg EW, Bossuyt P, et al. Calibration: the achilles heel of predictive analytics. BMC Med. (2019) 17(1):230. doi: 10.1186/s12916-019-1466-7
44. Cearns M, Hahn T, Clark S, Baune BT. Machine learning probability calibration for high-risk clinical decision-making. Aust N Z J Psychiatry. (2020) 54(2):123–6. doi: 10.1177/0004867419885448
45. Blangero Y, Rabilloud M, Ecochard R, Subtil F. A Bayesian method to estimate the optimal threshold of a marker used to select patients’ treatment. Stat Methods Med Res. (2020) 29(1):29–43. doi: 10.1177/0962280218821394
46. Subtil F, Rabilloud M. A Bayesian method to estimate the optimal threshold of a longitudinal biomarker. Biom J. (2010) 52(3):333–47. doi: 10.1002/bimj.200900242
47. Fluss R, Faraggi D, Reiser B. Estimation of the Youden Index and its associated cutoff point. Biom J. (2005) 47(4):458–72. doi: 10.1002/bimj.200410135
48. Steyerberg EW, Harrell FE. Prediction models need appropriate internal, internal–external, and external validation. J Clin Epidemiol. (2016) 69:245–7. doi: 10.1016/j.jclinepi.2015.04.005
49. Ramspek CL, Jager KJ, Dekker FW, Zoccali C, van Diepen M. External validation of prognostic models: what, why, how, when and where? Clin Kidney J. (2020) 14(1):49–58. doi: 10.1093/ckj/sfaa188
Keywords: prolactinoma, prolactin, biomarker, optimal threshold, machine learning, gender, adenoma size
Citation: Huber M, Luedi MM, Schubert GA, Musahl C, Tortora A, Frey J, Beck J, Mariani L, Christ E and Andereggen L (2024) Gender-specific prolactin thresholds to determine prolactinoma size: a novel Bayesian approach and its clinical utility. Front. Surg. 11:1363431. doi: 10.3389/fsurg.2024.1363431
Received: 30 December 2023; Accepted: 26 February 2024;
Published: 13 March 2024.
Edited by:
Basil Erwin Grüter, Hôpital de la Timone, FranceReviewed by:
Patrick Schober, Academic Medical Center, Netherlands© 2024 Huber, Luedi, Schubert, Musahl, Tortora, Frey, Beck, Mariani, Christ and Andereggen. This is an open-access article distributed under the terms of the Creative Commons Attribution License (CC BY). The use, distribution or reproduction in other forums is permitted, provided the original author(s) and the copyright owner(s) are credited and that the original publication in this journal is cited, in accordance with accepted academic practice. No use, distribution or reproduction is permitted which does not comply with these terms.
*Correspondence: Lukas Andereggen bHVrYXMuYW5kZXJlZ2dlbkBrc2EuY2g=
†These authors have contributed equally to this work and share last authorship
Abbreviations AUROC, area under the receiver operating characteristic; DA, dopamine agonist; MRI, magnetic resonance imaging; PRL, prolactin; TSS, transsphenoidal surgery.
‡ORCID Lukas Andereggen orcid.org/0000-0003-1764-688X
Disclaimer: All claims expressed in this article are solely those of the authors and do not necessarily represent those of their affiliated organizations, or those of the publisher, the editors and the reviewers. Any product that may be evaluated in this article or claim that may be made by its manufacturer is not guaranteed or endorsed by the publisher.
Research integrity at Frontiers
Learn more about the work of our research integrity team to safeguard the quality of each article we publish.