
94% of researchers rate our articles as excellent or good
Learn more about the work of our research integrity team to safeguard the quality of each article we publish.
Find out more
ORIGINAL RESEARCH article
Front. Surg., 21 July 2022
Sec. Reconstructive and Plastic Surgery
Volume 9 - 2022 | https://doi.org/10.3389/fsurg.2022.860806
This article is part of the Research TopicApplication of Stem Cell Therapy and Bioinformatics in Wound Repair and Skin DiseasesView all 13 articles
 Yujian Xu1,†
 Youbai Chen1,†
 Zehao Niu1,†
 Zheng Yang1
 Jiahua Xing1
 Xiangye Yin1
 Lingli Guo1
 Qixu Zhang2Yi Yang3*
 Yan Han1*
Purpose: Ferroptosis-related lncRNAs are promising biomarkers for predicting the prognosis of many cancers. However, a ferroptosis-related signature to predict the prognosis of cutaneous melanoma (CM) has not been identified. The purpose of this study was to construct a ferroptosis-related lncRNA signature to predict prognosis and immunotherapy efficacy in CM.
Methods: Ferroptosis-related differentially expressed genes (FDEGs) and lncRNAs (FDELs) were identified using TCGA, GTEx, and FerrDb datasets. We performed Cox and LASSO regressions to identify key FDELs, and constructed a risk score to stratify patients into high- and low-risk groups. The lncRNA signature was evaluated using the areas under the receiver operating characteristic curves (AUCs) and Kaplan-Meier analyses in the training, testing, and entire cohorts. Multivariate Cox regression analyses including the lncRNA signature and common clinicopathological characteristics were performed to identify independent predictors of overall survival (OS). A nomogram was developed for clinical use. We performed gene set enrichment analyses (GSEA) to identify significantly enriched pathways. Differences in the tumor microenvironment (TME) between the 2 groups were assessed using 7 algorithms. To predict the efficacy of immune checkpoint inhibitors (ICI), we analyzed the association between PD1 and CTLA4 expression and the risk score. Finally, differences in Tumor Mutational Burden (TMB) and molecular drugs Sensitivity between the 2 groups were performed.
Results: We identified 5 lncRNAs (AATBC, AC145423.2, LINC01871, AC125807.2, and AC245041.1) to construct the risk score. The AUC of the lncRNA signature was 0.743 in the training cohort and was validated in the testing and entire cohorts. Kaplan-Meier analyses revealed that the high-risk group had poorer prognosis. Multivariate Cox regression showed that the lncRNA signature was an independent predictor of OS with higher accuracy than traditional clinicopathological features. The 1-, 3-, and 5-year survival probabilities for CM patients were 92.7%, 57.2%, and 40.2% with an AUC of 0.804, indicating a good accuracy and reliability of the nomogram. GSEA showed that the high-risk group had lower ferroptosis and immune response. TME analyses confirmed that the high-risk group had lower immune cell infiltration (e.g., CD8+ T cells, CD4+ memory-activated T cells, and M1 macrophages) and lower immune functions (e.g., immune checkpoint activation). Low-risk patients whose disease expressed PD1 or CTLA4 were likely to respond better to ICIs. The analysis demonstrated that the TMB had significantly difference between low- and high- risk groups. Chemotherapy drugs, such as sorafenib, Imatinib, ABT.888 (Veliparib), Docetaxel, and Paclitaxel showed Significant differences in the estimated IC50 between the two risk groups.
Conclusion: Our novel ferroptosis-related lncRNA signature was able to accurately predict the prognosis and ICI outcomes of CM patients. These ferroptosis-related lncRNAs might be potential biomarkers and therapeutic targets for CM.
Cutaneous melanoma (CM), which is characterized by the malignant transformation and over-proliferation of melanocytes, has an increasing incidence and accounts for more than 75% of skin cancer-related deaths (1, 2). Although most cases of primary localized CM can be cured with surgical resection, advanced metastatic CM has a poor prognosis. The 5-year survival rates of patients with localized, regionally metastatic, and distantly metastatic CM are 98%, 63%, and 16%, respectively (3). Current prognosis prediction in CM patients depends primarily on clinicopathological factors (e.g., patient demographics, Breslow thickness, ulceration, TNM stage). Although these factors are useful for treatment decisions, they are not appropriate for the early identification of high-risk patients owing to molecular and tumor microenvironment (TME) heterogeneity (4, 5). Recent studies have shown that targeted therapy (e.g., BRAF inhibitors, MEK inhibitors) and immunotherapy with immune checkpoint inhibitors (ICIs) targeting cytotoxic T-lymphocyte antigen-4 (CTLA4) and programmed cell death protein 1 (PD1) can significantly improve the survival of CM patients (6). However, many CM patients have primary or acquired resistance to ICIs. Therefore, it is critical to identify novel molecular biomarkers to better predict the prognosis of CM patients and improve the efficacy of immunotherapy in this population.
Ferroptosis, a type of programmed cell death characterized by the accumulation of reactive oxygen species caused by iron accumulation and lipid peroxidation (7), have been proved to be different from apoptosis, necroptosis and pyroptosis (8). Ferroptosis affects cell proliferation, metastasis, and immune response in cancers. Because ferroptosis-related genes have important regulatory roles in cancer progression, they have been used to construct risk scores to predict the prognosis of many cancers, including melanoma based on mRNA expressions (9, 10). However, existing ferroptosis-related gene signatures have a poor predictive ability for the prognosis of CM patients in the most recent studies. Therefore, signatures based on ferroptosis-related non-coding RNAs may be better prognostic biomarkers owing to their higher cell/tissue specificity than protein-coding genes.
Long non-coding RNAs (lncRNAs) are a group of endogenous non-protein-coding RNAs that regulate many cellular processes, including proliferation, differentiation, migration, and invasion. They are also involved in innate and adaptive immunity by mediating the TME, and regulate ferroptosis in cancers. In addition, ferroptosis-related lncRNA signatures are useful predictors of the prognosis of many cancers, including lung adenocarcinoma (11–13), breast cancer (14, 15), gastric cancer (16, 17), bladder cancer (18), colon cancer (19), hepatocellular carcinoma (19), head and neck squamous cell carcinoma (20), and glioma (21). Ferroptosis-related lncRNAs may also have value in predicting CM prognosis. However, a ferroptosis-related lncRNA signature to predict the prognosis of CM has not yet been identified.
In the present study, we aimed to (1) identify a ferroptosis-related lncRNA signature to differentiate high- and low-risk CM patients; (2) construct a nomogram including the lncRNA signature to predict the survival of CM patients; and (3) identify differences in the TME between high- and low-risk patients and predict their responses to ICIs.
The flow chart of the present study is shown in Scheme 1. The fragments per kilobase of per million (FPKM) of CM transcriptome, lncRNA counts data and corresponding clinical data of CM were downloaded from TCGA database (https://tcga-data.ncinih.gov/tcga/). The transcriptome samples included 471 tumor samples and 1 normal sample. Among them, 461 clinical samples were included for prognosis analysis because 10 patients had missing survival time. The clinical characteristics of the 461 patients are displayed in Supplementary Table S1. In addition, 233 normal skin samples with transcriptome data were downloaded from GTEx database (https://gtexportal.org/home/), then normalized and processed with TCGA biolinks package (22). The batch effects between TCGA and GTEx data were eliminated by R software package “limma”. The final datasets contained RNA expression profile of 471 CM samples and 234 normal samples. Sixty ferroptosis-related genes (Supplementary Table S2) that have been validated in previous studies (23–25) were obtained from the FerrDb database (26).
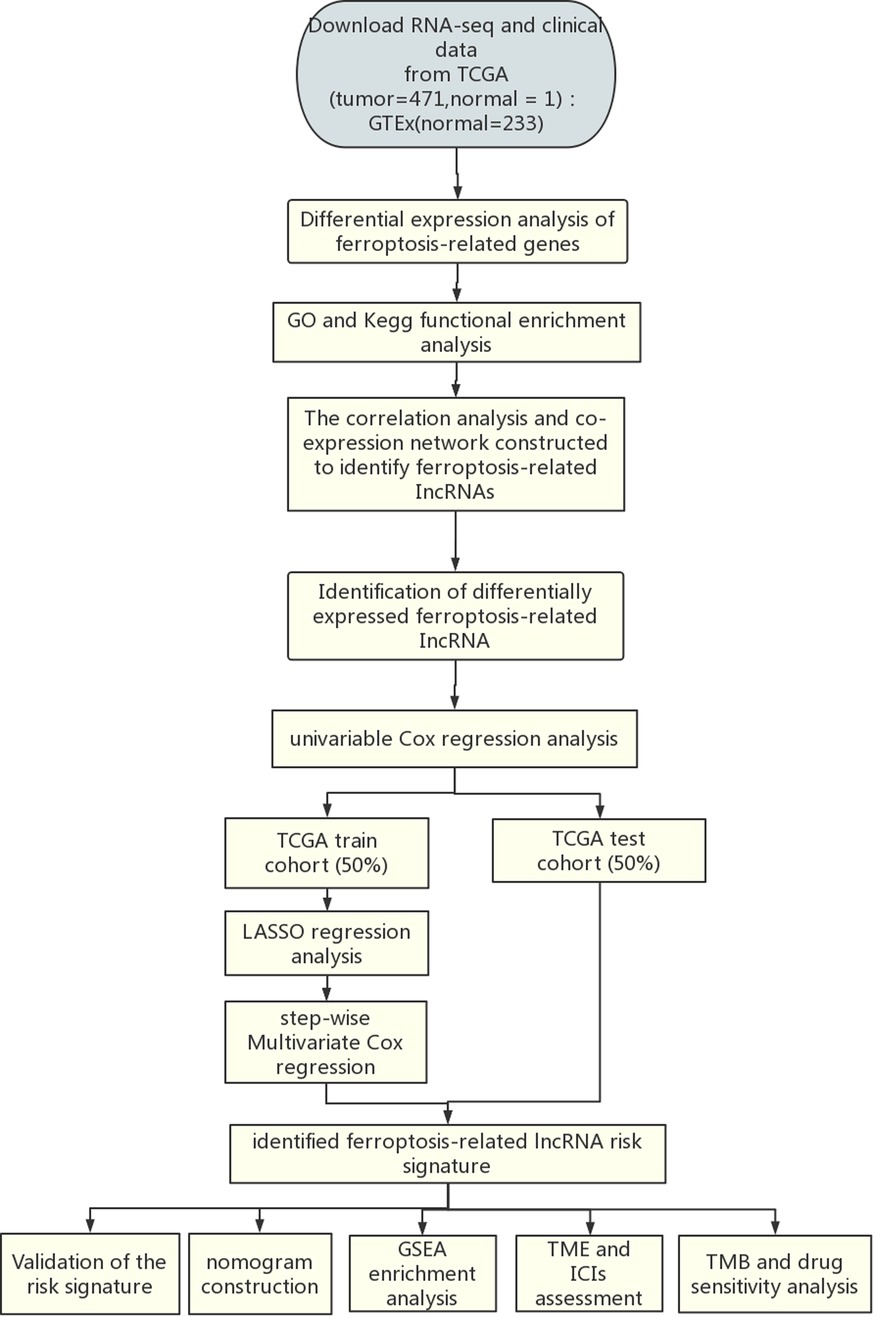
Scheme 1. Flowchart of the analysis process.
To identify the ferroptosis-related differentially expressed genes (FDEGs) between tumor and normal samples, we analyzed the datasets using the classical Bayesian algorithm in the “limma” package in R (27). The ggplot2 package was used to create heatmap plots (28). We performed Gene Ontology (GO) and Kyoto Encyclopedia of Genes and Genomes (KEGG) enrichment analyses to evaluate the biological processes and pathways associated with these FDEGs. Analyses of Pearson correlation between lncRNAs and FDEGs were performed to identify ferroptosis-related lncRNAs. The association was considered significant if the square of the correlation coefficient |R2| > 0.4 and P < 0.001. Cytoscape software 3.8.0 was used to visualize the network of gene-lncRNA co-expression (29). All ferroptosis-related lncRNAs in the co-expression network were included in the differential expression analysis. Ferroptosis-related differentially expressed lncRNAs (FDELs) (false discovery rate [FDR] < 0.05 and log2FC ≥ 1) were identified using the “limma” package and illustrated in heatmap and volcano plots
We first performed univariate Cox regression to identify candidate FDELs that were significantly associated with overall survival (OS). We then performed least absolute shrinkage and selection operator (LASSO) regression to identify the key FDELs based on the optimal lambda value. We performed stepwise multivariate Cox regression including these key FDELs to construct a risk score. The risk score was calculated as follows: risk score (expression of lncRNAi), where n is the number of key lncRNAs and β is the regression coefficient. Using the median risk score as a cutoff value, we classified all patients as high-risk (≥median risk score) or low-risk (<median risk score).
All 461 CM samples were randomly divided into a training cohort (n = 231) and a test cohort (n = 230) using the caret package in R. The detailed baseline characteristics of the training and testing cohort showed no statistical significance (Supplementary Table S3). The receiver operating characteristic (ROC) curves were applied and area under the curves (AUCs) were calculated to evaluate the accuracy of the prognostic lncRNA signature in the training, test, and entire cohorts. The risk level distribution and survival status distribution were illustrated. Kaplan-Meier analyses and log-rank tests were performed to compare survival differences between the high- and low-risk groups. In addition, principal component analysis (PCA) (30) and t-distributed stochastic neighbor embedding (t-SNE) (31) were used for dimensionality reduction and clustering visualization based on the risk score.
To determine whether the risk score was an independent predictor of survival, we performed univariate and multivariate Cox regression analyses, which included the risk score, patient age, patient sex, melanoma stage, and TNM stage (T: tumor size; N: lymph node involvement; M: metastasis), in the entire cohort. Hazard ratios (HRs) and 95% confidence intervals (CIs) for each predictor were calculated. AUCs for 3-year OS predicted with the independent risk factors as shown by multivariate Cox regression were calculated to evaluate the predictive value of the lncRNA signature. We also developed a nomogram that included the abovementioned risk factors for the practical prediction of 1-, 3-, and 5-year OS. The performance of the nomogram was evaluated using a calibration curve analysis and C-index.
We performed gene set enrichment analysis (GSEA) (32) to identify significantly differentially enriched pathways between the high- and low-risk groups. Gene expression was used as a phenotype label (33). The number of random sample permutations was set at 1,000. Statistical significance was set at a |normalized enrichment score| >1, nominal P-value <0.05, and FDR q-value <0.25 (34).
The tumor purity, ESTIMATE score, immune score, and stromal score for each melanoma sample were calculated using the ESTIMATE algorithm (17). In addition, the single-sample GSEA (ssGSEA) (35), TIMER, CIBERSORT (36), MCPcounter, QUANTISEQ, XCELL, and EPIC algorithms were used to compare cellular components and immune responses between high- and low-risk groups. The differences in immune cell infiltration were shown in heatmap, violin, and radar plots. Furthermore, the ssGSEA scores of the 16 most commonly involved immune cells and 13 most commonly involved immune functions in TME were compared between the 2 groups.
To predict the efficacy of ICIs, we systematically searched the ICI-related gene expression profiles and identified 44 ICI-related genes that might be correlated with ICI response. Among these genes, PD1 and CTLA4 were previously reported to be crucial targets of ICIs in CM (6, 37). The association between the expression of the PD1 and CTLA4 genes and the risk score was analyzed using data from The Cancer Immunome Atlas data (https://tcia.at/) to investigate the role of ferroptosis in the efficacy of ICIs.
The somatic mutational profile of CM was downloaded from the TCGA. The quantity and quality of the gene mutations were analyzed in the 2 groups with the “Maftools” package in R (38). In addition, we used the “pRRophetic” package in R to evaluate the half maximal inhibitory concentration (IC50) of common chemotherapy and molecular drugs.
All statistical analyses were performed using R version 3.6.1 (Institute for Statistics and Mathematics, Vienna, Austria; https://www.r-project.org) and its (packages: limma, impute, bioconductor, ggplot2, rms, glmnet, preprocess Core, forest plot, survminer, survival ROC, beeswarm, etc.) as described previously (39). Normally and non-normally distributed variables were analyzed using the unpaired Student' t-test and the Wilcoxon test, respectively. The Benjamin-i-Hochberg method was used to identify FDELs based on FDR. All statistical tests were 2-sided with P ≤ 0.05 being statistically significant.
We identified 53 FDEGs (25 upregulated and 28 downregulated) between the normal and tumor samples (Figure 1A). The results of GO (Figure 1B) and KEGG (Figure 1C) analyses indicated that FDEGs were mainly enriched in ferroptosis-related biological processes (e.g., response to oxidative stress) and signaling pathways (e.g., ferroptosis). Pearson correlation analysis identified 387 ferroptosis-related lncRNAs (326 upregulated and 61 downregulated) (Supplementary Table S4). The ferroptosis-related lncRNAs were visualized in a gene-lncRNA co-expression network (Figure 1D). As shown in the heatmap (Figure 1E) and volcano plot (Figure 1F), there were 161 FDELs (130 upregulated and 31 downregulated).
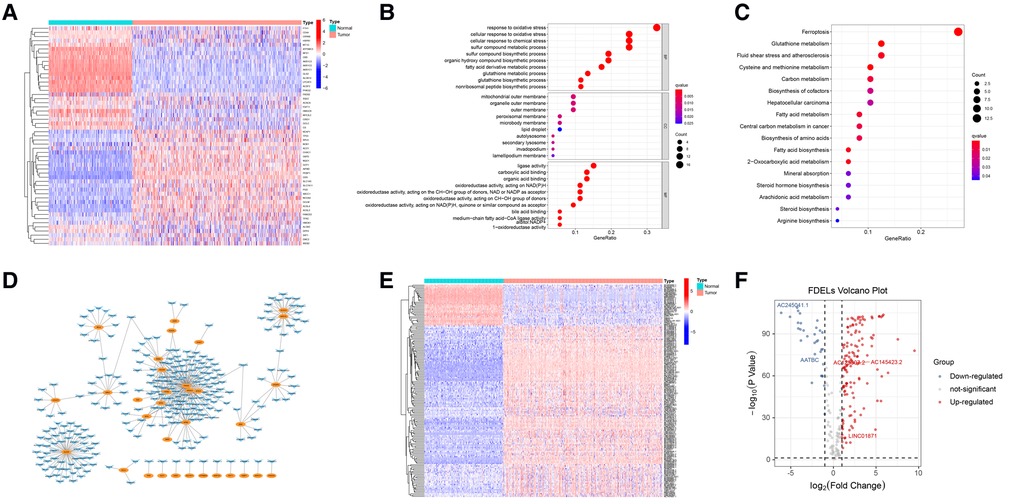
Figure 1. FDEG and FDEL identification and functional enrichment analyses. (A) The heatmap illustrates 53 FDEGs. (B) GO analysis of the FDEGs. (C) KEGG analysis of the FDEGs. (D) Co-expression network of FDEGs and FDELs. Yellow nodes indicate FDEGs; blue arrows FDELs. (E,F) A heatmap and volcano plot show 161 FDELs and 5 studied LncRNAs.
The univariate Cox regression analysis revealed that 50 of the 161 FDELs were significantly associated with OS (Figure 2A). LASSO regression revealed 8 of these 50 lncRNAs to be key to prognosis (Figures 2B,C). Stepwise multivariate Cox regression finally identified 5 lncRNAs (AATBC, AC145423.2, LINC01871, AC125807.2, and AC245041.1) for construction of the prognostic lncRNA signature (Figure 2D). Among these 5 lncRNAs, only LINC01871 was a protective factor, whereas the other 4 were risk factors (Figure 2E). The results of the univariate and multivariate Cox regression analyses of the 5 lncRNAs in the training cohort are shown in Supplementary Table S3. The risk score was calculated as follows: Risk score = 0.147 × expression of AATBC + 0.175 × expression of AC145423.2 - 0.091 × expression of LINC01871 + 0.165 × expression of AC125807.2 + 0.376 × expression of AC245041.1. All patients were divided into high- or low-risk group based on the median risk score of 0.995.
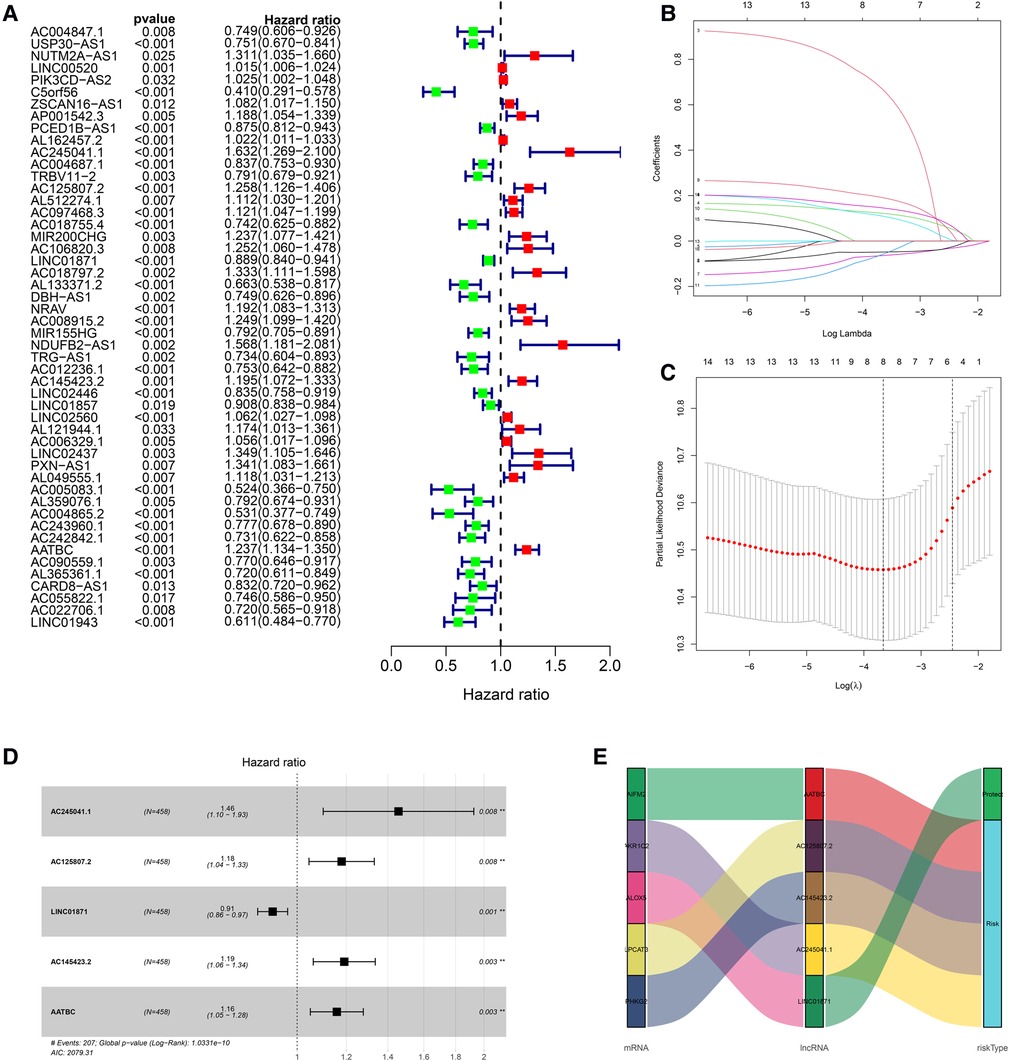
Figure 2. Construction of the prognostic ferroptosis-related lncRNA signature. (A) Univariate Cox regression revealed that 50 of the 161 FDELs were associated with OS. (B) LASSO regression identified 8 FDELs from the 50 lncRNAs, Dynamic LASSO coefficient profiling. (C) Selection of the tuning parameter (lambda); and the dashed lines on the left and right indicate the “lambda. min” and “lambda.1se” criteria, respectively. (D) Stepwise Cox regression finally identified 5 FDELs (AATBC, AC145423.2, LINC01871, AC125807.2, and AC245041.1) to construct the risk score (P < 0.001). (E) Sankey diagram shows the associations among FDELs, FDEGs, and risk types.
The AUC of the lncRNA signature for predicting 5-year OS in the TCGA training cohort was 0.743 (Figure 3A), indicating that the lncRNA signature offered accurate prediction. The mortality rate increased and survival time decreased as the risk score increased (Figures 3B,C). The OS rate of the high-risk group was significantly poorer than that of the low-risk group (Figure 3D). The ability of the 5-lncRNA signature to discriminate between high- and low-risk patients was validated in the testing cohort (Figures 3E–H) and entire TCGA cohort (Figures 3I–L). PCA and t-SNE analyses confirmed that the risk score had reliable clustering ability in the training cohort (Figures 3M,N), testing cohort (Figures 3O,P), and entire cohort (Figures 3Q,R).
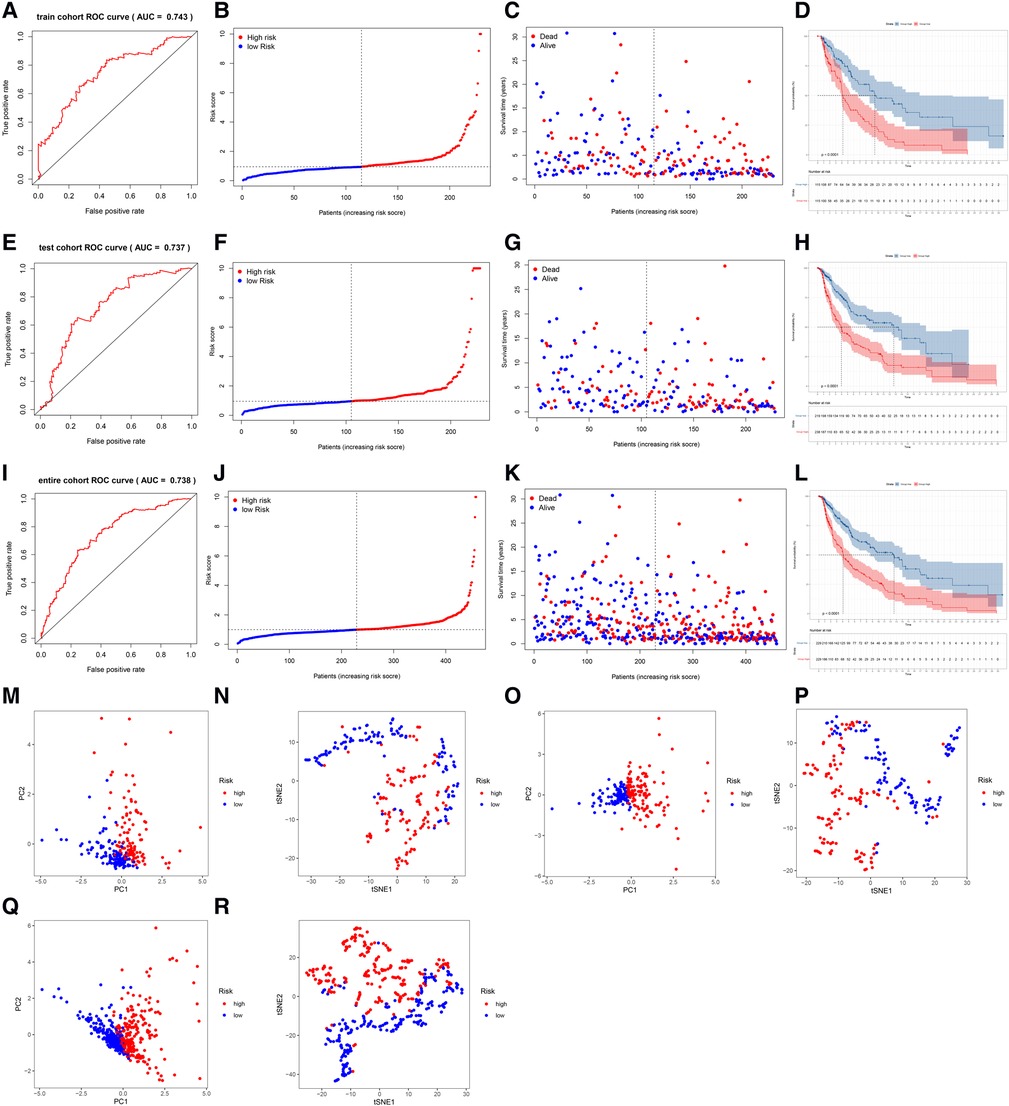
Figure 3. Evaluation and validation of the lncRNA signature in the training, testing, and entire cohorts. (A) AUC of the lncRNA signature for predicting 5-year survival in the training cohort. (B) The rank of the calculated risk score in the training cohort. (C) The survival status and survival time in the training cohort. (D) Kaplan-Meier survival curves of the high-risk patients and low-risk patients in the training cohort. (E–H) The lncRNA signature was validated in the testing cohort. (I–L) The lncRNA signature was validated in the entire cohort. (M,N) PCA and t-SNE analysis of the training cohort. (O,P) PCA and t-SNE analysis of the test cohort. (Q,R) PCA and t-SNE analysis of the entire cohort.
The clinicopathological features of all 471 CM patients are shown in Supplementary Table S5. The HRs of the risk score in the univariate and multivariate Cox regression analyses were 1.499 (95% CI: 1.302–1.725, P < .001) and 1.338 (95% CI:1.154–1.552, P < .001), respectively (Figures 4A,B), indicating that the lncRNA signature was an independent predictor of OS.
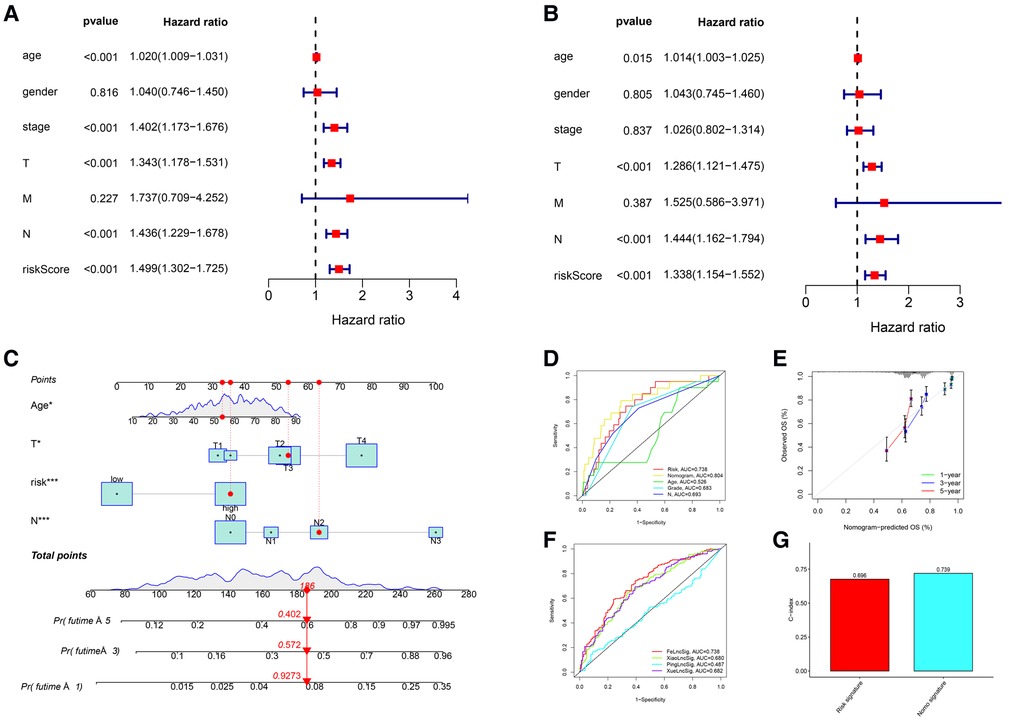
Figure 4. Independent prognostic value of the lncRNA signature and the comprehensive nomogram. (A) Univariate Cox regression identified individual factors related to OS. (B) Multivariate Cox regression identified independent predictors of OS. Our lncRNA signature was an independent predictor of OS with a hazard ratio of 1.338 (95% CI, 1.154-1.552, P < .001). (C) The nomogram including the lncRNA signature, age, T stage, and N stage for the practical prediction of the prognosis of CM patients. (D) AUCs of nomogram, signature and other clinicopathological characteristics for predicting 3-year OS. (E) A calibration curve analysis showed that the nomogram predictions were consistent with actual observations. (F) The ROC comparison of the studied signature with existing signatures. (G) The C-index of Nomogram.
We developed a nomogram that included the risk score and traditional clinicopathological factors for clinical use. The 1-, 3-, and 5-year survival probabilities for CM patients predicted with the nomogram were 92.7%, 57.2%, and 40.2%, respectively (Figure 4C). The AUC of the risk score for predicting 3-year OS (0.713) was greater than the AUCs of other clinicopathological features for predicting 3-year OS (684–0.693), indicating that the risk score had a better predictive ability (Figure 4D). In addition, the AUC of a prediction model that included the statistically significant variables in the multivariate analysis (i.e., risk score, age, T stage, and N stage) was 0.804, indicating that the novel risk score significantly increased the predictive accuracy of nomogram construction. The calibration curve analysis demonstrated excellent agreement between nomogram predictions and actual observations, indicating that the nomogram was stable and accurate in predicting the prognosis of CM (Figure 4E). Finally, the comparison of signature with other models showed that our AUC was superior to the existing signatures (Figure 4F). The calculation of C-index of Nomogram and signature were performed to reflect the validity of the nomogram and model, and two results are respectively 0.696 and 0.739 (Figure 4G).
The results of GSEA showed that ferroptosis, apoptosis, immune system process, immune response, antigen processing and presentation, T-cell receptor, B-cell receptor, and natural killer cell-mediated cytotoxicity pathways were inhibited in the high-risk group (Figures 5A–H). The lower level of ferroptosis and immune response in the high-risk group suggested that the association between ferroptosis and the immune TME play an important role in CM prognosis; therefore, we further compared immune cell infiltration and functions between the high- and low-risk groups.
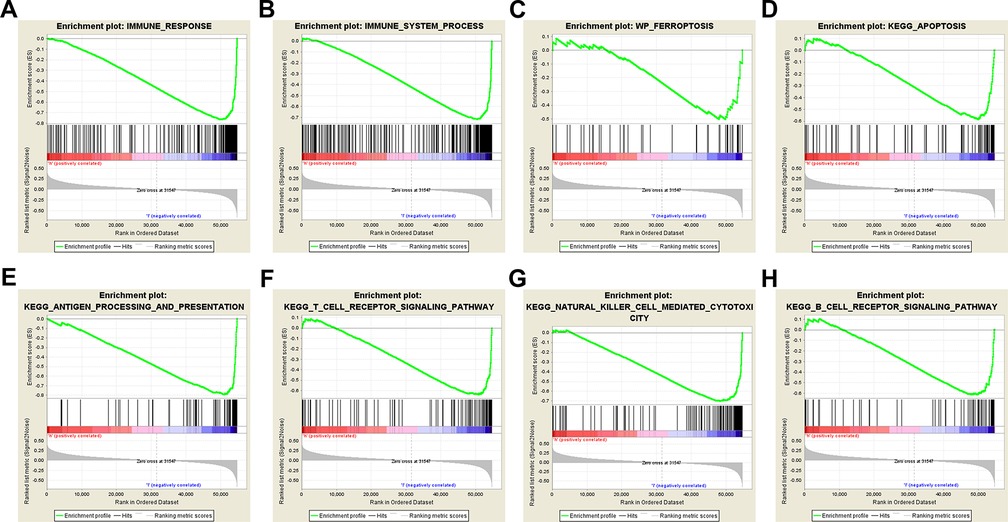
Figure 5. Gene set enrichment analysis. Immune-related and ferroptosis-related pathways were significantly enriched in the low-risk group. (A) Immune system process. (B) Immune response. (C) Ferroptosis. (D) Apoptosis. (E) Antigen processing and presentation. (F) T-cell receptor signaling pathway. (G) Natural killer cell-mediated cytotoxicity. (H) B-cell receptor signaling pathway.
Significant differences in immune cell infiltration between the high- and low-risk groups are illustrated in Figure 6A. Compared with the low-risk group, the high-risk group had significantly higher tumor purity (Figure 6B), but lower ESTIMATE scores (Figure 6C), stromal scores (Figure 6D), and immune score (Figure 6E), indicating that the high-risk group had a lower immune response. The high-risk group also had significantly fewer CD8+ T cells, CD4+ memory-activated T cells and M1 macrophages, but more M0 and M2 macrophages (Figure 6F). In addition, a comparison of ssGSEA scores for immune cells confirmed that the high-risk group had significantly fewer B cells, T cells, dendritic cells, macrophages, and nature killer cells than the low-risk group did (Figure 7A). ssGSEA score for immune functions demonstrated that pathways related to immune checkpoints, antigen-presenting cell, cell chemokine receptors, inflammation regulation, human leukocyte antigen, major histocompatibility complex, T cell functions, and type I/II interferon response were significantly downregulated in the high-risk group (Figure 7B).

Figure 6. Tumor microenvironment analyses. (A) Immunity heatmap including the Tumor purity score, ESTIMATE score, immune score, stromal score and 7 other algorithms (ssGSEA, TIMER, CIBERSORT, MCPcounter, QUANTISEQ, XCELL, and EPIC). (B) The high-risk group had significantly higher tumor purity. (C–E) The high-risk group had significantly lower ESTIMATE, stromal, and immune scores. (F) A radar plot shows that the high-risk group had significantly fewer CD8+ T cells, CD4+ memory activated T cells and M1 macrophages, but more M0 and M2 macrophages. *P < 0.05; **P < 0.01; ***P < 0.001.
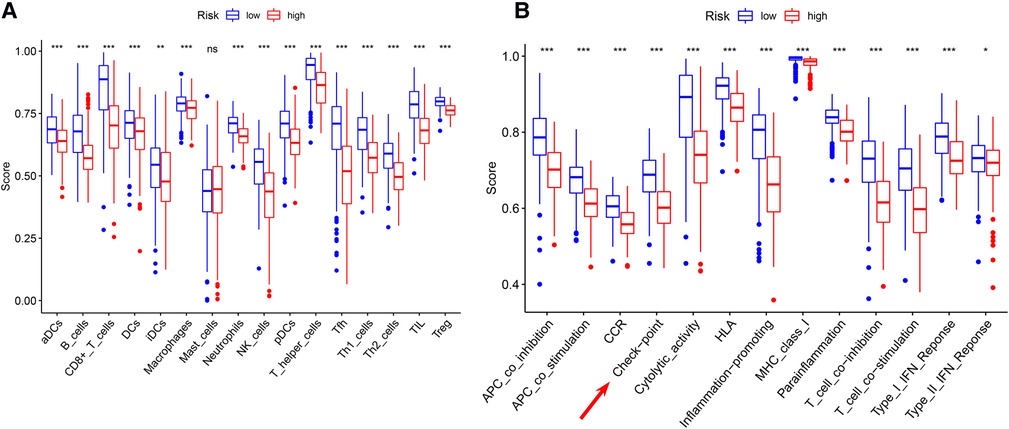
Figure 7. ssGSEA analyses (A) comparison of ssGSEA scores for 16 immune cells between the high- and low-risk groups. (B) A comparison of the 2 groups’ ssGSEA scores for 13 immune functions indicates that the high-risk group had a significantly lower the checkpoint score. *P < 0.05; **P < 0.01; ***P < 0.001.
The differences in the expression of 44 ICI-related genes between the high- and low-risk groups are shown in Figure 8A. The high-risk group had significantly lower expression levels of PD-1 and CTLA-4. Among patients whose disease expressed either of these ICI-related genes, low-risk patients were likely to have a better response to ICIs than high-risk patients were, through the Cancer Immune Atlas (TCIA) database (Figures 8B–E). These results suggest that a higher level of ferroptosis facilitated a higher immune response in the TME, leading to increase the efficacy of ICIs in CM patients. Then, we also used TIDE (Tumor Immune Dysfunction and Exclusion) score to evaluate the response to immunotherapy, and the results showed TIDE and Dysfunction scores were higher in low-risk group than high-risk group (Figures 8F,G). The prognostic performance in immunotherapy cohorts were displayed through survival cures, indicating that cohorts with low risk combined with high ICI score have the better prognosis than other cohorts, especially with PD-1 expression positive (Figure 8H).
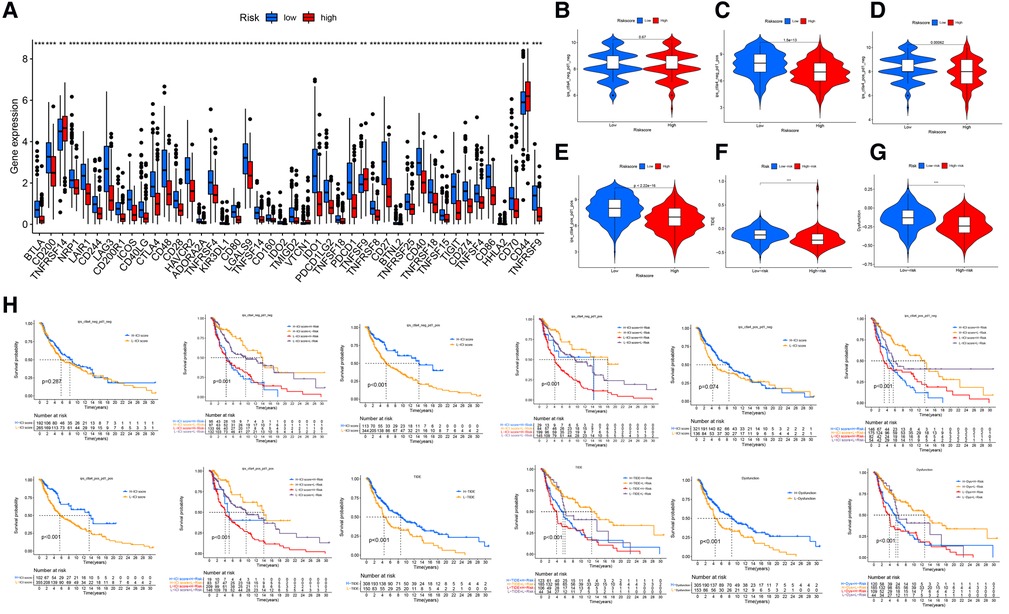
Figure 8. Immune checkpoint differences. (A) The expression of 44 immune checkpoint genes differed significantly between the high- and low-risk groups. The low-risk group had significantly higher expression of CD274 (PDL-1) and CLAT-4 (P < .001). (B) The difference in ICI efficacy was not significant between the 2 groups if PD-1 and CLAT4 were both negatively expressed. (C–E) Low-risk patients with PD-1 or CTLA4 expression were likely to respond better to ICIs than high-risk patients were. (F,G) The TIDE and Dysfunction scores were higher in low-risk group than high-risk group. (H) The prognostic performance in immunotherapy cohorts.
The analysis demonstrated that the TMB had significantly difference between low- and high- risk groups (Figure 9A), and TMB has a significant impact on patient prognosis between low- and high- risk groups (Figures 9B,C). Then, we then identified the top 20 genes with the highest mutation rates in the two risk subgroups. The mutation rates of TTN, MUC16, BRAF, and DNAH5 were higher than 30% in both groups (Figures 9D,E). Mutation of the TTN gene was more common in the high-risk subgroup. Genetic mutations can affect the tumor response to chemotherapy and targeted therapy (Figure 9F); therefore, we investigated the association between the risk model and the efficacy of chemotherapy and targeted therapy drugs in patients with CM. We listed 10 common target drugs (Figure 9G) and 10 Chemotherapy drugs (Figure 9H) used for CM, such as sorafenib, Imatinib, ABT.888 (Veliparib), Docetaxel, and Paclitaxel (Figure 9H). Significant differences in the estimated IC50 between the two risk groups were observed, which suggest that the risk model might be used to identify potential biomarkers for chemotherapy and targeted therapy sensitivity.
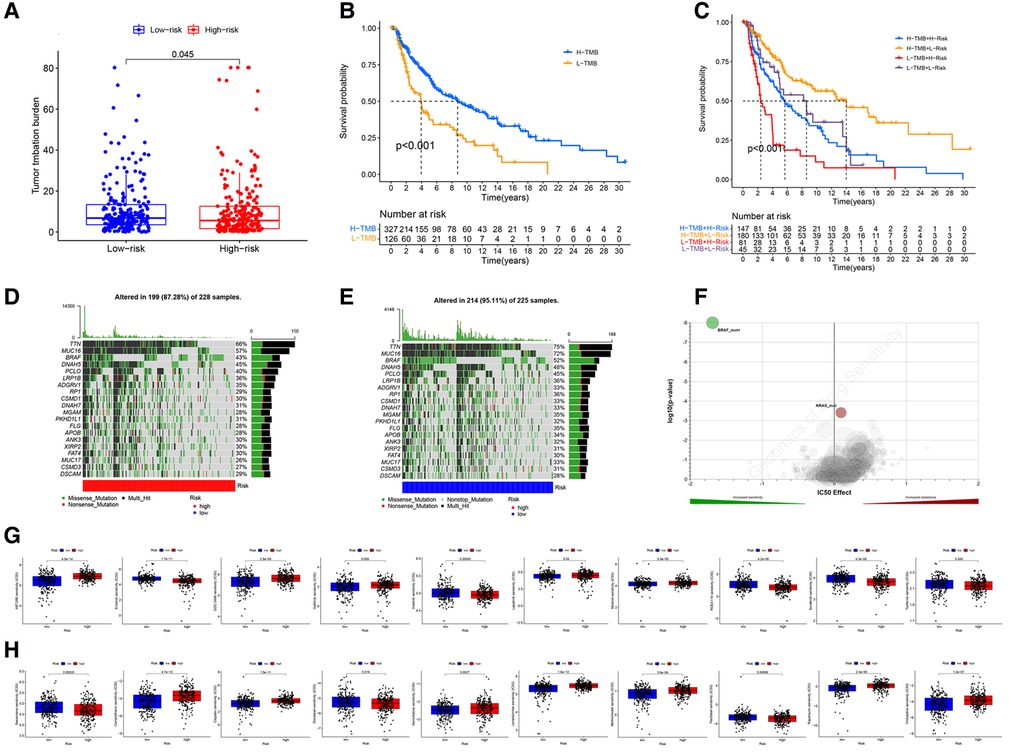
Figure 9. TMB and drugs sensitivity analysis. (A) The TMB in different risk groups. (P < .001). (B,C) The prognostic performance of TMB scores in survival cures. (D–E) The mutation rates of the top 20 genes in different risk groups. (F) The IC50 score with mutation. (G) The target drugs sensitivity in different risk groups. (H) The Chemotherapy drugs sensitivity in different risk groups.
We performed comprehensive analyses utilizing the TCGA, GTEx, and FerrDb databases and identified 5 key lncRNAs to construct a risk score that stratified CM patients into high- and low-risk groups. The lncRNA signature was an independent prognostic predictor of OS with fair accuracy. The nomogram that included the lncRNA signature and other clinicopathological factors had good accuracy and reliability in predicting the OS of CM patients. The high-risk group was associated with lower ferroptosis, immune response, immune cell infiltration and immune function. High-risk patients had also lower expression of ICI-related genes such as PD-1 and CTLA-4, and thus had poorer responses to ICIs. These results collectively demonstrate that this novel ferroptosis-related lncRNA signature can predict the prognosis of CM and the efficacy of ICIs in CM patients.
Ferroptosis-related lncRNA signatures have considerable predictive value for the prognosis of CM. Recent studies have developed several lncRNA signatures related to autophagy (40) and immunity (41–44) to predict the prognosis of CM. In these studies, the numbers of lncRNAs used for signature construction ranged from 3 to 24 (Supplementary Table S6). Similarly, we constructed a risk score based on 5 lncRNAs we identified (AATBC, AC145423.2, AC125807.2, AC245041.1, and LINC01871). The regulatory roles and molecular mechanisms of these 5 lncRNAs have been shown in previous studies.
AATBC (apoptosis-associated transcript in bladder cancer) was originally discovered in bladder cancer by Zhao et al. (45), who found that AATBC overexpression of AATBC is positively correlated with tumor grade and stage. A transcriptomic analysis of high-throughput sequencing data (46) confirmed that AATBC can harbor bladder cancer-related miRNA recognition elements. Wang et al. (47) identified a multi-RNA-type-based signature that included AATBC for predicting recurrence-free survival in patients with uterine corpus endometrial carcinoma. Tang et al. (48) found that AATBC overexpression promotes the migration and invasion of nasopharyngeal carcinoma cells in vitro, as well as their metastasis in vivo, through the miR-1237-3p-PNN-ZEB1 axis, leading to poor survival. Tang et al. (48) showed that AATBC is highly expressed in breast cancer and promotes cancer migration and invasion by activating the YAP1/Hippo signaling pathway through the AATBC-YBX1-MST1 axis. Zhang et al. (49) demonstrated that AATBC overexpression promotes the proliferation and migration of prostate cancer cells via the miR-1245b-5p-CASK axis. The role of AATBC in CM was reported by Yan et al. (50), who constructed a prognostic model with 7 gene instability–related lncRNAs, including AATBC. Their cell experiments verified that AATBC knockdown can inhibit the proliferation and invasion of CM. In accordance with these studies, we found that AATBC is a risk factor for poor prognosis in CM patients.
Unlike that of AATBC, the regulatory roles of the other 3 risk factors (AC145423.2, AC125807.2 and AC245041.1), have been rarely reported. Xuan et al. (51) identified 7 autophagy-related lncRNAs including AC145423.2 to build a risk score, for dividing clear cell renal cell carcinoma patients into low- and high-risk groups. Hou et al. (52) constructed a competing endogenous RNA network that included AC125807.2 and 11 other lncRNAs, and found AC125807.2 to be an independent prognostic predictor of OS in patients with lung adenocarcinoma. Huang et al. (53), who established a ferroptosis-related lncRNA signature, which included AC245041.1, for gastric cancer, found that higher AC245041.1 expression is correlated with poorer OS. In agreement with these studies, our results showed that AC145423.2, AC125807.2 and AC245041.1 are associated with poor prognosis in CM patients. However, the mechanism underlying how lncRNA regulates ferroptosis remains elusive and requires further investigation.
Previous studies have shown that LINC01871 is related to stemness, autophagy, and immunity in breast, gastric, cervical, and endometrial cancers. For example, Li et al. (54) identified 12 stemness-related lncRNA including LINC01871, to predict the prognosis of breast cancer. In a second, they identified 11 autophagy-related lncRNAs including LINC01871, in breast cancer (55). Ma et al. (56) established a signature comprising 8 immune-related lncRNA including LINC01871, to predict the survival of breast cancer patients. Moreover, LINC01871 has a strong positive correlation with ICI-related genes such as CTLA4 and PD1, which suggested that the lncRNAs has critical roles in the immune response and immunotherapy outcomes. Wu et al. (57) identified 5 autophagy-related lncRNAs including LINC01871, to construct a risk score and a nomogram to predict the prognosis of breast cancer patients. Mathias et al. (58) investigated the role of LINC01871 in 5 molecular subtypes of breast cancer and found that LINC01871 is associated with immune response activation and favorable OS in patients with basal-like breast cancers. He et al. (59), in a multi-omics data analysis, identified molecular features (e.g., genes, miRNAs, lncRNAs, proteins, pathways) that correlated with tumor immunity in gastric cancer. They found that LINC01871 was positively associated with cancer immunity (expression levels of CD8+ T cell, cytolytic immune activity, and PD-L1), which suggests that LINC01871 is a useful biomarker for assessing immunotherapy response. In addition, Chen et al. (60) constructed a signature of 6 immune-related lncRNAs, including LINC01871, to predict the prognosis of cervical cancer. Similarly, Wang et al. (61) identified a signature of 5 autophagy-related lncRNAs, including LINC01871, to predict the prognosis of endometrial cancer patients. Together, these studies demonstrate that LINC01871 is positively associated with the immune response, and thus a protective factor for cancer prognosis. This is consistent with our finding that LINC01871 is the only ferraptosis-related protective factor for OS in CM.
The AUCs of lncRNA signature for OS prediction significantly varied in previous studies, and (Supplementary Table S5). Our ferroptosis-related lncRNA signature had AUCs for predicting 5-year OS of 0.743, 0.737, and 0.738 in the training, testing, and entire cohorts, respectively. These results are in line with those of the studies by Yoshihara et al. (17), Xiao et al. (62), and Wang et al. (42), whose signatures for predicting survival also had an AUCs of 0.7–0.8. And the HRs of lncRNA signatures ranged from 1.024 to 2.043 (P < 0.05 for all), also listing in Supplementary Table S5. In accordance with these studies' findings, our multivariate Cox regression analysis showed that our lncRNA signature had an HR of 1.338, indicating that the mortality risk of a CM patient would increase by 33.8% as the risk score increased by 1 point.
Our nomogram integrated the independent risk factors identified in the multivariate Cox regression analysis. This combination significantly increased the predictive accuracy of Ferroptosis-related signature in clinical application, as it had an AUC of 0.804 for predicting 3-year OS in the entire cohort. The calibration curve analysis demonstrated excellent agreement between nomogram predictions and actual observations, indicating that our nomogram was stable and accurate in predicting the prognosis of CM. Few others have developed nomograms for the prediction of CM prognosis. Although Xiao et al. (62) constructed a nomogram that included the same predictors as ours, they did not report the AUC of the nomogram or evaluate its performance. Tian et al. (63) noted that the AUCs of their nomogram for predicting 3-year OS were 0.816 and 0.740 in the training and testing cohorts, respectively, but their nomogram had more variables than ours and was not verified by calibration curve analysis.
The imbalance of immunity in the TME plays an important role in the development and progression of CM. Ferroptosis is associated with the immune TME and the response of CM to immunotherapies (64). Specific ferroptosis-related lncRNAs can regulate the TME by affecting antigen release/presentation, immune activation, immune cells migration/infiltration, and even enhancing the efficacy of ICIs (65–68). Previous studies showed that patients with lower immune cell (e.g., CD8 + T cells, M1 macrophages) infiltration and function have poorer survival (69). For example, Wang et al. (42) found that high-risk CM patients have lower immune functions than low-risk patients do. Xiao et al. (62) showed that high-risk CM patients have lower levels of CD8+ T cells, CD4+ memory-activated T cells, and M1 macrophages, but higher levels of M0 macrophages. Their results were consistent with those of Ping et al. (41), who found that high-risk CM patients have lower levels of B cells, CD4+ T cells, monocytes, and CD8+ T cells, but higher levels of M0 macrophages. Thus, it may have lower responses to chemotherapeutics (i.e., cisplatin, vinblastine, paclitaxel) and ICIs. In accordance with those studies, the present study demonstrated that high-risk patients have significantly lower immune cell (e.g., CD8+ T cells) infiltration and immune function (e.g., immune checkpoint activation), possibly because immunotherapy-activated CD8+ T cells enhance lipid peroxidation and ferroptosis as a cytotoxic mechanism in CM cells and ultimately promote the efficacy of anti-CTLA-4 and anti-PD-1 therapies (70).
The present study had several limitations. First, the 5 lncRNAs were identified and validated using a single data source (TCGA). It would have been better if we tested the prognostic value of these lncRNAs in another independent patient cohort. its prognostic values were tested in another independent patient cohort. Second, the molecular mechanism of these lncRNAs remains unclear and requires further validation using cellular/ molecular biological experiments. Despite these limitations, this is the first study to identify a ferroptosis-related lncRNA signature for the prediction of prognosis and immunotherapy efficacy in CM patients. Owing to its relevance to the immune TME and ICI-related gene expression, these ferroptosis-related lncRNAs may be potential biomarkers and therapeutic targets for CM. The lncRNA signature may help improve the efficacy of personalized immunotherapy.
Our novel ferroptosis-related lncRNA signature was able to accurately predict the prognosis of CM patients and their outcomes. The novel ferroptosis-related lncRNA signature was able to accurately predict the prognosis and outcome of ICI therapies. These ferroptosis-related lncRNAs might be potential biomarkers and therapeutic targets for CM.
The original contributions presented in the study are included in the article/Suplementary Material, further inquiries can be directed to the corresponding author/s.
YX and YC are responsible for data processing and article writing. ZN is responsible for sorting out the results. LG and QZ are responsible for determining the research ideas. ZY, JX and XY reviewed the research and articles. General idea of YH and YY evaluation study. All authors contributed to the article and approved the submitted version.
We are grateful to those who provide and maintain the public databases, and datasets we used in this study.
The Supplementary Material for this article can be found online at: https://www.frontiersin.org/articles/10.3389/fsurg.2022.860806/full#supplementary-material.
The authors declare that the research was conducted in the absence of any commercial or financial relationships that could be construed as a potential conflict of interest.
All claims expressed in this article are solely those of the authors and do not necessarily represent those of their affiliated organizations, or those of the publisher, the editors and the reviewers. Any product that may be evaluated in this article, or claim that may be made by its manufacturer, is not guaranteed or endorsed by the publisher.
1. Siegel RL, Miller KD, Fuchs HE, Jemal A. Cancer statistics, 2021. CA Cancer J Clin. (2021) 71:7–33. doi: 10.3322/caac.21654
2. Trager MH, Queen D, Samie FH, Carvajal RD, Bickers DR, Geskin LJ. Advances in prevention and surveillance of cutaneous malignancies. Am J Med. (2020) 133:417–23. doi: 10.1016/j.amjmed.2019.10.008
3. Davis LE, Shalin SC, Tackett AJ. Current state of melanoma diagnosis and treatment. Cancer Biol Ther. (2019) 20:1366–79. doi: 10.1080/15384047.2019.1640032
4. Leonardi GC, Falzone L, Salemi R, Zanghì A, Spandidos DA, Mccubrey JA, et al. Cutaneous melanoma: from pathogenesis to therapy (Review). Int J Oncol. (2018) 52:1071–80. doi: 10.3892/ijo.2018.4287
5. Simiczyjew A, Dratkiewicz E, Mazurkiewicz J, Ziętek M, Matkowski R, Nowak D. The influence of tumor microenvironment on immune escape of melanoma. Int J Mol Sci. (2020) 21(21). doi: 10.3390/ijms21218359
6. Van Allen EM, Miao D, Schilling B, Shukla SA, Blank C, Zimmer L, et al. Genomic correlates of response to CTLA-4 blockade in metastatic melanoma. Science. (2015) 350:207–11. doi: 10.1126/science.aad0095
7. Wang Z, Jin D, Ma D, Ji C, Wu W, Xu L, et al. Ferroptosis suppressed the growth of melanoma that may be related to DNA damage. Dermatol Ther. (2019) 32:e12921. doi: 10.1111/dth.12921
8. Van der Meeren L, Verduijn J, Krysko DV, Skirtach AG. AFM Analysis enables differentiation between apoptosis, necroptosis, and ferroptosis in murine cancer cells. iScience. (2020) 23:101816. doi: 10.1016/j.isci.2020.101816
9. Zeng N, Ma L, Cheng Y, Xia Q, Li Y, Chen Y, et al. Construction of a ferroptosis-related gene signature for predicting survival and immune microenvironment in melanoma patients. Int J Gen Med. (2021) 14:6423–38. doi: 10.2147/IJGM.S327348
10. Xu C, Chen H. A ferroptosis-related gene model predicts prognosis and immune microenvironment for cutaneous melanoma. Front Genet. (2021) 12:697043. doi: 10.3389/fgene.2021.697043
11. Guo Y, Qu Z, Li D, Bai F, Xing J, Ding Q, et al. Identification of a prognostic ferroptosis-related lncRNA signature in the tumor microenvironment of lung adenocarcinoma. Cell Death Discov. (2021) 7:190. doi: 10.1038/s41420-021-00576-z
12. Lu L, Liu LP, Zhao QQ, Gui R, Zhao QY. Identification of a ferroptosis-related LncRNA signature as a novel prognosis model for lung adenocarcinoma. Front Oncol. (2021) 11:675545. doi: 10.3389/fonc.2021.675545
13. Zheng Z, Zhang Q, Wu W, Xue Y, Liu S, Chen Q, et al. Identification and validation of a ferroptosis-related long non-coding RNA signature for predicting the outcome of lung adenocarcinoma. Front Genet. (2021) 12:690509. doi: 10.3389/fgene.2021.690509
14. Wu ZH, Tang Y, Yu H, Li HD. The role of ferroptosis in breast cancer patients: a comprehensive analysis. Cell Death Discov. (2021) 7:93. doi: 10.1038/s41420-021-00473-5
15. Zhang K, Ping L, Du T, Liang G, Huang Y, Li Z, et al. A ferroptosis-related lncRNAs signature predicts prognosis and immune microenvironment for breast cancer. Front Mol Biosci. (2021) 8:678877. doi: 10.3389/fmolb.2021.678877
16. Chen W, Feng Z, Huang J, Fu P, Xiong J, Cao Y, et al. Identification of ferroptosis-related long noncoding RNA and construction of a novel prognostic signature for gastric cancer. Dis Markers. (2021) 2021:7724997. doi: 10.1155/2021/7724997
17. Yoshihara K, Shahmoradgoli M, Martínez E, Vegesna R, Kim H, Torres-Garcia W, et al. Inferring tumour purity and stromal and immune cell admixture from expression data. Nat Commun. (2013) 4:2612. doi: 10.1038/ncomms3612
18. Zhou R, Liang J, Tian H, Chen Q, Yang C, Liu C. Development of a ferroptosis-related lncRNA signature to predict the prognosis and immune landscape of bladder cancer. Dis Markers. (2021) 2021:1031906. doi: 10.1155/2021/1031906
19. Cai HJ, Zhuang ZC, Wu Y, Zhang YY, Liu X, Zhuang JF, et al. Development and validation of a ferroptosis-related lncRNAs prognosis signature in colon cancer. Bosn J Basic Med Sci. (2021) 21(5):569–76. doi: 10.17305/bjbms.2020.5617
20. Tang Y, Li C, Zhang YJ, Wu ZH. Ferroptosis-Related Long Non-Coding RNA signature predicts the prognosis of Head and neck squamous cell carcinoma. Int J Biol Sci. (2021) 17:702–11. doi: 10.7150/ijbs.55552
21. Zheng J, Zhou Z, Qiu Y, Wang M, Yu H, Wu Z, et al. A prognostic ferroptosis-related lncRNAs signature associated with immune landscape and radiotherapy response in glioma. Front Cell Dev Biol. (2021) 9:675555. doi: 10.3389/fcell.2021.675555
22. Mounir M, Lucchetta M, Silva TC, Olsen C, Bontempi G, Chen X, et al. New functionalities in the TCGAbiolinks package for the study and integration of cancer data from GDC and GTEx. PLoS Comput Biol. (2019) 15:e1006701. doi: 10.1371/journal.pcbi.1006701
23. Hassannia B, Vandenabeele P, Vanden Berghe T. Targeting ferroptosis to iron out cancer. Cancer Cell. (2019) 35:830–49. doi: 10.1016/j.ccell.2019.04.002
24. Stockwell BR, Friedmann Angeli JP, Bayir H, Bush AI, Conrad M, Dixon SJ, et al. Ferroptosis: a regulated cell death nexus linking metabolism, redox biology, and disease. Cell. (2017) 171:273–85. doi: 10.1016/j.cell.2017.09.021
25. Zheng J, Conrad M. The metabolic underpinnings of ferroptosis. Cell Metab. (2020) 32:920–37. doi: 10.1016/j.cmet.2020.10.011
26. Zhou N, Bao J. Ferrdb: a manually curated resource for regulators and markers of ferroptosis and ferroptosis-disease associations. Database (Oxford). (2020) 2020:baaa021. doi: 10.1093/database/baaa021
27. Ritchie ME, Phipson B, Wu D, Hu Y, Law CW, Shi W, et al. Limma powers differential expression analyses for RNA-sequencing and microarray studies. Nucleic Acids Res. (2015) 43:e47. doi: 10.1093/nar/gkv007
28. Ito K, Murphy D. Application of ggplot2 to pharmacometric graphics. CPT Pharmacometrics Syst Pharmacol. (2013) 2:e79. doi: 10.1038/psp.2013.56
29. Shannon P, Markiel A, Ozier O, Baliga NS, Wang JT, Ramage D, et al. Cytoscape: a software environment for integrated models of biomolecular interaction networks. Genome Res. (2003) 13:2498–504. doi: 10.1101/gr.1239303
30. Ringnér M. What is principal component analysis. Nat Biotechnol. (2008) 26:303–4. doi: 10.1038/nbt0308-303
31. Kanaan-Izquierdo S, Ziyatdinov A, Burgueño MA, Perera-Lluna A. Multiview: a software package for multiview pattern recognition methods. Bioinformatics (Oxford, England). (2019) 35:2877–9. doi: 10.1093/bioinformatics/bty1039
32. Subramanian A, Kuehn H, Gould J, Tamayo P, Mesirov JP. GSEA-P: a desktop application for gene set enrichment analysis. Bioinformatics (Oxford, England). (2007) 23:3251–3. doi: 10.1093/bioinformatics/btm369
33. Subramanian A, Tamayo P, Mootha VK, Mukherjee S, Ebert BL, Gillette MA, et al. Gene set enrichment analysis: a knowledge-based approach for interpreting genome-wide expression profiles. Proc Natl Acad Sci USA. (2005) 102:15545–50. doi: 10.1073/pnas.0506580102
34. Yoon S, Kim SY, Nam D. Improving gene-set enrichment analysis of RNA-seq data with small replicates. PLoS ONE. (2016) 11:e0165919. doi: 10.1371/journal.pone.0165919
35. Foroutan M, Bhuva DD, Lyu R, Horan K, Cursons J, Davis MJ. Single sample scoring of molecular phenotypes. BMC Bioinformatics. (2018) 19:404. doi: 10.1186/s12859-018-2435-4
36. Chen B, Khodadoust MS, Liu CL, Newman AM, Alizadeh AA. Profiling tumor infiltrating immune cells with CIBERSORT. Methods Mol Biol. (2018) 1711:243–59. doi: 10.1007/978-1-4939-7493-1_12
37. Daassi D, Mahoney KM, Freeman GJ. The importance of exosomal PDL1 in tumour immune evasion. Nat Rev Immunol. (2020) 20:209–15. doi: 10.1038/s41577-019-0264-y
38. Mayakonda A, Lin DC, Assenov Y, Plass C, Koeffler HP. Maftools: efficient and comprehensive analysis of somatic variants in cancer. Genome Res. (2018) 28:1747–56. doi: 10.1101/gr.239244.118
39. Löffler-Wirth H, Kalcher M, Binder H. oposSOM: r-package for high-dimensional portraying of genome-wide expression landscapes on bioconductor. Bioinformatics (Oxford, England). (2015) 31:3225–7. doi: 10.1093/bioinformatics/btv342
40. Ding Y, Li T, Li M, Tayier T, Zhang M, Chen L, et al. A novel autophagy-related lncRNA gene signature to improve the prognosis of patients with melanoma. Biomed Res Int. (2021) 2021:8848227. doi: 10.1155/2021/8848227
41. Ping S, Wang S, He J, Chen J. Identification and validation of immune-related lncRNA signature as a prognostic model for skin cutaneous melanoma. Pharmgenomics Pers Med. (2021) 14:667–81. doi: 10.2147/PGPM.S310299
42. Wang Y, Ba HJ, Wen XZ, Zhou M, Küçük C, Tamagnone L, et al. A prognostic model for melanoma patients on the basis of immune-related lncRNAs. Aging (Albany NY). (2021) 13:6554–64. doi: 10.18632/aging.202730
43. Xiao B, Liu L, Li A, Wang P, Xiang C, Li H, et al. Identification and validation of immune-related lncRNA prognostic signatures for melanoma. Immun Inflamm Dis. (2021) 9:1044–54. doi: 10.1002/iid3.468
44. Zhou JG, Donaubauer AJ, Frey B, Becker I, Rutzner S, Eckstein M, et al. Prospective development and validation of a liquid immune profile-based signature (LIPS) to predict response of patients with recurrent/metastatic cancer to immune checkpoint inhibitors. J Immunother Cancer. (2021) 9(2):e001845. doi: 10.1136/jitc-2020-001845
45. Zhao F, Lin T, He W, Han J, Zhu D, Hu K, et al. Knockdown of a novel lincRNA AATBC suppresses proliferation and induces apoptosis in bladder cancer. Oncotarget. (2015) 6:1064–78. doi: 10.18632/oncotarget.2833
46. Li M, Liu Y, Zhang X, Liu J, Wang P. Transcriptomic analysis of high-throughput sequencing about circRNA, lncRNA and mRNA in bladder cancer. Gene. (2018) 677:189–97. doi: 10.1016/j.gene.2018.07.041
47. Wang P, Zeng Z, Shen X, Tian X, Ye Q. Identification of a multi-RNA-type-based signature for recurrence-free survival prediction in patients with uterine corpus endometrial carcinoma. DNA Cell Biol. (2020) 39:615–30. doi: 10.1089/dna.2019.5148
48. Tang T, Yang L, Cao Y, Wang M, Zhang S, Gong Z, et al. LncRNA AATBC regulates Pinin to promote metastasis in nasopharyngeal carcinoma. Mol Oncol. (2020) 14:2251–70. doi: 10.1002/1878-0261.12703
49. Zhang W, Liu Q, Zhao J, Wang T, Wang J. Long noncoding RNA AATBC promotes the proliferation and migration of prostate cancer cell through miR-1245b-5p/CASK axis. Cancer Manag Res. (2021) 13:5091–100. doi: 10.2147/CMAR.S310529
50. Yan K, Wang Y, Shao Y, Xiao T. Gene instability-related lncRNA prognostic model of melanoma patients via machine learning strategy. J Oncol. (2021) 2021:5582920. doi: 10.1155/2021/5582920
51. Xuan Y, Chen W, Liu K, Gao Y, Zuo S, Wang B, et al. A risk signature with autophagy-related long noncoding RNAs for predicting the prognosis of clear cell renal cell carcinoma: based on the TCGA database and bioinformatics. Dis Markers. (2021) 2021:8849977. doi: 10.1155/2021/8849977
52. Hou J, Yao C. Potential prognostic biomarkers of lung adenocarcinoma based on bioinformatic analysis. Biomed Res Int. (2021) 2021:8859996. doi: 10.1155/2021/8859996
53. Huang S, Li D, Zhuang L, Sun L, Wu J. Identification of Arp2/3 complex subunits as prognostic biomarkers for hepatocellular carcinoma. Front Mol Biosci. (2021) 8:690151. doi: 10.3389/fmolb.2021.690151
54. Li X, Li Y, Yu X, Jin F. Identification and validation of stemness-related lncRNA prognostic signature for breast cancer. J Transl Med. (2020) 18:331. doi: 10.1186/s12967-020-02497-4
55. Li X, Jin F, Li Y. A novel autophagy-related lncRNA prognostic risk model for breast cancer. J Cell Mol Med. (2021) 25:4–14. doi: 10.1111/jcmm.15980
56. Ma W, Zhao F, Yu X, Guan S, Suo H, Tao Z, et al. Immune-related lncRNAs as predictors of survival in breast cancer: a prognostic signature. J Transl Med. (2020) 18:442. doi: 10.1186/s12967-020-02522-6
57. Wu Q, Li Q, Zhu W, Zhang X, Li H. Identification of autophagy-related long non-coding RNA prognostic signature for breast cancer. J Cell Mol Med. (2021) 25:4088–98. doi: 10.1111/jcmm.16378
58. Mathias C, Muzzi J, Antunes BB, Gradia DF, Castro M, Carvalho de Oliveira J. Unraveling immune-related lncRNAs in breast cancer molecular subtypes. Front Oncol. (2021) 11:692170. doi: 10.3389/fonc.2021.692170
59. He Y, Wang X. Identification of molecular features correlating with tumor immunity in gastric cancer by multi-omics data analysis. Ann Transl Med. (2020) 8:1050. doi: 10.21037/atm-20-922
60. Chen Q, Hu L, Huang D, Chen K, Qiu X, Qiu B. Six-lncRNA immune prognostic signature for cervical cancer. Front Genet. (2020) 11:533628. doi: 10.3389/fgene.2020.533628
61. Wang Z, Zhang J, Liu Y, Zhao R, Zhou X, Wang H. An integrated autophagy-related long noncoding RNA signature as a prognostic biomarker for human endometrial cancer: a bioinformatics-based approach. Biomed Res Int. (2020) 2020:5717498. doi: 10.1155/2020/5717498
62. Xiao B, Liu L, Chen Z, Li A, Wang P, Xiang C, et al. Identification of epithelial-mesenchymal transition-related prognostic lncRNAs biomarkers associated with melanoma microenvironment. Front Cell Dev Biol. (2021) 9:679133. doi: 10.3389/fcell.2021.679133
63. Tian J, Yang Y, Li MY, Zhang Y. A novel RNA sequencing-based prognostic nomogram to predict survival for patients with cutaneous melanoma: clinical trial/experimental study. Medicine (Baltimore). (2020) 99:e18868. doi: 10.1097/MD.0000000000018868
64. Drijvers JM, Gillis JE, Muijlwijk T, Nguyen TH, Gaudiano EF, Harris IS, et al. Pharmacologic screening identifies metabolic vulnerabilities of CD8(+) T cells. Cancer Immunol Res. (2021) 9:184–99. doi: 10.1158/2326-6066.CIR-20-0384
65. Carpenter S, Aiello D, Atianand MK, Ricci EP, Gandhi P, Hall LL, et al. A long noncoding RNA mediates both activation and repression of immune response genes. Science. (2013) 341:789–92. doi: 10.1126/science.1240925
66. Gomez JA, Wapinski OL, Yang YW, Bureau JF, Gopinath S, Monack DM, et al. The NeST long ncRNA controls microbial susceptibility and epigenetic activation of the interferon-γ locus. Cell. (2013) 152:743–54. doi: 10.1016/j.cell.2013.01.015
67. Hu R, Sun X. lncRNATargets: a platform for lncRNA target prediction based on nucleic acid thermodynamics. J Bioinform Comput Biol. (2016) 14:1650016. doi: 10.1142/S0219720016500165
68. Zhang H, Chen Z, Wang X, Huang Z, He Z, Chen Y. Long non-coding RNA: a new player in cancer. J Hematol Oncol. (2013) 6:37. doi: 10.1186/1756-8722-6-37
69. Wang P, Zhang X, Sun N, Zhao Z, He J. Comprehensive analysis of the tumor microenvironment in cutaneous melanoma associated with immune infiltration. J Cancer. (2020) 11:3858–70. doi: 10.7150/jca.44413
Keywords: cutaneous melanoma, ferroptosis, immune infiltration, immune checkpoint, long non-coding RNA
Citation: Xu Y, Chen Y, Niu Z, Yang Z, Xing J, Yin X, Guo L, Zhang Q, Yang Y and Han Y (2022) Ferroptosis-related lncRNA signature predicts prognosis and immunotherapy efficacy in cutaneous melanoma. Front. Surg. 9:860806. doi: 10.3389/fsurg.2022.860806
Received: 23 January 2022; Accepted: 7 July 2022;
Published: 21 July 2022.
Edited by:
Kun Xiong, Central South University, ChinaReviewed by:
Mattia Riefolo, University of Bologna, Italy© 2022 Xu, Chen, Niu, Yang, Xing, Yin, Guo, Zhang, Yang and Han. This is an open-access article distributed under the terms of the Creative Commons Attribution License (CC BY). The use, distribution or reproduction in other forums is permitted, provided the original author(s) and the copyright owner(s) are credited and that the original publication in this journal is cited, in accordance with accepted academic practice. No use, distribution or reproduction is permitted which does not comply with these terms.
*Correspondence: Yan Han MTM3MjAwODYzMzVAMTYzLmNvbQ== Yi Yang c3lkeXlAMTYzLmNvbQ==
†These authors have contributed equally to this work.
Specialty Section: This article was submitted to Reconstructive and Plastic Surgery, a section of the journal Frontiers in Surgery
Disclaimer: All claims expressed in this article are solely those of the authors and do not necessarily represent those of their affiliated organizations, or those of the publisher, the editors and the reviewers. Any product that may be evaluated in this article or claim that may be made by its manufacturer is not guaranteed or endorsed by the publisher.
Research integrity at Frontiers
Learn more about the work of our research integrity team to safeguard the quality of each article we publish.