 Chih-Jun Lai
 Ya-Jung Cheng
 Dar-Ming Lai5
 Chun-Yu Wu
 Fon-Yih Tsuang
94% of researchers rate our articles as excellent or good
Learn more about the work of our research integrity team to safeguard the quality of each article we publish.
Find out more
ORIGINAL RESEARCH article
Front. Surg., 16 March 2022
Sec. Otorhinolaryngology - Head and Neck Surgery
Volume 9 - 2022 | https://doi.org/10.3389/fsurg.2022.851126
Background: Objectively detecting perioperative swallowing changes is essential for differentiating the reporting of subjective trouble sensations in patients undergoing anterior cervical spine surgery (ACSS). Swallowing indicates the transmission of fluid boluses from the pharynx (velopharynx, oropharynx, and hypopharynx) through the upper esophageal sphincter (UES). Abnormal swallowing can reveal fluid accumulation at the pharynx, which increased the aspiration risk. However, objective evidence is limited. High-resolution impedance manometry (HRIM) was applied for an objective swallowing evaluation for a more detailed analysis. We aimed to elucidate whether HRIM can be used to detect perioperative swallowing changes in patients undergoing ACSS.
Methods: Fourteen patients undergoing elective ACSS underwent HRIM with the Dysphagia Short Questionnaire (DSQ, score: 0–18) preoperatively (PreOP), on postoperative at day 1 (POD1), and postoperative at day seven (POD7). We calculated hypopharyngeal and UES variables, including hypopharyngeal mean peak pressure (PeakP) and UES peak pressure, representing their contractility (normal range of PeakP, 69–280 mmHg; peak pressure, 149–548 mmHg). The velopharynx-to-tongue base contractile (VTI) was also calculated (normal range, 300–700 mmHg.s.cm), indicating contractility. The swallowing risk index (SRI) from HRIM combined with four hypopharyngeal parameters, including PeakP, represents the global swallowing function (normal range, 0–11). A higher SRI value indicated higher aspiration.
Results: SRI was significantly higher on POD1 (10.88 ± 5.69) than PreOP (6.06 ± 3.71) and POD7 (8.99 ± 4.64). In all patients, PeakP was significantly lower on POD1 (61.8 ± 18.0 mmHg) than PreOP (84.9 ±34.7 mmHg) and on POD7 (75.3 ± 23.4 mmHg). The UES peak pressure was significantly lower on POD1 (80.4 ± 30.0 mmHg) than PreOP (112.9 ± 49.3 mmHg) and on POD7 (105.6 ± 59.1 mmHg). Other variables, including VTI, did not change significantly among the three time points. DSQ scores were 1.36, 3.43, and 2.36 at PreOP, POD1, and POD7 respectively.
Conclusions: With similar trends in DSQ and SRI, swallowing was significantly decreased on POD1 because of decreased hypopharyngeal and UES contractility but recovered to the preoperative state on POD7 after ACSS. Applying HRIM is superior to DSQ in detecting mechanisms and monitoring the recovery from swallowing dysfunction.
Clinical Trial Registration: The study was registered at ClinicalTrials.gov (NCT03891940).
Objective detection of perioperative changes in swallowing is essential for differentiating only subjectively trouble swallowing sensations in patients undergoing anterior cervical spine surgery (ACSS). Normal effective swallowing is defined as the ability of pharyngeal peristalsis to transfer fluid boluses through the velopharynx, oropharynx, hypopharynx, and through the upper esophageal sphincter (UES) into the esophagus (Figure 1) (1). If one of these mechanisms is dysfunctional, it will cause bolus accumulation in these regions and increase the aspiration risk (2, 3).
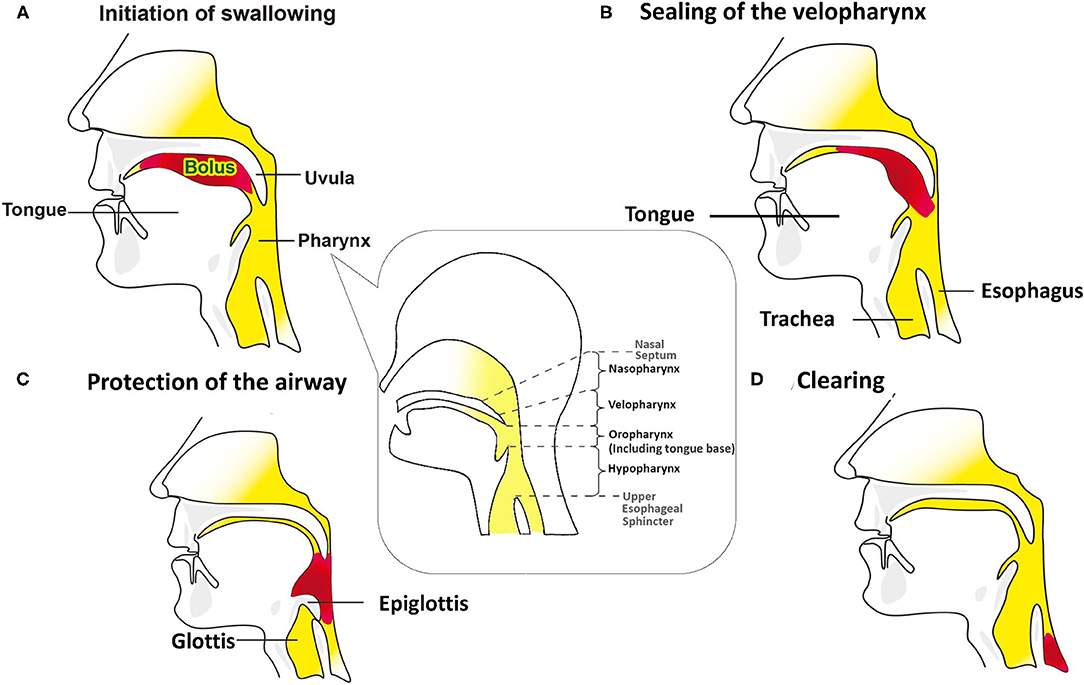
Figure 1. Swallowing mechanisms of bolus through the oral cavity into the esophagus. The red pattern in (B–D) depicts the bolus in the same way that does in the (A). (A) The bolus is kept in the oral cavity, initiating the swallowing process. The figure in the dialog box below the pharynx illustrates that the pharynx includes the velopharynx, oropharynx and hypopharynx. The base of tongue is part of the oropharynx, and usually not visible when the mouth is open. (B) During the pharyngeal phase, the velopharynx, oral cavity, and larynx are sealing, and the bolus is transmitted through the pharynx and into the esophagus by pharyngeal peristalsis. (C) Airway protection is essential during the swallowing process, which includes tilting back of epiglottis, closing the laryngeal vestibule, trucking of the sealed airway under the tongue base from the bolus path, and the neuronal suppression of respiration while the bolus passes through the pharynx. (D) As the bolus passing into the esophagus, the airway reopens.
Anesthesia and surgical manipulation of the ACSS may interfere with postoperative swallowing by affecting both sensory and motor functions. The trouble with swallowing is a subjective sensation and is the most common compliant in patients undergoing ACSS (4–8). However, objective evidence from previous studies assessing perioperative changes in swallowing is limited. Most previous investigators relied on patient self-report questionnaires, which are subjective and do not detect mechanisms of swallowing dysfunction (6). Some objective evaluation tools still have many shortcomings, such as radiation exposure in videofluoroscopy and inability to quantify swallowing physiology in the fiberoptic endoscopic evaluation of swallowing (9). In addition, the most concerning aspect of these tools is the inability to detect and differentiate the dysfunction of swallowing mechanisms. Early detection and differentiation of perioperative abnormal swallowing problems could help early treatment precisely (10).
High-resolution impedance manometry (HRIM) is a novel and reproducible tool for objectively assessing swallowing function using multiple pressure sensors and impedance channels (9, 11–14). In addition to multiple channels to measure pressure progression for effective pharyngeal peristalsis, a fluid bolus passing through the pharyngeal region can be detected through a low-impedance signal (12, 15). It could assess whether the muscle groups at the velopharynx, oropharynx, hypopharynx and UES could contract and open effectively and smoothly without resistance. HRIM also extends many parameters to measure them. In this study, we aimed to elucidate whether HRIM can be used to detect perioperative swallowing changes in patients undergoing ACSS. The data obtained by HRIM and subjective questionnaires on postoperative day one (POD1) and postoperative day seven (POD7) were compared with those collected preoperatively (PreOP). Swallowing dysfunction was determined by differentiating the affected physiology and recovery time.
Written informed consent was obtained from all patients participating in this study. The study was approved by the Ethics Committee of the National Taiwan University Hospital (No. 201901089RINC) and was registered at ClinicalTrials.gov (NCT03891940). Consecutive patients who underwent ACSS were eligible for enrollment. The study population included patients aged 20–80 years who underwent surgery for degenerative or traumatic conditions involving any cervical level. Patients were excluded from the study if they (1) had any major systemic disease, such as congestive heart failure, liver cirrhosis, end-stage renal disease, or malignancy; (2) were at risk of difficult ventilation or intubation; (3) were pregnant; (4) exhibited coagulopathy.
Manometric studies were completed using a 10 Fr outer diameter solid-state assembly with 36 circumferential pressure sensors at 1 cm intervals and 12 impedance segments at 2 cm intervals (MMS, Enschede, the Netherlands). Before each recording, the catheter was calibrated to the atmospheric pressure, according to the manufacturer's instructions. After a minimum 8 h of fasting, patients were intubated, and the catheter was positioned with sensors straddling the entire pharyngoesophageal segment (Figure 2). Pressure and impedance data were acquired at 20 Hz (Solar GI acquisition system, MMS, The Netherlands) with the patient sitting upright.
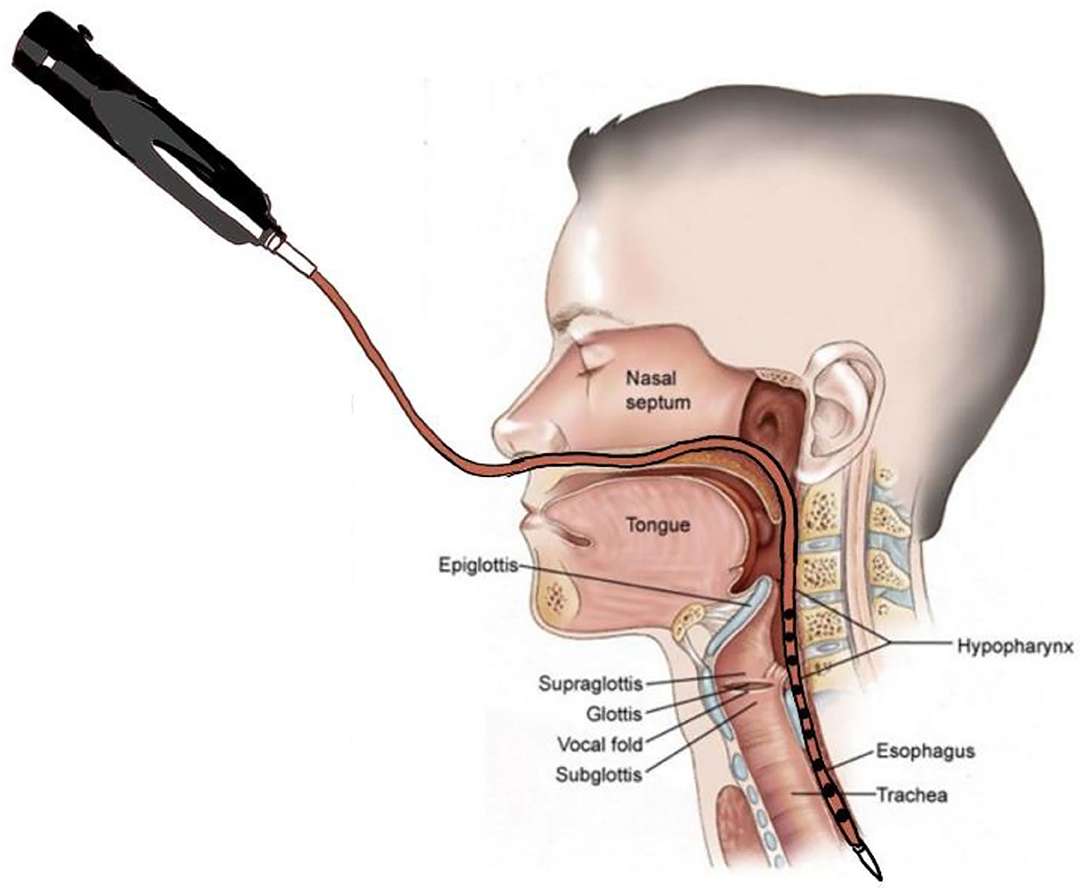
Figure 2. Swallow function recorded by High-Resolution Impedance Manometry (HRIM). The HRIM tube is shown in a patient's pharyngeal segment.
Patients were intubated with general anesthesia and remained supine on the operation table with the neck extended. The patient received 1 g of cefazolin as a prophylactic antibiotic within 1 h of the incision. A skin surface landmark was used to determine the incision site for the affected cervical segment. The operating surgeon was right-handed; and thus, the surgery was performed on the right side of the patient. A horizontal linear skin incision of ~4 cm was made in the skin and increased from the midline to the anterior border of the right sternocleidomastoid muscle. After careful dissection of the subcutaneous soft tissue, the anterior border of platysma muscle was exposed. The platysma muscle was vertically released for mobilization. We dissected along the medial border of the platysma and sternocleidomastoid muscles, as well as the lateral border of the trachea and hypopharynx to expose the prevertebral space. We dissected the medial aspect of the bilateral longus coli muscles off the vertebral bodies, and inserted Koros self-retaining retractors. The teeth of the Koros retraction blade were placed just beneath the medial border of the longus coli to avoid injury to the hypopharynx or esophagus. We did not routinely use a longitudinal distraction system, such as a Caspar retractor. Therefore, there was no distraction across the intervertebral spaces. We used lateral intraoperative fluoroscopy for surgery-level localization, followed by a surgical microscope. We performed annulotomy, discectomy, and osteophytes removal using a high-speed hand drill, curettage, and Kerrison rongeurs. The posterior longitudinal ligament was resected. In the current study, we used a polyetheretherketone cage combined with an artificial bone graft for interbody fusion, which was completely covered by the National Health Insurance in Taiwan. No plates or screws were used for anterior fixation. The wounds were irrigated with saline and closed in a standard manner. We did not apply local steroids in the prevertebral space nor did we administer any intravenous steroids postoperatively. Typically, no drain is inserted after surgery. We administered postoperative antibiotics for 24 h, and the patient received appropriate analgesic medication, including acetaminophen and nonsteroidal anti-inflammatory drugs. Patients were discharged on the first or second postoperative day.
All patients had their swallowing function assessed using HRIM combined with the Dysphagia Short Questionnaire (DSQ; score: 0 to 18; low score, mild symptoms) at the three time points (PreOP, POD1, and POD7) (11). After the HRIM catheter was inserted through the pharyngeal-esophageal segment, we administered 5 mL of normal saline boluses on command via a syringe at >20 s minimum intervals. Every patient underwent the swallowing test ten times.
HRIM data were calculated as the average of the ten swallowing tests completed by each patient. Figure 3A showed a high-resolution color pressure topography plot.
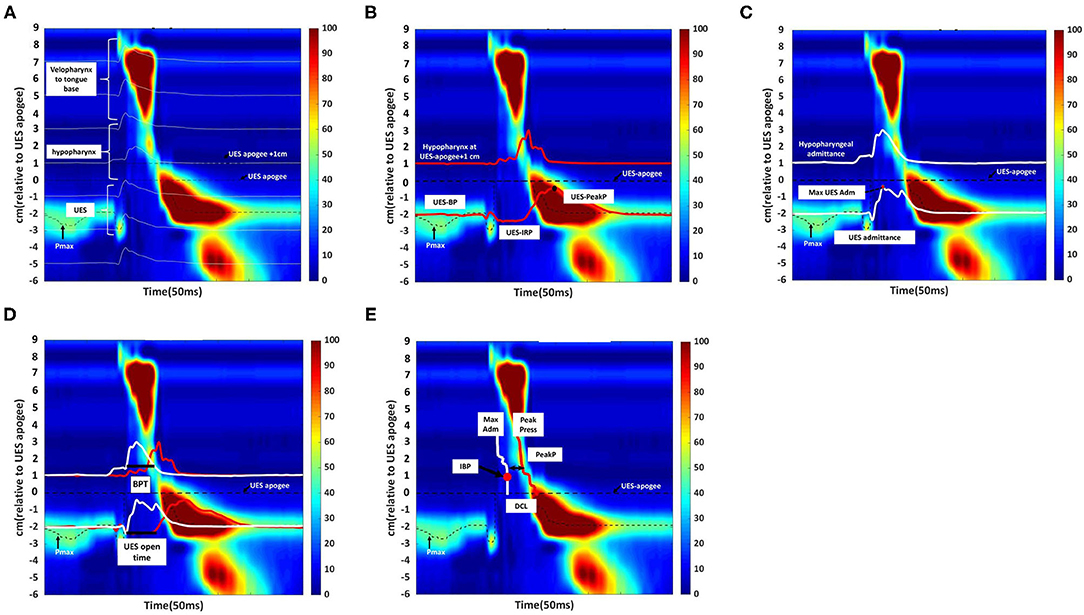
Figure 3. Swallowing function assessment via High -Resolution Impedance Manometry (HRIM). (A) Illustrative example of our data from the pressure sensors on the HRIM catheter (y-axis) over time (x-axis). The graph shows the oropharyngeal pressure topography, from the velopharynx to the tongue base, hypopharynx, and into the upper esophageal sphincter (UES). The high-pressure zone is the UES. The impedance channels from the velopharynx into the esophagus are indicated by white horizontal lines. Effective oropharyngeal muscle contraction relies on bolus transmission, during which the impedance level decreases. (B) Illustrative example of measurement of the parameters of hypopharyngeal and upper esophageal sphincter (UES) pressures. The upper red line represents the pressure waveform recorded at the hypopharynx during the swallow (apogee + 1 cm). The lower red line represents the UES pressure waveform, constructed from pressures recorded at the maximum UES pressure position over time. The mean pre-deglutitive UES basal pressure (UES-BP), UES integrated relaxation pressure (UES-IRP), and post-deglutitive UES peak pressure (UES-PeakP) can be identified at the lower red lines. (C) Illustrative example of measurement of the parameters of hypopharyngeal and upper esophageal sphincter admittance. Admittance (S) is the inverse product of impedance (Ω), i.e., S = 1/Ω. Admittance increases with bolus distension of the hypopharynx and UES. The maximum admittance within the UES (Max UES Adm) is represented by the maximum cross-sectional area of the lumen. The lower white line represents the UES admittance waveform, which is constructed from impedance recorded at the Pmax position over the swallowing period. The upper white line represents the admittance waveform at the hypopharyngeal position during the swallow (apogee +1 cm). (D) Illustrative example of measurement of bolus presence time (BPT) and upper esophageal sphincter (UES) open time. The lower section of the graph represents the UES region. The red line represents the UES pressure waveform, which is constructed from pressures recorded at the Pmax position over time. The white line represents the admittance waveform. UES open time was calculated from UES admittance and the pressure waveform, which were used together to define the onset of UES opening (based on the admittance upstroke in the UES), and UES closure (based on the pressure upstroke in the UES). The upper section of the graph represents the hypopharynx region (apogee + 1 cm). The red line represents the hypopharyngeal pressure waveform, and the white line represents the admittance waveform. The UES admittance level at the time of closure was used as the threshold to commence the hypopharyngeal admittance recording. The period when hypopharyngeal admittance exceeded this threshold was defined as the bolus presence time (BPT). (E) Illustrative example of measurement of the hypopharyngeal parameters. The white line indicates the maximum admittance (Max Adm) in the hypopharynx region. The red line indicates the mean value of the hypopharyngeal peak pressure (Mean Peak) in the hypopharynx region. Distension-contraction latency (DCL) reflects the time of maximum bolus distension and maximum contraction of the hypopharynx during the swallow. Hypopharyngeal intrabolus distension pressure (IBP) is defined as the pressure at maximum distension (at the position of Max Adm), 1 cm proximal to the UES apogee. The upper esophageal sphincter (UES) apogee is defined by visualization of the orad movement of the UES high-pressure zone to determine the highest position of the proximal edge of the high-pressure zone during swallowing. The Pmax position is defined as the position at the maximum pressure of UES.
The acquisition system allowed the export of raw pressure and impedance data to a spreadsheet template (Microsoft Excel, Microsoft Corporation, Redmond, WA, USA). The data for each patient were analyzed using MATLAB 2019b (MathWorks Inc., Natick, MA, USA). All the parameters and their definitions are described in detail in Table 1 (11, 16). We used the following landmarks: (1) velopharynx and tongue base, (2) hypopharynx, and (3) UES apogee (14, 17, 18) (Figure 3A).
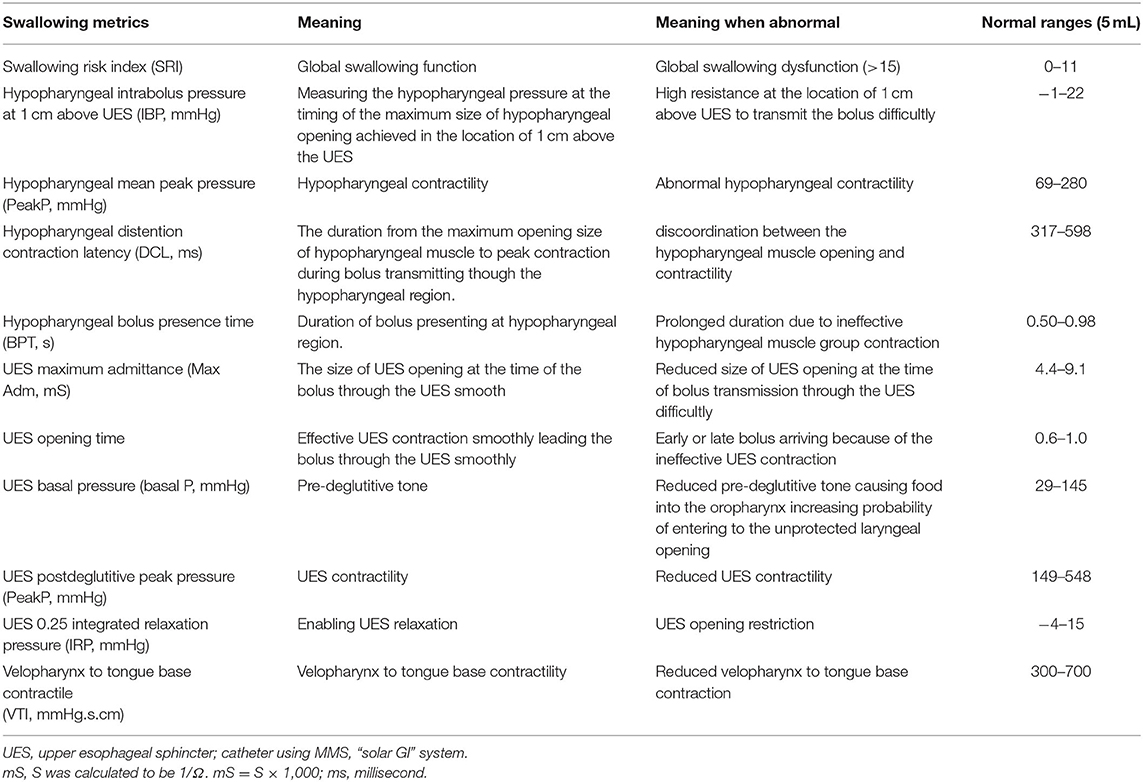
Table 1. Normative values for novel swallowing variables.
The pressure integral from the velopharynx to the tongue base (VTI) was derived by multiplying the mean pressure from the velopharynx to the tongue base (20 mmHg or higher) by the length of the velopharynx to the tongue base and then by the duration of the contraction in seconds (5). We defined the length of the velopharynx to the tongue base as the region between the superior margin of velopharyngeal contraction and the superior border of the hypopharynx (5). We calculated UES basal, peak and 0.25 s integrated relaxation pressure (IRP) (Figure 3B) (19, 20).
The UES and hypopharyngeal admittance is the inverse product of impedance (impedance: Ω, S = 1/Ω). The admittance rises with bolus distension of the hypopharynx and UES and the maximum admittance within the UES (Figure 3C). UES maximum admittance (UES Max Adm) is indicative of maximum cross-sectional area of the lumen (11).
The UES open time and hypopharyngeal bolus presence time (BPT) are presented in Figure 3D (11, 19). We assessed hypopharynx contractility using hypopharyngeal mean peak pressure (PeakP) (Figure 3E) (11). The hypopharyngeal intra-bolus distension pressure (IBP) was defined as the pressure recorded at maximum distension (1 cm proximal to the UES apogee, Figure 3E) (11). We defined the timing of flow to contraction as the average duration from hypopharyngeal muscle opening to contraction along the hypopharyngeal region [distension-contraction latency (DCL); Figure 3E] (11, 19). We defined the swallow risk index using the following formula (21):
SRI=(IBP × BPT)/(DCL + 1) × PeakP) × 100
We presented continuous data as means and standard deviations. Repeated measures ANOVA and Bonferroni post-hoc analyses were used to analyze the differences among the three time points. A p-value of P < 0.05 was considered statistically significant. Analyses were performed using SPSS (SPSS Inc., Chicago, IL, United States).
A total of 21 patients were eligible for inclusion in this study. We excluded four patients who declined to participate and three patients who refused to continue the HRIM swallowing test following the preoperative examination. Fourteen patients completed the study. Their detailed demographics information is presented in Table 2. The mean age was 59.84 ± 11.19 years and nine patients were men (64%). DSQ scores were 1.36 ± 1.22, 3.43 ± 1.95 and 2.36 ± 1.87 at PreOP, POD1, and POD7 time points (P < 0.01). DSQ scores at POD1 were significantly higher than PreOP or POD7. A total of 420 swallows were analyzed from these fourteen patients at all three time points.
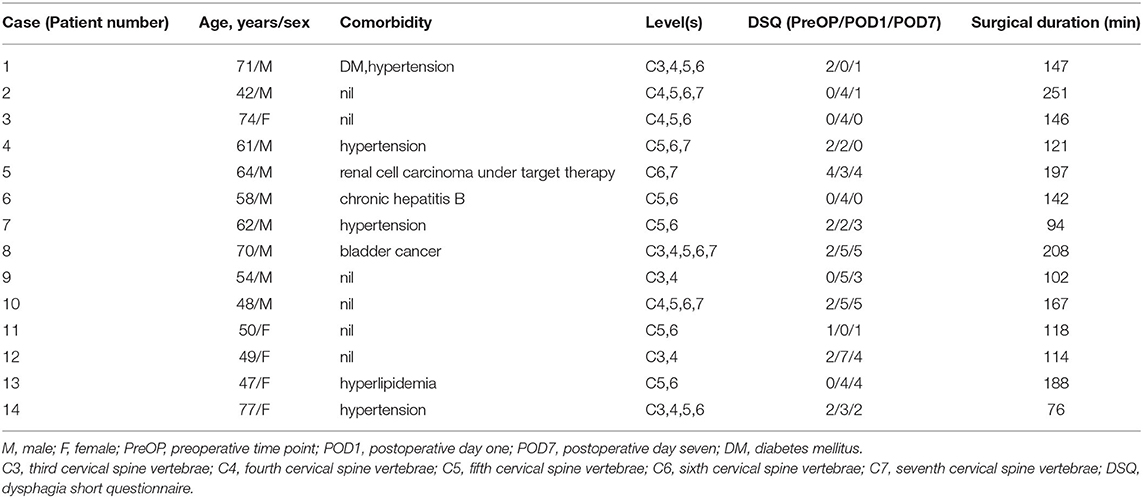
Table 2. Demographics and contributing factors of 14 patients associated with perioperative swallowing changes.
The changes in swallowing variables at the three time points are presented in Table 3 and Figure 4. The swallowing risk index (SRI) was significantly higher on POD1 (10.88) than on PreOP (6.06) and POD7 (8.99). A relative high SRI at POD1 (16.05) and POD7 (15.09) in patient number 9 (Table 2) with a higher preoperative SRI (12.86>11) was found. This patient had a low preoperative value of PeakP (61.88 mmHg). This indicates that the weak hypopharyngeal muscle groups are insufficient to transmit the bolus into the UES so that the bolus accumulates in the hypopharyngeal region and increases aspiration risk. The mean values of the SRI and other associated parameters for all patients are presented in Figure 4.
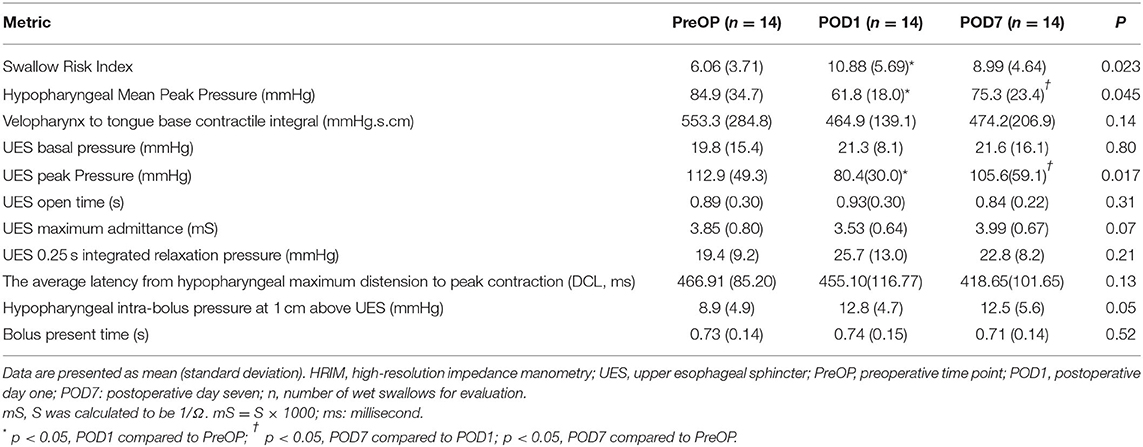
Table 3. Pharyngeal and upper esophageal sphincter parameters among HRIM swallow tests while in a neutral sitting position.
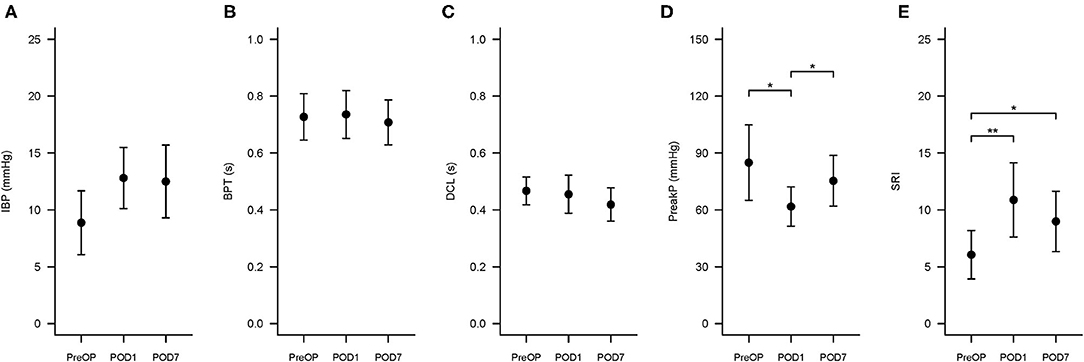
Figure 4. Swallowing Risk Index (SRI) and associated hypopharyngeal parameters changes at three time points. The three time points are PreOP (preoperative day), POD1 (postoperative day 1), and POD7 (postoperative day 7). The formula to calculate SRI is (IBP × BPT)/(DCL × PeakP) ×100. (A–E) Presented the error bar of IBP, BPT, DCL, PeakP, and SRI at PreOP, POD1 and POD7, respectively. *P < 0.05; **P < 0.01. SRI, Swallowing risk index; IBP, intrabolus pressure (mmHg); BPT, bolus present time (s); DCL, hypopharyngeal distention contraction latency (s); PeakP: hypopharyngeal mean peak pressure (mmHg).
For hypopharyngeal parameters, the PeakP indicating hypopharyngeal contractility was significantly lower at POD1 (61.8 mmHg) than PreOP (84.9 mmHg) and POD7 (75.3 mmHg; Tables 1, 3). UES peak pressure expressing UES contractility on POD1 (80.4 mmHg) was significantly lower than PreOP (112.9 mmHg) and POD7 (105.6 mmHg). Bolus presence time (BPT) and average latency from the hypopharyngeal maximum distension to peak contraction (DCL), implying the ability of bolus flow through the hypopharyngeal region smoothly presented no significant difference among the three time points (Tables 1, 3). Velopharynx to tongue base contractility presenting the muscle power at this region showed no significant differences among the 3 days (Table 3).
For evaluating UES effective opening (Tables 1, 3), UES maximum admittance (Max Adm) and UES open time showed no significantly changes at POD1 and POD7 compared to the data at PreOP (Tables 1, 3). UES 0.25 integrated relaxation pressure (IRP) indicating the capability of UES relaxation presented no significantly changes among these three time points (Tables 1, 3). UES basal pressure (basal P) indicating pre-deglutitive muscle tone showed no significantly difference among these time points (Tables 1, 3).
In this study, we were able to use HRIM to assess the perioperative swallowing functions in ACSS patients and detect changes in swallowing. Multiple HRIM impedance channels can be used to measure a liquid-based bolus that generates a low impedance signal, consistent with pharyngeal peristalsis (22). Our results showed that in ACSS patients without perioperative swallowing problems, the major factor interfering with swallowing was the effective contractility of the UES and hypopharyngeal muscle groups. When this contractility is less effective and associated with increasing SRI, these symptoms may be associated with surgical traction and resolve within seven days. HRIM measurements may play a particularly important role in differentiating the mechanisms of postoperative swallowing dysfunction and assessing preoperative swallowing function as a reference for patients with a high risk of developing postoperative dysphagia.
Our results showed that the measurements from the HRIM, including the SRI, provided more detailed information about changes in swallowing than the DSQ. A change in the DSQ score from 1.39 to 1.95 represented a slight change, without further information on swallowing, clinical impact or warning. However, SRI is a combined index that includes IBP, BPT, DCL and PeakP. These measurements indicate whether the hypopharyngeal peristalsis can transmit the bolus smoothly from the oropharyngeal region through the hypopharyngeal region into the esophagus. Because bolus retention in the hypopharyngeal region increases the possibility of the bolus entering the unprotected airway, there is an increased SRI and risk of aspiration. Clinicians should be aware that patients have a risk of aspiration risk when their SRI exceeds the normal range (>11) (11). One of our patients presented with a high SRI and increased data on PODs 1 and 7. We suspect that this patient had a relatively high preoperative intrabolus pressure, indicating a relatively high resistance to pharyngeal outflow. This would explain the high SRI after surgery. In previous studies, patients with high preoperative aspiration risk were assumed to have a high postoperative aspiration risk well (23). This indicates that these patients may have had swallowing dysfunction, but that the causative mechanisms were not identified preoperatively. This was because the treating physicians had not used an objective method for identifying swallowing dysfunction mechanisms. Early detection and assessment of swallowing dysfunction, and treating the root causes, may reduce complications, such as aspiration and its sequelae (10). In our study, using HRIM helped us to identify the underlying mechanisms. Further investigations and management, including postoperative swallowing education, should also be performed.
Generally, rapidly changing and widely varying pressures across the pharyngoesophageal segment make it difficult to conduct traditional manometry, which uses only a few transducers (24). In the pull-through techniques used in these traditional methods, sensors may be displaced from the UES high-pressure zone after breathing or coughing (25). With HRIM, multiple sensors and impedance channels allow the measurements to be analyzed in an integrated fashion (26). This approach has a high intra- and inter-rater reproducibility (9, 14). Furthermore, this catheter-based approach is clinically reliable and objective method for assessing swallowing function (9).
Historically, videofluoroscopy has been the most widely used technique for evaluating swallowing anatomy and physiology (27). However, besides the radiation exposure from associated with this technique (9), it cannot measure the contractility of the subcomponents (the velopharynx, tongue base and hypopharynx) (17). If these regions are combined, the composite measurement may appear “normal,” even in the presence of focal velopharynx-to-tongue base or hypopharyngeal muscle weakness. For example, increased viscosity of the barium preparation or higher bolus volume can lengthen bolus transmission time through the pharynx (28, 29). It is important to simultaneously evaluate muscle power and the condition of fluid bolus transmission. Furthermore, inter-rater reliability can vary widely depending on the analysis method for radiological images and the consistency of the bolus being swallowed (9).
The swallowing parameters measured via HRIM in our study (DCL, UES open time and UES maximum admittance in particular) showed fluid boluses passing smoothly and directly through the esophagus in all of our patients. These data were similar to patients without objective oropharyngeal dysphagia (11). These parameters simultaneously took pharyngeal pressure and bolus transmission into account, meaning that HRIM provided more detailed measurements than videofluoroscopy (11). Despite observing hypopharyngeal and UES muscle weakness and increasing SRI at POD1 (although these were within normal limits), the other parameters remained unaffected. This indicates that the weak UES and hypopharyngeal muscles were still sufficient to propel the bolus through the pharynx and UES at POD1 and thus not cause the bolus to accumulate around these regions and increase aspiration risk. We found that our measurements of UES and pharyngeal function were similar to those in previous studies of healthy volunteers (11). In addition, our data on UES pressure changes including UES opening from HRIM was similar to those of Nelson et al. (30). Our hypopharyngeal pressure data, however, were different from those of Rosen et al. (31). Rosen et al. used a different HRIM catheter and swallowing volume, resulting in the different pressure values they obtained in the hypopharyngeal region (11). Our catheter had 36 circumferential sensors, while the one used by Rosen et al was three-dimensional could measure four directional pressure changes, along with the mean pressures. In our study, patients swallowed 5 mL in every swallow test, but the volume was 10 mL in the study by Rosen et al.
The DSQ scores we recorded increased from the PreOP measurement (mean: 1.36) compared with POD1 measurement (mean: 3.43) and then decreased again by POD7 (mean: 2.36). The potential range of DSQ scores is from 0 to 18. The lower scores represent the milder symptoms (32). Overall, the mean DSQ scores we recorded were low. The small changes observed may indicate some swallowing discomfort, but not dysphagia or any swallowing problems. The HRIM measurements produced normal values, suggesting that none of the patients had any objective swallowing problems.
Our study has several limitations. First, because of the close arrangement of the pharyngeal structures, the 1 cm HRIM intervals used can detect detailed contractions in adjacent anatomical structures (33). However, it is difficult to differentiate between the velopharynx and mesopharynx (which includes the tongue base) as in the previous study (31), because deglutitive waves sometimes occur simultaneously (33). Therefore, the swallowing specialist assumed that the contractions were simultaneous (34). Second, we used only one bolus condition. Our results indicated a pattern of increasing IBP and reduced admittance. This phenomenon may be affected by the volume and viscosity of the bolus (35), however, but this could not be confirmed in this study. We are planning further research to address this question. Third, the ACSS was not performed at the same point on cervical spine in all patients, Performing the surgery at different points on the spine affects different locations on the pharynx, and it is difficult to elucidate the different effects this would have. However, regardless of the point on the cervical spine at which the surgery was performed, all of our patients received traction injuries during their ACSS (7, 36). We were able to use the HRIM to detect the changes perioperatively. We plan to investigate further effect of the different locations of surgery. Fourth, our patients presented slight perioperative changes in swallowing. Previous studies have identified factors that increase the risk of patients exhibiting swallowing disorders after cervical spine surgery, such as prolonged intubation or female gender (4, 37). We plan to investigate patients with actual swallowing disorder in the future. Fifth, the HRIM results were analyzed retrospectively. However, this did not affect our results because our analysis was based on published and validated methods (11). Sixth, the small sample size may have affected the results. However, the HRIM findings and patterns we observed n our patients were homogenous. Seventh, HRIM insertion is invasive, painful, and resulted in our sample size (only 14 patients agree to participate in these investigations). This also was reflected in the high withdrawal rate (~25%).
With similar trends in DSQ and SRI, swallowing functions were significantly decreased on POD1 because of decreasing hypopharyngeal and UES contractility but recovered toward preoperative state on POD7 after ACSS. Applying HRIM measurement is superior to DSQ on detecting possible mechanisms and monitoring recovery from global swallowing dysfunction, and also a feasible method for objectively assessing swallowing function perioperatively.
The raw data supporting the conclusions of this article will be made available by the authors, without undue reservation.
The studies involving human participants were reviewed and approved by 201901089RINC the Ethics Committee of the National Taiwan University Hospital. The patients/participants provided their written informed consent to participate in this study.
C-JL and F-YT contributed to the study concept, design, and data acquisition. C-JL contributed to the data analysis and interpretation, drafting of the manuscript, and statistical analysis. Y-JC and C-YW revised the manuscript. All the authors approved the final version of the manuscript. All authors contributed to the article and approved the submitted version.
This research was partially supported by National Taiwan University Hospital Grant (110-N4955 and 110-N4610).
The authors declare that the research was conducted in the absence of any commercial or financial relationships that could be construed as a potential conflict of interest.
All claims expressed in this article are solely those of the authors and do not necessarily represent those of their affiliated organizations, or those of the publisher, the editors and the reviewers. Any product that may be evaluated in this article, or claim that may be made by its manufacturer, is not guaranteed or endorsed by the publisher.
We acknowledge statistical assistance provided by the Taiwan Clinical Trial Statistical Centre.
ACSS, Anterior cervical spine surgery; DCL, Hypopharyngeal distension-contraction latency; HRIM, High resolution impedance manometry; IBP, Intrabolus distension pressure; PeakP, Hypopharyngeal mean peak pressure; POD1, Postoperative day 1; POD7, Postoperative day 7; PreOP, Preoperative time point; SRI, Swallowing risk index; UES, Upper esophageal sphincter; VTI, Velopharyx-to-tongue base contractile.
1. Shaw SM, Martino R. The normal swallow: muscular and neurophysiological control. Otolaryngol Clin North Am. (2013) 46:937–56. doi: 10.1016/j.otc.2013.09.006
2. Linden P, Siebens AA. Dysphagia: predicting laryngeal penetration. Arch Phys Med Rehabil. (1983) 64:281–4.
3. Murray J, Langmore SE, Ginsberg S, Dostie A. The significance of accumulated oropharyngeal secretions and swallowing frequency in predicting aspiration. Dysphagia. (1996) 11:99–103. doi: 10.1007/BF00417898
4. Bazaz R, Lee MJ, Yoo JU. Incidence of dysphagia after anterior cervical spine surgery: a prospective study. Spine. (2002) 27:2453–8. doi: 10.1097/00007632-200211150-00007
5. Razfar A, Sadr-Hosseini SM, Rosen CA, Snyderman CH, Gooding W, Abla AA, et al. Prevention and management of dysphonia during anterior cervical spine surgery. Laryngoscope. (2012) 122:2179–83. doi: 10.1002/lary.23284
6. Danto J, DiCapua J, Nardi D, Pekmezaris R, Moise G, Lesser M, et al. Multiple cervical levels: increased risk of dysphagia and dysphonia during anterior cervical discectomy. J Neurosurg Anesthesiol. (2012) 24:350–5. doi: 10.1097/ANA.0b013e3182622843
7. Rihn JA, Kane J, Albert TJ, Vaccaro AR, Hilibrand AS. What is the incidence and severity of dysphagia after anterior cervical surgery? Clin Orthop Relat Res. (2011) 469:658–65. doi: 10.1007/s11999-010-1731-8
8. Riley LH, Vaccaro AR, Dettori JR, Hashimoto R. Postoperative dysphagia in anterior cervical spine surgery. Spine. (2010) 35:S76–85. doi: 10.1097/BRS.0b013e3181d81a96
9. Rommel N, Hamdy S. Oropharyngeal dysphagia: manifestations and diagnosis. Nat Rev Gastroenterol Hepatol. (2016) 13:49–59. doi: 10.1038/nrgastro.2015.199
10. Wieseke A, Bantz D, Siktberg L, Dillard N. Assessment and early diagnosis of dysphagia. Geriatr Nurs. (2008) 29:376–83. doi: 10.1016/j.gerinurse.2007.12.001
11. Cock C, Omari T. Diagnosis of Swallowing Disorders: How We Interpret Pharyngeal Manometry. Curr Gastroenterol Rep. (2017) 19:11. doi: 10.1007/s11894-017-0552-2
12. Omari TI, Papathanasopoulos A, Dejaeger E, Wauters L, Scarpellini E, Vos R, et al. Reproducibility and agreement of pharyngeal automated impedance manometry with videofluoroscopy. Clin Gastroenterol Hepatol. (2011) 9:862–7. doi: 10.1016/j.cgh.2011.05.026
13. Omari TI, Wiklendt L, Dinning P, Costa M, Rommel N, Cock C. Upper esophageal sphincter mechanical states analysis: a novel methodology to describe UES relaxation and opening. Front Syst Neurosci. (2015) 8:241. doi: 10.3389/fnsys.2014.00241
14. Omari TI, Savilampi J, Kokkinn K, Schar M, Lamvik K, Doeltgen S, et al. The Reliability of Pharyngeal High Resolution Manometry with Impedance for Derivation of Measures of Swallowing Function in Healthy Volunteers. Int J Otolaryngol. (2016) 2016:2718482. doi: 10.1155/2016/2718482
15. Lee TH, Lee JS, Park JW, Cho SJ, Hong SJ, Jeon SR, et al. High-resolution impedance manometry facilitates assessment of pharyngeal residue and oropharyngeal dysphagic mechanisms. Dis Esophagus. (2014) 27:220–9. doi: 10.1111/dote.12101
16. Bhatia SJ, Shah C. How to perform and interpret upper esophageal sphincter manometry. J Neurogastroenterol Motil. (2013) 19:99–103. doi: 10.5056/jnm.2013.19.1.99
17. Omari TI, Ciucci M, Gozdzikowska K, Hernández E, Hutcheson K, Jones C, et al. High-Resolution Pharyngeal Manometry and Impedance: Protocols and Metrics—Recommendations of a High-Resolution Pharyngeal Manometry International Working Group. Dysphagia. (2019) 35:281–95. doi: 10.1007/s00455-019-10023-y
18. Cock C, Jones CA, Hammer MJ, Omari TI, McCulloch TM. Modulation of Upper Esophageal Sphincter (UES) Relaxation and Opening During Volume Swallowing. Dysphagia. (2017) 32:216–24. doi: 10.1007/s00455-016-9744-4
19. Doeltgen SH, Omari TI, Savilampi J. Remifentanil alters sensory neuromodulation of swallowing in healthy volunteers: quantification by a novel pressure-impedance analysis. Am J Physiol Gastrointest Liver Physiol. (2016) 310:1176–82. doi: 10.1152/ajpgi.00138.2016
20. Kwiatek MA, Mirza F, Kahrilas PJ, Pandolfino JE. Hyperdynamic upper esophageal sphincter pressure: a manometric observation in patients reporting globus sensation. Am J Gastroenterol. (2009) 104:289–98. doi: 10.1038/ajg.2008.150
21. Schar MS, Omari TI, Fraser RJ, Bersten AD, Bihari S. Disordered swallowing associated with prolonged oral endotracheal intubation in critical illness. Intensive Care Med. (2019) 46:140–2. doi: 10.1007/s00134-019-05844-2
22. Abdel Jalil AA, Katzka DA, Castell DO. Approach to the Patient with Dysphagia. Am J Med. (2015) 128:1138.e17–e23. doi: 10.1016/j.amjmed.2015.04.026
23. Weltz CR, Morris JB, Mullen JL. Surgical jejunostomy in aspiration risk patients. Ann Surg. (1992) 215:140–5. doi: 10.1097/00000658-199202000-00008
24. Cock C, Omari T. Systematic Review of Pharyngeal and Esophageal Manometry in Healthy or Dysphagic Older Persons (>60 years). Geriatrics. (2018) 3:67. doi: 10.3390/geriatrics3040067
25. Stewart M, Johnston RA, Stewart I, Wilson JA. Swallowing performance following anterior cervical spine surgery. Br J Neurosurg. (1995) 9:605–9. doi: 10.1080/02688699550040882
26. Jungheim M, Janhsen AM, Miller S, Ptok M. Impact of neuromuscular electrical stimulation on upper esophageal sphincter dynamics: a high-resolution manometry study. Ann Otol Rhinol Laryngol. (2015) 124:5–12. doi: 10.1177/0003489414539132
27. Smith-Hammond CA, New KC, Pietrobon R, Curtis DJ, Scharver CH, Turner DA. Prospective analysis of incidence and risk factors of dysphagia in spine surgery patients: comparison of anterior cervical, posterior cervical, and lumbar procedures. Spine. (2004) 29:1441–6. doi: 10.1097/01.BRS.0000129100.59913.EA
28. Nascimento WV, Cassiani RA, Santos CM, Dantas RO. Effect of bolus volume and consistency on swallowing events duration in healthy subjects. J Neurogastroenterol Motil. (2015) 21:78–82. doi: 10.5056/jnm14055
29. Stokely SL, Molfenter SM, Steele CM. Effects of barium concentration on oropharyngeal swallow timing measures. Dysphagia. (2014) 29:78–82. doi: 10.1007/s00455-013-9485-6
30. May NH, Davidson KW. Pearson Jr, William G, O'Rourke AK. Pharyngeal swallowing mechanics associated with upper esophageal sphincter pressure wave. Head Neck. (2020) 42:467–75. doi: 10.1002/hed.26029
31. Rosen SP, Jones CA, McCulloch TM. Pharyngeal swallowing pressures in the base-of-tongue and hypopharynx regions identified with three-dimensional manometry. Laryngoscope. (2017) 127:1989–95. doi: 10.1002/lary.26483
32. Skeppholm M, Ingebro C, Engstrom T, Olerud C. The Dysphagia Short Questionnaire: an instrument for evaluation of dysphagia: a validation study with 12 months' follow-up after anterior cervical spine surgery. Spine. (2012) 37:996–1002. doi: 10.1097/BRS.0b013e31823a7a5b
33. Ryu JS, Park DH, Kang JY. Application and Interpretation of High-resolution Manometry for Pharyngeal Dysphagia. J Neurogastroenterol Motil. (2015) 21:283–7. doi: 10.5056/15009
34. Singendonk M, Cock C, Bieckmann L, Szczesniak M, Ferris L, Benninga M, et al. Reliability of an online analysis platform for pharyngeal high-resolution impedance manometry recordings. Speech Lang Hear. (2019) 22:195–203. doi: 10.1080/2050571X.2018.1535564
35. Omari TI, Dejaeger E, Tack J, Van Beckevoort D, Rommel N. Effect of bolus volume and viscosity on pharyngeal automated impedance manometry variables derived for broad Dysphagia patients. Dysphagia. (2013) 28:146–52. doi: 10.1007/s00455-012-9423-z
36. Heese O, Fritzsche E, Heiland M, Westphal M, Papavero L. Intraoperative measurement of pharynx/esophagus retraction during anterior cervical surgery. Part II: perfusion Eur Spine J. (2006) 15:1839–43. doi: 10.1007/s00586-006-0070-7
Keywords: anterior cervical spine surgery, high-resolution impedance manometry, hypopharynx, perioperative swallowing physiology, upper esophageal sphincter
Citation: Lai C-J, Cheng Y-J, Lai D-M, Wu C-Y, Chang W-T and Tsuang F-Y (2022) Applying High-Resolution Impedance Manometry for Detecting Swallowing Change in Anterior Cervical Spine Surgery Patients. Front. Surg. 9:851126. doi: 10.3389/fsurg.2022.851126
Received: 10 January 2022; Accepted: 16 February 2022;
Published: 16 March 2022.
Edited by:
Ingo Todt, Bielefeld University, GermanyReviewed by:
Taher Omari, Flinders University, AustraliaCopyright © 2022 Lai, Cheng, Lai, Wu, Chang and Tsuang. This is an open-access article distributed under the terms of the Creative Commons Attribution License (CC BY). The use, distribution or reproduction in other forums is permitted, provided the original author(s) and the copyright owner(s) are credited and that the original publication in this journal is cited, in accordance with accepted academic practice. No use, distribution or reproduction is permitted which does not comply with these terms.
*Correspondence: Fon-Yih Tsuang, dHN1YW5nZnlAZ21haWwuY29t
Disclaimer: All claims expressed in this article are solely those of the authors and do not necessarily represent those of their affiliated organizations, or those of the publisher, the editors and the reviewers. Any product that may be evaluated in this article or claim that may be made by its manufacturer is not guaranteed or endorsed by the publisher.
Research integrity at Frontiers
Learn more about the work of our research integrity team to safeguard the quality of each article we publish.