 Yan WangLimin ChaiYuqian ChenJin LiuQingting WangQianqian ZhangYuanjie QiuDanyang LiHuan ChenNirui ShenXiangyu ShiJian WangXinming XieManxiang Li*
- Department of Respiratory and Critical Care Medicine, The First Affiliated Hospital of Xi’an Jiaotong University, Xi’an, China
Objective: This study aimed to analyze the correlation between quantitative computed tomography (CT) parameters and airflow obstruction in patients with COPD.
Methods: PubMed, Embase, Cochrane and Web of Knowledge were searched by two investigators from inception to July 2022, using a combination of pertinent items to discover articles that investigated the relationship between CT measurements and lung function parameters in patients with COPD. Five reviewers independently extracted data, and evaluated it for quality and bias. The correlation coefficient was calculated, and heterogeneity was explored. The following CT measurements were extracted: percentage of lung attenuation area <−950 Hounsfield Units (HU), mean lung density, percentage of airway wall area, air trapping index, and airway wall thickness. Two airflow obstruction parameters were extracted: forced expiratory volume in the first second as a percentage of prediction (FEV1%pred) and FEV1 divided by forced expiratory volume lung capacity.
Results: A total of 141 studies (25,214 participants) were identified, which 64 (6,341 participants) were suitable for our meta-analysis. Results from our analysis demonstrated that there was a significant correlation between quantitative CT parameters and lung function. The absolute pooled correlation coefficients ranged from 0.26 (95% CI, 0.18 to 0.33) to 0.70 (95% CI, 0.65 to 0.75) for inspiratory CT and 0.56 (95% CI, 0.51 to 0.60) to 0.74 (95% CI, 0.68 to 0.80) for expiratory CT.
Conclusions: Results from this analysis demonstrated that quantitative CT parameters are significantly correlated with lung function in patients with COPD. With recent advances in chest CT, we can evaluate morphological features in the lungs that cannot be obtained by other clinical indices, such as pulmonary function tests. Therefore, CT can provide a quantitative method to advance the development and testing of new interventions and therapies for patients with COPD.
Key points
(1) CT provides a quantitative and localized morphological method to study airflow limitation in COPD
(2) CT measurements have certain value for screening pre-COPD patients who have developed clinical symptoms but have not met the diagnostic criteria
(3) The combination of inspiratory and expiratory two-phase CT measurements and lung function can more accurately assess the degree of airflow limitation in patients
Introduction
Chronic obstructive pulmonary disease (COPD) is characterized by persistent respiratory symptoms and airflow limitation (1–3). Although the majority of patients followed a path of disease progression in which the severity of COPD tracked the severity of airflow limitation, the conventional method (such as pulmonary function tests, PFTs) fail to provide – information about regional pulmonary dysfunction (4). Studies have shown that the use of the fixed forced expiratory volume in the first second/forced vital capacity (FEV1/FVC) ratio to define airflow limitation may result in more frequent diagnoses of COPD in the elderly, and less frequent diagnoses in adults < 45 years of age (especially in patients with mild COPD), as compared with the use of the low limit of normal (LLN) values for FEV1/FVC (5, 6). The research results suggested that using lung function test in diagnosis and evaluation of COPD severity is controversial (7–10).
With the rapid development of CT imaging technology, quantitative CT can help physicians to quantify and localize the relative volumes of emphysema and gas trapping in patients with COPD by using low attenuation areas (11). In addition, the COPDGene® Study evaluating the accuracy of the GOLD stages in diagnosing airflow obstruction demonstrated that PFTs do not reflect the severity of quantitative CT parameters accurately (12). Trough objective quantitative evaluation of pulmonary emphysema and airways disease, CT may help achieve clinically meaningful phenotyping. Quantitative imaging has provided repeatable and unbised estimates of the severity and distribution of lung pathology. Lung volume reduction (LVR) and Endoscopic lung volume reduction (ELVR) are the current treatments for severe emphysema in addition to lung transplantation (11). Nowdays, Quantitative CT with its increasing possibilities has become a viable tool to provide detailed information on the distribution and heterogeneity of emphysema. This structural and functional information provides support for thoracic surgeons and interventional pulmonologists to select patients and optimize LVR procedures, as well as for the development of new endobronchial therapies to further improve outcomes in patients with lung volume reduction (11–13). Thus, quantitative CT may be used as a supplementary method to assess the degree and location of airflow limitation in patients with COPD.
Recently, it has been confirmed that the quantitative CT parameters of patients with COPD are related to airflow limitation. However, the results of these confounding factors such as the difference between the inspiratory and expiratory phases, the quantitative CT machine brand, and the level of tracheal measurement are variable and sometimes contradictory (13–16). Therefore, we conducted a systematic review and meta-analysis to analyze the correlation between quantitative computed tomography (CT) parameters and airflow obstruction in patients with chronic obstructive pulmonary disease (COPD).
Materials and methods
Study design
The study was designed according to the Preferred Reporting Items for Systematic Reviews and Meta-Analyses (PRISMA) statement (17).
Data sources and searches
PubMed, Embase, Cochrane and Web of Knowledge were searched for articles published from their inception to July 2022, using a combination of pertinent items to discover articles that investigated the relationship between CT measurements and lung function parameters in patients with COPD. Language restrictions were not implemented. Generally, the literature search was conducted using three keywords, such as “chronic obstructive pulmonary disease”, “pulmonary function test”, and “CT”. Besides, the Boolean operator “AND” was used in these three sets of keywords, and “OR” was used within each group. The detailed search process is shown in Supplementary Table S1.
Study selection
Each study was evaluated independently and systematically by five investigators with more than 6 years of thoracic radiology related working experiences. Articles were included in the systematic review if they met the following criteria: (1) all patients with stage 0-IV COPD were ≥18 years old, without a history of dementia and have no changes in medication or acute exacerbation within the past 6 weeks; (2) interventions included participants who had clearly described PFT, according to the guidelines of the American Thoracic Society (ATS), the European Respiratory Society (ERS), or other similar methods; (3) the relationship between quantitative CT and PFT was analyzed; (4) and the methods of the study included randomized control trial (RCTs), observational (prospective and retrospective cohort) studies, and cross-sectional studies. In addition, the exclusion criteria were as follows: (1) case reports, letters, and conference abstracts; (2) studies with outcomes from only PFT or quantitative CT; (3) studies that included participants who were included in other studies within the past 6 weeks; (4) studies that included participants with other confounding diseases (such as interstitial lung disease, α − 1 anti-trypsin, asthma, lung cancer, lung surgery, active pulmonary tuberculosis, etc.); (5) studies that included participants with diseases that affected adequate breathing.
Articles were included in the meta-analysis if (1) the study included a comparable proportion of GOLD 1–4 grades patients; (2) had a sample size ≥ 20 [20 subjects would provide a power of 0.90 when detecting a typical effect correlation coefficient (CC) of 0.60]; (3) provided the percentage of lung attenuation area under −950 HU (%LAA-950), mean lung density (MLD), wall area percentage (WA%) in airways ≥ fifth airway generation, air trapping index (ATI), airway wall thickness (WT), and airway lumen area (AI) by volumetric multi-detector CT (MDCT); (4) CCs of lung function and quantitative CT; (5) and parameters of lung function included the predicted forced expiratory volume in the first second as percentage (FEV1%pred) and FEV1/FVC. Articles were excluded in the meta-analysis if: (1) Selection Bias; (2) Sample size <20; (3) Not MDCT volume scan; (4) No CT quantitative parameters and PFT parameters included.
Data extraction and quality assessment
Two reviewers independently screened articles for the fulfillment of inclusion and exclusion criteria. Any disagreements or discrepancies were resolved through a consensus. A standardised extraction form was made to extract all relevant data from texts, tables, and figures of each study, including study characteristics, participant characteristics, methodology, and CCs. %LAA-950, %LAA < 950, MLD, 15 percentile point of lung density (Perc15), lung volume (LV), WA%, WT, AI and ATI were recorded in the systematic review. Seven CT measurements including %LAA-950, %LAA < −950 (between −856 and −950 HU), MLD, WA%, WT, AI, and ATI, were pooled in the meta-analysis and two PFT parameters including FEV1%pred and FEV1/FVC were extracted.
Furthermore, the Quality Assessment of Diagnostic Accuracy Studies (QUADAS) tool (18) was used to study methodological quality and potential bias. A study with a QUADAS score ≥11 points was deemed as high quality, while was considered to be of low quality.
Data synthesis and analysis
The overall measure was the correlation coefficient (CC) between CT and PFT parameters. The Hedges-Vevea random-effects model and normality Z-test were used to calculate the pooled 95% confidence intervals (95% CIs). We calculated correlations between emphysema proportions, mean lung density, tube wall thickness, and measures of lung function. We also performed a subgroup analysis across different CT brands to find sources of heterogeneity. If evaluating multiple layers of bronchi, we chose the smallest bronchi. Heterogeneity was evaluated using the I2 index. Additionally, we used a random-effects model because this was better equipped to explain the heterogeneity between the studies. Subgroup analyses were used to determine the impact of individual variables and the potential sources of heterogeneity. Subgroups were based on radiation dose (low or normal dose) and breath-hold (inspiratory and expiratory). Meta-regression was performed to investigate the influence of gender, if only the male patients was reported by at least three studies. Also, the potential publication bias was assessed using Begg's test.
In addition, we divided the densitometric thresholds into 950 HU and <−950 HU (between −856 and −950 HU) and divided breath-holding procedures into inspiratory and expiratory. We also divided CT machines into GE and Siemens, Toshiba, and Philips. All statistical analyses were performed using Stata 15.0 and SPSS 20.0. Further, sensitivity analyses were conducted to assess the impact of each study on the results of the pooled study by eliminating each study. Finally, analysis trimming and filling were carried out if necessary.
Results
Study selection
From the electronic databases (PubMed, Embase, Cochrane and Web of Knowledge), a total of 2,306 studies were included (Figure 1), and 1,961 citations were excluded based on their titles or abstracts. After screening the text of 345 articles, 204 studies were excluded from the systematic review. The reasons for exclusion were that the studies did not include: a large enough COPD sample or there was no association between quantitative CT and PFTs. According to the exclusion criteria of the meta-analysis, 78 studies were excluded. The reasons for exclusion were as follows: (1) selection bias, (2) small sample size, (3) MDCT volume scans were not available, (4) quantitative CT parameters or PFT parameters were not included. Finally, 141 articles were used for systematic review and 63 articles were included in the meta-analysis.
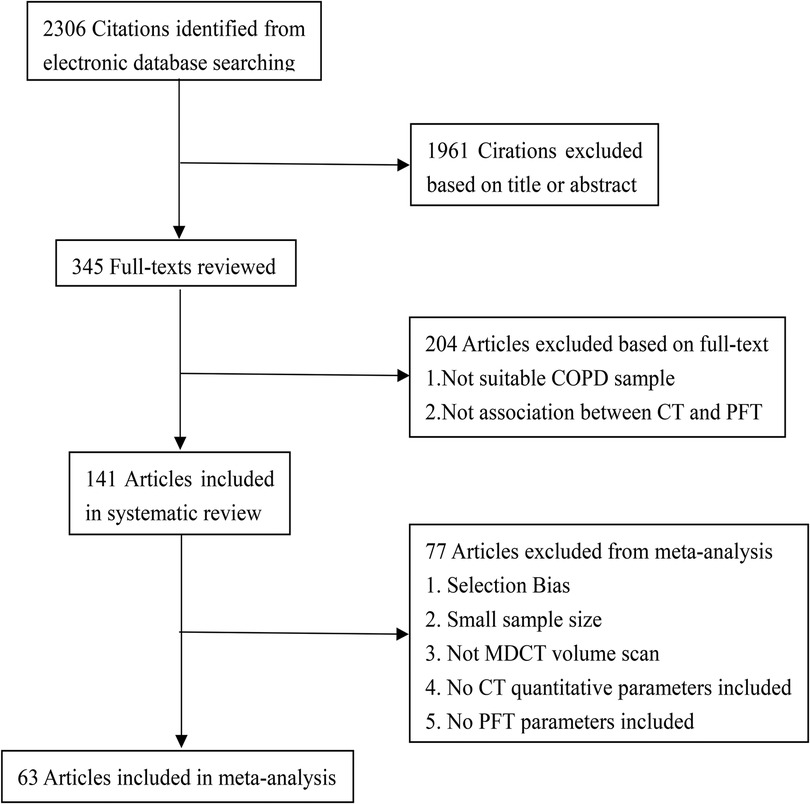
Figure 1. Flowchart of literature review and selection. COPD, chronic obstructive pulmonary disease; PFT, pulmonary function test; MDCT, multi-detector computed tomography.
Systematic review
The systematic review included a total of 25,214 participants. The age of patients range from 20 to 90, and there were 12,252 (60.4%) men, 5,676 (30.7%) women, 2,014 (8.9%) of the participants did not specify their gender (Supplementary Tables S2, S3). This study included RCTs and cohort studies. Of these, articles 46.8% (66 articles) were from Europe, 36.1% (51 articles) were from Asia, 12.8% (18 articles) were from North America, 2.8% (4 articles) from Oceania, 1.4% (2 articles) from Africa. Further, 123 (87.2%) were written in English, 11 (7.8%) in Chinese, 5 (3.5%) in Italian, 1 (0.7%) in French, and 1 (0.7%) in Polish.
The sample sizes of the recent publications were significantly larger than before, and the CT equipment was more advanced (Figure 2). Articles included a variety of breath-holding procedures, such as only inspiratory, expiratory, or both inspiratory and expiratory.
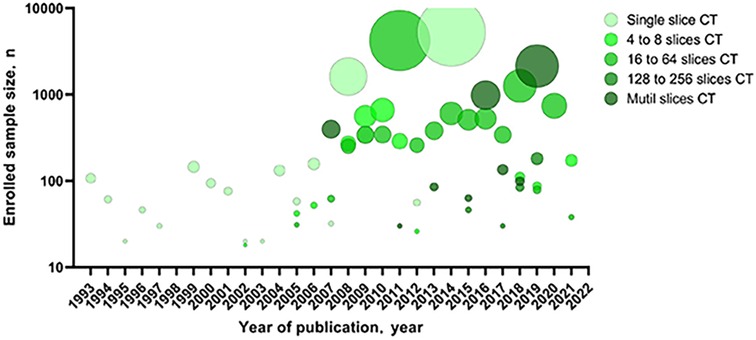
Figure 2. Sample size of the articles included in the systematic review by year of publication and MDCT. MDCT, multi-detector computed tomography.
The selected articles included 79 quantitative CT parameters and 29 pulmonary function parameters (Figure 3), and the final parameters for the systemic review included %LAA-950, %LAA < 950, WA%, MLD, ATI, Perc15, WT, AI, FEV1%pred, and FEV1/FVC. The common threshold defining the lung parenchyma in emphysema was −900 to −960 HU, and the most commonly used threshold was −950 HU (19). In some study, different thresholds in the same sample had different correlations with airflow obstruction parameters in PFTs (13, 14, 15, 20-22). The results show that there is a significant correlation between quantitative CT parameters and airflow limitation parameters (Table 1).
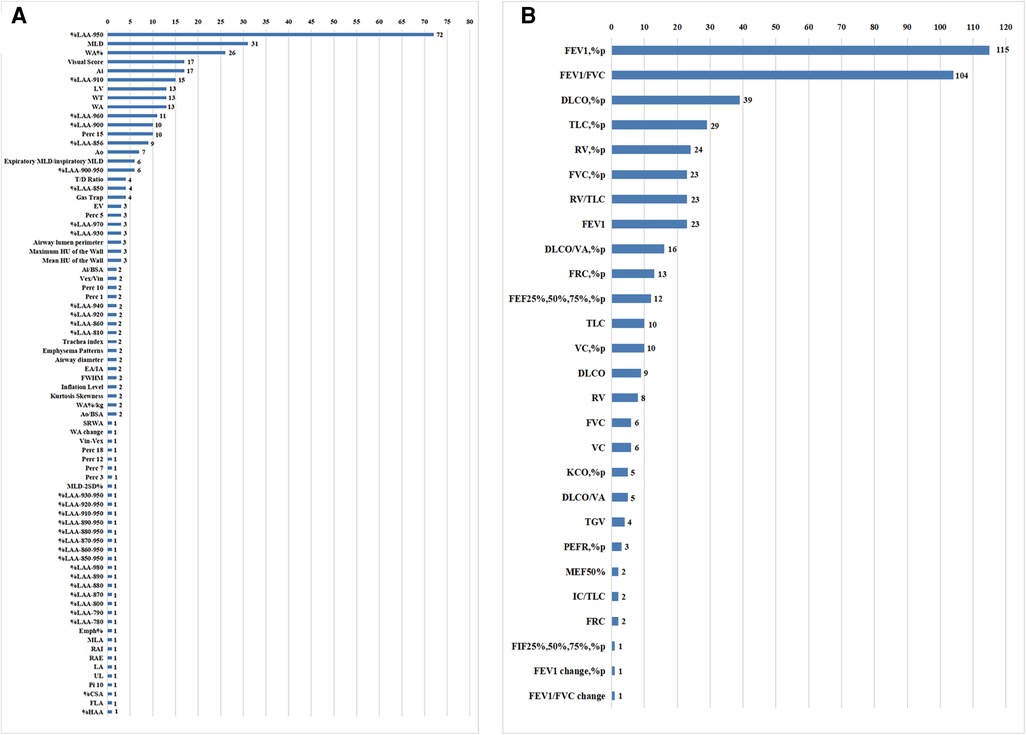
Figure 3. Counting of CT measurements and pulmonary function test parameters in the systematic review.
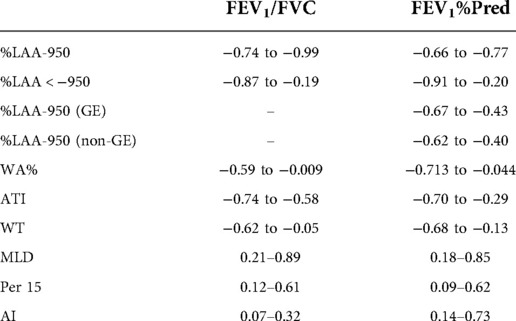
Table 1. Correlation coefficients between CT measurements and airflow obstruction parameters of pulmonary function test in the systematic review.
Risk of bias in the meta-analysis
All articles included in the meta-analysis were high quality (Supplementary Tables S4, S5); QUADAS scores ranged from 12.5 to 13.5 (Supplementary Table S6). QUADAS 2 where CT density was being considered as a diagnostic tool. Funnel plots and Begg-Mazumdar/Egger tests were selected to assess publication bias and reduce bias by excluding date or language limits during our search. No publication bias was found (Supplementary Table S7 and Supplementary Figures S1, S2).
Several of the meta-analyses showed slight heterogeneity. The I2 index was > 50% for correlations between WA% and FEV1%pred in inspiration (P = 0.018, I2 index = 56.8%), ATI and FEV1%pred in inspiration (P < 0.001, I2 index = 96.8%), WT and FEV1/FVC in inspiration (P < 0.001, I2 index = 96.1%), AI and FEV1%pred in inspiration (P < 0.001, I2 index = 90.7%), and AI and FEV1/FVC in inspiration (P = 0.031, I2 index = 71.1%). Because heterogeneity was high, a sensitivity analysis was conducted to explore the sources of the heterogeneity. Finally, we found that Yamashiro's (41) study was the main source of heterogeneity mainly because this study when measuring the thickness of the bronchial wall only the third, fourth, and fifth layers of the right bronchus were selected. The result obtained is not the average value of the bilateral bronchus which may cause selection bias. After excluding Yamashiro's study, the heterogeneity became significantly lower than before. Such as, WA% and FEV1%pred in inspiration (P = 0.057, I2 index = 48.9%). Then, we found that Washko's (35) study was also the main source of heterogeneity because subjects with GOLD 3 and 4 diseases were pooled into one group (GOLD 3&4) due to limited numbers of subjects with GOLD stage 4 disease which may cause selection bias. After excluding Washko's study, the heterogeneity became significantly lower than before. AI and FEV1%pred in inspiration (P = 0.203, I2 index = 37.3%), and AI and FEV1/FVC in inspiration (P = 0.376, I2 index = 0.0%). Because there are only two studies between ATI and FEV1/FVC in inspiration, the heterogeneity is still high. This needs to include more study to explore the source of heterogeneity.
Synthesis of results in the meta-analysis
A total of 6,341 participants were included in the meta-analysis (Figure 4). The CC between %LAA-950 and FEV1%pred in inspiration was reported in 35 articles (10, 14, 15, 20, 21, 26, 28, 32, 37–39, 41–60, 61–64). Two National Lung Screening Test (NLST) cohort studies (35, 44) and two Korean Obstruction Lung Disease (KOLD) cohort studies (26, 58) have been performed. The pooled CC between %LAA-950 and FEV1%pred was −0.49 (−0.52, −0.47), −0.56 (−0.60, −0.51) in inspiration and expiration (10, 14, 15, 26, 51, 55, 56, 62, 65), respectively. The pooled CC between %LAA-950 and FEV1/FVC was −0.61 (−0.63, −0.58), −0.67 (−0.73, −0.61) in inspiration (10, 14, 15, 20, 21, 28, 32, 37, 39, 44, 46, 47, 49, 52, 53, 56–58, 61–64, 66–69) and expiration (10, 14, 15, 56, 62, 70), respectively. The pooled CC between %LAA < 950 and FEV1%pred was −0.50 (−0.57, −0.43), −0.62 (−0.66, −0.57) in inspiration (14, 15, 20, 21, 24, 29, 30, 48, 71, 72) and expiration (10, 14, 15, 21, 24, 31, 57, 73, 74), respectively. The pooled CC between %LAA < 950 and FEV1/FVC was −0.61 (−0.67, −0.55), −0.66 (−0.70, −0.62) in inspiration (14, 16, 20, 21, 24, 30, 48, 72, 75–77) and expiration (10, 14, 15, 21, 31, 57, 70, 75, 76, 78), respectively.
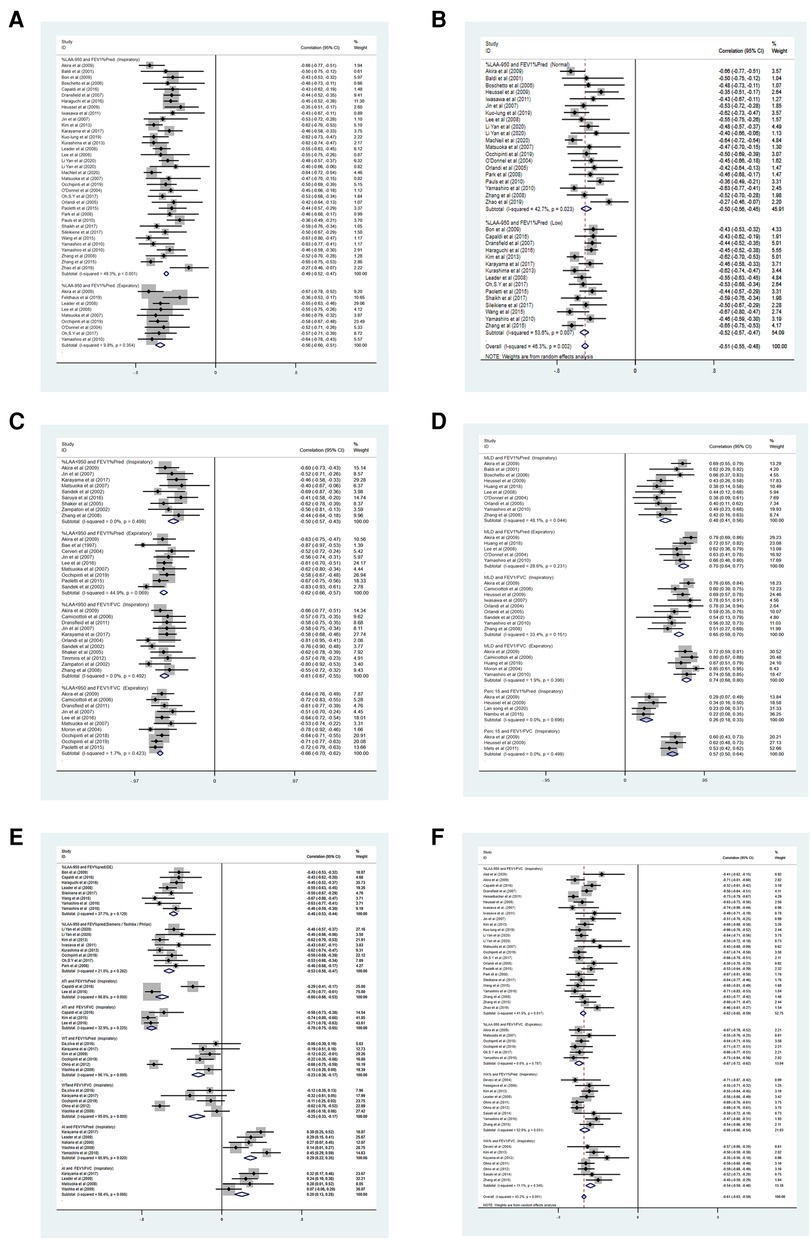
Figure 4. (A–F) Forest plots for correlations between CT measurements and airflow obstruction. CCI, confidence interval; P(Z) = P value of Z test; FEV1%pred, percentage of the predicted forced expiratory volume in the first second.
Twelve articles (25–27, 34, 36, 38, 39, 51, 62, 63, 79, 80) reported CCs between WA% and lung function tests in inspiration. Two articles (26, 38) were excluded because the airway measurements only involved the airway above the fifth generation. Therefore, a total of 10 articles were included (25, 27, 34, 36, 39, 51, 62, 63, 79, 80). In the included literature, the average lumen diameter of the peripheral airway was about 2–3 mm. The pooled CC value between WA% and FEV1%pred was −0.59 (95% CI: −0.63, −0.56), between WA% and FEV1/FVC was −0.53 (95% CI: −0.58, −0.48) in inspiration. Expiratory CT was not used for airway measurements.
The CC between MLD and FEV1%pred was reported in fifteen articles (14, 16, 20, 23, 24, 26, 28, 42, 43, 46, 55, 62, 75, 78, 81). The pooled CC between MLD and FEV1%pred was 0.48 (0.41, 0.56), 0.70 (0.64, 0.77) in inspiration (14, 20, 26, 28, 42, 43, 46, 55, 62, 81) and expiration (14, 26, 55, 62, 81), respectively. The pooled CC between MLD and FEV1/FVC was 0.65 (0.59, 0.70), 0.74 (0.68, 0.80) in inspiration (14, 16, 20, 23, 24, 28, 46, 62, 75) and expiration (14, 62, 75, 78, 81), respectively.
Only three studies (31–33) were analyzed according to strict criteria for inclusion, we determined that the pooled CC between ATI and FEV1/FVC was −0.70 (95% CI: −0.75, −0.65) in inspiration.
Five articles (14, 40, 46, 82, 83) reported CCs between Perc15 and FEV1%pred in inspiration; however, Perc15 and FEV1/FVC only had three groups of data.The pooled CC between AI and FEV1%pred was 0.26 (95% CI: 0.18, 0.33) in inspiration, and the pooled CC of AI and FEV1/FVC was 0.57 (95% CI: 0.50, 0.64) in inspiration.
Eight articles (32, 37, 38, 41, 45, 51, 61, 62) reported CCs between LAA-950 and FEV1%pred using GE in inspiration. Eight articles (10, 39, 50, 52, 53, 56, 58) reported CCs between LAA-950 and FEV1%pred using other brands of CT machines (such as Siemens, Toshiba, and Philips) in inspiration. The pooled CC between LAA-950 and FEV1%pred using GE was −0.50 (95% CI: −0.56, −0.45) and −0.54 (95% CI: −0.60, −0.49) between LAA-950 and FEV1%pred using other brands of CT machines.
Subgroup analysis
We performed a subgroup analysis, depending on the densitometric thresholds (29). At <−950 HU (between −856 and −950 HU) thresholds, the pooled CC was −0.50 (95% CI: −0.57, −0.43). At thresholds of −950 HU, the pooled CC was −0.49 (95% CI: −0.52, −0.47). Similarly, a subgroup analysis was performed for for radiation dose was performed for the association between %LAA-950 and FEV1%pred in inspiration, indicating no significant difference (P = 0.4494). In normal dose, the pooled CC was −0.50 (95% CI: −0.56, −0.45). In low dose, the pooled CC was −0.52 (95% CI: −0.57, −0.47). Subgroup analysis was performed for inspiratory and expiratory CT. Compared with inspiratory CT, expiratory CT %LAA-950 showed a stronger negative correlation with FEV1%pred and FEV1/FVC (P < 0.05), MLD and FEV1%pred showed a stronger positive correlation (P < 0.001), FEV1/FVC also shows the same trend. In addition, subgroup analyses were also performed based on the brands of CT machines. The pooled CC was −0.50 (95% CI: −0.56, −0.45) in the first group (GE) and −0.54 (95% CI: −0.60, −0.49) in the second group (Siemens, Toshiba, and Philips), showing that there was no significant difference between %LAA-950 and FEV1%pred according to CT machine (P = 0.882).
Discussion
In the current study, we conducted a systematical review and meta-analysis to determine the relationship between quantitative CT parameters and airflow obstruction in patients with COPD. The result of this meta-analysis suggested that there were correlations between CT measurements and airflow obstruction parameters in PFTs in patients with COPD, both in inspiratory and expiratory CT. In the included studies, the absolute CCs of CT measurements and airflow limitation were as follows: inspiratory CT, 0.44 to 0.71 and expiratory CT, 0.59 to 0.66. These results were consistent with other studies that have revealed that expiratory CT can be used as an auxiliary examination for inspiratory CT (14, 46, 84, 85). This reconfirmed our hypothesis that there was a significant correlation between the proportion of emphysema, WA%, MLD, AI, Perc15, ATI, WT, and lung function in patients with COPD. Therefore, this approach generates reproducible and sensitive measurements of COPD that are related to pulmonary ventilation and perfusion as well as the anatomical and morphological features of the airway wall and parenchyma (86).
Pulmonary function is the main objective test for determining airflow limitation. FEV1/FVC can detect mild airflow obstruction, which is beneficial for early detection and treatment of patients with COPD. However, lung function does not provide information on regional dysfunction. With the widespread use of quantitative CT and the continuous improvement of corresponding software, lung structure and function abnormalities can be regionally identified and measured. %LAA-950 and MLD can reflect the extent of damage to the lung parenchyma. Meanwhile, it can be used to measure the thickness of the bronchial wall to assess the degree of airflow obstruction. Thus, quantitative CT is a morphologica method for identifying morphological information regarding the degree of airway stenosis and the proportion of emphysema, which are complementary to lung function.
This systematic review included ≥ 10 different CT measurements. However, because of the insufficient number of studies, only 7 items (%LAA-950, %LAA < 950 MLD, WA%, Perc15, AI, ATI, and WT) were used in the meta-analysis. We also evaluated FEV1/FVC and FEV1%pred from PFTs because these are important factors associated with the diagnosis of COPD and the classification of airflow limitation. Furthermore, the above two parameters were relatively comprehensive and easy to extract.
We performed a subgroup analysis based on different respiratory processes (including inspiratory and expiratory processes). Our results demonstrated that CT measurements in expiratory were more strongly correlated with FEV1%pred and FEV1/FVC than inspiratory. This was consistent with other findings that have suggested that CT measurements in expiratory are more strongly correlated with airflow limitation than in inspiratory (55, 87, 88). However, the significance of expiratory CT data for the assessment of COPD still requires additional data for further study. Further, we also performed a subgroup analysis according to the brand of CT machines, and the results indicated that %LAA-950 was correlated with lung function regardless of the brand of CT machine, which was consistent with previous studies by imaging experts (19). Meanwhile, our results showed that %LAA ≤ −950 HU (between −856 and −950 HU) were more strongly correlated with FEV1%pred than %LAA-950 HU in expiratory. This was consistent with other findings that have suggested that the selected CT parameters (between −856 HU and −950 HU), software programs, reconstruction algorithms, and section thickness vary widely throughout the process (19). While the prolonged examination time also reminded us to perform adequate breathing training for patients before the CT examination. Also, Our study suggested low radiation doses did not change correlations between CT emphysema quantification and airflow obstruction compared to normal doses. Low-dose CT can decrease the overall radiation dose for CT quantitative emphysema evaluation without loss in diagnostic value. Quantitative CT indicators provide support for thoracic surgeons and interventional pulmonologists to select patients and optimize LVR procedures, as well as to develop new endobronchial therapies to further improve outcomes in patients with reduced lung volume (13).
Some researchers have studied the third to fifth or sixth generation airways and found that the correlation between airway wall measurements and PFTs was stronger in the smallest airways (19, 41, 43). To reduce the deviation caused by different airway generations, we unified ≥5th generation airways and included them in the meta-analysis. From our results, the correlation between WA% and FEV1%pred was −0.59. Based on the above results, the airway WT measurement from CT was more reliable in the smallest airway.
Although some previous meta-analyses (15, 16, 55, 85) have evaluated the relationship between quantitative CT and lung function in patients with COPD, the current meta-analyses reconfirmed these findings and had multiple advantages. First of all, this meta-analysis had a large sample size, which made our results more reliable. Second, all included studies had more quantitative CT parameters, such as WT, Prec15 and AI. Subgroup analyses were also performed according to the densitometric thresholds (%LAA-950 HU, −910 HU, and −900 HU) and the brands of CT machines. These comparisons have often been overlooked in previous studies, and we found that there are many brands of CT machines (such as GE, Siemens, Toshiba and Philips). Therefore, it is necessary to conduct subgroup analyses to determine if brands of CT machines impact the results. Third, the results of most studies were highly consistent. After sensitivity analysis and publication bias analysis, the source of heterogeneity has been found, which provides ideas for future experimental designs. Fourth, our results enriched and validated the previous conclusions.
Meanwhile, this meta-analysis inevitably had some limitations. First, the results of this study may be influenced by age, race, and the male-female ratio. Additionally, the severity of the disease varied among participants in the included studies. Second, a variety of quantitative CT parameters and PFTs parameters were extracted for systematic evaluation but only representative parameters with complete data were selected for the meta-analysis. Measurements that were not included may be valuable for the evaluation of COPD, and these measurements require further research. Above all, the interval time between lung function and quantitative CT was inconsistent, and this may have impacted the measurements of quantitative CT parameters. In addition, we used different brands of post-processing software, work stations that we did not examine in more details because their impact was considered less relevant (19). This study just conducted a subgroup analysis according to the brands of CT machines, and the results showed that quantitative CT parameters were correlated with lung function regardless of the brands of CT machines. Thus, this systematic review was based on studies of high methodological quality, and there was no publication bias; therefore, the results have a certain strength of argumentation.
Conclusions
Results from this study provided evidence that quantitative CT parameters are significantly correlated with lung function in patients with COPD. Quantitative CT may provide a morphological approach for accurate and early diagnosis of COPD and testing new interventions and therapies for patients with COPD.
Data availability statement
The original contributions presented in the study are included in the article/Supplementary Material, further inquiries can be directed to the corresponding author.
Author contributions
YW and JW conceived and designed the paper. YW was responsible for all data gathering, extraction, and analysis. JW and QZ were the primary independent reviewers, with bias and quality of data extraction reviewed by QW, LC, YQ, JL, DY NS. ML was responsible for the research protocol, the third reviewer of the data abstract, the supervision of the data abstract, the preparation of the manuscript, and the submission for publication. All authors contributed to the article and approved the submitted version.
Funding
This work was supported by the Natural Science Foundation of China No. 81670051 and No. 81970050 and the Integration of Basic and Clinical Science Project of School of Basic Medical Sciences, Xi'an Jiaotong University (Grant No. YXJLRH2022034).
Acknowledgments
The authors would like to thank all the insiders for participating in the research and for all the time and energy they spent in screening literature and extracting data. The author would also like to thank the Chinese Natural Science Foundation for financial support.
Conflict of interest
The authors declare that the research was conducted in the absence of any commercial or financial relationships that could be construed as a potential conflict of interest.
Publisher's note
All claims expressed in this article are solely those of the authors and do not necessarily represent those of their affiliated organizations, or those of the publisher, the editors and the reviewers. Any product that may be evaluated in this article, or claim that may be made by its manufacturer, is not guaranteed or endorsed by the publisher.
Supplementary material
The Supplementary Material for this article can be found online at: https://www.frontiersin.org/articles/10.3389/fsurg.2022.1066031/full#supplementary-material.
Supplementary Figure S1
Funnel plot about the publication bias for Correlation coefficients between CT measurements and airflow obstruction parameters
Supplementary Figure S2
Trim-fill graph about the publication bias for Correlation coefficients between CT measurements and airflow obstruction parameters
Supplementary Table S1
Electronic supplementary table 1 Literature search strategy. Last search on July 5, 2022
Supplementary Table S2
Characteristics of studies included in the systematic review
Supplementary Table S3
Correlation coefficients between CT measurements and airflow obstruction parameters of pulmonary function test in the systematic review
Supplementary Table S4
Characteristics of studies included in the meta-analysis
Supplementary Table S5
Correlation coefficients between CT measurements and airflow obstruction parameters of pulmonary function test in the meta-analysis
Supplementary Table S6
Assessment of Study Quality, by the Quality Assessment of Diagnostic Accuracy Studies (QUADAS) tool
Supplementary Table S7
Bias analysis in the meta-analysis
Abbreviations
%LAA-950 HU, percentage of lung attenuation area under −950 HU; %LAA < −950 HU, percentage of lung attenuation area between −856 and −950 HU; AI, airway lumen area; ATI, air trapping index; ATS, American thoracic society; CC, correlation coefficient; CI, confidence interval; COPD, chronic obstructive pulmonary disease; CT, computed tomography; ERS, European respiratory society; FEV1%pred, forced expiratory volume in the first second as percentage from predicted; FEV1/FVC, FEV1 divided by the forced volume vital capacity; GOLD, global initiative for chronic Obstructive Lung Disease; HU, hounsfield unit; LV, lung volume; MLD, mean lung density; PFT, pulmonary function test; Prec15, 15 percentile point of lung density; PRISMA, preferred reporting items for systematic reviews and meta-analyses; QUADAS, quality assessment of diagnostic accuracy studies; WA%, wall area percentage; WT, airway wall thickness.
References
1. Wedzicha JE. The heterogeneity of chronic obstructive pulmonary disease. Thorax. (2000) 55:631–2. doi: 10.1136/thorax.55.8.631
2. Regan E, Lynch D, Curran-Everett D, Jeffrey L, Curtis J, Austin J, et al. Clinical and radiologic disease in smokers with Normal spirometry. JAMA Intern Med. (2015) 175(9):1539–49. doi: 10.1001/jamainternmed.2015.2735
3. Vogelmeier CF, Criner GJ, Martinez FJ, Anzueto A, Barnes PJ, Bourbeau J, et al. Global strategy for the diagnosis, management, and prevention of chronic obstructive lung disease 2017 report. GOLD executive summary. Am J Respir Crit Care Med. (2017) 195(5):557–82. doi: 10.1164/rccm.201701-0218PP
4. Le Roux PY, Siva S, Steinfort DP, Callahan J, Eu P, Irving LB, et al. Correlation of 68 Ga ventilation-perfusion PET/CT with pulmonary function test indices for assessing lung function. J Nucl Med. (2015) 56(11):1718–23. doi: 10.2967/jnumed.115.162586
5. Van Dijk W, Tan W, Li P, Guo B, Li S, Benedetti A, et al. Clinical relevance of fixed ratio vs lower limit of Normal of FEV1/FVC in COPD: patient-reported outcomes from the CanCOLD cohort. Ann Fam Med. (2015) 13(1):41–8. doi: 10.1370/afm.1714
6. Güder G, Brenner S, Angermann CE, Ertl G, Held M, Sachs AP, et al. GOLD Or lower limit of Normal definition? A comparison with expert-based diagnosis of chronic obstruction disease in a prospective cohort-study. Respir Res. (2012) 13(1):13. doi: 10.1186/1465-9921-13-13
7. Han MK, Lange P, Anzueto A, Martinez FJ, Jones PW. GOLD COPD categories are not fit for purpose in primary care-author’reply. Lancet Respir Med. (2013) 1(1):e17–18. doi: 10.1016/S2213-2600(13)70016-X
8. Jones PW. Health status and the spiral of decline. COPD. (2009) 6(1):59–63. doi: 10.1080/15412550802587943
9. Herth FJF, Kirby M, Sieren J, Herth J, Schirm J, Wood S, et al. The modern art of Reading computed tomography images of the lungs: quantitative CT. Respiration. (2018) 95(1):8–17. doi: 10.1159/000480435
10. Occhipinti M, Paoletti M, Bartholmai BJ, Rajagopalan S, Karwoski RA, Nardi C. Spirometric assessment of emphysema presence and severity as measured by quantitative CT and CT-based radiomics in COPD. Respir Res. (2019) 20(1):101. doi: 10.1186/s12931-019-1049-3
11. Schroeder JD, McKenzie AS, Zach JA. Relationships between airflow obstruction and quantitative CT measurements of emphysema, air trapping, and airways in subjects with and without chronic obstructive pulmonary disease. AJR Am J Roentgenol. (2013) 201:W460–70. doi: 10.2214/AJR.12.10102
12. Koo HJ, Lee SM, Seo JB, Lee SM, Kim N, Oh SY, et al. Prediction of pulmonary function in patients with chronic obstructive pulmonary disease: correlation with quantitative CT parameters. Korean J Radiol. (2019) 20(4):683–92. doi: 10.3348/kjr.2018.0391
13. Washko GR, Criner GJ, Mohsenifar Z, Sciurba FC, Sharafkhaneh A, Make BJ, et al. Computed tomographic-based quantification of emphysema and correlation to pulmonary function and mechanics. COPD. (2008) 5:177–86. doi: 10.1080/15412550802093025
14. Akira M, Toyokawa K, Inoue Y, Arai T. Quantitative CT in chronic obstructive pulmonary disease: inspiratory and expiratory assessment. AJR Am J Roentgenol. (2009) 192:267–72. doi: 10.2214/AJR.07.3953
15. Matsuoka S, Kurihara Y, Yagihashi K, Nakajima Y. Quantitative assessment of peripheral airway obstruction on paired expiratory/inspiratory thin-section computed tomography in chronic obstructive pulmonary disease with emphysema. J Comput Assist Tomogr. (2007) 31:384–9. doi: 10.1097/01.rct.0000243457.00437.10
16. Orlandi I, Moroni C, Camiciottoli G, Bartolucci M, Belli G, Villari N, et al. Spirometric-gated computed tomography quantitative evaluation of lung emphysema in chronic obstructive pulmonary disease—a comparison of 3 techniques. J Comput Assist Tomogr. (2004) 28:437–42. doi: 10.1097/00004728-200407000-00001
17. Moher D, Liberati A, Tetzlaff J, Altman DG. Preferred reporting items for systematic reviews and meta-analyses: the PRISMA statement. PLoS Med. (2009) 6(7):e1000097. doi: 10.1371/journal.pmed.1000097
18. Whiting PF, Weswood ME, Rutjes AW, Reitsma JB, Bossuyt PN, Kleijnen J. Evaluation of QUADAS, a tool for the quality assessment of diagnostic accuracy studies. BMC Med Res Methodol. (2006) 6:6–9. doi: 10.1186/1471-2288-6-9
19. Crossley D, Renton M, Khan M, Low EV, Turner AM. CT Densitometry in emphysema: a systematic review of its clinical utility. Int J Chron Obstruct Pulmon Dis. (2018) 13:547–63. doi: 10.2147/COPD.S143066
20. Zhang J, Yu TL, Wu Q, Ye N, Cao Y, Zhou N. Quantitative MSCT study of lung attenuation in patients with chronic obstructive pulmonary disease. Chin J Med Imaging Technol. (2008) 24:1611–4. doi: 10.3321/j.issn:1003-3289.2008.10.035
21. Jin LF, Miao JT, Li ZY, Xie XQ, Dai XM. Study of voxel index from multislice CT in evaluating chronic obstructive pulmonary disease air-trapping. Chin J Med Imaging Technol. (2007) 23:1033–6. doi: 10.3321/j.issn:1003-3289.2007.07.025
22. Kim WJ, Silverman EK, Hoffman E, Criner GJ, Mosenifar Z, Sciurba FC, et al. CT Metrics of airway disease and emphysema in severe COPD. Chest. (2009) 136(2):396–404. doi: 10.1378/chest.08-2858
23. Iwasawa T, Takahashi H, Ogura T, Asakura A, Gotoh T, Kagei S, et al. Correlation of lung parenchymal MR signal intensity with pulmonary function tests and quantitative computed tomography (CT) evaluation: a pilot study. J Magn Reson Imaging. (2007) 26(6):1530–6. doi: 10.1002/jmri.21183
24. Sandek K, Bratel T, Lagerstrand L, Rosell H. Relationship between lung function, ventilation-perfusion inequality and extent of emphysema as assessed by high-resolution computed tomography. Respir Med. (2002) 96(11):934–43. doi: 10.1053/rmed.2002.1371
25. Deveci F, Murat A, Turgut T, Altuntas E, Muz MH. Airway wall thickness in patients with COPD and healthy current smokers and healthy non-smokers: assessment with high resolution computed tomographic scanning. Respiration. (2004) 71(6):602–10. doi: 10.1159/000081761
26. Lee YK, Oh YM, Lee JH, Kim EK, Lee JH, Kim N, et al. Quantitative assessment of emphysema, air trapping, and airway thickening on computed tomography. Lung. (2008) 186(3):157–65. doi: 10.1007/s00408-008-9071-0
27. Ohno Y, Koyama H, Yoshikawa T, Matsumoto K, Aoyama N, Onishi Y, et al. Comparison of capability of dynamic O2-enhanced MRI and quantitative thinsection MDCT to assess COPD in smokers. Eur J Radiol. (2011) 81(5):1068–75. doi: 10.1016/j.ejrad.2011.02.004
28. Orlandi I, Moroni C, Camiciottoli G, Bartolucci M, Pistolesi M, Villari N, et al. Chronic obstructive pulmonary disease: thin-section CT measurement of airway wall thickness and lung attenuation. Radiology. (2005) 234(2):604–10. doi: 10.1148/radiol.2342040013
29. Falaschi F, Miniati M, Battolla L, Filippi E, Sostman HD, Laiolo E, et al. [Quantification of pulmonary emphysema with computerized tomography. Comparison with various methods]. Radiol Med. (1995) 90(1–2):16–23. PMID: 75690897569089
30. Shaker SB, Maltbaek N, Brand P, Haeussermann S, Dirksen A. Quantitative computed tomography and aerosol morphometry in COPD and alpha1-antitrypsin deficiency. Eur Respir J. (2005) 25(1):23–30. doi: 10.1183/09031936.04.00075304
31. Lee SM, Seo JB, Lee SM, Kim N, Oh SY, Oh YM. Optimal threshold of subtraction method for quantification of air-trapping on coregistered CT in COPD patients. Eur Radiol. (2016) 26(7):2184–92. doi: 10.1007/s00330-015-4070-z
32. Capaldi DP, Zha N, Guo F, Pike D, McCormack DG, Kirby M, et al. Pulmonary imaging biomarkers of gas trapping and emphysema in COPD: (3)He MR imaging and CT parametric response maps. Radiology. (2016) 279(2):597–608. doi: 10.1148/radiol.2015151484
33. Kim EY, Seo JB, Lee HJ, Kim N, Lee E, Lee SM. Detailed analysis of the density change on chest CT of COPD using non-rigid registration of inspiration /expiration CT scans. Eur Radiol. (2015) 25(2):541–9. doi: 10.1007/s00330-014-3418-0
34. Ohno Y, Koyama H, Yoshikawa T, Matsumoto K, Takahashi M, Van Cauteren M, et al. T2* measurements of 3-T MRI with ultrashort TEs: capabilities of pulmonary function assessment and clinical stage classification in smokers. AJR Am J Roentgenol. (2011) 197(2):W279–85. doi: 10.2214/AJR.10.5350
35. Washko GR, Dransfield MT, Estépar RS, Diaz A, Matsuoka S, Yamashiro T, et al. Airway wall attenuation: a biomarker of airway disease in subjects with COPD. J Appl Physiol. (2009) 107:185–91. doi: 10.1152/japplphysiol.00216.2009
36. Hasegawa M, Nasuhara Y, Onodera Y, Makita H, Nagai K, Fuke S, et al. Airflow limitation and airway dimensions in chronic obstructive pulmonary disease. Am J Respir Crit Care Med. (2006) 173(12):1309–15. doi: 10.1164/rccm.200601-037OC
37. Wang G, Wang L, Ma Z, Zhang C, Deng K. Quantitative emphysema assessment of pulmonary function impairment by computed tomography in chronic obstructive pulmonary disease. J Comput Assist Tomogr. (2015) 39(2):171–5. doi: 10.1097/RCT.0000000000000187
38. Bon JM, Leader JK, Weissfeld JL, Coxson HO, Zheng B, Branch RA, et al. The influence of radiographic phenotype and smoking status on peripheral blood biomarker patterns in chronic obstructive pulmonary disease. PLoS One. (2009) 4:e6865. doi: 10.1371/journal.pone.0006865
39. Kim SS, Seo JB, Lee HY. Chronic obstructive pulmonary disease: lobe-based visual assessment of volumetric CT by using standard images-comparison with quantitative CT and pulmonary function test in the COPD gene study. Radiology. (2013) 266:626–35. doi: 10.1148/radiol.12120385
40. Song L, Leppig JA, Hubner RH, Lassen-Schmidt BC, Neumann K, Theilig DC, et al. Quantitative CT analysis in patients with pulmonary emphysema: do calculated differences between full inspiration and expiration correlate with lung function? Int J Chron Obstruct Pulmon Dis. (2020) 15:1877–86. doi: 10.2147/COPD.S253602
41. Yamashiro T, Matsuoka S, Estépar RS, Dransfield MT, Diaz A, Reilly JJ, et al. Quantitative assessment of bronchial wall attenuation with thin-section CT: an indicator of airflow limitation in chronic obstructive pulmonary disease. Am J Roentgenol. (2010) 195:363–9. doi: 10.2214/AJR.09.3653
42. Baldi S, Miniati M, Bellina CR, Battolla L, Catapano G, Begliomini E, et al. Relationship between extent of pulmonary emphysema by high-resolution computed tomography and lung elastic recoil in patients with chronic obstructive pulmonary disease. Am J Respir Crit Care Med. (2001) 164(4):585–9. doi: 10.1164/ajrccm.164.4.2010066
43. Boschetto P, Quintavalle S, Zeni E, Leprotti S, Potena A, Ballerin L, et al. Association between markers of emphysema and more severe chronic obstructive pulmonary disease. Thorax. (2006) 61(12):1037–42. doi: 10.1136/thx.2006.058321
44. Dransfield MT, Washko GR, Foreman MG, Estepar RSJ, Reilly J, Bailey WC. Gender differences in the severity of CT emphysema in COPD. Chest. (2007) 132:464–70. doi: 10.1378/chest.07-0863
45. Haraguchi M, Nakamura H, Sasaki M, Miyazaki M, Chubachi S, Takahashi S, et al. Determinants of chronic obstructive pulmonary disease severity in the late-elderly differ from those in younger patients. BMC Res Notes. (2016) 9:7. doi: 10.1186/s13104-015-1810-8
46. Heussel CP, Herth FJ, Kappes J, Hantusch R, Hartlieb S, Weinheimer O, et al. Fully automatic quantitative assessment of emphysema in computed tomography: comparison with pulmonary function testing and Normal values. Eur Radiol. (2009) 19(10):2391–402. doi: 10.1007/s00330-009-1437-z
47. Iwasawa T, Takahashi H, Ogura T, Asakura A, Gotoh T, Shibata H, et al. Influence of the distribution of emphysema on diaphragmatic motion in patients with chronic obstructive pulmonary disease. Jpn J Radiol. (2011) 29:256–64. doi: 10.1007/s11604-010-0552-8
48. Karayama M, Inui N, Mori K, Kono M, Hozumi H, Suzuki Y, et al. Respiratory impedance is correlated with morphological changes in the lungs on three-dimensional CT in patients with COPD. Sci Rep. (2017) 8(7):41709. doi: 10.1038/srep41709
49. Lor KL, Liu CP, Chang YC, Yu CJ, Wang CY, Chung MJ, et al. Predictive modelling of lung function using emphysematous density distribution. Sci Rep. (2019) 9(1):19763. doi: 10.1038/s41598-019-56351-9
50. Kurashima K, Hoshi T, Takaku Y, Kanauchi T, Nakamoto K, Ueda M. Changes in the airway lumen and surrounding parenchyma in chronic obstructive pulmonary disease. Int J Chron Obstruct Pulmon Dis. (2013) 8:523–32. doi: 10.2147/COPD.S52637
51. Leader JK, Zheng B, Sciurba FC, Fuhrman CR, Bon JM, Park SC, et al. The relation of airway size to lung function. Proc SPIE Med Imaging. (2008) 6916:691623. doi: 10.1117/12.770886
52. Li Y, Gao J, Guo Y. Application value of CT quantitative technique in patients with different clinical phenotypes of chronic obstructive pulmonary disease. Journal of Clinical Radiology. (2020) 39(6):1090–4. doi: 10.13437/j.cnki.jcr.2020.06.014
53. Li Y, Gao J, Guo Y. Longitudinal changes of CT quantitative indexes and lung function in patients with bronchitis-type and emphysema-type COPD. Journal of Clinical Radiology. (2020) 39(6):1104–7. doi: 10.13437/j.cnki.jcr.2020.06.017
54. MacNeil JL, Capaldi DPI, Westcott AR, Eddy RL, Barker AL, McCormack DG, et al. Pulmonary imaging phenotypes of chronic obstructive pulmonary disease using multiparametric response maps. Radiology. (2020) 295(1):227–36. doi: 10.1148/radiol.2020191735
55. O'Donnell RA, Peebles C, Ward JA, Daraker A, Angco G, Broberg P. Relationship between peripheral airway dysfunction, airway obstruction, and neutrophilic inflammation in COPD. Thorax. (2004) 59(10):837–42. doi: 10.1136/thx.2003.019349
56. Oh SY, Lee M, Seo JB, Kim N, Lee SM, Lee JS. Size variation and collapse of emphysema holes at inspiration and expiration CT scan: evaluation with modified length scale method and image co-registration. Int J Chron Obstruct Pulmon Dis. (2017) 13(12):2043–57. doi: 10.2147/COPD.S130081
57. Paoletti M, Cestelli L, Bigazzi F, Camiciottoli G, Pistolesi M. Chronic obstructive pulmonary disease: pulmonary function and CT lung attenuation do not show linear correlation. Radiology. (2015) 276(2):571–8. doi: 10.1148/radiol.2015141769
58. Park YS, Seo JB, Kim N, Chae EJ, Oh YM, Lee SD, et al. Texture-based quantification of pulmonary emphysema on high-resolution computed tomography: comparison with density-based quantification and correlation with pulmonary function test. Invest Radiol. (2008) 43:395–402. doi: 10.1097/RLI.0b013e31816901c7
59. Pauls S, Gulkin D, Feuerlein S, Muche R, Krüger S, Schmidt SA, et al. Assessment of COPD severity by computed tomography: correlation with lung functional testing. Clin Imaging. (2010) 34:172–8. doi: 10.1016/j.clinimag.2009.05.004
60. Shaikh M, Sood RG, Sarkar M, Thakur V. Quantitative computed tomography (CT) assessment of emphysema in patients with severe chronic obstructive pulmonary disease (COPD) and its correlation with age, sex, pulmonary function tests, BMI, smoking, and biomass exposure. Pol J Radiol. (2017) 82:760–6. doi: 10.12659/PJR.903278
61. Sileikiene V, Urbonas M, Mataciunas M, Norkuniene J. Relationships between pulmonary function test parameters and quantitative computed tomography measurements of emphysema in subjects with chronic obstructive pulmonary disease. Acta medica Lituanica. (2017) 24(4):209–18. doi: 10.6001/actamedica.v24i4.3616
62. Yamashiro T, Matsuoka S, Bartholmai BJ, San José Estépar R, Ross JC, Diaz A, et al. Collapsibility of lung volume by paired inspiratory and expiratory CT scans. Correlations with lung function and mean lung density. Acad Radiol. (2010) 17:489–95. doi: 10.1016/j.acra.2009.11.004
63. Zhang Y, Tu YH, Fei GH. The COPD assessment test correlates well with the computed tomography measurements in COPD patients in China. Int J Chron Obstruct Pulmon Dis. (2015) 10:507–14. doi: 10.2147/COPD.S77257
64. Zhao F, Wang L, Zhu Y, Li J, Guo Y, Huang X. Application of biphasic registration of quantitative CT in imaging phenotype of chronic obstructive pulmonary disease. Chinese Journal of Medical Imaging. (2019) 27(11):829–33. doi: 10.3969/j.issn.1005-5185.2019.11.008
65. Feldhaus FW, Theilig DC, Hubner RH, Kuhnigk JM, Neumann K, Doellinger F. Quantitative CT analysis in patients with pulmonary emphysema: is lung function influenced by concomitant unspecific pulmonary fibrosis? Int J Chron Obstruct Pulmon Dis. (2019) 14:1583–93. doi: 10.2147/COPD.S204007
66. Abd elsalam SM, Hafez M, Mohmrd MF, Said AH. Correlation between quantitative multi-detector computed tomography lung analysis and pulmonary function tests in chronic obstructive pulmonary disease patients. Egypt J Radiol Nucl Med. (2020) 51(1):160–68. doi: 10.1186/s43055-020-00281-4
67. Doganay O, Matin T, Chen M, Kim M, McIntyre A, McGowan DR, et al. Time-series hyperpolarized xenon-129 MRI of lobar lung ventilation of COPD in comparison to V/Q-SPECT/CT and CT. Eur Radiol. (2019) 29(8):4058–67. doi: 10.1007/s00330-018-5888-y
68. Hesselbacher SE, Ross R, Schabath MB, Smith EO, Perusich S, Barrow N, et al. Cross-sectional analysis of the utility of pulmonary function tests in predicting emphysema in ever-smokers. Int J Environ Res Public Health. (2011) 8:1324–40. doi: 10.3390/ijerph8051324
69. Iwasawa T, Takahashi H, Ogura T, Asakura A, Gotoh T, Shibata H, et al. Influence of the distribution of emphysema on diaphragmatic motion in patients with chronic obstructive pulmonary disease. Jpn J Radiol. (2011) 29(4):256–64. doi: 10.1007/s11604-010-0552-8
70. Occhipinti M, Paoletti M, Bigazzi F, Camiciottoli G, Inchingolo R, Larici AR. Emphysematous and non emphysematous gas trapping in chronic obstructive pulmonary disease: quantitative CT findings and pulmonary function. Radiology. (2018) 287(2):683–92. doi: 10.1148/radiol.2017171519
71. Saruya S, Matsuoka S, Yamashiro T, Matsushita S, Fujikawa A, Yagihashi K. Quantitative CT measurements of small pulmonary vessels in chronic obstructive pulmonary disease: do they change on follow-up scans. Clin Physiol Funct Imaging. (2016) 36(3):211–7. doi: 10.1111/cpf.12215
72. Zompatori M, Fasano L, Mazzoli M, Sciascia N, Cavina M, Pacilli AM, et al. Spiral CT evaluation of pulmonary emphysema using a low-dose technique. Radiol Med. (2002) 104(1–2):13–24. doi: 10.1016/S2589-7500(21)00146-1
73. Bae KT, Slone RM, Gierada DS, Yusen RD, Cooper JD. Patients with emphysema: quantitative CT analysis before and after lung volume reduction surgery. Work in progress. Radiology. (1997) 203(3):705–14. doi: 10.1148/radiology.203.3.9169692
74. Cerveri I, Dore R, Corsico A, Zoia MC, Pellegrino R, Brusasco V, et al. Assessment of emphysema in COPD: a functional and radiologic study. Chest. (2004) 125(5):1714–8. doi: 10.1378/chest.125.5.1714
75. Camiciottoli G, Bartolucci M, Maluccio NM, Moroni C, Mascalchi M, Giuntini C. Spirometrically gated high-resolution CT findings in COPD: lung attenuation vs lung function and dyspnea severity. Chest. (2006) 129(3):558–64. doi: 10.1378/chest.129.3.558
76. Dransfield MT, Huang F, Nath H, Singh SP, Bailey WC, Washko GR. CT Emphysema predicts thoracic aortic calcification in smokers with and without COPD. COPD. (2010) 7(6):404–10. doi: 10.3109/15412555.2010.528085
77. Timmins SC, Diba C, Farrow CE, Schoeffel RE, Berend N, Salome CM, et al. The relationship between airflow obstruction, emphysema extent, and small airways function in COPD. Chest. (2012) 142(2):312–9. doi: 10.1378/chest.11-2169
78. Moron K, Liebhart J, Liebhart E, Ciesielska A, Badowski R. Structural and functional lung changes in patients with COPD and asthma-the benefit of quantitative HRCT assessment. Adv Clin Exp Med. (2004) 13:59–66.
79. Sasaki T, Takahashi K, Takada N, Ohsaki Y. Ratios of peripheral-to-central airway lumen area and percentage wall area as predictors of severity of chronic obstructive pulmonary disease. AJR Am J Roentgenol. (2014) 203:78–84. doi: 10.2214/AJR.13.11748
80. Koyama H, Ohno Y, Yamazaki Y, Onishi Y, Takenaka D, Yoshikawa T, et al. Quantitative bronchial luminal volumetric assessment of pulmonary function loss by thin-section MDCT in pulmonary emphysema patients. Eur J Radiol. (2012) 81(2):384–8. doi: 10.1016/j.ejrad.2010.12.042
81. Huang XQ, Bai LJ, Shen C, Ding H, Liu M, Wang JG, et al. Correlation between mean lung density and lung function test in patients with chronic obstructive pulmonary disease by dual phase CT. J Xi'an Jiaotong Univ. (2019) 40(2):178–81. doi: 10.7652/jdyxb201902002
82. Nambu A, Zach J, Schroeder J, Jin GY, Kim SS, Kim YI, et al. Relationships between diffusing capacity for carbon monoxide (DLCO), and quantitative computed tomography measurements and visual assessment for chronic obstructive pulmonary disease. Eur J Radiol. (2015) 84(5):980–5. doi: 10.1016/j.ejrad.2015.01.010
83. Mets OM, Murphy K, Zanen P, Gietema HA, Lammers JW, van Ginneken B, et al. The relationship between lung function impairment and quantitative computed tomography in chronic obstructive pulmonary disease. Eur Radiol. (2012) 22(1):120–8. doi: 10.1007/s00330-011-2237-9
84. Matsuoka S, Kurihara Y, Yagihashi K, Hoshino M, Nakajima Y. Airway dimensions at inspiratory and expiratory multisection CT in chronic obstructive pulmonary disease: correlation with airflow limitation. Radiology. (2008) 248(3):1042–9. doi: 10.1148/radiol.2491071650
85. Xie X, de Jong PA, Oudkerk M, Wang Y, Ten Hacken NH, Miao J, et al. Morphological measurements in computed tomography correlate with airflow obstruction in chronic obstructive pulmonary disease: systematic review and meta-analysis. Eur Radiol. (2012) 22:2085–93. doi: 10.1007/s00330-012-2480-8
86. Hwang HJ, Seo JB, Lee SM, Kim N, Oh SY, Lee JS, et al. Assessment of regional xenon ventilation, perfusion, and ventilation-perfusion mismatch using dual-energy computed tomography in chronic obstructive pulmonary disease patients. Invest Radiol. (2016) 51(5):306–15. doi: 10.1097/RLI.0000000000000239
87. Zaporozhan J, Ley S, Eberhardt R, Weinheimer O, Iliyushenko S, Herth F. Paired inspiratory/expiratory volumetric thin-slice CT scan for emphysema analysis: comparison of different quantitative evaluations and pulmonary function test. Chest. (2005) 128(5):3212–20. doi: 10.1378/chest.128.5.3212
Keywords: airway obstruction, systematic review, meta-analysis, quantitative CT, COPD
Citation: Wang Y, Chai L, Chen Y, Liu J, Wang Q, Zhang Q, Qiu Y, Li D, Chen H, Shen N, Shi X, Wang J, Xie X and Li M (2023) Quantitative CT parameters correlate with lung function in chronic obstructive pulmonary disease: A systematic review and meta-analysis. Front. Surg. 9:1066031. doi: 10.3389/fsurg.2022.1066031
Received: 10 October 2022; Accepted: 14 November 2022;
Published: 4 January 2023.
Edited by:
Jiaxi He, First Affiliated Hospital of Guangzhou Medical University, ChinaReviewed by:
Jianrong Zhang, The University of Melbourne, AustraliaGulser Caliskan, University of Verona, Italy
Mizuho Nishio, Kyoto University, Japan
© 2023 Wang, Chai, Chen, Liu, Wang, Zhang, Qiu, Li, Chen, Shen, Shi, Wang, Xie and Li. This is an open-access article distributed under the terms of the Creative Commons Attribution License (CC BY). The use, distribution or reproduction in other forums is permitted, provided the original author(s) and the copyright owner(s) are credited and that the original publication in this journal is cited, in accordance with accepted academic practice. No use, distribution or reproduction is permitted which does not comply with these terms.
*Correspondence: Manxiang Li manxiangli@hotmail.com
Specialty Section: This article was submitted to Thoracic Surgery, a section of the journal Frontiers in Surgery