
95% of researchers rate our articles as excellent or good
Learn more about the work of our research integrity team to safeguard the quality of each article we publish.
Find out more
ORIGINAL RESEARCH article
Front. Surg. , 06 January 2023
Sec. Orthopedic Surgery
Volume 9 - 2022 | https://doi.org/10.3389/fsurg.2022.1047603
This article is part of the Research Topic Clinical Application of Medical Imaging for Functional Evaluation in Orthopaedics View all 21 articles
 Gaoxiang Xu1,2,3,†
 Daofeng Wang1,2,3,†
 Hao Zhang2,3,†Cheng Xu2,3Hua Li2,3
 Wupeng Zhang2,3,4
 Jiantao Li2,3*
 Licheng Zhang2,3*
 Peifu Tang2,3*
Background: Utilizing dual-energy x-ray absorptiometry (DXA) to assess bone mineral density (BMD) was not routine in many clinical scenarios, leading to missed diagnoses of osteoporosis. The objective of this study is to obtain effective parameters from hip computer tomography (CT) to screen patients with osteoporosis and predict their clinical outcomes.
Methods: A total of 375 patients with hip CT scans for intertrochanteric fracture were included. Among them, 56 patients possessed the data of both hip CT scans and DXA and were settled as a training group. The cortical bone thickness (CTh) and Hounsfield unit (HU) values were abstracted from 31 regions of interest (ROIs) of the proximal femur. In the training group, the correlations between these parameters and BMD were investigated, and their diagnostic efficiency of osteoporosis was assessed. Finally, 375 patients were divided into osteoporotic and nonosteoporotic groups based on the optimal cut-off values, and the clinical difference between subgroups was evaluated.
Results: The CTh value of ROI 21 and the HU value of ROI 14 were moderately correlated with the hip BMD [r = 0.475 and 0.445 (p < 0.001), respectively]. The best diagnostic effect could be obtained by defining osteoporosis as CTh value < 3.19 mm in ROI 21 or HU value < 424.97 HU in ROI 14, with accuracies of 0.821 and 0.883, sensitivities of 84% and 76%, and specificities of 71% and 87%, respectively. The clinical outcome of the nonosteoporotic group was better than that of the osteoporotic group regardless of the division criteria.
Conclusion: The CTh and HU values of specific cortex sites in the proximal femur were positively correlated with BMD of DXA at the hip. Thresholds for osteoporosis based on CTh and HU values could be utilized to screen osteoporosis and predict clinical outcomes.
Osteoporosis, an age-related illness marked by reduced bone mineral density (BMD) and microarchitectural deterioration, could lead to a series of osteoporotic fractures (1). In the global population over 50 years old, 33% of women and 20% of men would encounter one or more osteoporotic fractures (2). The mortality rate within 1 year was as high as 20%, and the permanent disability rate was as high as 50% (3). Meanwhile, due to reduced bone strength, the incidence of postoperative complications of osteoporotic fractures was significantly higher than that of nonosteoporotic fractures (4, 5). These cost the China healthcare system approximately 18.9 billion dollars annually (6). Thus, an early screening of osteoporosis would be advantageous to allocate considerable resources for preventing osteoporotic fractures and postoperative complications without exceeding those incurred following these problems (7).
Dual-energy x-ray absorptiometry (DXA) and quantitative computed tomography (QCT) have been applied to identify osteoporosis as the gold standard (8). BMD assessed in exact areas of the hip or lumbar spine was commonly utilized to evaluate bone health and fracture risk (9). However, the lack of both tests in primary medical institutions, the untimely examination of patients in senior medical institutions, and the additional medical costs resulting from routine examination make many patients easily missed. Therefore, how to apply the existing imaging data to screen osteoporosis to avoid the occurrence of osteoporotic fractures and postoperative complications has attracted high attention of researchers.
Cortical thickness could be more easily acquired in routine orthopedic radiographic examinations, and this value in the proximal femur has been proven to be correlated with BMD and of ability to predict osteoporosis (10). However, which part of the proximal femur possessed the highest predictive value had been seldom discussed. Additionally, the correlation between HU values of the cortex and BMD was unclear. In addition, no study has explored the correlation between these parameters and clinical outcomes.
Thus, we attracted cortical bone thickness (CTh) and Hounsfield unit (HU) values from the cortical bone in hip computed tomography (CT) to evaluate the correlation between these parameters and BMD. This study aimed to (1) investigate the correlation between the anatomical parameters of cortical bone and BMD assessed with DXA scans; (2) calculate the sensitivity, specificity, and area under the curve (AUC) of the parameters with higher correlation to predict osteoporosis; and (3) evaluate the clinical differences between osteoporotic and nonosteoporotic patients with intertrochanteric fractures divided by the cut-off values with optimal diagnostic efficiency.
Nine hundred and sixty-three patients with intertrochanteric fractures were admitted to our hospital from September 2009 to March 2017. According to the inclusion and exclusion process shown in Figure 1, 375 patients were included for clinical evaluation. Among them, 56 patients that had received CT scans from a CT machine (Siemens AG, Erlangen, Germany) and a contemporary DXA (with a Hologic Discovery system) at the unaffected hip and lumber spine at our institution within 1 month were identified for the calculation of correlation between BMD and anatomical parameters and the diagnosis efficiency of osteoporosis. This study was approved by the institutional review board (S2020-114-01).
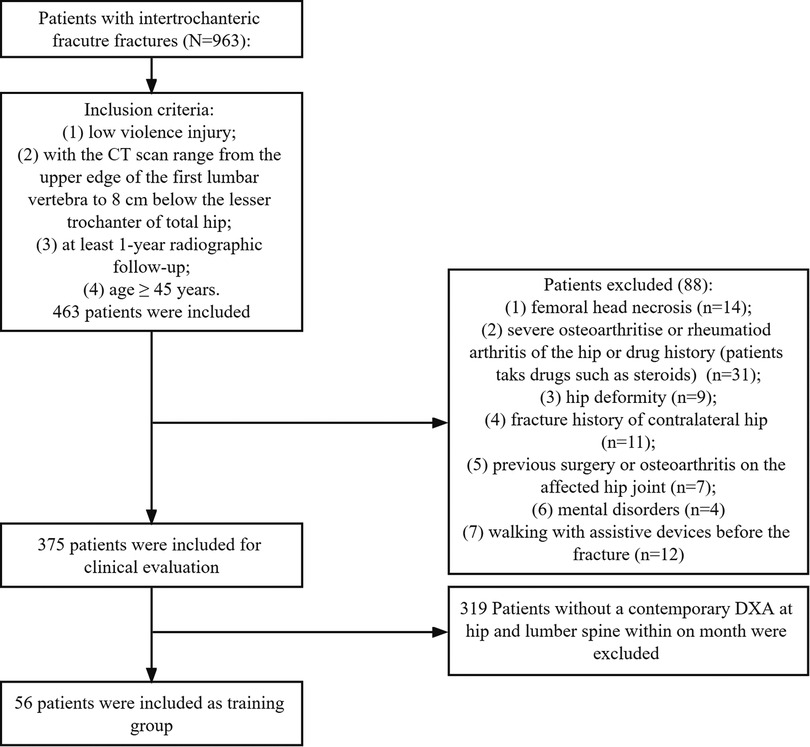
Figure 1. Flow chart of the inclusion and exclusion process.
Patient hip CT data in the Digital Imaging and Communications in Medicine (DICOM) format were imported in Mimics 20.0 (Materialise, Belgium), and bone tissue was separated by the threshold value of 0–350 HU displaying the outline of bone clearly. Then, according to our previous study (11), 31 regions of interest (ROIs) that best reflect the stress distribution pattern in the proximal femur were defined to abstract the CTh and HU values of cortical bone.
The bottom and subcephalic sites of the femoral neck were determined using the method described by Sparks et al.(12) and Zhang et al. (13). Furthermore, the middle site of the femoral neck was determined. Then, Sections 1–3 at the above sites perpendicular to the femoral neck axis were established (Figure 2). According to the method of our previous study (11), the ROIs of upper, lower, anterior, and posterior cortical bone in each section were determined as follows: the longest line between the upper and lower walls (purple line) and the longest line between the anterior and posterior walls (green line) were drawn and intersected with cortical bone, resulting in the intersections regarded as the ROIs 1–12 of cortical bone in each section of the femoral neck to extract CTh and HU values (Figures 3A–C). Then, the relevance between BMD and these parameters was analyzed.
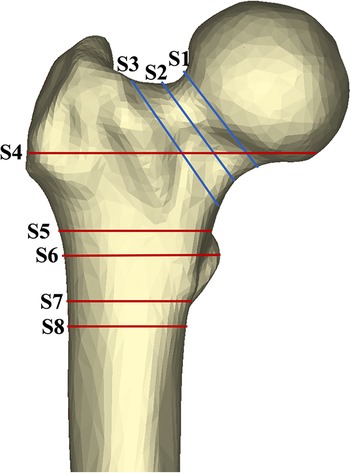
Figure 2. Area of exploration in proximal femoral region. The femoral neck was divided by axial S1–3 (sections at the subcephalic, middle, and bottom sites of the femoral neck, respectively). Similarly, the shaft region was divided by S4–8 (sections at 20 mm above the upper edge of the femoral lesser trochanter, the upper edge of the femoral lesser trochanter, the vertex of the femoral lesser trochanter, the lower edge of the femoral lesser trochanter, and the 20 mm below the vertex of the femoral lesser trochanter, respectively).
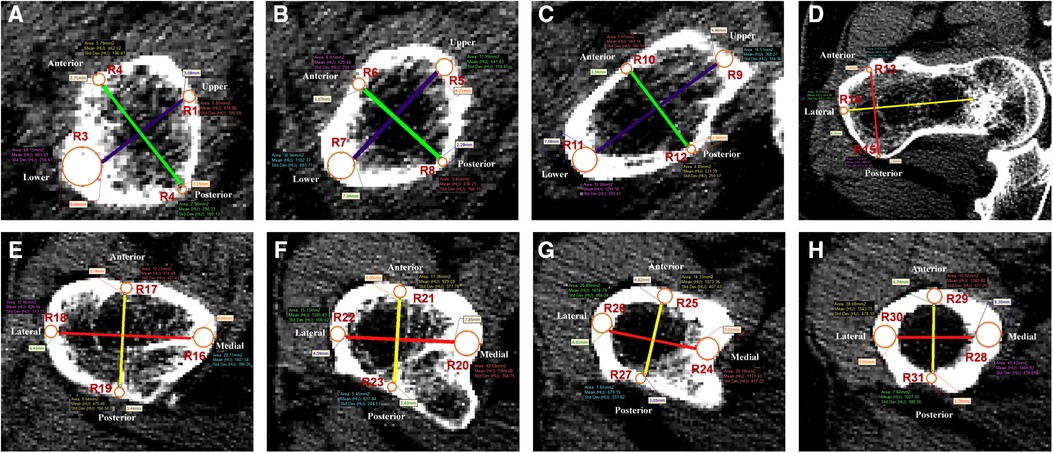
Figure 3. Thirty-one regions of interest were defined in the femoral neck and shaft regions. (A–C) Femoral neck region. Purple line was the longest diameter between the upper and lower walls of femoral neck. Green line was the longest diameter between the anterior and posterior walls of femoral neck. R1–12 were defined as the measurement points of S1–3. (D–H) Femoral shaft region. Red line was the longest diameter between the medial and lateral walls of the femoral shaft. Yellow line was the longest diameter between the anterior and posterior walls of the femoral shaft. R13–31 were defined as the measurement points of S4–8.
By the method described by Zhang et al. (14), five sections perpendicular to the femoral shaft axis were determined: S4 at 20 mm above the upper edge of the femoral lesser trochanter, S5 at the upper edge of the femoral lesser trochanter, S6 at the vertex of the femoral lesser trochanter, S7 at the lower edge of the femoral lesser trochanter, and S8 at the 20 mm below the vertex of the femoral lesser trochanter (Figure 2). According to the method of our previous study (11), in each section, the longest line (red line) between the medial and lateral walls and the longest line (yellow line) between the anterior and posterior walls were drawn to determine the ROIs 13–31 in each section of the femoral shaft to extract CTh and HU values (Figures 3D–H). Since it intersected with the femoral head, the medial wall of S4 was excluded.
BMD values of the lumbar spine (L1–4) and healthy hip sites were measured by a DXA scanner. According to the World Health Organization criteria: a patient with T-value at any region less than −2.5 was diagnosed with osteoporosis. Then, the sensitivity, specificity, positive predictive value, and negative predictive value of CTh and HU values in different areas for screening osteoporosis were assessed.
After the cut-off values with optimal diagnostic efficiency of osteoporosis were determined, 375 patients with intertrochanteric hip fracture were divided into osteoporosis and nonosteoporosis groups. The demographic information, functional parameters, and complications of different groups were collected for clinical evaluation.
Timed Up and Go (TUG) test (15), the Functional Independence Measure (FIM) (16), 2-min walk test (2MWT) (17), and Parker–Palmer scores (18) were obtained in medical records and used to assess the physical function at the final follow-up.
Implant breakage, reduction loss, nonunion, excessive sliding, cut-out, periprosthetic fracture, infection, and loss of mobility were recorded as complications. Reduction loss was defined as a change of femoral neck-shaft angle >10°, and excessive sliding was defined as a sliding distance ≥10 mm in postoperative radiography follow-up (19).
The intraclass correlation coefficient (ICC) was used to assess the reliability of the measurement methods established in this study. The CTh and HU values were measured twice independently at 2-week intervals by an orthopedic surgeon blinded to the result of the DXA scan. Independent measurements were performed by other two orthopedic colleagues within a 2-week period. The interobserver and intraobserver correlation coefficients were then calculated.
Statistical analysis was conducted using the SPSS software (version 26.0, IBM, Armonk, NY, United States) and R package (3.6.3 version, statistical analysis and visualization). Student’s t-test was utilized to analyze the continuous data conforming to nonosteoporosis distribution, or a nonparametric rank sum test was used. Chi-square analysis or Fisher's exact test was performed for categorical variables. Pearson's correlation coefficient (r) was utilized to test the association between CTh value, HU value, and BMD. The receiver operating characteristic (ROC) curve was used to determine the diagnostic efficiency of the parameters of ROIs for osteoporosis. The cut-off values of variables were determined by calculating AUC. Then, sensitivity, specificity, positive predictive value, and negative predictive value were calculated. The level of statistical significance was defined as p < 0.05.
Fifty-six patients (40 female and 16 male) with a mean age of 82 ± 9 years were enrolled for the calculation of Pearson's correlation coefficient and the diagnostic efficiency of osteoporosis in our study. The mean BMD values of the hip and lumbar spine were 0.57 ± 0.19 and 0.82 ± 0.16 g/cm2, respectively. Other characteristics are shown in Table 1.
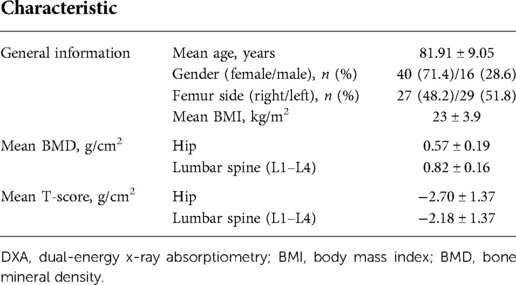
Table 1. The characteristics of the patients with a DXA at the hip and lumber spine.
There was a moderate correlation between hip BMD and the CTh value of ROI 16 (r = 0.523, p < 0.001), ROI 21 (r = 0.475, p < 0.001), ROI 23 (r = 0.501, p < 0.001), ROI 25 (r = 0.480, p < 0.001), and ROI 28 (r = 0.457, p = 0.001) (Table 2). The mean CTh value and the correlation between other CTh values and BMD are summarized in Supplementary Tables S1, 2.
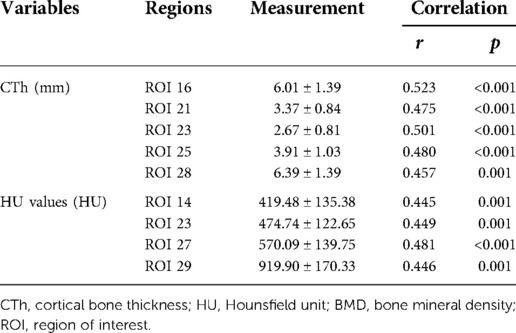
Table 2. Correlation between CTh and HU values of the proximal femur and hip BMD.
The moderate correlation was found between hip BMD and the HU values of ROI 14 (r = 0.445, p = 0.001), ROI 23 (r = 0.449, p = 0.001), ROI 27 (r = 0.481, p < 0.001), and ROI 29 (r = 0.446, p = 0.001) (Table 2). The mean HU value and the correlation between other HU values and BMD were summarized in Supplementary Tables S1, 2.
The correlations between lumber BMD, CTh, and HU values at 31 ROIs were weak, so we summarized the correlation between these parameters in 31 ROIs and lumber BMD in Supplementary Tables S1, 2.
The CTh and HU values with greater r values were used to evaluate ROC and AUC. Among them, the CTh of ROI 21 and HU of ROI 14 showed superior diagnostic accuracy for screening osteoporosis, as AUC were 0.82 (0.71– 0.93) and 0.88 (0.80– 0.97), respectively (Figure 4). The cut-off value for the CTh value of ROI 21 was 3.19 mm, with a sensitivity of 84% and a specificity of 71%. The cut-off value for the HU value of ROI 14 was 424.97 HU, with a sensitivity of 76% and a specificity of 87% (Table 3). Other CTh values of 18 ROIs and HU values of 10 ROIs were confirmed to be weaker diagnostic efficiency (displayed in Supplementary Table S3, 4).
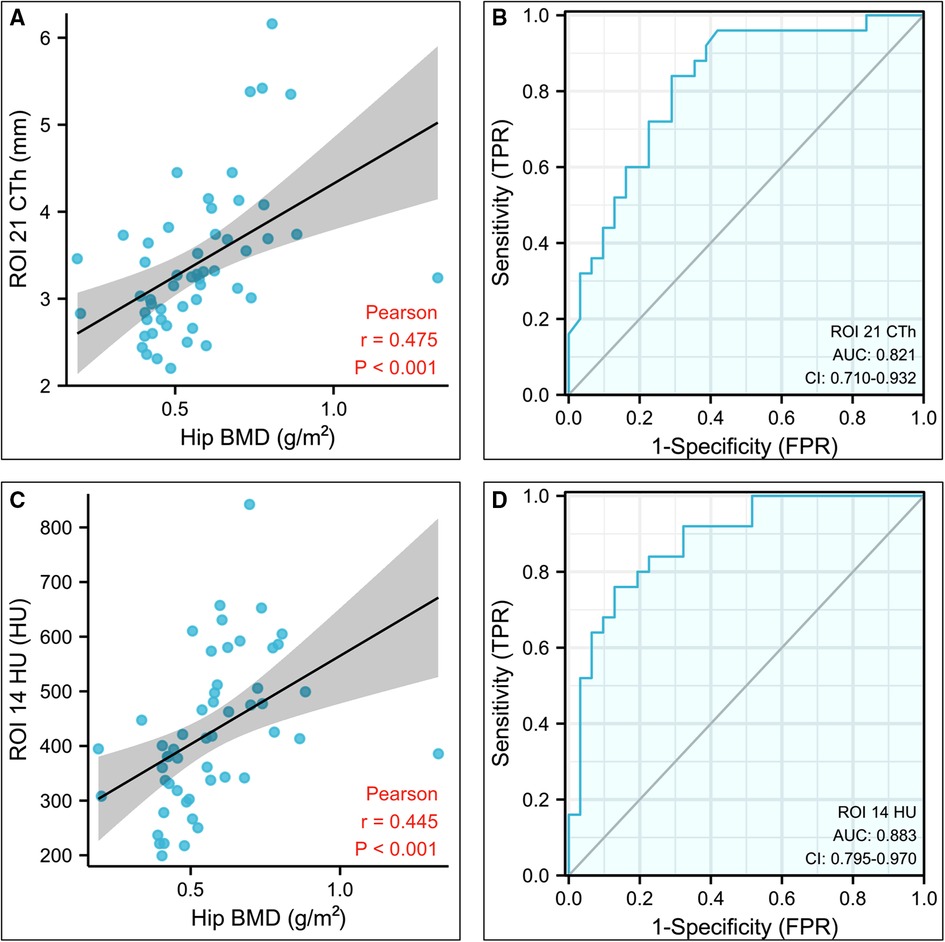
Figure 4. Statistical analysis results of the CTh value of the region of interest (ROI) 21 and HU value of the ROI 14. (A) Plot illustrating the correlation between the CTh value of ROI 21 and hip bone mineral density. (B) Diagnostic efficiency of the CTh value of ROI 21 for osteoporosis. (C) Plot illustrating the correlation between the HU value of ROI 14 and hip bone mineral density. (D) Diagnostic efficiency of the HU value of ROI 14 for osteoporosis. CTh, cortical bone thickness; HU, Hounsfield unit; ROI, region of interest.
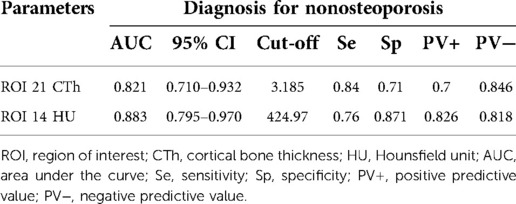
Table 3. Diagnostic efficiency of ROI 21 CTh and ROI 14 HU value for osteoporosis.
Three hundred and seventy-five patients (240 female and 135 male) with a mean age of 77.81 ± 9.44 years were included for clinical evaluation. Their demographic information is shown in Table 5. Based on the cut-off value of CTh value at ROI 21, 375 patients were divided into the osteoporosis group (n = 180) and the nonosteoporosis group (n = 195). Based on the cut-off value of 424.97 HU at ROI 14, 375 patients were divided into the osteoporosis group (n = 183) and the nonosteoporosis group (n = 192). There was a correlation between the two diagnostic methods of osteoporosis, but there was no difference between them (Table 4). The incidence of postoperative complications in the osteoporosis group was higher than that in the nonosteoporosis group divided by the CTh value at ROI 21 (p < 0.05) (Table 5). The number of patients who got FIM parameters and Parker–Palmer scores is shown in Table 6. The proportion of patients completing the TUG and 2MWT is shown in Table 7. The FIM parameters and Parker–Palmer scores of the nonosteoporosis group were higher than those of the osteoporosis group divided by the HU value of ROI 14 (p < 0.05) (Table 6).
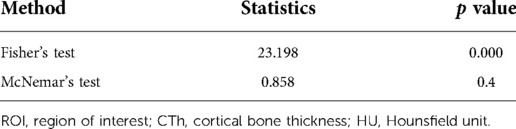
Table 4. Correlation and difference analysis of two diagnostic methods based on the cut-off values of ROI 21 CTh and ROI 14 HU value for osteoporosis.
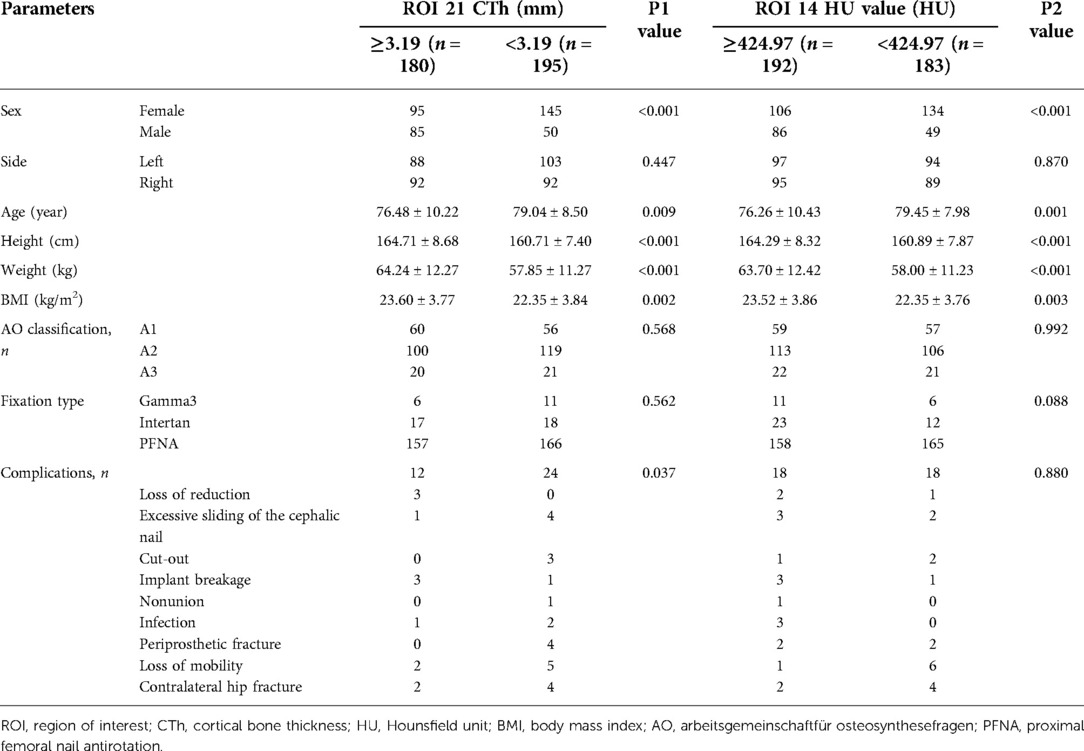
Table 5. Patient demographics and complications by the group.
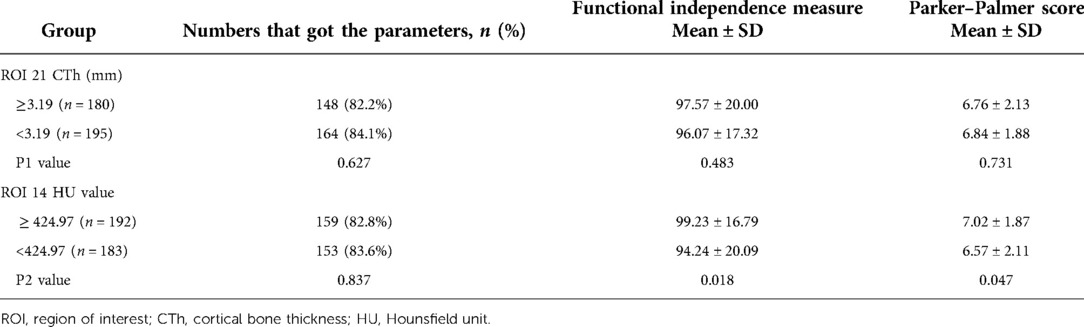
Table 6. Functional ability by the group.
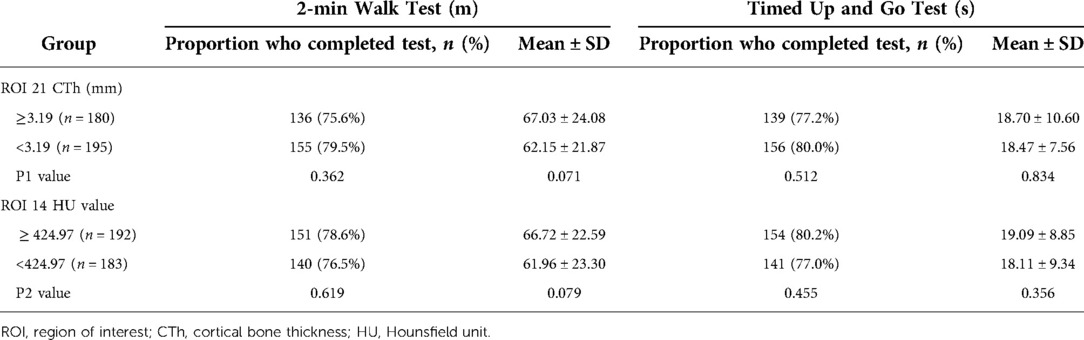
Table 7. Performance-based functional ability by the group measured using the 2-min walk test and Timed Up and Go test.
The intraclass correlation coefficient (ICC) was 0.803–0.965 for interobserver reliability and 0.814–0.970 for intraobserver reliability (Figure 5; Supplementary Figures S1–4).
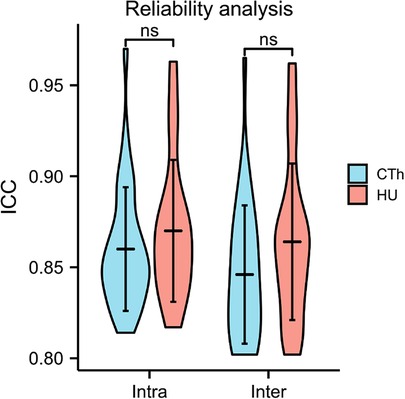
Figure 5. Rater reliability analysis.
Our research reflected that CTh and HU in the exact areas of the proximal femur could be reliable indexes for screening osteoporosis, verifying that BMD could be assessed from other image data. The above two methods had the same diagnostic rate for osteoporosis and could replace each other (Table 4). And osteoporosis and nonosteoporosis groups divided by the above cut-off values displayed distinct differences in clinical outcomes. Meanwhile, the measurement methods of CTh and HU values showed excellent interrater and intrarater reliability. Therefore, our study provided clinicians with an effective and convenient method for screening osteoporosis and predicting clinical outcomes.
In this study, we found that the CTh and HU values of the cortex in the proximal femur pronouncedly corresponded with hip BMD but were weakly associated with lumbar spine BMD. This could be explained by the fact that these anatomic parameters were extracted from the hip not the lumbar spine. Furthermore, BMD of hip DXA correlated better with these parameters in the intertrochanteric region (ROIs 13–27) than those in the femoral neck (ROIs 1–12) and shaft (ROIs 28–31) regions, suggesting that the CTh and HU values of the intertrochanteric region were more suitable for predicting bone quality. We believed that this difference mainly resulted from the intertrochanteric region, as the separation zone between the cortical and cancellous bone of the proximal femur, was more sensitive to deterioration of bone quality. In addition, Tang et al. (11, 20–22) proposed the “triangular stability theory” of the proximal femur and pointed out that the proximal femur was stabilized by a structural mechanical model formed by the medial, lateral, and upper sides. The ROI 14 was located at the cortex of the vastus lateralis ridge, which was the junction between the lateral and upper sides. The ROI 21 was located at the anterior wall at the vertex of the lesser trochanter, which was the junction between the lateral and medial sides. Both regions could effectively predict BMD and mechanical stability and might prevent the occurrence of osteoporotic fractures and postoperative complications.
Clinically, a simple and reliable method for screening osteoporosis was vital for the early prevention of osteoporotic fracture and the optimal choice of surgical scheme. Therefore, the concept of “opportunistic osteoporosis screening” was proposed and popularized (23). Mather et al. (24), Patterson et al. (25), and Ye et al. (26) analyzed the correlation between BMD and the cortical bone thickness of proximal humerus, distal tibia, and distal radius on x-ray, respectively, and verified that the cortical bone thickness of different sites could be used to screen osteoporosis. Wagner et al. (27) and Schreiber et al. (23) measured the HU values of cancellous portions of the distal ulna and radius from wrist CT scans to glean additional information for predicting bone quality. Then, Ehresman et al. (28) utilized a novel MRI-based score, the Vertebral Bone Quality score, to predict osteoporosis and proposed this score to be a significant predictor of osteoporosis with an accuracy of 81%. Compared with the above previous studies, a strength of this study was that hip CT of femoral intertrochanteric fracture was a routine examination and accurately reflected a person's true anatomy. Another strength of this study was that these measurement parameters were all abstracted from the hip, which was the site with the most serious consequences of osteoporotic fractures, such as femoral neck and intertrochanteric fractures (29). To our knowledge, no study has conducted a correlation analysis between these parameters and BMD. Thus, our method would provide the clinician with a novel prospect to assess BMD.
Meanwhile, our study evaluated the clinical difference between osteoporosis and nonosteoporosis groups divided by the cut-off values. When the group was divided by the cut-off value of CTh in ROI 21, the osteoporotic group occupied a higher incidence of complications. Due to reduced BMD and microarchitectural deterioration, the mechanical strength of osteoporotic cancellous bone significantly decreased, resulting in that osteoporotic bone could not resist normal screw pullout strength and insertional torque (4, 30). When the normal load was applied to osteoporotic cancellous bone, the proximal femur would have the tendency of varus, and the stress between implant and bone tended to be concentrated, leading to a higher incidence of complications (30). Previous studies also confirmed that patients with osteoporotic fractures occupied a higher rate of complications (31). However, there was no statistical difference in the incidence of complications between different groups divided by the cut-off value of HU in ROI 14 (p > 0.05), which might result from the lower sensitivity of the cut-off value of HU in ROI 14 led to more misdiagnosis of actual osteoporotic patients. Thus, the cut-off value of CTh in ROI 21 was suggested as the optimal index for predicting clinical outcomes. After the osteoporotic patients were selected, the initiation of osteoporotic treatment should be considered for preventing the happen of osteoporotic fractures (32). Also, some implants with better mechanical stability, such as medial sustain nail based on femoral proximal triangular stability theory (33), should be adopted to prevent the happening of complications.
Our study had some limitations. First, the sample size was small, but this would not likely have dramatic effects on our results since the excellent measuring reliability and significant results. Second, this study only involved the patient experiencing intertrochanteric fracture, so the result of the study might not apply to the general population. Third, only Chinese was selected in our study and the result might not be generalizable to all races. Despite these limitations, this study provided a useful method for screening for osteoporosis and provided guidance for clinical treatment.
In conclusion, the CTh of ROI 21 and HU value of ROI 14 were simple and effective screening indexes to predict BMD, which could help clinicians prevent the happen of osteoporotic fractures and postoperative complications.
The raw data supporting the conclusions of this article will be made available by the authors, without undue reservation.
The studies involving human participants were reviewed and approved by the Medical Ethics Committee of Chinese PLA General Hospital (S2020-114-04).
Conception: PT, LZ, and JL. Collection, measurement, and analysis of data: GX, DW, HZ, and CX. Preparation of the manuscript: GX, DW, and HZ. Revision for important intellectual content: GX, HL, and WZ. Supervision: PT, LZ, and JL. All authors contributed to the article and approved the submitted version.
This work was supported by the Beijing Natural Science Foundation (Grant 7222180) and the 13th Five-year Plan for Key Discipline Construction Project of PLA (A350109). We declare that no funds, grants, or other support were received during the preparation of this manuscript.
The authors thank Miss Dou Xiong for her guidance on measurement methods.
The authors declare that the research was conducted in the absence of any commercial or financial relationships that could be construed as a potential conflict of interest.
All claims expressed in this article are solely those of the authors and do not necessarily represent those of their affiliated organizations, or those of the publisher, the editors and the reviewers. Any product that may be evaluated in this article, or claim that may be made by its manufacturer, is not guaranteed or endorsed by the publisher.
The Supplementary Material for this article can be found online at: https://www.frontiersin.org/articles/10.3389/fsurg.2022.1047603/full#supplementary-material.
1. Compston JE, McClung MR, Leslie WD. Osteoporosis. Lancet. (2019) 393:364–76. doi: 10.1016/S0140-6736(18)32112-3
2. Bliuc D, Nguyen ND, Milch VE, Nguyen TV, Eisman JA, Center JR. Mortality risk associated with low-trauma osteoporotic fracture and subsequent fracture in men and women. JAMA. (2009) 301:513–21. doi: 10.1001/jama.2009.50
3. Liu R, Chao A, Wang K, Wu J. Incidence and risk factors of medical complications and direct medical costs after osteoporotic fracture among patients in China. Arch Osteoporos. (2018) 13:12. doi: 10.1007/s11657-018-0429-5
4. von Rüden C, Augat P. Failure of fracture fixation in osteoporotic bone. Injury. (2016) 47(Suppl 2):S3–10. doi: 10.1016/S0020-1383(16)47002-6
5. Hollensteiner M, Sandriesser S, Bliven E, von Rüden C, Augat P. Biomechanics of osteoporotic fracture fixation. Curr Osteoporos Rep. (2019) 17:363–74. doi: 10.1007/s11914-019-00535-9
6. Si L, Winzenberg TM, Jiang Q, Chen M, Palmer AJ. Projection of osteoporosis-related fractures and costs in China: 2010-2050. Osteoporos Int. (2015) 26:1929–37. doi: 10.1007/s00198-015-3093-2
7. Majumdar SR. A T-2 translational research perspective on interventions to improve post-fracture osteoporosis care. Osteoporos Int. (2011) 22(Suppl 3):471–6. doi: 10.1007/s00198-011-1700-4
8. Xiongfeng T, Cheng Z, Meng H, Chi M, Deming G, Huan Q, et al. One novel phantom-less quantitative computed tomography system for auto-diagnosis of osteoporosis utilizes low-dose chest computed tomography obtained for COVID-19 screening. Front Bioeng Biotechnol. (2022) 10:856753. doi: 10.3389/fbioe.2022.856753
9. Rajapakse CS, Farid AR, Kargilis DC, Jones BC, Lee JS, Johncola AJ, et al. MRI-based assessment of proximal femur strength compared to mechanical testing. Bone. (2020) 133:115227. doi: 10.1016/j.bone.2020.115227
10. Baumgärtner R, Heeren N, Quast D, Babst R, Brunner A. Is the cortical thickness index a valid parameter to assess bone mineral density in geriatric patients with hip fractures. Arch Orthop Trauma Surg. (2015) 135:805–10. doi: 10.1007/s00402-015-2202-1
11. Xu G, Li J, Xu C, Xiong D, Li H, Wang D, et al. Triangular mechanical structure of the proximal femur. Orthop Surg. (2022) 14:3047–60. doi: 10.1111/os.13498
12. Sparks CA, Decker SJ, Ford JM. Three-dimensional morphological analysis of sex, age, and symmetry of proximal femurs from computed tomography: application to total hip arthroplasty. Clin Anat. (2020) 33:731–8. doi: 10.1002/ca.23496
13. Zhang RY, Su XY, Zhao JX, Li JT, Zhang LC, Tang PF. Three-dimensional morphological analysis of the femoral neck torsion angle-an anatomical study. J Orthop Surg Res. (2020) 15:192. doi: 10.1186/s13018-020-01712-8
14. Zhang Q, Liu H, Chen W, Li X, Song Z, Pan J, et al. Radiologic measurement of lesser trochanter and its clinical significance in Chinese. Skeletal Radiol. (2009) 38:1175–81. doi: 10.1007/s00256-009-0662-5
15. Morris S, Morris ME, Iansek R. Reliability of measurements obtained with the timed “up & go” test in people with Parkinson disease. Phys Ther. (2001) 81:810–8. doi: 10.1093/ptj/81.2.810
16. Granger CV. The emerging science of functional assessment: our tool for outcomes analysis. Arch Phys Med Rehabil. (1998) 79:235–40. doi: 10.1016/s0003-9993(98)90000-4
17. Butland RJ, Pang J, Gross ER, Woodcock AA, Geddes DM. Two-, six-, and 12-minute walking tests in respiratory disease. Br Med J (Clin Res Ed). (1982) 284:1607–8. doi: 10.1136/bmj.284.6329.1607
18. Parker MJ, Palmer CR. A new mobility score for predicting mortality after hip fracture. J Bone Joint Surg Br. (1993) 75:797–8. doi: 10.1302/0301-620X.75B5.8376443
19. Li J, Tang S, Zhang H, Li Z, Deng W, Zhao C, et al. Clustering of morphological fracture lines for identifying intertrochanteric fracture classification with Hausdorff distance-based K-means approach. Injury. (2019) 50:939–49. doi: 10.1016/j.injury.2019.03.032
20. Chen H, Li J, Chang Z, Liang X, Tang P. Treatment of femoral neck nonunion with a new fixation construct through the Watson-Jones approach. J Orthop Translat. (2019) 19:126–32. doi: 10.1016/j.jot.2019.04.004
21. Li J, Yin P, Zhang L, Chen H, Tang P. Medial anatomical buttress plate in treating displaced femoral neck fracture a finite element analysis. Injury. (2019) 50:1895–900. doi: 10.1016/j.injury.2019.08.024
22. Li J, Zhang L, Zhang H, Yin P, Lei M, Wang G, et al. Effect of reduction quality on postoperative outcomes in 31-A2 intertrochanteric fractures following intramedullary fixation: a retrospective study based on computerised tomography findings. Int Orthop. (2019) 43:1951–9. doi: 10.1007/s00264-018-4098-1
23. Schreiber JJ, Gausden EB, Anderson PA, Carlson MG, Weiland AJ. Opportunistic osteoporosis screening—gleaning additional information from diagnostic wrist CT scans. J Bone Joint Surg Am. (2015) 97:1095–100. doi: 10.2106/JBJS.N.01230
24. Mather J, MacDermid JC, Faber KJ, Athwal GS. Proximal humerus cortical bone thickness correlates with bone mineral density and can clinically rule out osteoporosis. J Shoulder Elbow Surg. (2013) 22:732–8. doi: 10.1016/j.jse.2012.08.018
25. Patterson J, Rungprai C, Den Hartog T, Gao Y, Amendola A, Phisitkul P, et al. Cortical bone thickness of the distal part of the tibia predicts bone mineral density. J Bone Joint Surg Am. (2016) 98:751–60. doi: 10.2106/JBJS.15.00795
26. Ye C, Guo Y, Zheng Y, Wu Z, Chen K, Zhang X, et al. Distal radial cortical bone thickness correlates with bone mineral density and can predict osteoporosis: a cohort study. Injury. (2020) 51:2617–21. doi: 10.1016/j.injury.2020.08.018
27. Wagner SC, Dworak TC, Grimm PD, Balazs GC, Tintle SM. Measurement of distal ulnar Hounsfield units accurately predicts bone mineral density of the forearm. J Bone Joint Surg Am. (2017) 99:e38. doi: 10.2106/JBJS.15.01244
28. Ehresman J, Pennington Z, Schilling A, Lubelski D, Ahmed AK, Cottrill E, et al. Novel MRI-based score for assessment of bone density in operative spine patients. Spine J. (2020) 20:556–62. doi: 10.1016/j.spinee.2019.10.018
29. Nieves JW, Bilezikian JP, Lane JM, Einhorn TA, Wang Y, Steinbuch M, et al. Fragility fractures of the hip and femur: incidence and patient characteristics. Osteoporos Int. (2010) 21:399–408. doi: 10.1007/s00198-009-0962-6
30. Nazarian A, Muller J, Zurakowski D, Müller R, Snyder BD. Densitometric, morphometric and mechanical distributions in the human proximal femur. J Biomech. (2007) 40:2573–9. doi: 10.1016/j.jbiomech.2006.11.022
31. Adler RA. Update on osteoporosis in men. Best Pract Res Clin Endocrinol Metab. (2018) 32:759–72. doi: 10.1016/j.beem.2018.05.007
32. Cosman F, de Beur SJ, LeBoff MS, Lewiecki EM, Tanner B, Randall S, et al. Clinician's guide to prevention and treatment of osteoporosis. Osteoporos Int. (2014) 25:2359–81. doi: 10.1007/s00198-014-2794-2
Keywords: osteoporosis, bone mineral density, proximal femur, cortical bone thickness, Hounsfield unit
Citation: Xu G, Wang D, Zhang H, Xu C, Li H, Zhang W, Li J, Zhang L and Tang P (2023) Prediction of osteoporosis from proximal femoral cortical bone thickness and Hounsfield unit value with clinical significance. Front. Surg. 9:1047603. doi: 10.3389/fsurg.2022.1047603
Received: 18 September 2022; Accepted: 7 November 2022;
Published: 6 January 2023.
Edited by:
Yan Yu, Tongji University School of Medicine, ChinaReviewed by:
Yuhui Chen, Southern Medical University, China© 2023 Xu, Wang, Zhang, Xu, Li, Zhang, Li, Zhang and Tang. This is an open-access article distributed under the terms of the Creative Commons Attribution License (CC BY). The use, distribution or reproduction in other forums is permitted, provided the original author(s) and the copyright owner(s) are credited and that the original publication in this journal is cited, in accordance with accepted academic practice. No use, distribution or reproduction is permitted which does not comply with these terms.
*Correspondence: Peifu Tang cGZ0YW5nMzAxQDE2My5jb20= Licheng Zhang emhhbmdsaWNoZW5nQDMwMWhvc3BpdGFsLmNvbS5jbg== Jiantao Li bGlqaWFudGFvNjE4QDE2My5jb20=
†These authors have contributed equally to this work
Specialty Section: This article was submitted to Orthopedic Surgery, a section of the journal Frontiers in Surgery
Disclaimer: All claims expressed in this article are solely those of the authors and do not necessarily represent those of their affiliated organizations, or those of the publisher, the editors and the reviewers. Any product that may be evaluated in this article or claim that may be made by its manufacturer is not guaranteed or endorsed by the publisher.
Research integrity at Frontiers
Learn more about the work of our research integrity team to safeguard the quality of each article we publish.